Nutritional Assessment
Dietary Practices of Selected Cultural Groups
Purposes and Components of Nutritional Assessment

http://evolve.elsevier.com/Jarvis/
Structure and Function
Defining Nutritional Status
Nutritional status refers to the degree of balance between nutrient intake and nutrient requirements. This balance is affected by many factors, including physiologic, psychosocial, developmental, cultural, and economic.
Optimal nutritional status is achieved when sufficient nutrients are consumed to support day-to-day body needs and any increased metabolic demands due to growth, pregnancy, or illness. Persons having optimal nutritional status are more active, have fewer physical illnesses, and live longer than persons who are malnourished.
Undernutrition occurs when nutritional reserves are depleted and/or when nutrient intake is inadequate to meet day-to-day needs or added metabolic demands. Vulnerable groups—infants, children, pregnant women, recent immigrants, persons with low incomes, hospitalized people, and aging adults—are at risk for impaired growth and development, lowered resistance to infection and disease, delayed wound healing, longer hospital stays, and higher health care costs.
Overnutrition is caused by the consumption of nutrients—especially calories, sodium, and fat—in excess of body needs. A major nutritional problem today, overnutrition can lead to obesity and is a risk factor for heart disease, type 2 diabetes, hypertension, stroke, gallbladder disease, sleep apnea, certain cancers, and osteoarthritis.24
An estimated 17% of children and adolescents (ages 2 to 19 years) are overweight, and 66% of adults in the United States are either overweight or obese.7,27 For children, overweight is a body mass index (BMI) equal to or greater than the 95th percentile based on age- and gender-specific BMI charts. For adults, overweight is a BMI of 25 or greater and obesity is a BMI of 30 or greater.7 Although obesity rates in both children and adults seem to be leveling off after several years of increases, these data are alarming. Being overweight during childhood and adolescence is associated with increased risk for becoming overweight during adulthood.24
 Developmental Competence
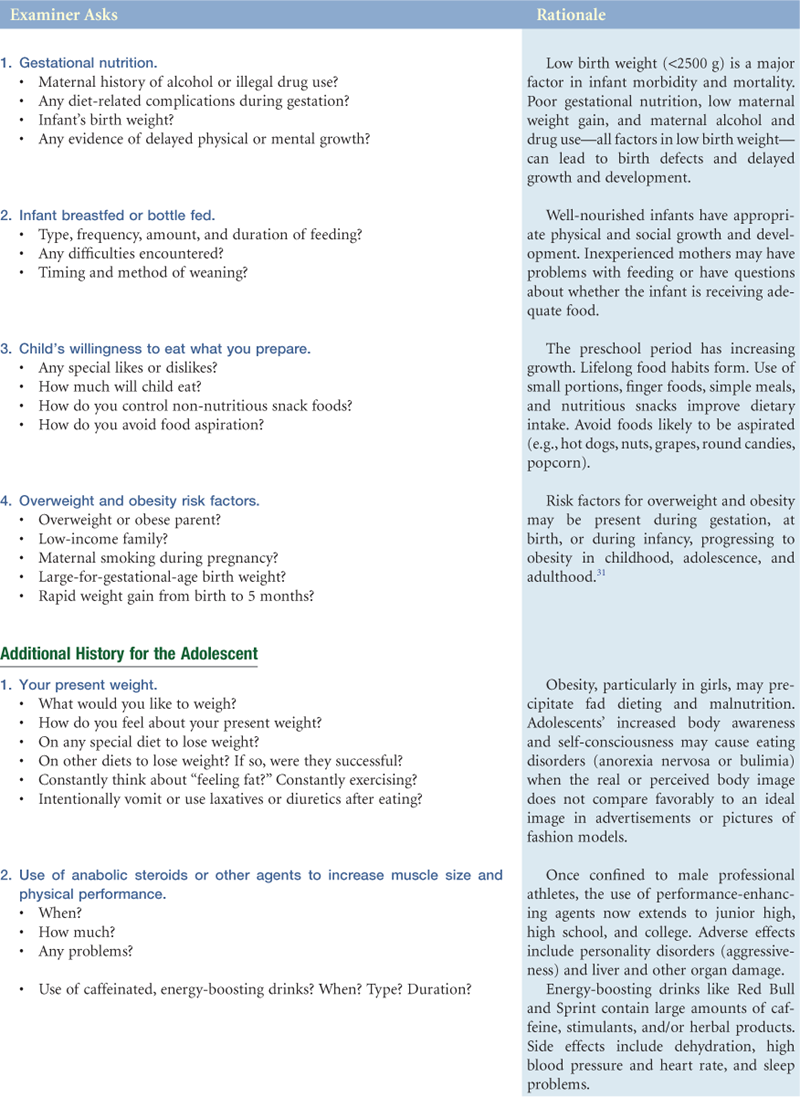
Infants and Children
The time from birth to 4 months of age is the most rapid period of growth in the life cycle. Although infants lose weight during the first few days of life, they usually regain birth weight by the 7th to 10th day after birth. Thereafter, infants double their birth weight by 4 months and triple it by 1 year of age. The number of pounds gained during the second year approximates the birth weight.
Breastfeeding is recommended for full-term infants for the 1st year of life because breast milk is ideally formulated to promote normal infant growth and development and natural immunity. Other advantages of breastfeeding are (1) fewer food allergies and intolerances, (2) reduced likelihood of overfeeding, (3) less cost than commercial infant formulas, and (4) increased mother-infant interaction time. Because cow’s milk may cause gastrointestinal and kidney problems and is a poor source of iron and vitamins C and E, it is not recommended for infants until 1 year of age. Although relatively few contraindications to breastfeeding exist, women who are human immunodeficiency virus (HIV) positive should not breastfeed because HIV can be transmitted through breast milk.
Infants increase their length by 50% during the first year of life and double it by 4 years of age. Brain size also increases very rapidly during infancy and childhood. By age 2 years, the brain has reached 50% of its adult size; by age 4, 75%; and by age 8, 100%. For this reason, infants and children younger than 2 years should not drink skim or low-fat milk or be placed on low-fat diets—fat (calories and essential fatty acids) is required for proper growth and central nervous system development.
Adolescence
After a period of slow growth in late childhood, adolescence is characterized by a rapid physical growth and endocrine and hormonal changes. Caloric and protein requirements increase to meet this demand, and because of bone growth and increasing muscle mass (and, in girls, the onset of menarche), calcium and iron requirements also increase. Typically, these increased requirements cannot be met by three meals per day; therefore nutritious snacks play an important role in achieving adequate nutrient intake. The following are some factors to consider when working with adolescents to select healthier food choices: skipped meals, excessive fast food and sweetened beverage consumption, limited fruit and vegetable intake, peer pressure, alternative dietary patterns, eating disorders, hectic schedules, and possible experimentation with drugs and alcohol.
In general, boys grow taller and have less body fat than girls. The percent of body fat increases in females to about 25% and decreases in males (replaced by muscle mass) to about 12%. Typically, girls double their body weight between the ages of 8 and 14 years; boys double their body weight between the ages of 10 and 17 years.
Pregnancy and Lactation
To support the synthesis of maternal and fetal tissues, sufficient calories, protein, vitamins, and minerals must be consumed. In particular, iron, folate, and zinc are essential for fetal growth, and vitamin and mineral supplements are often required. The National Academy of Sciences (NAS) recommends a weight gain of 25 to 35 lb for women of normal weight, 28 to 40 lb for underweight women, 15 to 25 lb for overweight women, and 11 to 20 lb for obese women, a new weight gain category. See Appendix F on the Evolve website for increased requirements of pregnancy and lactation. Appendix G on the Evolve website gives recommended weight gain guidelines based on body mass index and illustrates curves of desirable weight gain during pregnancy, as recommended by the Subcommittee on Nutritional Status and Weight Gain During Pregnancy.23
Adulthood
During adulthood, growth and nutrient needs stabilize. Most adults are in relatively good health. However, lifestyle factors such as cigarette smoking, stress, lack of exercise, excessive alcohol intake, and diets high in saturated fat, cholesterol, salt, and sugar and low in fiber can be factors in the development of hypertension, obesity, atherosclerosis, cancer, osteoporosis, and diabetes mellitus. The adult years, therefore, are an important time for education, to preserve health and to prevent or delay the onset of chronic disease.
The Aging Adult
Older adults have increased risk for undernutrition or overnutrition. Poor physical or mental health, social isolation, alcoholism, limited functional ability, poverty, and polypharmacy are the major risk factors for malnutrition in older adults.30
Normal physiologic changes in aging adults that directly affect nutritional status include poor dentition, decreased visual acuity, decreased saliva production, slowed gastrointestinal motility, decreased gastrointestinal absorption, and diminished olfactory and taste sensitivity. Important nutritional features of the older years are a decrease in energy requirements due to loss of lean body mass (the most metabolically active tissue) and an increase in fat mass. Because protein and vitamin and mineral needs remain the same or increase (e.g., vitamin D and calcium), nutrient-dense food choices (e.g., milk, eggs, cheese, and peanut butter) are important to offset lower energy/calorie needs.
Socioeconomic conditions frequently affect the nutritional status of the aging adult. The decline of extended families and increased mobility of families reduce available support systems. Facilities for meal preparation and eating, transportation to grocery stores, physical limitations, income, and social isolation are frequent problems that interfere with acquiring a balanced diet. Medications must also be considered, because aging adults frequently take multiple medications that have a potential for interaction with nutrients and with one another.
 Culture and genetics
Because foods and eating customs are culturally distinct, each person has a unique cultural heritage that may affect nutritional status. Immigrants commonly maintain traditional eating customs long after the language and manner of dress of an adopted country become routine (especially for holidays and observance of religious customs). Occupation, class, religion, gender, and health awareness also have a great bearing on eating customs. Within the past decade, hundreds of thousands of individuals from Mexico, the Caribbean, Central and South America, Asia, Africa, and the Middle East have immigrated to the United States. Their food habits not only change to accommodate their new cultures but also influence their adoptive country. The popularity of tortillas, salsa, plantains, tofu, pita bread, hummus, and curry is just one example of these influences on American eating habits (Fig. 11-1).

11-1
Newly arriving immigrants may be at nutritional risk for a variety of reasons. They frequently come from countries with limited food supplies caused by poverty, poor sanitation, war, or political strife. General undernutrition, hypertension, diarrhea, lactose intolerance, osteomalacia (soft bones), scurvy, and dental caries are among the more common nutrition-related problems of new immigrants from developing countries.
When immigrants arrive in the United States, other factors contribute to their nutritional problems:
• They are in a new country with a completely new language, culture, and society.
• They are faced with unfamiliar foods, food storage, food preparation, and food-buying habits.
• Many familiar foods are difficult or impossible to obtain.
When traditional food habits are disrupted by a new culture, borderline deficiencies or adverse nutritional consequences may result. As an example, Hispanic immigrants to the United States have increased risk of becoming overweight and obese as they adapt to a diet in the United States that is higher in saturated fats and calories.2
Cultural heritage also plays a role in nutrient needs. For example, studies have shown that Black women have lower hemoglobin levels than white women independent of iron intake and that their risk for osteoporosis is significantly less despite lower overall calcium intake. Or, cultural values may conflict with optimum nutrition (e.g., many cultures worldwide consider obesity an indication of beauty, affluence, and well-being).
Because eating patterns and customs are changing rapidly in all countries, what are considered customs today may not be considered traditional in a few years. The best way to learn about the eating patterns of a people is to talk with them, eat with them, and ask about their dietary customs. It is important to keep in mind that recent immigrant groups, such as Southeast Asians, are often shorter and weigh less than their Western counterparts, so American standard tables of weight for age, height for age, and weight for height may not work to evaluate growth and development of immigrant children. At present, no reliable standards to evaluate every immigrant group exist.
The cultural factors to consider are the cultural definition of food, frequency and number of meals eaten away from home, form and content of ceremonial meals, amount and types of foods eaten, and regularity of food consumption. The 24-hour dietary recalls or 3-day food records used traditionally for assessment may be inadequate when dealing with people from culturally diverse backgrounds. Standard dietary handbooks may not provide culture-specific diet information because nutritional content and exchange tables are generally based on Western diets. Another source of error may be cultural patterns of eating. For example, many low-income ethnic groups eat sparingly or moderately during the week (i.e., simple rice or bean dishes), whereas weekend meals are markedly more elaborate (i.e., meats, fruits, vegetables, and sweets are added).
Although you may assume that the term “food” is a universal concept, you should have the person clarify what is meant by the term. For example, Latino groups do not consider chili peppers—an important source of vitamins A and C—to be food and thus fail to list them as vegetables on daily food records. Among Vietnamese refugees, the dietary intake of calcium may appear inadequate, particularly with the low consumption of dairy products. But daily soups prepared by soaking bones in acidified broth or pickled or sweet-and-sour meats such as pork ribs (vinegar leaches calcium from the bones and makes it available to the body) are commonly consumed, thus providing adequate quantities of calcium to meet daily requirements. Tofu is also a good source of calcium if calcium salts are used to precipitate the curd. For Mexican Americans, tortillas prepared from corn treated with lime water significantly increase dietary calcium. In Middle Eastern countries, yogurt and feta cheese are the major dietary sources of calcium since milk is not commonly consumed by adults. The reason for this is lactose intolerance, a condition found in many African Americans, American Indians, and Asian Americans.
Food itself is only one part of eating. In some cultures, social contacts during meals are restricted to members of the immediate or extended family. For example, in some Middle Eastern cultures, men and women eat meals separately or women may be permitted to eat with their husbands but not with other males. Among some Hispanic groups, the male breadwinner is served first, then women and children. Etiquette during meals, the use of hands, type of eating utensils (e.g., chopsticks, special flatware), and protocols governing the order in which foods are consumed during a meal all vary cross-culturally.
Dietary Practices of Selected Cultural Groups
It is necessary to avoid cultural stereotyping, the tendency to view individuals of common cultural backgrounds similarly and according to a preconceived notion of how they “ought” to behave. For example, despite widely held stereotypes, we know that some Chinese do not like rice, some Italians dislike spaghetti, some Irish dislike corned beef and cabbage, and so forth. Aggregate dietary preferences among people from certain cultural groups, however, can be described (e.g., characteristic ethnic dishes, methods of food preparation). Refer to nutrition texts on the topic for detailed information about culture-specific diets and the nutritional value of ethnic foods.
Cultural food preferences are often interrelated with religious dietary beliefs and practices. Many religions use foods as symbols in celebrations and rituals. Knowing the person’s religious practices related to food enables you to suggest improvements or modifications that do not conflict with dietary laws. Table 11-1 summarizes dietary practices for selected religious groups.
TABLE 11-1
| Religious Group | Food Restrictions |
| Buddhism | All meat |
| Catholicism | Meat by some denominations on Ash Wednesday, Good Friday, and other holy days Alcoholic beverages by some denominations |
| Hinduism | Beef, pork, and some fowl Alcohol Garlic and onions by some Red-colored foods (e.g., tomatoes) by some |
| Islam | All pork and pork products Meat not slaughtered according to ritual Alcoholic beverages and alcohol products (e.g., vanilla extract), coffee, and tea Food and beverages before sunset during Ramadan |
| Mormon | Alcoholic beverages Caffeinated beverages (e.g., coffee, tea, sodas) and medicines containing caffeine, stimulants, or alcohol (e.g., Anacin, NoDoz, Nyquil) Food and beverages on first Sunday of each month |
| Orthodox Judaism | All pork and pork products Meat not slaughtered according to ritual All shellfish (e.g., crab, lobster, shrimp, oysters) Dairy products and meat at the same meal Leavened bread and cake during Passover Food and beverages on Yom Kippur |
| Seventh-Day Adventist | All pork and pork products Shellfish Meat, dairy products, and eggs by some Alcoholic beverages, coffee, and tea Highly seasoned foods |
Other issues are fasting and other religious observations that may limit a person’s food or liquid intake during specified times (e.g., many Catholics fast and abstain from meat on Ash Wednesday and the Fridays of Lent; Muslims fast from dawn to sunset during the month of Ramadan in the Islamic calendar and eat only twice a day—before dawn and after sunset; Jews observe a 24-hour fast on Yom Kippur).
Kosher is the term that refers to the dietary laws of observant Jews; not mixing milk and meat products at the same meal and not eating pork and pork products are examples of the many practices within the system. Halal is the term that refers to the Islamic dietary laws (here, too, the prohibition of pork is one of many dietary practices).
Purposes and Components of Nutritional Assessment
Nutritional assessment techniques are noninvasive, inexpensive, and easy to perform. The purposes of nutritional assessment are to (1) identify individuals who are malnourished or are at risk for developing malnutrition, (2) provide data for designing a nutrition plan of care that will prevent or minimize the development of malnutrition, and (3) establish baseline data for evaluating the efficacy of nutritional care.
Nutrition screening, the first step in assessing nutritional status, is required for all patients in all health care settings within 24 hours of admission.21 Based on easily obtained data, nutrition screening is a quick and easy way to identify individuals at nutrition risk, such as those with weight loss, inadequate food intake, or recent illness. Parameters used for nutrition screening typically include weight and weight history, conditions associated with increased nutritional risk, diet information, and routine laboratory data. A variety of valid tools are available for screening different populations. For example, the Malnutrition Screening Tool12 (Table 11-2) was validated for use in adult acute care patients and the Mini Nutritional Assessment (MNA®) (Fig. 11-2) was designed and validated for use in older adults in long-term care and community settings.36
TABLE 11-2
Malnutrition Screening Tool (MST)
| Have you lost weight recently without trying? | |
| No | 0 |
| Unsure | 2 |
| If yes, how much weight (in kilograms) have you lost? | |
| 1-5 | 1 |
| 6-10 | 2 |
| 11-15 | 3 |
| >15 | 4 |
| Unsure | 2 |
| Have you been eating poorly because of a decreased appetite? | |
| No | 0 |
| Yes | 1 |
| Total | |
| Score of 2 or more = patient at risk for malnutrition. |
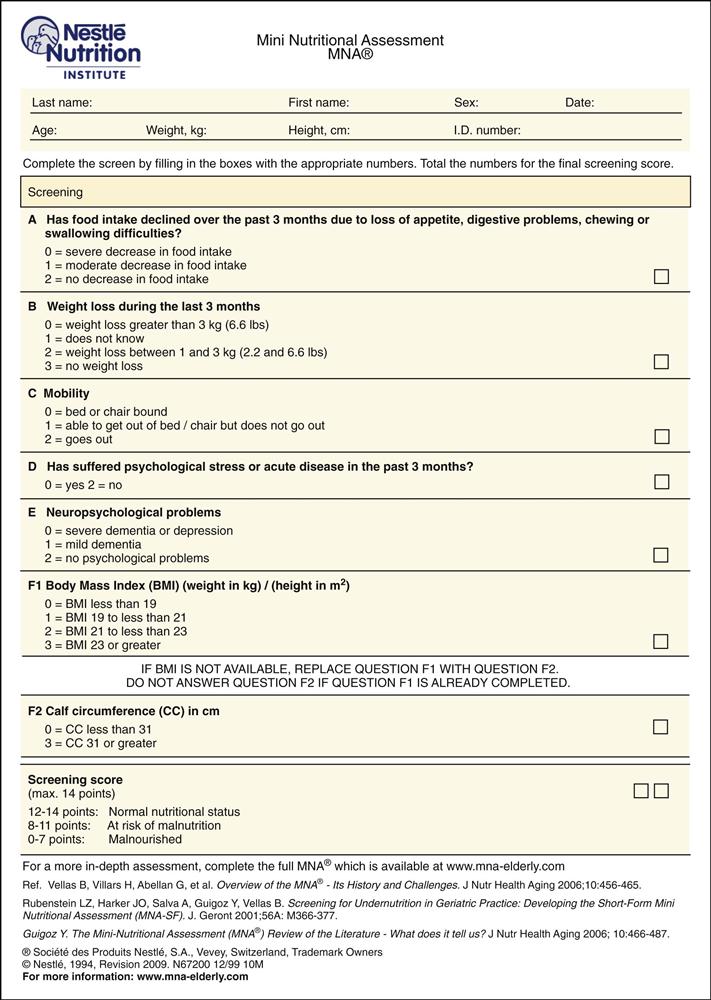
11-2
Individuals identified at nutritional risk during screening should undergo a comprehensive nutritional assessment, which includes dietary history and clinical information, physical examination for clinical signs, anthropometric measures, and laboratory tests. The skills needed to collect the clinical and dietary history and to perform the physical examination are described in the Subjective Data and Objective Data sections that follow. Table 11-3 is an example of a Subjective Global Assessment form for compiling comprehensive nutritional assessment data.
TABLE 11-3
Features of Subjective Global Assessment (SGA)
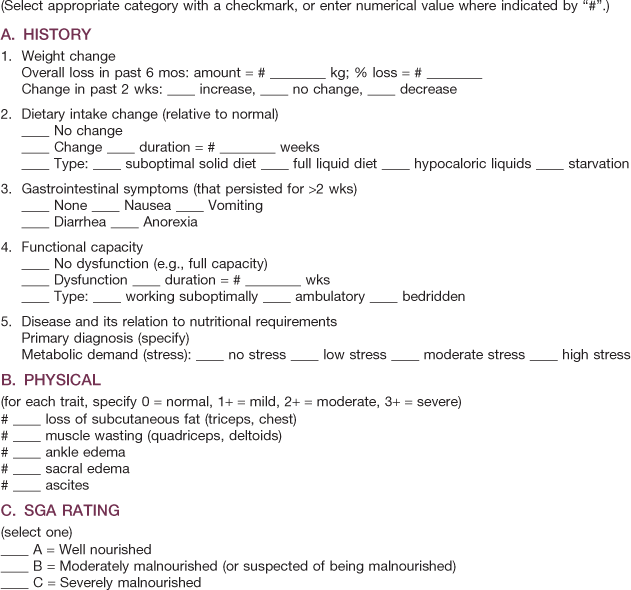
Reprinted with permission from Detsky, A. S., McLaughlin, J. R., & Baker, J. P. (1987). What is subjective global assessment of nutritional status? Journal of Parenteral Enteral Nutrition, 11(1), 8-14.
Various methods for collecting current dietary intake information are available—24-hour recall, food frequency questionnaire, and food diary. During hospitalization, documentation of nutritional intake is achieved through calorie counts of nutrients consumed and/or infused.
The easiest and most popular method for obtaining information about dietary intake is the 24-hour recall. The individual or family member completes a questionnaire or is interviewed and asked to recall everything eaten within the last 24 hours. An advantage of the 24-hour recall is that it can elicit specific information about dietary intake over a specific period of time. However, there are several significant sources of error: (1) the individual or family member may not be able to recall the type or amount of food eaten; (2) intake within the last 24 hours may be atypical of usual intake; (3) the individual or family member may alter the truth for a variety of reasons; and (4) snack items and use of gravies, sauces, and condiments may be underreported.
To counter some of the difficulties inherent in the 24-hour recall method, you can use a food frequency questionnaire. With this tool, information is collected on how many times per day, week, or month the individual eats particular foods, providing an estimate of usual intake. Drawbacks to the use of the food frequency questionnaire are (1) it does not always quantify amount of intake and (2) like the 24-hour recall, it relies on the individual’s or family member’s memory for how often a food was eaten.
Food diaries or records ask the individual or family member to write down everything consumed for a certain period of time. Three days—two weekdays and one weekend day—are customarily used. A food diary is most complete and accurate if you teach the individual to record information immediately after eating. Potential problems with the food diary include (1) noncompliance, (2) inaccurate recording, (3) atypical intake on the recording days, and (4) conscious alteration of diet during the recording period.
Direct observation of the feeding and eating process can detect problems not readily identified through standard nutrition interviews. For example, observing the typical feeding techniques used by a parent or caregiver and the interaction between the individual and caregiver can help when assessing failure to thrive in children or unintentional weight loss in older adults.
MyPyramid has been replaced by MyPlate (www.choosemyplate.gov).
MyPyramid, Dietary Guidelines, and the Daily Reference Intakes (DRIs) are three guides commonly used to determine an adequate diet. MyPyramid and Dietary Guidelines were released in 2005 (Fig. 11-3 and Table 11-4). Please access the website at www.mypyramid.gov for additional information plus interactive features that allow you and your patients to create individualized nutrition and health plans. It can be easily adapted to people with various cultural backgrounds, lifestyles, and health problems. For example, the recommended calorie intake for an active 2-year-old is 1400 kcal/day versus 1000 kcal/day for a sedentary 2-year-old. A more detailed report of the 2005 Dietary Guidelines can be accessed at www.health.gov/dietaryguidelines. The DRIs are recommended amounts of nutrients to prevent deficiencies and reduce the risk for chronic diseases. In addition to recommending adequate intakes, they also specify upper limits of nutrients to avoid toxicity. With increased use of dietary supplements, the risk for nutrient toxicities is on the rise. Examples of specific DRIs can be found at http://fnic.nal.usda.gov/nal_display/index.php?info_center=4&tax_level=1&tax_subject= 256.
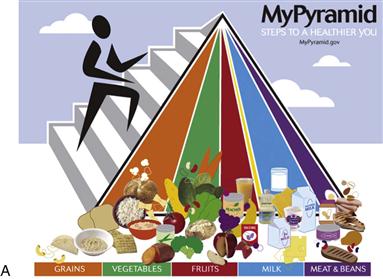
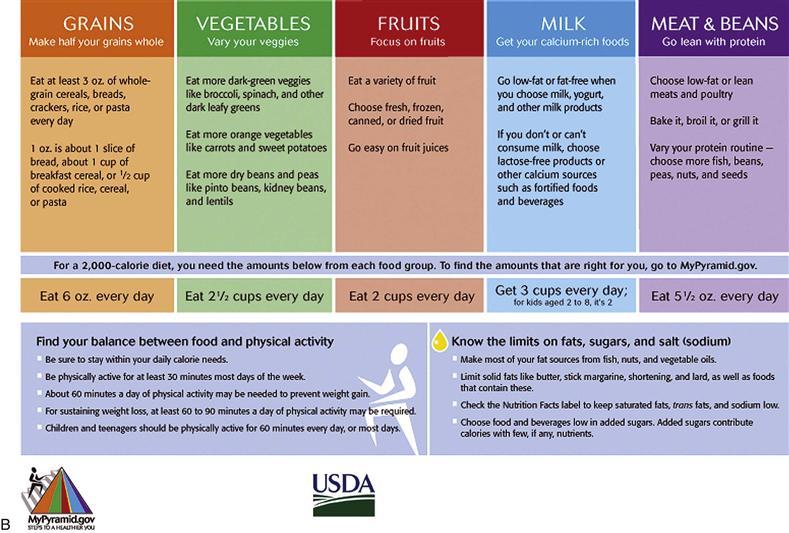
11-3, A & B
TABLE 11-4
Summary of 2010 Dietary Guidelines
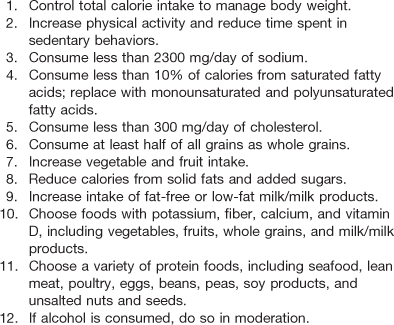
From U.S. Department of Agriculture and U.S. Department of Health and Human Services. (2011). Dietary guidelines for Americans, 2010. Washington, DC: USDA and USDHHS. www.dietaryguidelines.gov.
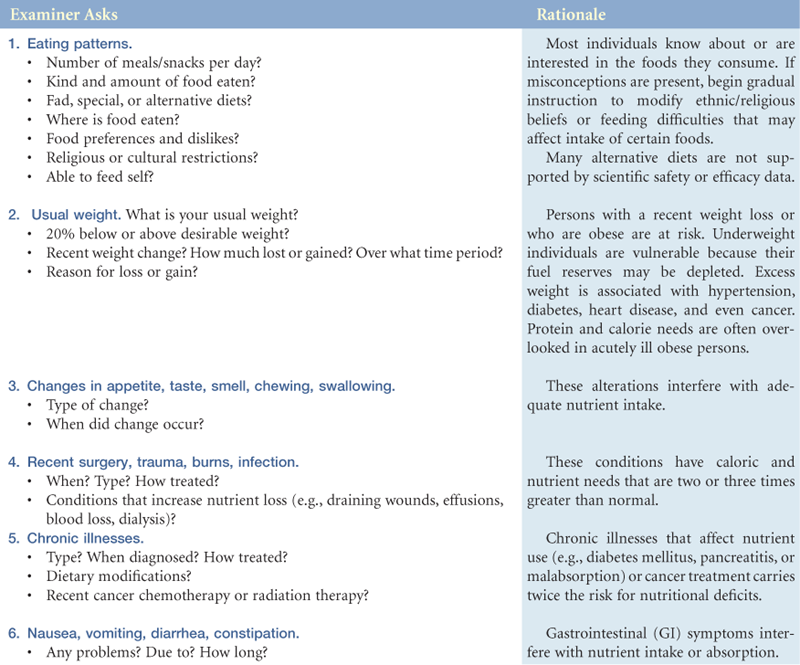
Subjective Data
3. Changes in appetite, taste, smell, chewing, swallowing
4. Recent surgery, trauma, burns, infection
6. Vomiting, diarrhea, constipation
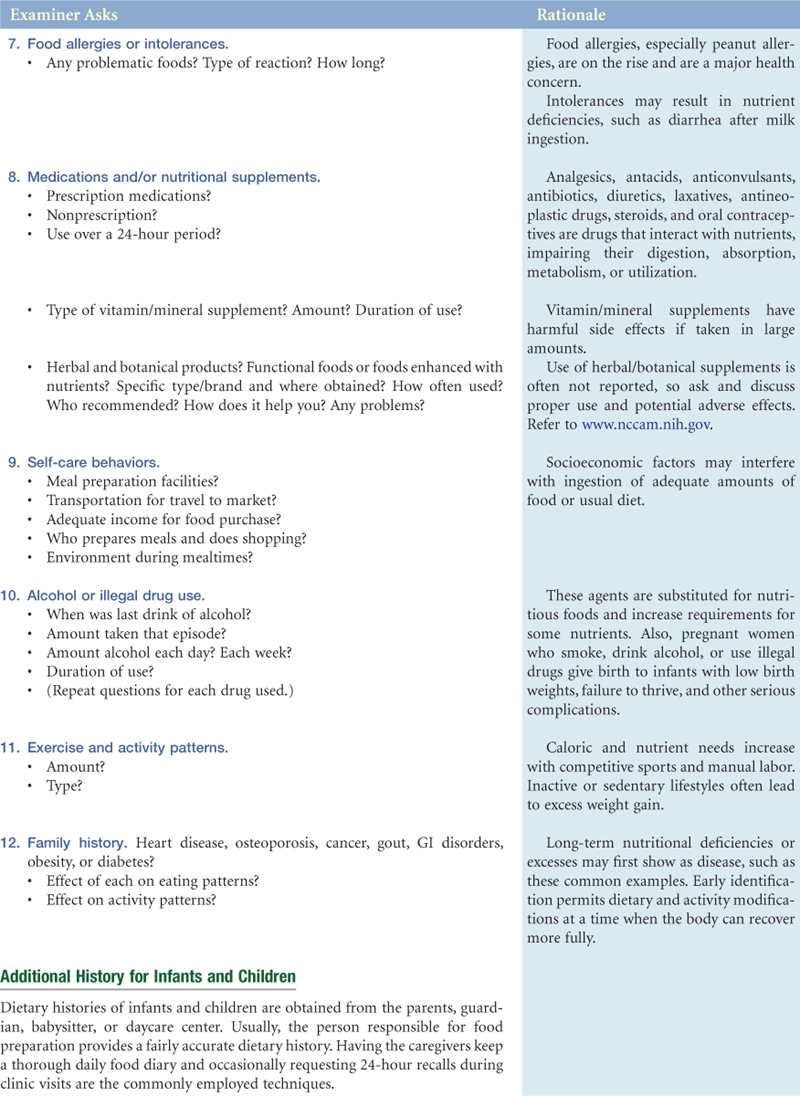
7. Food allergies or intolerances
8. Medications and/or nutritional supplements
10. Alcohol or illegal drug use
Objective Data
| CLINICAL SIGNS | EQUIPMENT NEEDED |
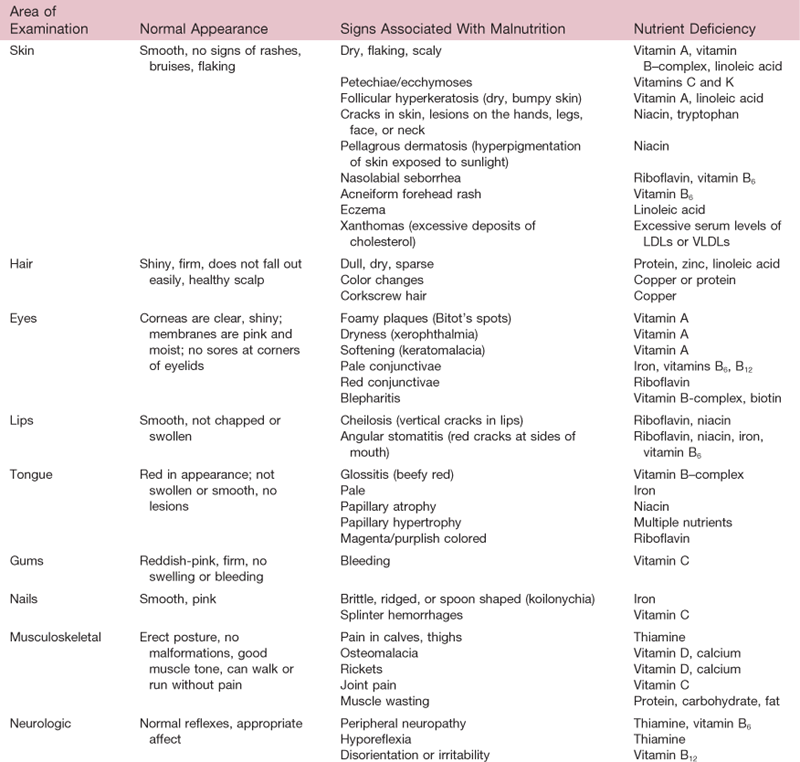
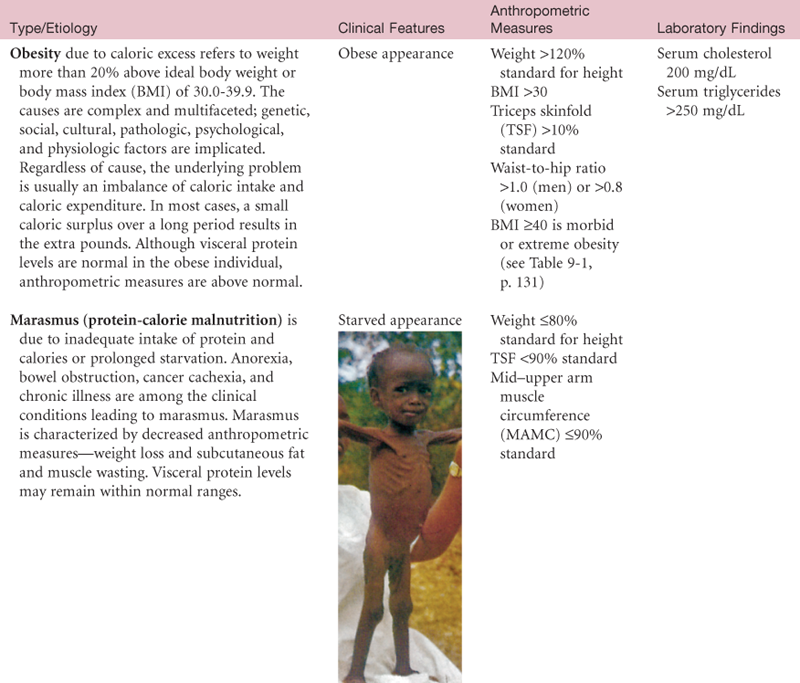
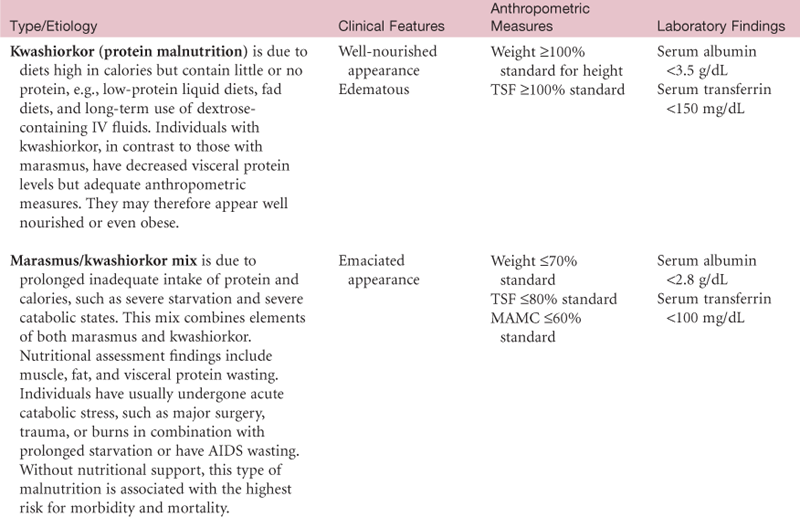
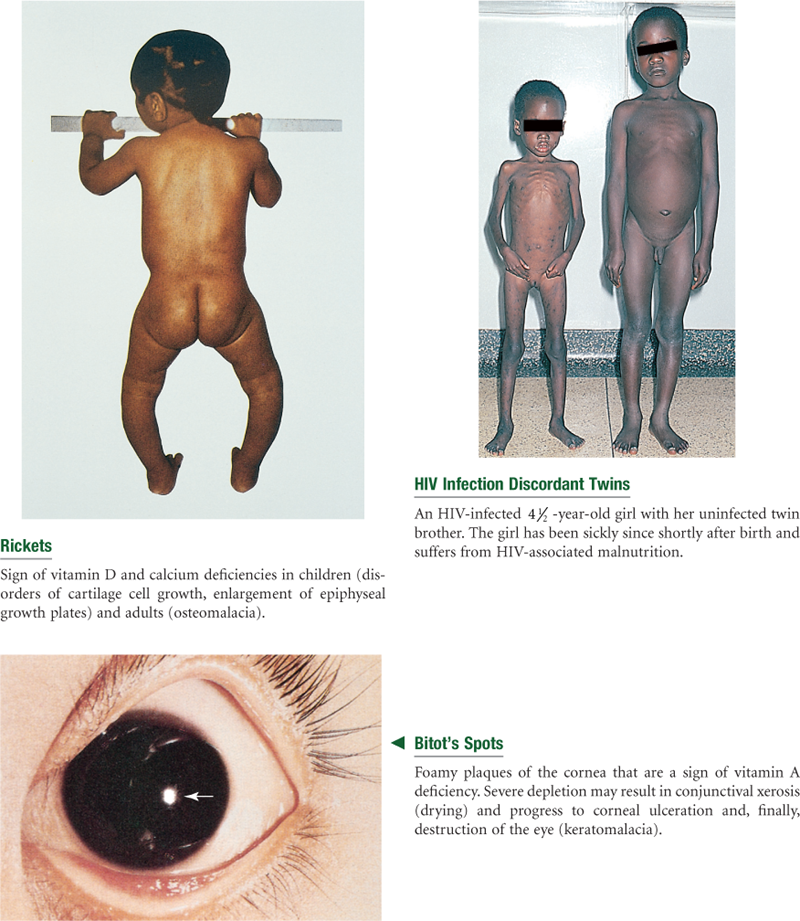
| The general appearance—obese, cachectic (fat and muscle wasting), or edematous—can provide clues to overall nutritional status. More specific clinical signs of nutritional deficiencies can be detected through a physical examination. Because clinical signs are late manifestations of malnutrition, only in areas of rapid turnover of epithelial tissue—skin, hair, mouth, lips, and eyes—are the deficiencies readily detectable. These signs may also be non-nutritional in origin. Therefore laboratory testing is required to make an accurate diagnosis, reviewed later in this chapter. Clinical signs of various nutritional deficiencies are summarized in Table 11-5 and are depicted in the section on abnormalities at the end of this chapter (see Tables 11-6 to 11-8). | Lange or Harpenden skinfold calipers Ross insertion tape or other measurement tape Anthropometer Pen or pencil Nutritional assessment data form |
 Documentation and Critical Thinking
Sample Charting
Subjective
No history of diseases or surgery that would alter intake/requirements; no recent weight changes; no appetite changes. Socioeconomic history is noncontributory. Does not smoke; drink alcohol; or use illegal, prescription, or over-the-counter drugs. No food allergies. Sedentary lifestyle; plays golf once per week.
Objective
Dietary intake is adequate to meet protein and energy needs. No clinical signs of nutrient deficiencies. Height, weight, and screening laboratory tests within normal ranges.
Focused Assessment: Clinical Case Study 1
Molly is a 14-year-old high school freshman who has been overweight most of her life.
Subjective
Molly presents to the school clinic with a weight gain of 10 pounds since starting high school 6 months ago. Daily calorie intake averages 2500 to 3000 calories/day. Skips breakfast and eats lunch at a fast food restaurant across the street from the high school—usually a cheeseburger, fries, and soft drink. Lives in a low-income neighborhood where the nearest grocery store with fresh fruits and vegetables is a bus ride away, and there are few safe places to exercise.
Objective
Inspection: General appearance is overweight for age and height.
Anthropometric: Height is 157.4 cm (62 in). Current weight is 63.6 kg (140 lb); BMI is 25.6 (91st percentile—at risk for overweight).
Laboratory: Not available, but fasting plasma glucose should be checked for prediabetes.
Assessment
Imbalanced nutrition: more than body requirements R/T high fat and calorie intake, undesirable eating patterns, lack of exercise, environmental influences, knowledge deficit.
Overweight with high risk for becoming an obese adult and for developing obesity-related complications, such as type 2 diabetes mellitus, sleep apnea, arthritis, asthma, poor self-esteem and quality of life, and metabolic syndrome.
Focused Assessment: Clinical Case Study 2
E.F. is an 87-year-old widow who lives alone in her own home. She has enjoyed good health all of her life.
Subjective
During the past year, she has experienced declining memory and no longer cooks or drives. Relies on children to take her grocery shopping and prepare occasional meals. Income adequate. Describes her appetite as excellent. Spends her days watching television and reading. Experiences occasional constipation. Eats a well-balanced diet and enjoys high-carbohydrate foods such as cookies, candy, and doughnuts because they are easy to chew. Caloric intake is 1800 kcal/day.
Objective
Inspection: No clinical signs of nutrient deficiencies.
Anthropometric: Height is 160 cm (63 in). Current weight is 56.8 kg (125 lb); usual weight is 56.8 kg (125 lb), and ideal weight is 56.4 kg (124 lb).
Laboratory: Hemoglobin, hematocrit, and albumin values within normal limits.
Assessment
Normal nutriture
Constipation related to inactivity and diet high in refined carbohydrates

Abnormal Findings for Advanced Practice
Table 11-9
Potential Nutritional Consequences of Bariatric Surgery*† and Related Dietary Changes
| Potential Nutritional Consequences | Related Dietary Changes |
| Malabsorption of protein and calories due to decreased absorptive surface and availability of digestive enzymes | Eating small, nutrient-dense meals |
| Malabsorption of vitamins and minerals due to achlorhydria or loss of site of absorption | Taking vitamin and mineral supplements |
| Weight re-gain | Avoiding excessive intake of calorically dense liquids/foods |
| Obstruction of bypassed sections or pouch | Avoiding chunks of food that could cause blockage |
*Vertical and adjustable gastric banding, Roux-en-Y gastric bypass.
†Persons who are 100% or more above ideal body weight or have a BMI ≥40 are categorized as morbidly or extremely obese and are possible candidates for bariatric or weight-loss surgery, as are persons with BMIs ≥35 and comorbid conditions.
Summary Checklist: Nutritional Assessment
 For a PDA-downloadable version, go to http://evolve.elsevier.com/Jarvis/.
1. Obtain a health history relevant to nutritional status.
2. Elicit dietary history, if indicated.
3. Inspect skin, hair, eyes, oral cavity, nails, and musculoskeletal and neurologic systems for clinical signs and symptoms suggestive of nutritional deficiencies.
4. Measure height, weight, and other anthropometric parameters, as indicated.
Bibliography
1. Adult Treatment Panel III (ATP III). Executive summary of the third report of the National Cholesterol Education Program (NCEP) Expert Panel on Detection, Evaluation, and Treatment of High Blood Cholesterol in Adults. JAMA: The Journal of the American Medical Association. 2001;285:2486–2497.
2. Akresh IR. Overweight and obesity among foreign-born and U.S.-born Hispanics. Biodemography and Social Biology. 2008;54(2):183–199.
3. A Scientific Statement from American Heart Association Nutrition Committee of the Council of Nutrition, Physical Activity and Metabolism, Council on Cardiovascular Disease in the Young, Council on Arteriosclerosis, Thrombosis and Vascular Biology, Council on Cardiovascular Nursing, Council on Epidemiology and Prevention, and Council for High Blood Pressure Research. Implementing American Heart Association pediatric and adult nutrition guidelines. Circulation. 2009;119:1161–1175.
4. Blackburn GL, Bistrian BR, Maini BS, et al. Nutritional and metabolic assessment of the hospitalized patient. JPEN Journal of Parenteral and Enteral Nutrition. 1977;1(1):11–22.
5. Bleyer AJ, Hire D, Russell GB, et al. Ethnic variation in the correlation between random serum glucose concentration and glycated haemoglobin. Diabetic Medicine. 2009;26(2):128–133.
6. Centers for Disease Control and Prevention. Growth charts. National Center for Health Statistics in collaboration with the National Center for Chronic Disease Prevention and Health Promotion. Retrieved July 5, 2006, from www.cdc.gov/growth_charts; 2000.
7. Centers for Disease Control and Prevention. Overweight and obesity. Retrieved July 11, 2009, from www.cdc.gov/obesity/data/index.html.
8. Charney P, Malone AM. ADA pocket guide to nutrition assessment. 2nd ed. Chicago: American Dietetic Association; 2009.
8a. Chernecky CC, Berger BJ. Laboratory tests and diagnostic procedures. 5th ed. St. Louis: Saunders; 2008.
9. Deo RC, Reich D, Tandon A, et al. Genetic differences between the determinants of lipid profile phenotypes in African and European Americans: the Jackson Heart Study. PLoS Genetics. 2009;5(1):e1000342.
10. Detsky AS, McLaughlin JR, Baker JP, et al. What is subjective global assessment of nutritional status? JPEN Journal of Parenteral and Enteral Nutrition. 1987;11(1):8–14.
11. DiMaria-Ghalili RA, Amella E. Nutrition in older adults: intervention and assessment can help curb the growing threat of malnutrition. The American Journal of Nursing. 2005;105(3):40–49.
12. Ferguson M, Capra S, Bauer J, Banks M. Development of a valid and reliable malnutrition screening tool for adult acute care hospital patients. Nutrition. 1999;15:458–464.
13. Fischbach FT, Dunning MD. Manual of laboratory and diagnostic tests. 8th ed. Philadelphia: Lippincott Williams & Wilkins; 2009.
13a. Ford ES, Giles WH, Dietz WH. Prevalence of the metabolic syndrome among U.S adults: findings from the National Health and Nutrition Examination Survey. JAMA: The Journal of the American Medical Association. 2002;287:356–359.
14. Frisancho AR. New standards of weight and body composition by frame size and height for assessment of nutritional status of adults and the elderly. The American Journal of Clinical Nutrition. 1984;40:808–819.
15. Frisancho AR. Anthropometric standards for the assessment of growth and nutritional status. Ann Arbor, MI: University of Michigan Press; 1990.
16. Frisancho AR, Flegel PN. Elbow breadth as a measure of frame size for U.S males and females. The American Journal of Clinical Nutrition. 1983;31:311–314.
17. Furman EF. Undernutrition in older adults across the continuum of care: nutritional assessment, barriers, and interventions. Journal of Gerontological Nursing. 2006;32(1):22–27.
18. Gabriella SE, Sinclair AJ. Diagnosing undernutrition in elderly people. Reviews in Clinical Gerontology. 1997;7:367–371.
19. Grundy SM, Cleeman JI, Daniels SR, et al. Diagnosis and management of the metabolic syndrome: an American Heart Association/National Heart, Lung, and Blood Institute scientific statement—Executive Summary. Circulation. 2005;112:e285–e290.
20. Jackson RT. Separate hemoglobin standards for blacks and whites: a critical review of the case for separate and unequal hemoglobin standards. Medical Hypotheses. 1990;32:181–189.
21. The Joint Commission. Comprehensive accreditation manual for hospitals. Chicago: Author; 2009.
22. Lee RD, Nieman DC. Nutritional assessment. 5th ed. New York: McGraw-Hill; 2009.
23. National Academy of Sciences, Committee to Reexamine IOM Pregnancy Weight Guidelines, Institute of Medicine, National Research Council Rasmussen KM, Yaktine AL. Weight gain during pregnancy: reexamining the guidelines. Washington, DC: National Academies Press; 2009.
24. National Heart, Lung, and Blood Institute, National Institutes of Health, Department of Health and Human Services. Overweight and obesity. Retrieved July 11, 2009, from www.nhlbi.nih.gov/health/dci/Diseases/obe_whatare.html.
25. National Institutes of Health. The practical guide: identification, evaluation, and treatment of overweight and obesity in adults (monograph). Washington, DC: NHLBI Obesity Education Initiative; 2009.
26. Niemeier HM, Raynor HA, Lloyd-Richardson EE, et al. Fast food consumption and breakfast skipping: predictors of weight gain from adolescence to adulthood in a nationally representative sample. The Journal of Adolescent Health. 2006;29:842–849.
27. Ogden CL, Carroll MD, Flegal KM. High body mass index for age among U.S children and adolescents, 2003-2006. JAMA: The Journal of the American Medical Association. 2008;229(20):2401–2405.
28. Pesce-Hammond K, Wessel J. Nutrition assessment and decision making. In: Merritt R, ed. The A.S.P.E.N nutrition support practice manual. 2nd ed. Silver Spring, MD: The American Society for Parenteral and Enteral Nutrition; 2005;3–26.
29. Reuben DB, Greendale GA, Harrison GG. Nutrition screening in older persons. Journal of the American Geriatrics Society. 1995;43(4):415–425.
30. Silver HJ. Oral strategies to supplement older adults’ dietary intakes: comparing the evidence. Nutrition Reviews. 2009;67(1):21–31.
31. Trapp LW, Ryan AA, Ariza AJ, et al. Primary care identification of infants at high risk for overweight and obesity. Clinical Pediatrics. 2009;48(3):313–316.
32. U.S. Department of Agriculture, Center for Nutrition Policy and Promotion. MyPyramid. Retrieved April 12, 2006, from www.mypyramid.gov; April 2005.
33. U.S. Department of Agriculture and Department of Health and Human Services. Dietary guidelines for Americans 2005. Retrieved April, 12, 2006, from www.health.gov/dietaryguidelines; January 2005.
34. U.S. Department of Agriculture, Food and Nutrition Information Center. Retrieved July 23, 2009, from http://fnic.nal.usda.gov/nal_display/index.php?info_center=4&tax_level=1&tax_subject= 256.
35. Vartanian LR, Schwartz MB, Brownell KD. Effects of soft drink consumption on nutrition and health: a systematic review and meta-analysis. American Journal of Public Health. 2007;97:667–675.
36. Vellas B, Vellars H, Abellan G, et al. Overview of the MNA®: its history and challenges. The Journal of Nutrition, Health & Aging. 2006;10(6):456–465.
37. Weiss R, Dziura J, Burgert TS, et al. Obesity and the metabolic syndrome in children and adolescents. The New England Journal of Medicine. 2004;350(23):2362–2374.
Nutrition-Related Websites
1. American Cancer Society. In: www.cancer.org.
2. American Diabetes Association. In: www.diabetes.org.
3. American Dietetic Association. In: www.eatright.org.
4. American Heart Association. In: www.americanheart.org.
5. Centers for Disease Control and Prevention. In: www.cdc.gov/nccdphp/dnpa/nutrition/index/htm.
6. FDA Food Safety. In: www.foodsafety.gov.
7. International Food Information Council. In: www.ific.org/food.
8. Mayo Clinic Food and Nutrition Center. In: http://mayohealth.org.
9. National Center for Complementary and Alternative Medicine. In: www.nccam.nih.gov.
10. National Eating Disorders Organization. In: www.edap.org.
11. National Institutes of Health-Guidelines for Obesity. In: www.nhlbi.nih.gov/guidelines/obesity/ob_gdlns.htm.
12. USDA Food and Nutrition Information Center. In: www.nal.usda.gov/fnic/topics_a-z.shtml.