Molecular Diagnostics
Goals of Molecular Diagnostic Testing in Oncology
Since the mid-1980s, advances in the fields of molecular biology and genetics have changed our understanding of the biology of cancer. Technologic advances now provide the opportunity for applying this advanced understanding to the clinical arena in the form of novel diagnostic tests and management strategies. Molecular approaches for cancer diagnosis are now part of the standard of care for most human patients.1 Technologic advances have reduced the unit cost for many of these approaches, and their use and commercialization is increasingly taking hold within the veterinary field. It is now feasible to assess proteins, RNA, DNA, or their metabolites in tumors, effusions, blood, saliva, and urine to more accurately classify and detect various forms of neoplasia.
Recently, the National Comprehensive Cancer Network (NCCN) defined molecular testing in oncology as “procedures designed to detect somatic or germline mutations in DNA and changes in gene or protein expression that could impact the diagnosis, prognosis, prediction and evaluation of therapy for patients with cancer.”1 Molecular assays are used for a variety of reasons in the diagnostic evaluation of malignancy. For example, the presence or absence of individual oncogene mutations or chromosomal abnormalities has significant prognostic implications in many types of malignancies. In people, finding a mutation in the nucleophosmin gene in cases of acute myelogenous leukemia (AML) predicts a significantly better prognosis, independent of other factors.2 In canine mast cell disease, the presence of a mutation in the c-kit gene suggests a worse prognosis than for patients without such a mutation.3 In lymphoma, the phenotype (B- versus T-cell) plays a large role in determining prognosis in both veterinary and human patients. A variety of molecular diagnostic tests, including DNA-based and various methods of protein detection, can establish the phenotype of lymphoma.
The presence of a particular mutation or chromosomal abnormality can help to subclassify a tumor. For example, chronic lymphocytic leukemia/small cell lymphoma (CLL/SCL) and mantle cell lymphoma in humans are both neoplasms of mature B-cells, with a similar (but not identical) immunophenotype. Mantle cell lymphoma, however, almost always has a rearrangement between the immunoglobulin heavy chain locus (IgH) and the CCND1 (encoding cyclinD1) gene, whereas this rearrangement is very rare in CLL/SCL.4 The prognosis and treatment of these two diseases is quite different, so the distinction is important to make.
Molecular diagnostic testing also helps guide therapy. This may be best illustrated by the development of tyrosine kinase inhibitors (TKIs). These drugs inhibit signaling through tyrosine kinase receptors, such as c-kit, platelet-derived growth factor (PDGF) receptor, and epidermal growth factor (EGF) receptor. Tumors with mutations in these receptors that result in their constitutive activation respond well to TKIs, whereas those without may require different kinds of chemotherapy. Thus testing for mutations in these genes has become commonplace in human medicine—EGF receptor in small cell lung carcinoma and stem cell factor (SCF) receptor (c-kit) in gastrointestinal stromal cell tumors. Similarly, mast cell tumors in dogs that harbor a c-kit mutation respond better to TKIs than those without the mutation.3
Finally, oncogenes and chromosomal translocations uniquely distinguish neoplastic from normal tissue. As such, sensitive detection of mutations can be used to quantify residual disease in patients that have been treated. The best example of this is detection of the bcr-abl fusion gene, which can allow oncologists to detect as few as 1 : 106 neoplastic cells in peripheral blood.5 Tumor-specific primers that recognize the unique immunoglobulin genes found in both canine and human B-cell lymphomas have been used to quantify tumor burden and monitor disease in both dogs and people with lymphoma.
The goal of this chapter is to review several molecular techniques useful in the diagnosis and classification of cancer. It is likely that advanced molecular methodologies and diagnostics will continue to improve, become increasingly inexpensive and simpler to use, and be more broadly available to veterinarians over the next few years.
Methods for Analyzing Genes
DNA represents the genetic code of all species. This code consists of a series of continuous nucleic acid sugar strands linked through hydrogen bonds. This series of nucleic acids takes on a tertiary folded structure through modification by binding proteins called histones. The folded and wrapped DNA strand is packaged within the chromosomes of the cell. The earliest techniques used to assess the genetic changes of cancer were those that defined gains, losses, or structural changes in chromosomes, referred to as cytogenetics. Subsequently, polymerase chain reaction (PCR)–based methods and high-throughput sequencing have allowed us to detect smaller discrete mutations in DNA that do not involve changes in large portions of the chromosome. Small deletions and insertions in genes, as well as single nucleotide changes, are now routinely detected.
Detection of Chromosomal Abnormalities
Historically, these techniques involved the examination of metaphase preparations made from chromosomes. Metaphase preparations were then stained (banded) to help in the identification of distinct chromosome morphologies. Using these techniques, detection of gross abnormalities in chromosome number (ploidy) and of the presence of chromosomal translocations was possible and led to the identification of genes associated with tumor development and progression. Cytogenetic analysis has been most useful in the clinical assessment of leukemias, in which metaphase preparations are relatively easy to develop from whole blood samples.6 For most human leukemias, cytogenetic descriptors are used to define distinct subgroups into prognostic groups and to guide treatment decisions. The use of cytogenetic approaches in the management of companion animals has been limited due to the difficulty in using conventional chromosomal banding to identify canine chromosomes. The development of chromosome-specific “paints” that allow the identification of specific canine chromosomes has improved the opportunity to apply cytogenetic descriptors to canine cancers. Using these techniques, Breen and colleagues have identified a chromosomal translocation in canine chronic myelogenous leukemia (CML) and chronic monocytic leukemia that is the equivalent of the bcr-abl Philadelphia chromosome found in human CML.7,8
For the most part, traditional cytogenetic techniques, including the use of chromosome-specific paints, are labor intensive and have been replaced by alternative modalities. Comparative genomic hybridization (CGH) arrays can define gains and losses in chromosome number within tumor specimens rapidly and with highly reproducible results. In CGH analysis, the investigator labels genomic DNA from a normal individual and from tumor cells of the patient with two different color fluorescent probes. The labeled DNA is then hybridized to an array of DNA probes that span the majority of the genome. These probes are printed onto a chip or slide, such that the location of each individual probe is identified. The degree of hybridization to each probe is then determined by the level of fluorescence detected by laser excitation. Equal hybridization of the DNA from both sources to an individual probe indicates normal copy number, whereas increased binding by the tumor DNA indicates the presence of chromosomal duplication in the area of the genome covered by that probe (Figure 8-1). Similarly, higher binding by the DNA from the normal individual indicates chromosomal loss in the area.
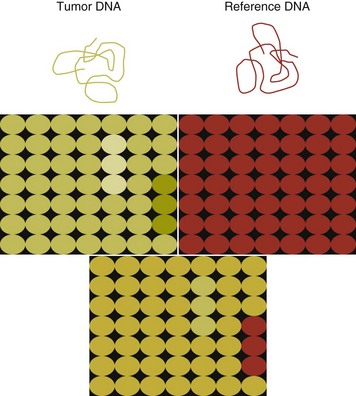
Figure 8-1 The principle of array analysis. A chip or slide is printed so that each position on the chip (there are thousands) has a single probe, which can range in size, depending on the type of array. DNA from a tumor tested is labeled with one dye (green) and DNA from the reference sample with another (red). Both samples are hybridized to the same chip. The separate red and green panels indicate that the tumor DNA exhibits both chromosomal gain (increased green fluorescence) and loss (decreased green fluorescence). When the two DNA preparations are co-hybridized, a yellow signal indicates equal degrees of red and green fluorescence. When there is a gain in copy number in a region of DNA, the signal will be green. When there is a loss in copy number, the signal will be red.
CGH arrays are useful for localizing chromosomal regions where investigators should focus their search for genes important to that cancer. A canine CGH array with 2 megabase resolution has been reported.9 Using this array, Breen and colleagues have shown that a subset of T-cell lymphomas (histologically defined as peripheral T-cell lymphoma, unspecified) exhibits copy number gain in regions common to most examples of this histologic type but not present in other T-cell lymphoma subtypes.10 This finding will help to identify genes within the duplicated areas that might be useful for diagnostics and therapy and for understanding the genesis of the neoplasm. A similar study in canine malignant histiocytosis (MH) demonstrated that MH frequently exhibits loss of chromosomal regions that contain tumor suppressor genes.11 Such genetic characterization of a diverse group of cancers, with distinct biologic behaviors but similar histologic descriptions, will significantly improve opportunities to target specific therapies and management strategies to distinct biologic subgroups of these diseases.
Polymerase Chain Reaction–Based Techniques: Detection of Mutations, Novel Genes, and Assessment of Clonality
PCR is the process of amplifying a small specific segment of DNA for the purpose of further analysis. Two small segments of DNA (commonly about 20 bases long), which are complementary to the DNA sequence surrounding the area to be amplified, are synthesized. These primers are then used to amplify the DNA, which lies between them (typically less than 1000 bases). This amplified DNA product can then be analyzed in a number of ways for mutations to quantify the product for measurement of gene expression, or in the case of lymphoid malignancy the DNA can be separated by size in order to look for clonal populations of B- and T-cells. The same methods can be applied to the analysis of RNA, once the RNA has been transcribed into DNA.
Primer synthesis typically requires that the sequence of the target gene is known. The publication of the canine genome in 200512 has been invaluable in this regard, since it is now possible to simply use the known canine sequences rather than hope for sequence similarities with mice and humans.
Detection of Genetic Insertions and Deletions
PCR-based assays are commonly used in human oncology to detect insertions or deletions in genes relevant to the prognosis or treatment of a neoplasm. In veterinary medicine, detection of internal tandem duplications (ITD) in the c-kit gene in canine mast cell tumors is now a routine part of the diagnosis for the purpose of determining the most effective treatment. C-kit is a TK receptor for the growth factor SCF and is mutated in some cases of canine mast cell tumors.13 The primary mutations described are internal ITD in two different exons, exon 8 and 11.14 The mutations involve the duplication of a small segment of DNA so that it is repeated, resulting in a larger gene (Figure 8-2). Approximately 14% to 20% of canine mast cell tumors have a duplication in either exon 8 or 11.14 Since mast cell tumors containing the ITD respond better to TK inhibitors than tumors with wild-type c-kit,15 testing for c-kit mutations has become a routine part of the diagnostic work-up for mast cell tumors.
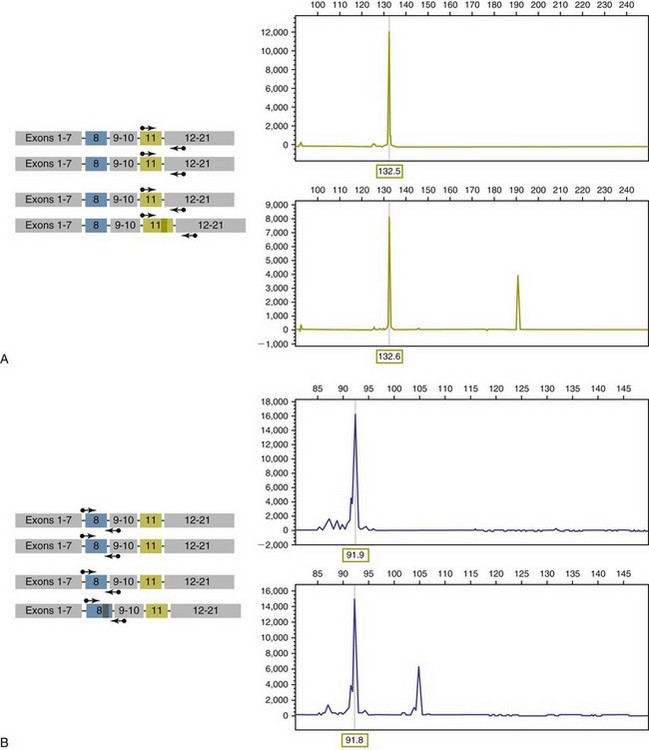
Figure 8-2 Detection of c-kit mutations by PCR. A, Two different tumor types are depicted—one has two copies of a wild type c-kit gene, and the second has one copy of a c-kit gene containing an internal tandem mutation in exon 11. The PCR products detected after amplification with primers surrounding the duplication (arrows) for each tumor are shown on the right. B, Same as in A, but in this case, the second tumor has an internal duplication in exon 8, and the PCR products are amplified with primers flanking the region of the duplication.
Detection of this type is fairly simple, since the presence of a larger (or smaller, in the case of deletions) PCR product is determined by size separation. It is likely that as more genes are identified as being targets of therapy, such assays will become more frequent. Recently, Suter et al identified an internal duplication in the FLT3 gene16 in acute lymphocytic leukemia (ALL) using the same methods and provided preliminary evidence that response to a small molecule inhibitor is predicted by the presence of the mutation in lymphoid cell lines. We are likely to see routine use of mutation detection grow in the near future and continue to guide treatment decisions.
Detection of Single-Base Mutations
Single-base mutations are more difficult to detect, since the base-pair change does not confer a size difference to the PCR product. Several strategies are used in human medicine for detecting these kinds of mutations. First, mutations can be detected by synthesizing primers that are complementary to the mutation, rather than to the wild-type version of the gene. In theory, a PCR product would only be seen if the mutation is present. This approach has to be tested empirically for each individual mutation, since such primers may also anneal to the wild-type gene, although with less affinity. There are a variety of ways to produce primers that are more discriminating, and different methods will be more or less effective for individual mutations.
Another approach employs direct sequencing of the PCR product. Sequencing is now inexpensive and widely available. The limitation of direct sequencing is that the sample must contain a significant percentage of tumor cells for the mutation to be detected—most estimates suggest 10% or more. This is because at best only one-half of the DNA sequenced will have the individual mutation (assuming the tumor also has a wild-type copy of the gene), and the presence of nonneoplastic tissue in most clinically derived samples will serve to further dilute the amount of mutated DNA. Thus, unless the PCR products are cloned and sequenced individually, a significant portion of the DNA must be tumor derived.
Detection of Fusion Gene Products by PCR
One mechanism by which chromosomal translocation causes malignant transformation of cells is to create novel proteins with altered function. The best studied of these fusion genes, the Philadelphia chromosome, is the breakpoint cluster region-Abelson (bcr-abl) fusion gene found in greater than 90% of all human CMLs and occasionally ALL and AML.17 abl is a tyrosine kinase that has myriad activities involved in cell growth and differentiation. It is encoded on human chromosome 9, and in CML, it is translocated to chromosome 22. The site of the translocation varies within the bcr gene, so that a new fusion gene, bcr-abl, is formed. The new fusion protein allows for the constitutive activation of the abl tyrosine kinase, which in turn promotes the development of CML (Figure 8-3).
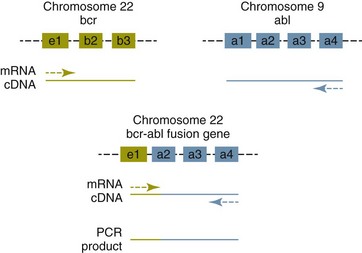
Figure 8-3 Translocation of the abl gene to the bcr gene creates a fusion gene that can be detected by PCR. In nonleukemic cells, primers located as indicated (arrows) will not amplify any product, because they anneal to two distinct cDNAs. When bcr and abl are brought together, the primers are both annealing to the same cDNA and will amplify this product. e1, b2, and so forth refer to exon numbers.
This fusion protein is the product of a novel RNA transcript, which can be readily detected by PCR. To accomplish this, RNA is extracted from blood containing potentially neoplastic cells and reverse transcribed to cDNA. The cDNA is then amplified with two primers, one which anneals to the bcr gene, and the other to the abl gene. Since these two genes are normally on different chromosomes, no product will be seen in the absence of a translocation, but will be detected if the genes have been brought together to form a single messenger RNA (mRNA). This assay can detect as few as 1 : 106 tumor cells5 and can therefore be used for both diagnosis of CML and quantifying residual disease after treatment.
Assays for a large number of translocations have been developed over the past 10 years.18 These assays are now routinely available for characterization of human tumors, particularly leukemia. The finding that canine leukemia and lymphoma can exhibit the same translocations as their human counterparts8 suggests that detection of this novel fusion gene would aid in the diagnosis of canine chronic myelogenous leukemia.
Assessment of Clonality in Lymphoma and Leukemia
A clonality assay demonstrates that a group of cells is derived from a single clone. The term is usually used to refer to detection of the unique genes found in each individual B- or T-cell—immunoglobulin genes in B-cells and T-cell receptor (TCR) genes in T-cells. The portion of these genes that encodes the antigen-binding region is the portion that varies between cells, both in size and sequence. When B- or T-cells divide, the immunoglobulin and TCR genes are passed on to the daughter cells.19,20
In the course of a normal immune response to a pathogen, B- and T-cells are activated, expand, and eventually die, leaving behind a small number of residual memory cells. On the other hand, when a cell becomes neoplastic, it no longer responds to growth controls and undergoes unlimited expansion. Therefore, if one can establish that the majority of cells in a particular collection of lymphocytes have the same immunoglobulin or TCR gene, it is most likely that these cells are neoplastic rather than reactive.21
When immunoglobulin and TCR genes rearrange during the course of B-cell and T-cell development, respectively, the length and sequence of the resultant gene differs from cell to cell. There are many reasons for this, including the fact that nucleotides are added between V, D, and J segments as they rearrange into a contiguous formation. The clonality assay takes advantage of this fact. In a sample consisting of many different lymphocytes, as in a reactive process (the lymph nodes of a dog with chronic pyoderma or poor dental hygiene, for example), there will be multiple different-sized TCR and immunoglobulin genes. On the other hand, in a sample consisting of neoplastic lymphocytes, the immunoglobulin gene or the TCR gene (depending on whether it is a B-cell or a T-cell lymphoma) will be a single size (Figure 8-4).
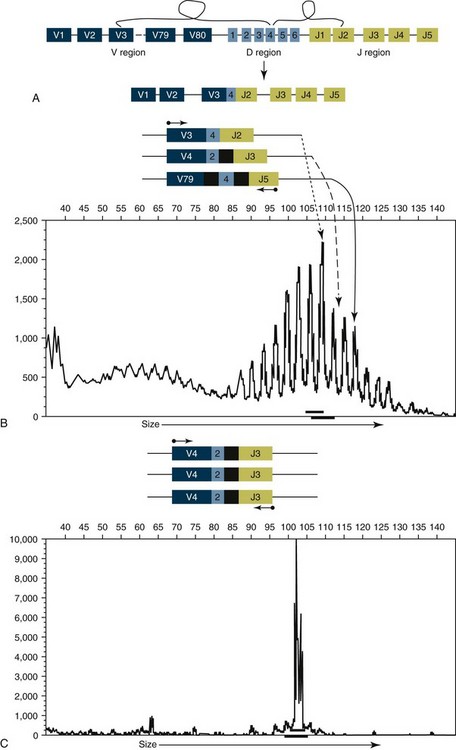
Figure 8-4 Rearrangement of immunoglobulin genes. A, There are approximately 80 V-region genes, 6 D-region genes, and 5 J-region genes. A single V, D, and J are brought together at random to create a single VDJ gene segment that encodes the antigen-binding portion of an antibody, and the intervening sequence is removed. B, In the process of bringing together V, D, and J genes, a variable number of nucleotides (black) are added between V and D and D and J. As a result, each individual B-cell will have a VDJ gene segment with a unique length. When DNA from a heterogeneous population of B-cells is isolated and amplified with primers bracketing the VDJ gene segment (small arrows), the PCR products will be different lengths. The lower panel shows the PCR products separated by size using capillary gel electrophoresis and illustrates multiple different-sized PCR products. C, When a population of B-cells is comprised of cells derived from a single clone, all the VDJ gene segments will be identically sized. PCR amplification of the VDJ gene segment will yield a single-sized product as shown in the lower panel. All the principles illustrated here also apply to T-cell receptor (TCR) genes. For the clonality assay, the TCR γ-chain is amplified, although in theory TCR β-chain could also be used.
Clonality assays are accomplished by isolating DNA from cells suspected to be neoplastic and then using PCR primers directed at the conserved regions of TCR or immunoglobulin genes. The primers amplifying the variable regions and the PCR products are separated by size using a variety of possible methods. The presence of a single-sized PCR product is indicative of clonality, whereas the presence of multiple PCR products supports a reactive process. This assay has now been reported by a number of laboratories22-25 and used to answer a variety of clinical questions.26-28 This assay is termed the PCR for antigen receptor rearrangement (PARR) assay in order to distinguish it from other types of clonality assays.23 It should be noted, however, that the term PARR is not used in the human literature, where the assay instead is referred to as a clonality assay.
The PARR assay is able to detect approximately 1 : 100 neoplastic cells. The sensitivity and specificity of the assay will differ between laboratories because the results are highly sensitive to the conditions under which the assay is run and to the technique used to separate the PCR products. Capillary gel electrophoresis has the highest resolution, but high percentage polyacrylamide gels may also be used. Agarose gels, even high-resolution agarose gels, provide insufficient resolution for this assay and should not be used.
The main application of the PARR assay is to establish clonality in a sample that is cytologically or histologically ambiguous—cases in which there are rare cytologically suspicious cells within the context of a reactive node, for example, or a lymph node that was interpreted as “atypical lymphoid hyperplasia” on histology. Clonality assays can sometimes be useful for establishing the lineage (B- versus T-cell) in cytologically unambiguous lymphomas if additional case material is not obtainable from the patient, but in general flow cytometry, immunohistochemistry, or immunocytochemistry are preferable for this purpose. This is because aberrant rearrangements can occasionally be seen in nonlymphoid tumors such as myelogenous leukemias and also in a neoplasm of the opposite phenotype (TCR rearrangement in a B-cell lymphoma, for example). The rate at which this occurs also probably differs from laboratory to laboratory and depends on the subtype of lymphoma being examined.
The principle of the clonality assay can also be used to quantify tumor cells in blood or node and to monitor minimum residual disease. For this type of analysis, PCR primers specific for the immunoglobulin or TCR gene that is carried by the tumor are used, instead of the broadly reactive primers used to screen samples. In this way the investigator is certain that only tumor DNA is being amplified and not nonneoplastic lymphocytes. The specificity of this reaction permits determination of the number of tumor cells in a sample of blood, even when those cells are as rare as 1 : 10,000 cells. Yamazaki et al28 demonstrated that with current chemotherapy protocols, all seven dogs they examined had at least 1 : 10,000 cells in their peripheral blood, even though the dogs achieved clinical remission. Although this kind of analysis may not be practical for routine diagnostics, it is a powerful research tool to compare the efficacy of novel chemotherapy regimens.
Single Nucleotide Polymorphism Analysis
A great deal of interpatient variability in the biology of cancers is based on the presence or absence of mutations in a cancer. However, small differences in host genes—referred to as single nucleotide polymorphisms (SNPs)—have been shown to be important in defining these interindividual differences in disease progression and response to treatment. SNPs can result in a change in the structure or function of a gene. SNPs are considered to be distinct from mutations since they are present in a subset of the population and do not cause disease themselves. A number of SNPs in genes that function in hepatic metabolism in the human population have been identified and can predict increased risk for toxicity to some drugs. Similarly, SNPs in other genes have been shown to predict an increased risk for a more aggressive course of metastatic progression once a patient develops a cancer.29 The release of the canine genome sequence has made possible the high-throughput detection of SNPs—using an array platform30—within a population of dogs. It is likely that SNP-based diagnostics will emerge from these discovery efforts and will contribute to the individualization of therapy of dogs and cats with otherwise similar diseases. SNP-based diagnostics are also helpful in providing an opportunity to attempt to predict or define individual differences seen between patients treated in the same way for the same disease. These differences may include toxicities experienced after receiving a treatment, beneficial response to a therapy, or progression rates for patients with a similar disease stage. These forms of individualized therapy are on the horizon for both human and veterinary cancer patients.
Quantifying Genes and Gene Expression
The complete genetic code, or DNA sequence, is present within every cell in the body. The effective genetic information that uniquely defines each cell type within the body is defined by the genes expressed (transcribed) as mRNA. The expression of mRNA is more responsible for the phenotype of a cancer than the individual genes and mutations harbored by the tumor. When assessing the level of expression of one or a few genes, real time PCR is most commonly used. Assessment of the global level of gene expression is carried out with microarrays and is called gene expression profiling. Both methods measure relative expression of message when compared to a control gene whose expression is thought to be more or less constant in all cells and universal. These methods are both likely to be replaced over the next 10 years with new technologies, which allow investigators to count the absolute number of genes or transcripts in a sample.
Real-Time Polymerase Chain Reaction
Real-time PCR (also called Q-PCR) refers to the quantitative measurement of DNA—either genes, or more commonly, RNA that has been reverse transcribed to cDNA. The principle of real-time PCR is that DNA is amplified using primers, just as in a routine PCR reaction, but at each round of amplification, fluorescence relative to the amount of PCR product is quantified. Unlike endpoint PCR, in which the reaction runs to completion and the product is separated by size, real-time PCR is highly quantitative.
The two main methods for quantifying DNA in real-time PCR have different advantages and disadvantages. The simplest and least expensive method is the use of the DNA-binding dyes, such as SYBR green (pronounced cyber). This dye fluoresces when it intercollates into DNA. Therefore, at each round of amplification, more dye is intercollated and the degree of fluorescence increases. Eventually, the fluorescence reaches saturation, but the endpoint is less important than the log phase of DNA increase. The amount of starting material is compared between samples by determining at which amplification cycle the degree of fluorescence crosses a given threshold. SYBR green will intercollate into any DNA product, so this method is only accurate when the primers are highly specific and amplify only one gene product.
An alternative method uses fluorescently labeled DNA probes. These are short segments of DNA complementary to the target sequence between the two primer sites. A fluorescent molecule attached to the probe is quenched until the 5′ to 3′ exonuclease activity of the Taq polymerase releases the fluorescent molecule. As the amount of PCR product increases proportional to the starting material, the amount of fluorescence increases. The advantage of the probe method is that instead of two primers providing specificity to the reaction, there are three. In order to detect a product, these three different segments of DNA need to bind to the target sequence in three separate places. The assay may be less robust at low target numbers and is slightly more expensive but also significantly more specific. This assay with its increased specificity was used by Yamazaki et al28 to quantify individual neoplastic lymphocytes in a background of heterogenous lymphocytes and thus quantify minimal residual disease.
Real-time PCR can quickly allow for precise quantification of mRNA levels within samples and has a number of defined clinical applications. It is commonly used in the quantification of aberrant oncogenic fusion products. Promyelocytic leukemia gene–retinoic acid receptor (PML-RAR) fusion transcripts in acute promyelocytic leukemia (APL) are identified by this method31 and can be used to define molecular remission in patients with APL. Molecular remissions are defined by the absence of not only clinically detectable disease but by the absence of any tumor-associated transcript in blood, bone marrow, or lymph node. Achieving a molecular remission in patients with leukemias and lymphoma is a superior measure of prognosis over clinical assessments of remission that are based on clinical examination, imaging techniques, or histologic or cytologic assessments of at-risk tissues.
Gene Expression Profiling
Gene expression profiling refers to the quantification of thousands of mRNAs simultaneously to create a picture of global gene expression in the cell population. The pattern of gene expression is called a gene expression profile. A variety of different software tools are available for identifying patterns of expression involved in a common pathway or function. The companies that produce these tools mine the literature for information about the function(s) of different genes, and then place these genes into pathways. A collection of genes involved in a particular pathway are frequently referred to as signatures. For example, if the gene expression profile shows a proliferation signature, then the genes involved in the regulation of cell division are upregulated. If the cells show a nuclear factor kappa B (NFκB) signature, expression of genes regulated by the transcription factor NFκB are increased.
Gene expression profiling is performed using similar tools as CGH arrays. Oligonucleotides complementary to thousands of different genes are printed on a slide or chip, usually more than one oligo for each gene. mRNA from the sample in question is isolated, reverse transcribed to DNA, and labeled with a fluorescent probe. This fluorescent cDNA is then hybridized to the chip, and the degree of fluorescence is proportional to the amount of mRNA present in the original sample. A variety of controls are built into the chip and are used during the analysis to look at gene expression relative to standard housekeeping genes, such as GAPDH.
Gene expression profiling is comparative. Investigators can compare expression profiles of tumor cells to the normal cellular counterpart, to similar tumors with different clinical outcomes, and to tumor cells from the same patient before chemotherapy; can compare primary lesions to metastatic lesions; and can make other comparisons to ask how different pathways have changed. Such information has proved invaluable in a variety of settings. For example, in a study of cervical cancer in humans, investigators analyzed gene expression profiles of tumors that responded to chemotherapy and radiation and compared those with tumors that did not respond. Their study revealed that activation of the PI3K/Akt signaling pathway was associated with a poor response, suggesting one potential therapeutic target.32 Another example of how gene expression profiling has advanced oncology are the studies of B-cell lymphoma by Staudt and colleagues. Noting that diffuse large B-cell lymphoma (DLBCL) has a heterogeneous outcome in people, this group compared the gene expression profiles of 96 DLBCL with B-cells derived from different stages of normal B-cell development.33 They found that the gene expression profile of DLBCL could either be categorized as similar to germinal center B-cells or similar to activated B-cells. Importantly, these two categories had prognostic significance: germinal center-like DLBCL cases had a better prognosis. The distinction between germinal center DLBCL and activated B-cell DLBCL is now well established as a prognostic indicator.
This same group made another important discovery about B-cell lymphoma using gene expression profiling, which provided insights into immunity to cancer. Expression profiles of lymph nodes from patients with follicular B-cell lymphoma demonstrated that the type of immune response signature was prognostic in this disease. Patients whose lymph node gene expression patterns exhibited evidence of T-cell activation had a better overall survival than patients whose gene expression patterns resembled activated macrophages.34 The expression profile of the tumor cells themselves was not predictive. This finding suggests that the immune response contributes to survival in patients with follicular B-cell lymphoma, a result which was corroborated in other types of B-cell lymphoma.35,36
Gene expression profiling is now a readily accessible tool in canine oncology because of the availability of the Affymetrix Canine Genome 2.0 and Agilent (V2) Gene Expression microarrays, and investigators have begun to examine gene expression profiles in a variety of canine neoplasms, including hemangiosarcoma,37-39 lymphoma, and osteosarcoma.40,41
On the Horizon—Counting Genes
The next generation of genetic analysis uses a new paradigm for evaluating individual genes, gene expression (cDNA analysis), and whole genomes. The old paradigm has been to use fluorescent or other types of DNA labels to quantify copies of DNA—more fluorescence means more copies. For example, if we want to quantify bcr-abl fusion messenger RNA for determining the number of circulating cells present before and after treatment, a fluorescent based real time PCR method would be used. Fluorescently labeled probes, corresponding to a portion of the bcr-abl fusion gene, would be added to a PCR reaction where that gene is specifically amplified. The amount of fluorescence is directly proportional to the amount of product, which is proportional to the amount of starting cDNA. This is usually compared with the amount of message from a housekeeping gene to give a relative quantity of bcr-abl message.
In the new paradigm, the number of cDNAs corresponding to bcr-abl in a blood sample would be counted in absolute numbers. One name given to this idea is “digital PCR.” There are many methods to accomplish this kind of quantification, but they all share the idea that millions of isolated PCR reactions are being carried out on single DNA molecules. In the bcr-abl example, millions of individual cDNAs from a blood sample, together with bcr-abl primers and polymerase, would be isolated on a solid matrix or in individual droplets in an emulsion; the result of that amplification would be positive (if the bcr-abl cDNA is present) or negative (if the bcr-abl DNA is absent). Presence or absence of a product can still be a fluorescent readout, but the message is quantified by the percentage of individual reactions that are positive. The advantage of this method is the elimination of the need for standard curves and reference samples. In addition, these methods are likely to be significantly more sensitive since thousands to millions of DNA molecules are analyzed at one time. Thus one has the possibility of measuring as few as 1 in 106 copies of a gene or message. The first generation of instruments that can carry out this kind of analysis are now commercially available, and it is likely that these will eventually become commonplace.
Next generation whole genome sequencing works on a similar principle. A variety of instruments are now available with the capability of sequencing an entire mammalian genome within days (including setup and DNA isolation) at a cost of about $10,000 to $20,000. This is accomplished by carrying out millions of sequencing PCR reactions simultaneously. Whole genomic DNA is sheared into small fragments, and individual sequencing PCR reactions are carried out on each fragment. The result is that the investigator obtains millions of short sequences, which must then be interpreted by extensive software analysis. It is certain that the cost of this type of analysis and its complexity will both decrease in the near future. Current efforts are underway to sequence both whole genome and exons of a number of canine cancers that will continue to identify and characterize important targets and pathways in their pathogenesis. The day when a patient’s entire tumor genome is sequenced as a routine part of diagnostics is imaginable and not that far in the future.
Methods for Protein Analysis
Protein expression represents the accumulation or end product of genetic information. DNA is transcribed into RNA, which is then translated into proteins. Therefore the detection of proteins and their active forms (most often phosphorylated) represents an important step in the global understanding of cancer biology. Protein measurements can be both qualitative and quantitative and can include a variety of candidate approaches, including Western blotting, immunohistochemistry, and various novel noncandidate proteomic platforms, collectively referred to as proteomic approaches.
Western Blots
Western blots allow for the detection of a protein within a sample through the use of an antibody that is specific to that protein. Western blots are used widely as a diagnostic modality that has recently seen expanded clinical use in the field of oncology through the availability of antibodies that are specific for phosphorylated forms of proteins and for mutated proteins. As treatment modalities for cancer have become more target-dependent, the need has increased to define the presence of the target protein in a clinical sample. Documentation of HER2/neu oncogene expression in human breast cancer patients has the dual utility of contributing to prognosis (expression of this protein carries a negative prognostic value) and guiding the rational use of trastuzumab (Herceptin), a therapeutic monoclonal antibody that has been shown to improve time to progression and overall survival in metastatic breast cancer patients when combined with chemotherapy.42
In the veterinary field, Western blots have been part of the diagnosis and management of animals with tick-borne infectious disease and feline immunodeficiency virus. The use of in-house “snap” test technology is based on a similar technique of antibody-based detection, including enzyme-linked immunosorbent assay (ELISA) and radioimmunoassay (RIA). In these assays, rather than using gel electrophoresis, the probing antibody is affixed to a substrate for detection of antigen in material passed over or through this substrate. As such, the specificity and sensitivity of antigen-antibody interactions needed for these tests are greater than what are needed for a Western blot. In the field of oncology, these snap tests have been limited by a lack of tumor-specific antibodies (with high sensitivity and specificity) that could aid in the diagnosis of cancer.
Immunohistochemistry and Flow Cytometry
As in the case of Western blots, advances in antibody development have similarly improved the opportunity to define patient groups and direct therapy through the use of immunohistochemistry (IHC; the assessment of protein expression in fixed tissue sections) or by flow cytometry.
Immunohistochemical staining is carried out on formalin-fixed, paraffin-embedded tissue or, less commonly, on frozen sections. Immunocytochemistry (ICC) uses the same methods and reagents but on fine-needle aspirates. Antibodies to specific proteins are applied to the tissue, generally followed by a secondary antibody of a different species than the patient or the primary antibody. The secondary antibodies are conjugated to enzymes that catalyze a color change when substrate is added. This method allows pathologists to identify individual cells that do or do not express the protein of interest and to put these cells in the context of tissue architecture.
In veterinary oncology, IHC is most commonly used to distinguish sarcomas from carcinomas and to phenotype lymphomas. The first application involves staining tumor sections with antibodies to the cytoskeletal proteins vimentin and cytokeratin. Vimentin is found in mesenchymal origin tumors (e.g., osteosarcomas, fibrosarcomas). Cytokeratin is expressed by epithelial origin cancers (carcinomas). Although the distinction between these two types of tumors is generally straightforward, when there is doubt, it is common to request vimentin/cytokeratin staining (see Chapter 3).
IHC is particularly important in subclassifying lymphoma. The 2008 World Health Organization (WHO) classification of lymphomas describes greater than 40 lymphoproliferative disorders (lymphoma and leukemia) in humans.43 All subclassifications begin with phenotype (B- versus T-cell). The origin and biologic behavior of different subclassifications of lymphoma are different enough that it is not scientifically justified to consider lymphoma a single disease. Therefore, when conducting therapeutic trials, epidemiologic studies, and any other types of analyses on canine lymphoma, it will be necessary to examine individual subtypes separately (Figure 8-5).
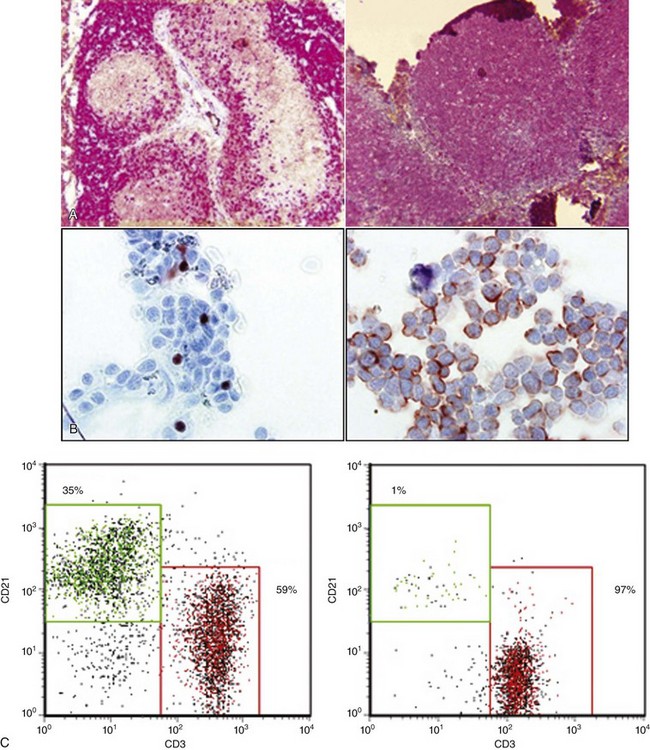
Figure 8-5 Two methods for determining immunophenotype in a T-cell lymphoma. A, Immunohistochemical staining of a normal lymph node (left) and a T-cell lymphoma (right). The brown stain in the left panel is the result of binding by anti-CD79a, and indicates the B-cell regions of the lymph node. The red staining indicates binding by anti-CD3 and highlights the T-cell regions of the lymph node. The panel on the right reveals a node effaced by T-cells (T-cell lymphoma). B, Immunocytochemical staining of a T-cell lymphoma, showing staining with anti-Pax5 on the left (a B-cell specific antibody) and anti-CD3 on the right. C, Flow cytometry staining of a T-cell lymphoma (right panel) and a normal lymph node (left panel). Each dot represents a cell, which is plotted on the histogram based on the amount of CD3 staining (x axis, red box) and CD21 staining (y axis, green box) for identifying T-cells and B-cells, respectively. The percentage of total cells in the node is indicated in each box. The lymph node from the dog with T-cell lymphoma contains T-cells almost exclusively, which, in a separate staining reaction, were shown to be CD4+.
The antibodies used to determine the B- or T-cell origin of lymphoma in formalin-fixed sections are anti-CD3 (which identifies T-cells) and one of several anti–B-cell antibodies, including CD79a, Pax5, and CD20. All of these antibodies recognize the cytoplasmic portions of the target antigen—the process of fixation permeabilizes cells to allow antibodies access to these epitopes. The antibodies also recognize conserved regions of the proteins and are therefore useful in a variety of different species. Further subclassification of lymphoma is possible based on the distribution of neoplastic cells within the lymph node. For example, there are a number of neoplasms of mature B-cells with very different outcomes: SCL, mantle cell lymphoma, and follicular lymphoma (FL). These can be differentiated by examining architecture of a lymph node stained with B-cell antibodies. In human patients, they can also be differentiated by flow cytometry (see later) or cytogenetic studies. The human classification has been applied to canine lymphoma by a consortium of pathologists who reached broad but not perfect agreement about histologic subtypes.44 There is still a paucity of data, however, on the biologic behavior of these subtypes in dogs.
An alternative method of immunophenotyping lymphomas is flow cytometry. Flow cytometry analyzes cells in single-cell suspension. The flow cytometer uses lasers to identify characteristics of the cells, including their size, their complexity, and the proteins they express on their cell surface. The latter requires that the cells are stained with antibodies, which are conjugated to various fluorescent proteins. Flow cytometry is an extremely powerful tool because for each individual cell in the suspension, the expression of up to 10 different proteins can be analyzed routinely, and even higher numbers are possible. The value of this kind of analysis is highlighted in human medicine by the approach to a patient with circulating neoplastic mature B-cells. The differential diagnosis includes CLL, leukemic mantle cell lymphoma, marginal zone lymphoma, and FL. In all four entities, the cells will express the B-cell antigen CD20, but only mantle cell lymphoma and CLL express CD5. The latter two can then be distinguished from one another by expression of a series of additional surface proteins, which can be examined simultaneously by flow cytometry.45
Flow cytometric phenotyping has advantages and disadvantages compared with IHC. As noted above, the advantages are that multiple parameters can be analyzed at once and objective data obtained about each parameter. Information about cell size and granularity and the levels of expression of different antigens have prognostic significance.46-48 Because formalin fixation damages proteins, most of the cell surface proteins examined by flow cytometry cannot be identified in tissue sections, so less information about protein expression is available by IHC. Flow cytometry can be carried out on lymph node aspirates, precluding the requirement of sedation and a biopsy.
IHC, however, allows the pathologist to view the architecture of the node. Veterinary pathologists recognize many of the WHO categories of lymphoma, including diffuse large B-cell lymphoma, FL, and mantle cell lymphoma. One study systematically evaluated outcome using contemporary classifications and found that small cell T-zone lymphoma had the most favorable outcome, whereas Burkitt-like B-cell lymphoma had the worst.49 This study was small but revealed the value of classifying and subclassifying lymphomas using contemporary standards. More recently, an investigation of canine indolent T-cell lymphoma, which is a diagnosis that can only be made by histology coupled with IHC, revealed that treatment of this form of lymphoma with a CHOP-based protocol resulted in the same outcome as treatment with chlorambucil and prednisone. This is the first study clearly demonstrating the utility of histology and IHC in guiding treatment decisions.50 When additional outcome-based investigations are performed and veterinary pathologists are more widely knowledgeable about the WHO classification scheme, the added expense and invasiveness of a biopsy over flow cytometry will be justified.
Proteomics
Proteomics is the large-scale and high-throughput study of proteins, including their identification, structure (e.g., posttranslational modifications), and function.51 Proteomics, like gene expression profiling, is often comparative, and differences in protein expression in cell lysates or tissues in various conditions (e.g., neoplastic versus normal) are measured. The proteome is a dynamic entity that is much less stable and more complicated than the genome. Protein expression is influenced by translation, protein activation (most often by phosphorylation) or other posttranslational modifications, and also protein turnover and degradation. Thus the protein complement in a disease state is not solely defined by its genetic expression pattern and can change quickly over time. Because proteins are the molecules that execute cell or tissue processes, their identification globally is thought to be a more accurate “snapshot” of cell status than either the genomic sequence or gene expression at the RNA level. Thus far, proteomics has led to better understanding of cancer and identification of potential markers for diagnosis and prognosis. However, routine clinical application of proteomics is still developing.
A recent review describes proteomics and proteomics techniques in detail.52 A typical proteomics experiment, the aim of which is to identify a large number of proteins in a complex mixture, requires multiple steps. These steps can include protein solubilization, separation into less complex fractions, mass spectrometric measurement of peptide masses, and finally protein identification via database searching. Separation of a mixture of proteins can be performed using one-dimensional polyacrylamide gel electrophoresis (1D-PAGE) (separation by size), two-dimensional PAGE (separation by isoelectric point, then size), liquid chromatography (separation of soluble proteins or peptides based on their physical properties), or a combination. Once proteins are separated, they are digested with an enzyme into a mixture of peptides. These peptides are applied to a mass spectrometer and their mass-to-charge ratio is measured. A list of measured masses is searched against theoretical peptide masses generated from “in silico” digestion of proteins translated from genomic databases.
There are several types of spectrometers, which vary by their ionization technique and method of mass-to-charge measurement. Briefly, electrospray ionization introduction and ionization of the sample occur in the liquid phase. For matrix-assisted laser desorption ionization (MALDI), the sample is mixed with a matrix (organic acid) and allowed to co-crystallize on a target (metal plate). Biomarker discovery has been performed using a specific application of MALDI-mass spectrometry called surface-enhanced laser desorption/ionization (SELDI) mass spectrometry. The separation of proteins for SELDI is performed directly on the plate, which contains specific materials designed to retain certain proteins. SELDI produces a profile of mass spectrometric masses (protein profiling), rather than actual protein identification. This technique was originally described as being highly sensitive and specific for identifying individuals with ovarian cancer,53 although the interpretation of the spectral data has been difficult to reproduce.54 This underscores the fact that, regardless of the initial promise of a diagnostic method, it is still necessary to use appropriate study design and statistical analysis (as with any other test).
A recent study demonstrates the utility of proteomic analysis in the study of cancer. Klose et al55 asked if progression from hyperplastic mammary tissue to neoplastic and then metastatic disease was associated with changes in protein expression in humans. They compared normal mammary tissue, mammary adenomas, mammary carcinomas (nonmetastatic), and carcinomas that had metastasized. Among their most significant findings was that, while the histologic appearance of nonmetastatic and metastatic tumors was not different, the proteins they express were significantly different. This kind of study can lead directly to the development of prognostic markers, which can be used in routine IHC, and also serves to identify good and poor prognosis patients.
Summary
Molecular diagnostics is becoming more integrated into veterinary medicine and at the same time becoming more affordable. One important feature of such advanced diagnostics is that many of them save money for owners and preclude invasive procedures for their pets. Sensitive methods for detecting lymphoma through a combination of cytology, flow cytometry, and PARR assays, for example, can mean that a diagnosis of splenic lymphoma can be made without splenectomy. Detection of the c-kit mutation can guide therapy so that the most efficacious (and therefore cost-effective) drugs are used. More expensive exploratory techniques such as whole genome sequencing and proteomic analysis of tumors will almost certainly lead to discovery of new testing that can further simplify diagnoses. Veterinarians are encouraged to participate in these developmental studies when they can, by providing biologic materials and clinical data to researchers, because ultimately patients and their owners will derive great benefit from current research.
References
1. Engstrom, PF, Bloom, MG, Demetri, GD, et al. NCCN Molecular Testing White Paper: Effectiveness, efficiency, and reimbursement. J Natl Compr Canc Netw. 2011;9(suppl 6):S1–S16.
2. Grimwade, D, Hills, RK, Moorman, AV, et al. Refinement of cytogenetic classification in acute myeloid leukemia: determination of prognostic significance of rare recurring chromosomal abnormalities among 5876 younger adult patients treated in the United Kingdom Medical Research Council trials. Blood. 2010;116:354–365.
3. London, CA, Malpas, PB, Wood-Follis, SL, et al. Multi-center, placebo-controlled, double-blind, randomized study of oral toceranib phosphate (SU11654), a receptor tyrosine kinase inhibitor, for the treatment of dogs with recurrent (either local or distant) mast cell tumor following surgical excision. Clin Canc Res. 2009;15:3856–3865.
4. Jevremovic, D, Viswanatha, DS. Molecular diagnosis of hematopoietic and lymphoid neoplasms. Hematol Oncol Clin North Am. 2009;23:903–933.
5. Morley, A. Quantifying leukemia. N Engl J Med. 1998;339:627–629.
6. Knuutila, S. Cytogenetics and molecular pathology in cancer diagnostics. Ann Med. 2004;36:162–171.
7. Cruz Cardona, JA, Milner, R, Alleman, AR, et al. BCR-ABL translocation in a dog with chronic monocytic leukemia. Vet Clin Path. 2011;40:40–47.
8. Breen, M, Modiano, JF. Evolutionarily conserved cytogenetic changes in hematological malignancies of dogs and humans—man and his best friend share more than companionship. Chromosome Res. 2008;16:145–154.
9. Thomas, R, Scott, A, Langford, CF, et al. Construction of a 2-Mb resolution BAC microarray for CGH analysis of canine tumors. Genome Res. 2005;15:1831–1837.
10. Thomas, R, Seiser, EL, Motsinger-Reif, A, et al. Refining tumor-associated aneuploidy through ‘genomic recoding’ of recurrent DNA copy number aberrations in 150 canine non-Hodgkin lymphomas. Leuk Lymphoma. 2011;52:1321–1335.
11. Hedan, B, Thomas, R, Motsinger-Reif, A, et al. Molecular cytogenetic characterization of canine histiocytic sarcoma: A spontaneous model for human histiocytic cancer identifies deletion of tumor suppressor genes and highlights influence of genetic background on tumor behavior. BMC Cancer. 2011;11:201–215.
12. Lindblad-Toh, K, Wade, CM, Mikkelsen, TS, et al. Genome sequence, comparative analysis and haplotype structure of the domestic dog. Nature. 2005;438:803–819.
13. London, CA, Galli, SJ, Yuuki, T, et al. Spontaneous canine mast cell tumors express tandem duplications in the proto-oncogene c-kit. Exp Hematol. 1999;27:689–697.
14. Letard, S, Yang, Y, Hanssens, K, et al. Gain-of-function mutations in the extracellular domain of KIT are common in canine mast cell tumors. Mol Cancer Res. 2008;6:1137–1345.
15. Hahn, KA, Ogilvie, G, Rusk, T, et al. Masitinib is safe and effective for the treatment of canine mast cell tumors. J Vet Int Med. 2008;22:1301–1309.
16. Suter, SE, Small, GW, Seiser, EL, et al. FLT3 mutations in canine acute lymphocytic leukemia. BMC Cancer. 2011;11:38–46.
17. Wong, S, Witte, ON. The BCR-ABL story: bench to bedside and back. Annu Rev Immunol. 2004;22:247–306.
18. Osumi, K, Fukui, T, Kiyoi, H, et al. Rapid screening of leukemia fusion transcripts in acute leukemia by real-time PCR. Leuk Lymphoma. 2002;43:2291–2299.
19. Delves, PJ, Roitt, IM. The immune system. First of two parts. N Engl J Med. 2000;343:37–49.
20. Blom, B, Spits, H. Development of human lymphoid cells. Annu Rev Immunol. 2006;24:287–320.
21. Swerdlow, SH. Genetic and molecular genetic studies in the diagnosis of atypical lymphoid hyperplasias versus lymphoma. Hum Pathol. 2003;34:346–351.
22. Vernau, W, Moore, PF. An immunophenotypic study of canine leukemias and preliminary assessment of clonality by polymerase chain reaction. Vet Immunol Immunopath. 1999;69:145–164.
23. Burnett, RC, Vernau, W, Modiano, JF, et al. Diagnosis of canine lymphoid neoplasia using clonal rearrangements of antigen receptor genes. Vet Path. 2003;40:32–41.
24. Tamura, K, Yagihara, H, Isotani, M, et al. Development of the polymerase chain reaction assay based on the canine genome database for detection of monoclonality in B cell lymphoma. Vet Immunol Immunopath. 2006;115:163–167.
25. Yagihara, H, Tamura, K, Isotania, M, et al. Genomic organization of the T-cell receptor γ gene and PCR detection of its clonal rearrangement in canine T-cell lymphoma/leukemia. Vet Immunol Immunopath. 2007;115:375–382.
26. Burnett, RC, Blake, MK, Thompson, LJ, et al. Evolution of a B-Cell lymphoma to multiple myeloma after chemotherapy. J Vet Int Med. 2004;18:768–771.
27. Keller, RL, Avery, AC, Burnett, RC, et al. Detection of neoplastic lymphocytes in peripheral blood of dogs with lymphoma by polymerase chain reaction for antigen receptor gene rearrangement. Vet Clin Path. 2004;33:145–149.
28. Yamazaki, J, Baba, K, Goto-Koshino, Y, et al. Quantitative assessment of minimal residual disease (MRD) in canine lymphoma by using real-time polymerase chain reaction. Vet Immunol Immunopath. 2008;126:321–331.
29. Hoque, MO, Lee, CC, Cairns, P, et al. Genome-wide genetic characterization of bladder cancer: A comparison of high-density single-nucleotide polymorphism arrays and PCR-based microsatellite analysis. Cancer Res. 2003;63:2216–2222.
30. Heller, MJ. DNA microarray technology: devices, systems, and applications. Annu Rev Biomed Eng. 2002;4:129–153.
31. Gallagher, RE, Yeap, BY, Bi, W, et al. Quantitative real-time RT-PCR analysis of PML-RAR alpha mRNA in acute promyelocytic leukemia: Assessment of prognostic significance in adult patients from intergroup protocol 0129. Blood. 2003;101:2521–2528.
32. Schwarz, JK, Payton, JE, Rashmi, R, et al. Pathway-specific analysis of gene expression data identifies the PI3K/Akt pathway as a novel therapeutic target in cervical cancer. Clin Canc Res. 2012;18(5):1464–1471.
33. Alizadeh, AA, Eisen, MB, Davis, RE, et al. Distinct types of diffuse large B-cell lymphoma identified by gene expression profiling. Nature. 2000;403:503–511.
34. Dave, SS, Wright, G, Tan, B, et al. Prediction of survival in follicular lymphoma based on molecular features of tumor-infiltrating immune cells. N Engl J Med. 2004;351:2159–2169.
35. Rimsza, LM, Roberts, RA, Miller, TP, et al. Loss of MHC class II gene and protein expression in diffuse large B-cell lymphoma is related to decreased tumor immunosurveillance and poor patient survival regardless of other prognostic factors: A follow-up study from the Leukemia and Lymphoma Molecular Profiling Project. Blood. 2004;103:4251–4258.
36. Lenz, G, Wright, G, Dave, SS, et al. Stromal gene signatures in large-B-cell lymphomas. N Engl J Med. 2008;359:2313–2323.
37. Tamburini, BA, Phang, TL, Fosmire, SP, et al. Gene expression profiling identifies inflammation and angiogenesis as distinguishing features of canine hemangiosarcoma. BMC Cancer. 2010;10:619.
38. Tamburini, BA, Trapp, S, Phang, TL, et al. Gene expression profiles of sporadic canine hemangiosarcoma are uniquely associated with breed. PLoS One. 2009;4:e5549.
39. Starkey, MP, Murphy, S. Using lymph node fine needle aspirates for gene expression profiling of canine lymphoma. Vet Comp Oncol. 2010;8:56–71.
40. Scott, MC, Sarver, AL, Gavin, KJ, et al. Molecular subtypes of osteosarcoma identified by reducing tumor heterogeneity through an interspecies comparative approach. Bone. 2011;49:356.
41. Paoloni, M, Davis, S, Lana, S, et al. Canine tumor cross-species genomics uncovers targets linked to osteosarcoma progression. BMC Genomics. 2009;10:625.
42. Masood, S, Bui, MM. Prognostic and predictive value of HER2/neu oncogene in breast cancer. Microsc Res Tech. 2002;59:102–108.
43. Jaffe, ES. The 2008 WHO classification of lymphomas: implications for clinical practice and translational research. Hematology Am Soc Hematol Educ Program. 2009:523–531.
44. Valli, VE, San Myint, M, Barthel, A, et al. Classification of canine malignant lymphomas according to the World Health Organization criteria. Vet Path. 2011;48:198–211.
45. Hsi, ED. The leukemias of mature lymphocytes. Hematol Oncol Clin North Am. 2009;23:843–871.
46. Rao, S, Lana, S, Eickhoff, J, et al. Class II major histocompatibility complex expression and cell size independently predict survival in canine b-cell lymphoma. J Vet Int Med. 2011;25:1097–1105.
47. Williams, MJ, Avery, AC, Lana, SE, et al. Canine lymphoproliferative disease characterized by lymphocytosis: Immunophenotypic markers of prognosis. J Vet Int Med. 2008;22:596–601.
48. Comazzi, S, Gelain, ME, Martini, V, et al. Immunophenotype predicts survival time in dogs with chronic lymphocytic leukemia. J Vet Int Med. 2011;25:100–106.
49. Ponce, F, Magnol, JP, Ledieu, D, et al. Prognostic significance of morphological subtypes in canine malignant lymphomas during chemotherapy. Vet J. 2004;167:158–166.
50. Flood-Knapik, KE, Durham, AC, Gregor, TP, et al. Clinical, histopathological and immunohistochemical characterization of canine indolent lymphoma. Vet Comp Onc. 2012. [epub 2–2–12].
51. Cristea, IM, Gaskell, SJ, Whetton, AD. Proteomics techniques and their application to hematology. Blood. 2004;103:3624–3634.
52. Prenni, JE, Avery, AC, Olver, CS. Proteomics: a review and an example using the reticulocyte membrane proteome. Vet Clin Path. 2007;36:13–24.
53. Petricoin, EF, Ardekani, A, Hitt, B, et al. Use of proteomic patterns in serum to identify ovarian cancer. Lancet. 2002;359:572–577.
54. Baggerly, KA, Morris, JS, Coombes, KR. Reproducibility of SELDI-TOF protein patterns in serum: comparing datasets from different experiments. Bioinformatics. 2004;20:777–785.
55. Klose, P, Weise, C, Bondzio, A, et al. Is there a malignant progression associated with a linear change in protein expression levels from normal canine mammary gland to metastatic mammary tumors? J Proteome Res. 2011;10:4405–4415.