17 THE CXR: ITS IMPACT ON CLINICAL DECISION MAKING
“Every diagnostic test causes additional cost if not additional risk. The cost and risk are justified if the test result is likely to change what is done for the patient. This includes a diagnostic test that does not alter therapy but provides important prognostic information to the patient, or to parents, or to the physician”1.
In Part A the emphasis has been placed on the core knowledge—i.e. the basic principles that assist a physician to accurately and confidently assess a chest radiograph. In Part B we now turn to the practical use of a CXR in assisting with the individual patient’s clinical management.
What impact does the CXR examination have on clinical management? This depends on whether or not the individual physician applies an informed evaluation of the CXR. This is not just shadow gazing. Informed evaluation requires the application of five important rules.
RULE 1—CLINICAL DETAILS ARE PIVOTAL
Accurate interpretation of the CXR appearances always involves correlation with the findings obtained from the clinical history and physical examination. The CXR shadows should never be considered in isolation.
RULE 2—ALWAYS ASK THE CXR A QUESTION
“What precise question do I want this CXR to answer?”. The query will direct the analysis of the CXR to the specific clinical problem.
Example: this young man has acute chest pain. I think that a pneumothorax is likely. The question—is a pneumothorax, obvious or subtle, present? Formulating this query will lead to careful examination of the lung apex (p. 96).
RULE 3—RECOGNISE SOME IMPERFECTIONS
The CXR is a very useful but nevertheless imperfect test. It is good at providing information on some pathologies (e.g. is there pneumonia?) and poor with others (e.g. is there a pulmonary embolus?). Furthermore, a lung shadow merely represents a radiographic density. It does not provide the precise anatomical detail of CT nor the cellular diagnosis of histopathology.
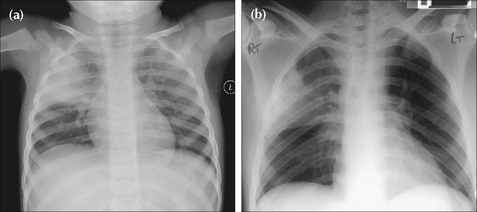
Figure 17.1 Precise clinical details are crucial for accurate analysis. Compare the CXRs of patients (a) and (b). (a) presents with a cough, fever and green sputum. An acute illness. The lung opacity represents a lobar pneumonia. (b) presents with weight loss and haemoptysis. The CXR shows similar lung shadowing to (a). However, given the clinical history, a simple lobar pneumonia is unlikely. The illness is not acute. The eventual diagnosis…bronchioloalveolar cell carcinoma of the lung.
RULE 4—A NORMAL CXR CAN BE VERY USEFUL2
It is tempting to think of the CXR as mainly a test for making diagnoses. In clinical practice a normal (i.e. negative) CXR is more common than an abnormal CXR. This does not mean that performing the CXR was a waste of time. In fact, a normal CXR can be extremely useful.
 It can provide reassurance that a particularly serious condition is not present, or highly unlikely. In other words, a normal CXR may modify the pre-test probability of a particular disease so that the post-test probability (Rule 5) is so low that further investigation is unnecessary.
Example: haemoptysis—is it due to lung cancer? A normal CXR examination (in this instance, frontal and lateral projections) is very reassuring to both the physician and to the patient.
RULE 5—CARRY OUT PROBABILITY ASSESSMENTS3-21
“Diagnostic tests should be selected…in a way that allows them to influence the clinician’s estimate of pre-test disease probability. This estimate is the major factor in determining whether to withhold treatment, order more tests, or treat without subjecting the patient to the risks of further testing”4.
A probability assessment is valuable in enabling the physician to consider how useful a CXR will be in confirming or excluding a particular diagnosis.
PRE-TEST AND POST-TEST PROBABILITY
The physician will have in mind how likely it is that a particular diagnosis is present in the individual patient (i.e. the pre-test probability). The pre-test probability assessment will determine which diagnostic test the physician will then select. The likelihood that the disease is present is subsequently modified by the result of the test (i.e. a post-test probability is generated). These assessments help the physician to plan further management. This includes the option of deciding not to request any further tests. Thus:
It is a useful exercise for the physician requesting a CXR to note her pre- and post-test probability estimates of the disease being present both before and after a CXR. This is useful because probability assessments will:
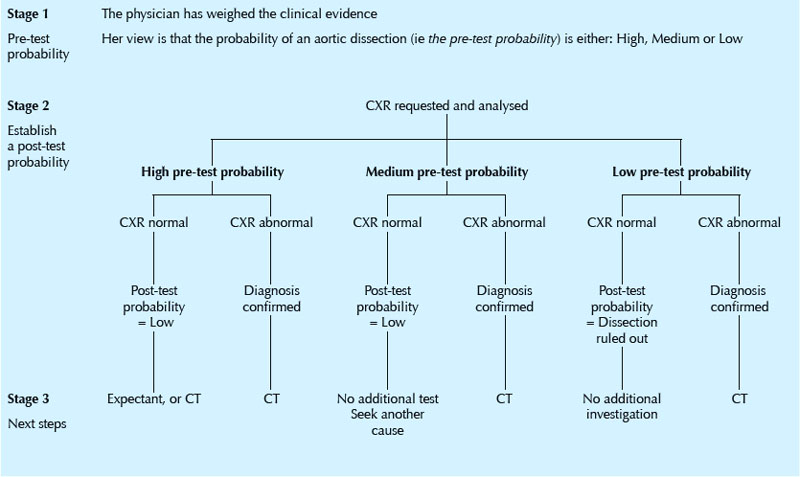
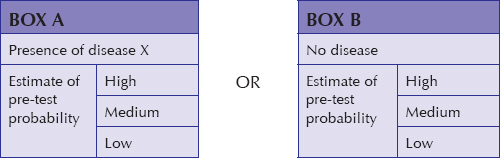
Application of a pre-test probability assessment requires an understanding of the reliability of the CXR to diagnose or exclude the particular pathology in question (i.e. by knowing the positive and negative predictive values). For those of us who do not like getting into statistics and numbers when making these probability assessments it is both practical and helpful to utilise a simple estimate of pre- and post-test probability as being either high, medium or low (see: Box A and Box B). For example: chest pain—rule out aortic dissection (Table 17.1).
APPENDIX
Sometimes the terms used in discussions on the accuracy and selection of a diagnostic test (e.g. the CXR) can be confusing or poorly understood. This appendix provides some useful definitions and explanations.
DEFINITIONS AND EXPLANATIONS3-26
| Bayes’ Theorem | The predictive value of any particular test depends not only on the sensitivity and specificity of the test but also on the prevalence of the disease in the population being tested8. |
| Clinical prediction rules | An assembly of symptoms and signs from a large number of patients with a specific disease. Points are assigned to the various symptoms and signs and the pre-test probability of disease is determined by adding up the points4. These rules (there are relatively few of them) permit a rough estimation of pre-test disease probability. NB: caution has been advised in too readily accepting an assumed consistency in pre-test probability estimates of some diseases, because there can be a large variation in pre-test estimations between clinicians18. |
| Diagnostic accuracy | Accuracy measures how close to a true or accepted value a measurement lies. The accuracy (i.e. the performance) of a diagnostic test can be expressed in several different ways. These include: sensitivity and specificity; likelihood ratios; predictive values; the area under a receiver operator characteristic curve. |
| Gold standard | A method, procedure, or measurement that is widely accepted as being the best available5. |
| Predictive value of a test |
The probability that a person with a positive test is a true positive (i.e. does have the disease), or that a person with a negative test truly does not have the disease. The predictive value of a test is determined by the sensitivity and specificity of the test, and by the prevalence of the condition for which the test is used5.
The negative predictive value is the proportion of persons with a negative test who do not have the condition. In other words, given that a patient tests negative, what is the probability that she truly does not have the disease? This measure is critically dependent on the prevalence of the disease in the given population at a given time4,6,9. The positive predictive value is the proportion of persons with a positive test who do have the condition. In other words, given that a patient tests positive, what is the probability that he truly has the disease? This measure is critically dependent on the prevalence of the disease in the given population6,9. |
| Pre-test probability | The probability of disease (i.e. the target disorder) before performing a diagnostic test5. Statisticians commonly express pre-test probability4,10 using numbers, i.e. a point on a continuum ranging from absent (0) to present (1). In practice, pre-test probability does not have to be expressed numerically. It can be described in terms of probability thresholds11. Thus the pre-test probability may usefully be expressed using the terms High, Medium and Low. |
| Post-test probability | The probability of disease (i.e. the target disorder) updated by the results of a diagnostic test5. |
| Prevalence | The proportion of persons with a particular disease within a given population at a given time5. |
| Sensitivity of a test | The probability of a positive test in those with the disease: i.e. the frequency of true positives. A sensitive test has few false negatives6,7. |
| Specificity of a test | The probability of a negative test in those without the disease: i.e. the frequency of true negatives. A specific test has few false positives6,7. |
| Test | Any method (laboratory; imaging; other) for obtaining additional information on a patient’s health status. |
| AND | |
| Likelihood Ratio | An index developed in order to indicate how reliably a diagnostic test detects a particular disease. Some statisticians prefer to use likelihood ratios6 rather than positive and negative predictive values, because likelihood ratios are independent of disease prevalence6. Likelihood ratios have become incorporated into evidence-based medicine. The objective is to encourage physicians to make more accurate and cost-effective clinical management decisions1,13,14,15. |
| Threshold Model | A clinical decision-making yardstick which utilises two thresholds1,4,12. Threshold 1 is a no-test threshold because the probability of a disease is so low that the value of not treating the patient is the same as that of performing the test. Threshold 2 is also a no-test threshold because the probability of the disease is so high that the value of performing the test is the same as that of administering treatment. If the probability of disease falls within either of these two thresholds (i.e. below Threshold 1 or above Threshold 2) then there is no point in carrying out the test. Thus the decision not to treat, to carry out the test, or to treat is determined by the pre-test disease probability and the two thresholds1,4. When the pre-test disease probability lies between the two thresholds then the test result could lead to a different (post-test) probability of disease that could alter the decision to treat, not to treat, or to instigate an additional test…thus, the test should be carried out. |
1. Moyer VA, Kennedy KA. Understanding and using diagnostic tests. Clin Perinatol. 2003;30:189-204.
2. Gorry GA, Pauker SG, Schwartz WB. The diagnostic importance of the Normal Finding. New Engl J Med. 1978;298:486-489.
3. Mishriki YY. When are liver tests warranted? Postgrad Med. 2004;116:8.
4. Scherokman B. Selecting and Interpreting Diagnostic Tests. xnet.kp.org/permanentejournal/fall97pj/tests.html, 1997.
5. The EBM Glossary. www.cebm.utoronto.ca/glossary, 2004.
6. Attia J. Moving beyond sensitivity and specificity: using likelihood ratios to help interpret diagnostic tests. Aust Prescr. 2003;26:111-113.
7. Fletcher RH, Fletcher SW, Wagner EH. Clinical Epidemiology: The Essentials, 3rd ed., Philadelphia, PA: Williams and Wilkins; 1996:64-67.
8. Fleming J, Hersh J. Pulmonary Embolism: Diagnostic Evaluation. Am J Clin Med. 2004 www.aapsga.org/ajcm/2004/winter/article02.html.
9. Guggenmoos-Holzmann I, van Houwelingen HC. The (in)validity of sensitivity and specificity. Stat Med. 2000;19:1783-1792.
10. Kassirer JP. Our stubborn quest for diagnostic certainty: a cause of excessive testing. N Engl J Med. 1989;320:1489-1491.
11. www.evidencebasedradiology.net.
12. Pauker SG, Kassirer JP. The threshold approach to clinical decision making. N. Engl J Med. 1980;302:1109-1117.
13. Sonis J. How to use and interpret interval likelihood ratios. Fam Med. 1999;31:432-437.
14. Sackett DL, Haynes RB, Guyatt GH, Tugwell P. Clinical Epidemiology: A Basic Science for Clinical Medicine, 2nd ed. Philadelphia, PA: Lippincott, Williams & Wilkins, 1991.
15. Ebell MH. Evidence-Based Diagnosis: A Handbook of Clinical Prediction Rules. New York: Springer, 2001.
16. Wells PS, Anderson DR, Bormanis J, et al. Value of assessment of pretest probability of deep vein thrombosis in clinical management. Lancet. 1997;350:1795-1798.
17. University of Washington Department of Medicine. Advanced Physical Diagnosis, Learning and Teaching at the Bedside: Epidemiology Glossary. depts.washington.edu/physdx/eglossary.html, 2007.
18. Phelps MA, Levitt MA. Pretest Probability Estimates: a pitfall to the clinical utility of evidence-based medicine? Acad Emerg Med. 2004;11:692-694.
19. Altman DG, Bland JM. Statistics notes. Diagnostic tests (2): predictive values. BMJ. 1994;309:102.
20. Altman DG, Bland JM. Diagnostic tests (1): sensitivity and specificity. BMJ. 1994;308:1552.
21. Norcliffe PJ, Davies CWH. The validity of pre-test probability scoring to predict PE in routine practice. Thrombus. 2006;10:1. 3–5.
22. Fletcher RH. Interpretation of diagnostic tests. Indian J Pediatr. 2000;67:49-53.
23. Camp BW. What the clinician really needs to know: questioning the clinical usefulness of sensitivity and specificity in studies of screening tests. J Dev Behav Pediatr. 2006;27:226-230.
24. Coulthard MG. Quantifying how tests reduce diagnostic uncertainty. Arch Dis Child. 2007;92:404-408.
25. Akobeng AK. Understanding diagnostic tests (1): sensitivity, specificity and predictive values. Acta Paediatr. 2007;96:338-341.
26. Akobeng AK. Understanding diagnostic tests (2): likelihood ratios, pre- and post-test probabilities and their use in clinical practice. Acta Paediatr. 2007;96:487-491.