Chapter 440 Development of the Hematopoietic System
Hematopoiesis in the Human Embryo and Fetus
Hematopoiesis is the process by which the cellular elements of blood are formed. In the developing human embryo and fetus, hematopoiesis is conceptually divided into 3 anatomic stages: mesoblastic, hepatic, and myeloid. Mesoblastic hematopoiesis occurs in extraembryonic structures, principally in the yolk sac, and begins between the 10th and 14th days of gestation. By 6-8 wk of gestation the liver replaces the yolk sac as the primary site of blood cell production, and during this time the placenta also contributes as a hematopoietic site. By 10-12 wk extraembryonic hematopoiesis has essentially ceased. Hepatic hematopoiesis occurs through the remainder of gestation, although hepatic production diminishes during the 2nd trimester while bone marrow (myeloid) hematopoiesis increases. The liver remains the predominant erythropoietic organ (few if any neutrophils are produced in the human fetal liver) through 20-24 wk of gestation.
Each hematopoietic organ houses distinct populations of cells. At 18-20 wk, the fetal liver is predominantly an erythropoietic organ, and the marrow produces both erythrocytes and neutrophils. The types of leukocytes present in the fetal liver and marrow differ with gestation. Macrophages precede neutrophils in the marrow, and the ratio of macrophages to neutrophils decreases as gestation progresses. Regardless of gestational age or anatomic location, production of all hematopoietic tissues begins with pluripotent stem cells capable of both self-renewal and clonal maturation into all blood cell lineages. Progenitor cells differentiate under the influence of hematopoietic growth factors (Table 440-1). Fetal hematopoietic growth factor production is independent of maternal growth factor production (Fig. 440-1).
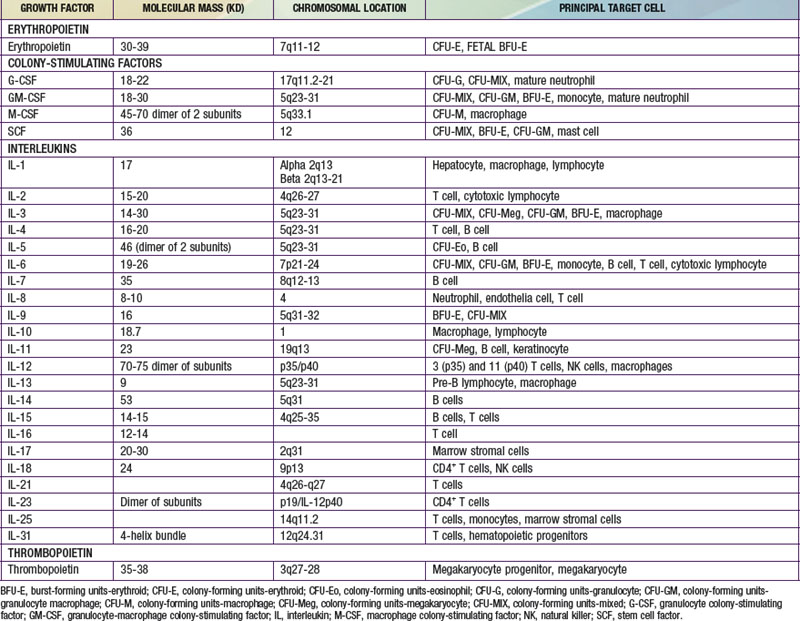
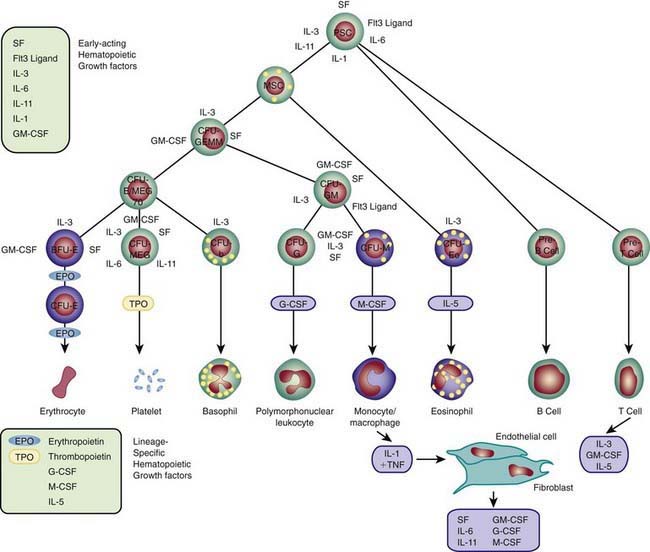
Figure 440-1 Major cytokine sources and actions to promote hematopoiesis. Cells of the bone marrow microenvironment, such as macrophages, endothelial cells, and reticular fibroblasts, produce macrophage colony-stimulating factor (M-CSF), granulocyte-macrophage colony-stimulating factor (GM-CSF), and granulocyte colony-stimulating factor (G-CSF) after stimulation. These cytokines and others listed in the text have overlapping interactions during hematopoietic differentiation, as indicated; for all lineages, optimal development requires a combination of early- and late-acting factors. BFU, burst forming unit; CFU, colony forming unit; IL, interleukin; MSC, myeloid stem cells; PSC, pluripotent stem cell; TNF, tumor necrosis factor.
(From Sieff CA, Nathan DG, Clark SC: The anatomy and physiology of hematopoiesis. In Orkin SH, Nathan DG, editors: Hematology of infancy and childhood, ed 5, Philadelphia, 1998, WB Saunders, p 168.)
Erythrocytes in the fetus are larger than in adults, and at 22-23 wk gestation the mean corpuscular volume can be as high as 135 fL (Fig. 440-2, upper panel). Similarly the mean corpuscular hemoglobin is very high at 22-23 wk and falls relatively linearly with advancing gestation (see Fig. 440-2, lower panel). In contrast, the mean corpuscular hemoglobin concentration is constant throughout gestation at 34 ± 1 g/fL. Although the size and quantity of hemoglobin in erythrocytes diminish during gestation, the hematocrit and blood hemoglobin concentration gradually increase (Fig. 440-3).
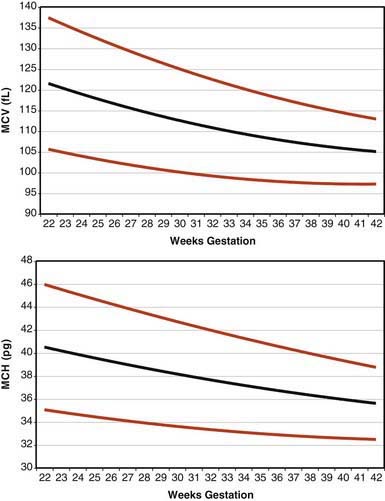
Figure 440-2 Erythrocyte mean corpuscular volume (MCV) and mean corpuscular hemoglobin (MCH) from 22 wk of gestation through term. The lines represent the 5th percentile, the mean, and the 95th percentile reference range.
(From Christensen RD, Jopling J, Henry E, et al: The erythrocyte indices of neonates, defined using data from over 12,000 patients in a multihospital healthcare system, J Perinatol 28:24–28, 2008.)
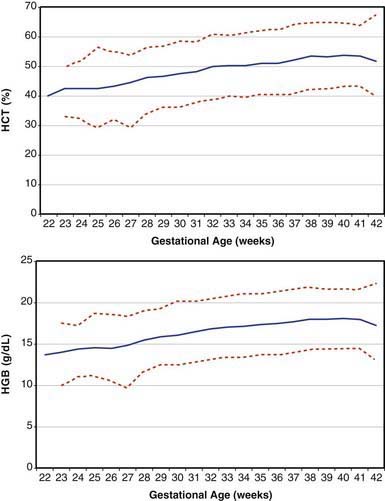
Figure 440-3 Fetal hematocrit (HCT) and blood hemoglobin concentration (HGB) from 22 wk of gestation through term. The lines represent the 5th percentile, the mean, and the 95th percentile reference range.
(From Jopling J, Henry E, Wiedmeier SE, et al: Reference ranges for hematocrit and blood hemoglobin concentration during the neonatal period: data from a multihospital healthcare system, Pediatr 123:e333–e337, 2009.)
Concentrations of platelets in the blood increase gradually between 22 and 40 wk gestation (Fig. 440-4), but the platelet size, assessed by mean platelet volume, remains constant at 8 ± 1 fL. No differences are observed between males and females in fetal and neonatal reference ranges for erythrocyte indices, hematocrit, hemoglobin, platelet counts, or mean platelet volume measurements.
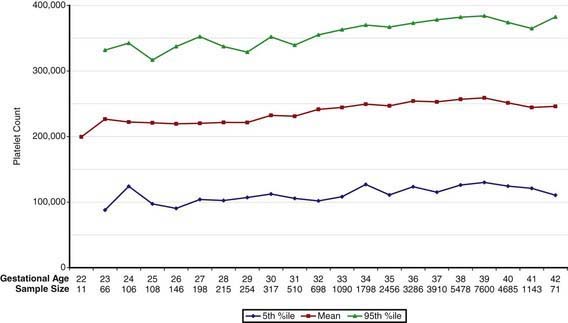
Figure 440-4 Fetal platelet count from 22 wk of gestation through term. The lines represent the 5th percentile, the mean, and the 95th percentile reference range.
(From Wiedmeier SE, Henry E, Sola-Visner MC, et al: Platelet reference ranges for neonates, defined using data from over 47,000 patients in a multihospital healthcare system, J Perinatol 29:130–136, 2009.)
Fetal Granulocytopoiesis
Neutrophils are first observed in the human fetus about 5 wk after conception as small clusters of cells around the aorta. The fetal bone marrow space begins to develop around the 8th wk after conception, and from 8-10 wk the marrow space enlarges but no neutrophils appear there until 10.5 wk. From 14 wk through term the most common granulocytic cell type in the fetal bone marrow space is the neutrophil. Neutrophils and macrophages originate from a common progenitor cell, but macrophages appear before neutrophils in the fetus, first in the yolk sac, liver, lung, and brain, all before the bone marrow cavity is formed.
Granulocyte colony-stimulating factor (G-CSF) and macrophage colony-stimulating factor (M-CSF) are expressed in developing fetal bone as early as 6 wk post conception, and both are expressed in the fetal liver as early as 8 wk. Granulocyte-macrophage colony-stimulating factor (GM-CSF) and stem cell factor (SCF) also are distributed widely in human fetal tissues. However, no changes in expression of any of these factors, or of their specific receptors, appear to be the signal for fetal production of neutrophils or macrophages, because those signals have not yet been identified.
Fetal blood contains few neutrophils until the 3rd trimester. At 20 wk of gestation the blood neutrophil count is 0-500/mm3. Although mature neutrophils are scarce, progenitor cells with the capacity to generate neutrophil clones are abundant in fetal blood. When cultured in vitro in the presence of recombinant G-CSF, they mature into large colonies of neutrophils. The physiologic role of G-CSF includes upregulating neutrophil production, and this function is present in the fetus and neonate as well as adults. Thus, the low quantities of circulating neutrophils in the 2nd-trimester human fetus may be due, in part, to low production of G-CSF. Monocytes isolated from the blood of adults produce G-CSF when stimulated with a variety of inflammatory mediators such as bacterial lipopolysaccharide (LPS) or interleukin-1 (IL-1). In contrast, monocytes isolated from the blood or organs of fetuses up to 24 wk of gestation generate only small quantities of G-CSF protein and mRNA after LPS or IL-1 stimulation. Despite the low quantities of G-CSF, G-CSF receptors on the surface of neutrophils of newborn infants are equal in number and affinity to those on adult neutrophils.
In the fetus, actions of the granulocytopoietic factors (G-CSF, M-CSF, GM-CSF, and SCF) are not limited to hematopoiesis. Receptors for each of these factors are located in areas of the fetal central nervous system and gastrointestinal tract, where their patterns of expression change with development. Important developmental roles exist for these factors beyond hematopoiesis.
Fetal Thrombopoiesis
Platelet production occurs from 2 pools of cells: megakaryocyte progenitors and megakaryocytes. Megakaryocyte progenitors are categorized as burst-forming unit-megakaryocytes (BFU-MK), which are primitive megakaryocyte progenitors, and colony-forming unit-megakaryocytes (CFU-MK), which are more differentiated. BFU-MK produces large multifocal colonies containing ≥50 megakaryocytes, whereas CFU-MK generate smaller (3-50 cells/colony) unifocal colonies. The colonies generated by BFU-MK of fetal origin contain significantly more megakaryocytes than do those of adult origin and on that basis are thought to represent somewhat more primitive cells. Megakaryocytes are identified by their morphologic characteristics as they undergo endoreduplication, which results in large cells with polyploid nuclei. Unlike megakaryocyte progenitors, megakaryocytes do not have the capacity to generate clones. Rather, they undergo maturation, progressing from small mononuclear cells to large polyploid cells. The modal megakaryocyte ploidy (the number of sets of complete chromosomes) in normal adult marrow is 16 N. In the fetus and neonate, ploidy is lower and megakaryocyte size is smaller. However, umbilical cord blood has a higher concentration of megakaryocytes than adult blood. Large megakaryocytes generate more platelets than do small megakaryocytes; thus, it is assumed that megakaryocytes of neonates produce fewer platelets than do their adult counterparts.
The processes of platelet production and release from megakaryocytes are not well understood. It has been speculated that small buds, proplatelets, are formed on megakaryocytes and that these are released from the marrow as platelets. An alternative possibility is that platelets are principally released from megakaryocytes in the lungs as a consequence of shear forces.
Thrombopoietin (TPO) is the physiologic regulator of platelet production and acts as a stimulator of all stages of megakaryocyte growth and development (see Table 440-1). The gene encoding TPO is located on the long arm of chromosome 3. TPO-mRNA is expressed primarily in liver and kidney and, to a lesser extent, in marrow stroma. TPO is a primary, but not exclusive, regulator of platelet production and stimulates the proliferation and survival not only of megakaryotic progenitors but also of erythroid, myeloid, and multipotent progenitors. Recombinant TPO (rTPO) supports the growth of megakaryocytic colonies of neonates and children, and progenitors of preterm neonates are more sensitive to rTPO than are progenitors of term neonates.
Fetal Erythropoiesis
Similar to hematopoietic production of other cell lines, fetal erythropoiesis is regulated by growth factors produced by the fetus, not by the mother. Erythropoietin (EPO) does not cross the human placenta. Stimulating maternal EPO production does not stimulate of fetal erythropoiesis, and suppressing maternal erythropoiesis by hypertransfusion does not suppress fetal erythropoiesis.
It is unclear to what extent the mechanisms regulating erythropoiesis in adults are operative in the fetus. Of all the factors known to be involved in stimulating erythropoiesis, none plays a more central regulatory role than does EPO, a 30-39 kd glycoprotein that binds to specific receptors on the surface of erythroid precursors and stimulates their differentiation and clonal maturation into mature erythrocytes. Regulating EPO gene expression involves an oxygen-sensing mechanism. EPO mRNA production is regulated by cis-acting elements in the promoter and 3′ enhancer regions that are responsive to hypoxia. Two factors, hepatic nuclear factor 4 (HNF-4) and hypoxia inducible factor (HIF-1), exhibit transcriptional activation for EPO and other hypoxia-inducible genes. HNF-4 binds to the EPO promoter and enhancer regions of the gene. HIF-1 is a basic helix-loop-helix transcription factor composed of HIF-1α and HIF-1β subunits that bind to cis-acting hypoxia-response elements and induce EPO transcription. HIF-1 is expressed in many cells and is involved in upregulating a variety of oxygen-regulated proteins, including vascular endothelial growth factor (VEGF). HIF-1α appears to be constitutively expressed and rapidly degraded under normoxic conditions. RNA stability depends on the ubiquitin proteasome degradation system; inhibition of this system leads to increased HIF-1 and increased EPO, even under normoxic conditions.
EPO is produced in fetal liver during the 1st and 2nd trimesters, principally by cells of monocyte and macrophage origin. After birth, the anatomic site of EPO production shifts to the kidney. The specific stimulus for this shift is unknown but might involve the increase in arterial oxygen tension that occurs at birth. Epigenetic modification of gene expression might also play a role, because it appears that renal and hepatic EPO genes are methylated to different degrees. Although EPO mRNA and protein can be found in the human fetal kidney, it is not known whether this production is biologically relevant. However, it appears that renal production of EPO is not essential for normal fetal erythropoiesis, as evidenced by the normal serum EPO concentrations and normal hematocrits of anephric fetuses.
Hemoglobins in the Fetus and Neonate
The evolutionary development of oxygen-carrying proteins, the hemoglobins, increased the ability of blood to transport oxygen. The combination of oxygen with hemoglobin and its dissociation from it are accomplished without expenditure of metabolic energy.
Hemoglobin is a complex protein consisting of iron-containing heme groups and the protein moiety globin. A dynamic interaction between heme and globin gives hemoglobin its unique properties in the reversible transport of oxygen. The hemoglobin molecule is a tetramer made up of 2 pairs of polypeptide chains, with each chain having a heme group attached. The polypeptide chains of various hemoglobins are of chemically different types. The major hemoglobin of a normal adult (HbA) is made up of 1 pair of alpha (α) and 1 pair of beta (β) polypeptide chains, represented as α2β2. The major hemoglobin in the fetus (HbF), which is made up of 2 alpha and 2 gamma globin chains, is represented by α2γ2.
The various globin chains differ in both the number and sequence of amino acids, and the synthesis of these chains is directed by separate genes (Fig. 440-5). Two sets of genes for the α chains are located on human chromosome 16. Two pairs of alleles provide the genetic information for the structure of the α chain. The β, γ, and δ genes are closely linked on chromosome 11.
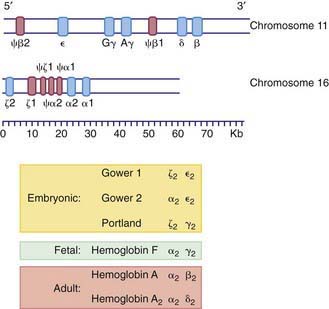
Figure 440-5 Organization of the globin genes. The bottom line reflects the scale in kilobases. The upper segment represents the beta-like globin genes on chromosome 11, and the lower segment represents the alpha-like genes on chromosome 16. Regions of the gene that code for primary globin proteins are shown as blue segments, and regions that code for pseudogenes (“ψ,” nonexpressed remnants) are shown as pink segments. The composition of embryonic, fetal, and adult hemoglobins is listed.
Within the red blood cell (RBC) mass of an embryo, fetus, child, and adult, 6 different hemoglobins may normally be detected (Fig. 440-6): the embryonic hemoglobins, Gower-1, Gower-2, and Portland; the fetal hemoglobin, HbF; and the adult hemoglobins, HbA and HbA2. The electrophoretic mobilities of hemoglobins vary with their chemical structures. The time of appearance and quantitative relationships among the hemoglobins are determined by complex developmental processes.
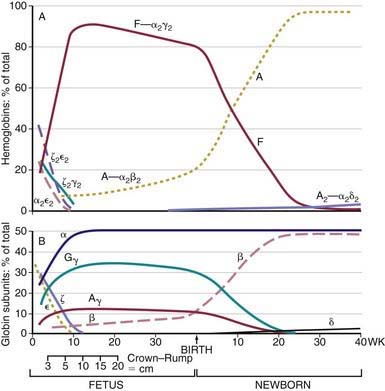
Figure 440-6 Changes in hemoglobin tetramers (A) and in globin subunits (B) during human development from embryo to early infancy.
(From Polin RA, Fox WW: Fetal and neonatal physiology, ed 2, Philadelphia, 1998, WB Saunders, p 1769.)
Embryonic Hemoglobins
The blood of early human embryos contains 2 slowly migrating hemoglobins, Gower-1 and Gower-2, and Hb Portland, which has HbF-like mobility. The zeta (ζ) chains of Hb Portland and Hb Gower-1 are structurally quite similar to α chains. Both Gower hemoglobins contain a unique type of polypeptide chain, the epsilon (ε) chain. Hb Gower-1 has the structure ζ2ε2, and Hb Gower-2 has the structure α2ε2. Hb Portland has the structure ζ2γ2. In embryos of 4-8 wk of gestation, the Gower hemoglobins predominate, but by the 3rd mo they have disappeared.
Fetal Hemoglobin
HbF contains γ polypeptide chains in place of the β chains of HbA. Its resistance to denaturation by strong alkali is the basis for determining the presence of fetal RBCs in the maternal circulation (the Kleihauer-Betke test). After the 8th wk, HbF is the predominant hemoglobin; at 24 wk of gestation it constitutes 90% of the total hemoglobin. During the 3rd trimester, a gradual decline occurs, so that at birth HbF averages 70% of the total hemoglobin. Synthesis of HbF decreases rapidly postnatally (Fig. 440-7), and by 6-12 mo of age only a trace is present.
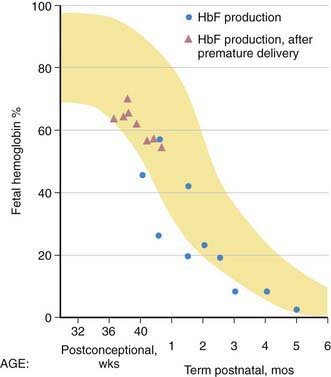
Figure 440-7 Pre- and postnatal changes in the percentage of total hemoglobin represented by fetal hemoglobin (HbF) (yellow). The triangles represent postnatal production by reticulocytes in premature infants, and the circles represent cord blood and postnatal reticulocyte production in term infants.
(From Brown MS: Fetal and neonatal erythropoiesis. In Stockman JA, Pochedly C, editors: Developmental and neonatal hematology, New York, 1988, Raven Press.)
Adult Hemoglobins
By the 24th wk of gestation, HbA constitutes 5-10% of total hemoglobin. A steady increase in HbA continues throughout gestation, reaching a level of 30% of total hemoglobin at term. By 6-12 mo of age, the normal HbA pattern appears. The minor HbA component HbA2 contains delta (δ) chains and has the structure α2δ2. HbA2 is seen only when significant amounts of HbA are also present. At birth, <1% of HbA2 is seen, but by 12 mo of age the normal level of 2.0-3.4% is attained. Throughout life, the normal ratio of HbA to HbA2 is about 30 : 1.
Normal Relationships Among the Hemoglobins
During fetal life and early childhood, the rates of synthesis of γ and β chains and the amounts of HbA and HbF are inversely related. This relationship has been attributed to a “switch mechanism” similar to genetic regulatory mechanisms in bacteria, but the genetic, biologic, and developmental processes that direct a switchover from predominantly γ-chain synthesis in utero to predominantly β-chain synthesis after birth are unclear. It is not certain whether the mechanisms involve selective genetic inhibition or facilitation. The increase in the α1/α2 globin ratio occurring after 36 wk of gestation corresponds with a rapid decline in γ-globin synthesis, suggesting that these changes could be regulated by a coordinated molecular mechanism. Differential selection and amplified production of RBC precursors derived from BFU-E cells result in considerable HbF production. This may be the basis for the increased levels of HbF that occur in many hypoproliferative or hemolytic anemias. Alternative explanations involve more basic epigenetic regulation through processes such as methylation and deacetylation in the DNA sequences that flank the hemoglobin gene complexes.
Alterations of the Hemoglobins by Disease
Because hemoglobins containing ε chains normally are present only very early in intrauterine life, in the past they were largely of theoretical interest. In recent years, interest has been renewed by the growing method of isolation of free fetal DNA in the maternal circulation, allowing noninvasive fetal diagnosis of a variety of genetic traits, such as RhD positivity in the fetus of an RhD negative mother. In addition, small amounts of the Gower hemoglobins have been detectable in a few newborns with trisomy 13. Increased levels of Hb Portland have been found in cord blood of stillborn infants with homozygous α-thalassemia.
HbF levels may be influenced by various factors. Because the HbF level is elevated during the 1st year of life, knowledge of its normal decline is important (see Figs. 440-6 and 440-7). In persons heterozygous for β-thalassemia (β-thalassemia trait), postpartum decrease of HbF is delayed; about 50% of such persons have elevated levels of HbF (>2.0%) in later life. In homozygous thalassemia (Cooley anemia) and in hereditary persistence of HbF, large amounts of HbF characteristically are found. In patients with major β-chain hemoglobinopathies (HbSS, HbSC), HbF usually is increased, particularly during childhood. Preterm infants treated with human recombinant EPO increase HbF production during active erythropoiesis. Moderate elevations of HbF can occur in many diseases accompanied by hematologic stress, such as hemolytic anemias, leukemia, and aplastic anemia, because of a minor population of RBCs that contain increased amounts of HbF. Tetramers of γ chains (γ4 or Hb Barts) or β chains (β4, HbH) may be found in α-thalassemia syndromes.
The normal adult level of HbA2 (2.0-3.4%) is seldom altered. Levels of HbA2 >3.4% are found in most persons with the β-thalassemia trait and in persons with megaloblastic anemias secondary to vitamin B12 and folic acid deficiency. Decreased HbA2 levels are found in persons with iron-deficiency anemia (Chapter 455) and α-thalassemia (Chapter 462).
Red Cell Life Span of the Fetus and Neonate
The differences in physical properties of RBCs derived from term and preterm infants may account, in part, for the decreased life span of neonatal RBCs within the circulation. The average life span for a neonatal RBC is 60-90 days, approximately one half to two thirds that of an adult RBC. When neonatal RBCs are transfused into adults, they exhibit a shortened life span, owing to alterations intrinsic to the neonatal RBC. In contrast, cells transfused from adult donors appear to survive normally in newborns. With increasing degrees of prematurity, remarkably shorter red cell life spans (35-50 days) are found. The shortened red cell life span of the preterm and term neonate may be explained by some of the characteristics specific to newborn cells: a rapid decline in intracellular enzyme activity and adenosine triphosphate (ATP), loss of membrane surface area by internalization of membrane lipids, decreased levels of intracellular carnitine, increased susceptibility of membrane lipids and proteins to peroxidation, and increased mechanical fragility due to increased membrane deformability.
Andrews NC. Genes determining blood cell traits. Nat Genetics. 2009;11:1161-1162.
Bishara N, Ohls RK. Current controversies in the management of the anemia of prematurity. Semin Perinatol. 2009;33:29-34.
Christensen RD, Jopling J, Henry E, Wiedmeier SE. The erythrocyte indices of neonates, defined using data from over 12,000 patients in a multihospital healthcare system. J Perinatol. 2008;28:24-28.
Dame C, Juul S. The switch from fetal to adult erythropoiesis. Clin Perinatol. 2000;27:507-526.
Deutsch VR, Toner A. Megakaryocyte development and platelet production. Br J Haematol. 2006;134:453-466.
Jopling J, Henry E, Wiedmeier SE, et al. Reference ranges for hematocrit and blood hemoglobin concentration during the neonatal period: data from a multihospital healthcare system. Pediatr. 2009;123:e333-e337.
Kaushansky K. Lineage-specific hematopoietic growth factors. N Engl J Med. 2006;354:2034-2045.
Sola-Visner MC, Christensen RD, Hutson AD, et al. Megakaryocyte size and concentration in the bone marrow of thrombocytopenic and nonthrombocytopenic neonates. Pediatr Res. 2007;61:479-484.
Spangrude GJ, Perry SS, Slayton WB. Early stages of hematopoietic differentiation. Ann N Y Acad Sci. 2003;996:186-194.
Vats A, Bielby RC, Tolley NS, et al. Stem cells. Lancet. 2005;366:592-602.
Wiedmeier SE, Henry E, Sola-Visner MC, et al. Platelet reference ranges for neonates, defined using data from over 47,000 patients in a multihospital healthcare system. J Perinatol. 2009;29:130-136.
Yoshimoto M, Yoder MC. Developmental biology: birth of the blood cell. Nature. 2009;457:801-813.