chapter 4 Urinary Tract Imaging
Basic Principles
Imaging plays an indispensable role in the diagnosis and management of urologic diseases. Because many urologic conditions are unable to be assessed by physical examination, conventional radiography has long been critical to the diagnosis of conditions of the kidneys, ureters, and bladder. Ultrasonography revolutionized the diagnosis of prostatic disease. The urologist’s familiarity with ultrasonography led to its widespread use for many conditions in the office and the operating room. The development of axial imaging and the use of intravenous contrast agents have provided detailed anatomic, functional, and physiologic information about urologic conditions. In this chapter we discuss the indications for imaging in urology with an emphasis on the underlying physical principles of the imaging modalities. The strengths and limitations of each modality, as well as the techniques necessary to maximize image quality and minimize the risks and harms to urologic patients, are discussed.
Conventional Radiography
Conventional radiography, though eclipsed by axial imaging for certain indications, remains useful in a variety of urologic conditions. Conventional radiography includes abdominal plain radiography, intravenous excretory urography, retrograde pyelography, loopography, retrograde urethrography, and cystography. Urologists increasingly perform and interpret conventional radiography examinations including fluoroscopic examinations in the office and operating room environments.
Physics
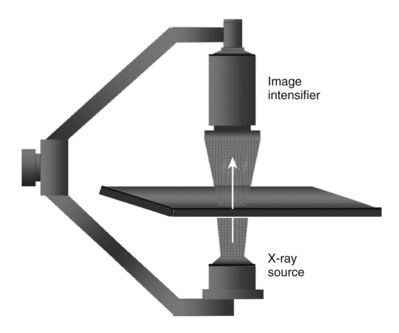
It is imperative that urologists understand the physics of conventional radiography and fluoroscopy, as well as the implications of radiation exposure to the patient and the operator. The underlying physical principles of conventional radiography involve emitting a stream of photons from an x-ray source. These photons travel through the air and strike tissue, imparting energy to that tissue. Some of the photons emerge from the patient with varying amounts of energy attenuation and strike an image recorder such as a film cassette or the input phosphor of an image-intensifier tube, thus producing an image (Fig. 4–1).
Radiation Management in Uroradiology
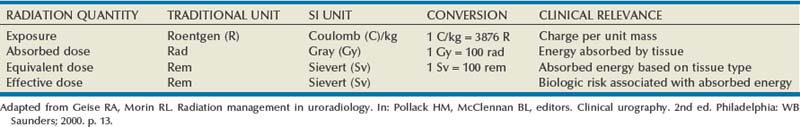
When diagnostic radiation passes through tissue, it creates ion pairs. The resultant charge per unit mass of air is referred to as the radiation exposure. The current unit of radiation exposure is coulombs(C)/kg. Absorbed dose is the energy absorbed from the radiation exposure and is measured in units called gray (Gy). The older unit of absorbed dose was called the rad (1 rad = 100 Gy).
Because different types of radiation have different types of interaction with tissue, a conversion factor is applied to better express the amount of energy absorbed by a given tissue. The application of this conversion factor to the absorbed dose yields the equivalent dose measured in sieverts (Sv). For diagnostic radiographs the conversion factor is 1, so the absorbed dose is the same as the equivalent dose. When discussing the amount of radiation energy absorbed by patients during therapeutic radiation, the dose is given in gray. When discussing exposure to patients or medical personnel due to diagnostic ionizing radiation procedures, the dose is given in sieverts.
The distribution of energy absorption in the human body will be different on the basis of the body part being imaged and various other factors. The most important risk of radiation exposure from diagnostic imaging is the development of cancer. The effective dose is a quantity used to denote the radiation risk (expressed in sieverts) to a population of patients from an imaging study. See Table 4–1 for a description of the relationship between these measures of radiation exposure.
The average person living in the United States is exposed to 1 to 3 mSv of radiation per year from ambient sources such as radon and cosmic rays. The recommended occupational exposure limit to medical personnel is 50 mSv per year (NCRP, 1993). Exposure to the eyes and gonads has a more significant biologic impact than exposure to the extremities, so recommended exposure limits vary according to the body part. However, there is no safe dose of radiation. An effective radiation dose of as little as 10 mSv may result in the development of a malignancy in 1 of 1000 individuals exposed (NRCNA, 2006).
Relative Radiation Levels
The assessment of biologic risk from radiation exposure is complex. By estimating the range of effective doses for various imaging modalities, they can be assigned a relative radiation level (RRL) (Table 4–2).
Table 4–2 Relative Radiation Level Designations along with Common Example Examinations for Each Classification
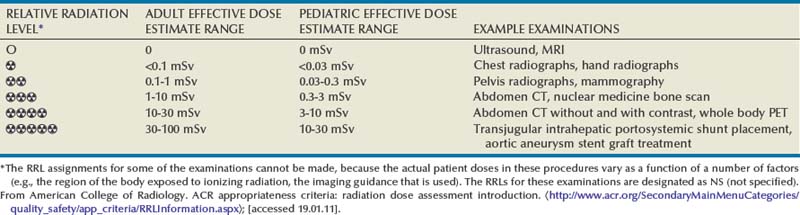
The effective dose from a three-phase computed tomography (CT) scan of the abdomen and pelvis without and with contrast may be as high as 25 to 40 mSv. An often overlooked source of significant radiation exposure is fluoroscopy. Fluoroscopy for 1 minute results in a radiation dose to the skin equivalent to 10 times that of a single radiograph of the same anatomic area (Geise and Morin, 2000).
Radiation Protection
The cumulative dose of radiation to patients increases relatively rapidly with repeated axial imaging studies or procedures guided by fluoroscopy. Certain patient populations such as those with recurrent renal calculus disease or those with a urologic malignancy may be at risk because of repeated exposures to ionizing radiation. Attempts should be made to limit axial imaging studies to the anatomic area of interest and to substitute imaging studies not requiring ionizing radiation when feasible. The cumulative dose of radiation to medical personnel (including physicians) may increase relatively rapidly in circumstances where fluoroscopy is used.
Reduction in radiation exposure to medical personnel is achieved by three major mechanisms: (1) limiting the time of exposure; (2) maximizing distance from the radiation source; and (3) shielding. Radiation dose during fluoroscopy is directly proportional to the time of exposure and to the number of exposures. The exposure time during fluoroscopy should be minimized by using short bursts of fluoroscopy and using the “last image hold” feature of the fluoroscopy unit. Radiation beams diverge with distance and therefore radiation exposure diminishes as the square of the distance from the radiation source. Maintaining the maximum practical distance from an active radiation source significantly decreases exposure to medical personnel. Positioning the image intensifier as close to the patient as feasible substantially reduces scatter radiation. Standard aprons and thyroid shields provide significant shielding for medical personnel and should be worn by all personnel involved in the use of fluoroscopy.
Key Points
Conventional Radiography/Radiation Management in Uroradiology
Contrast Media
The urologist ordering a radiographic evaluation on a patient must consider the risks and benefits associated with a contrast-enhanced imaging study, as well as alternative imaging modalities that could provide the same information without the need for contrast exposure.
Many different types of contrast media have been used to enhance medical imaging and thus improve diagnostic and therapeutic decisions made by urologists. These agents are used on a daily basis throughout the world with great safety and efficacy. However, like all other pharmaceuticals, there are inherent risks associated with the use of contrast media. Adverse side effects and adverse drug reactions (ADRs) can be a direct result from the use of contrast media and vary from minor disturbances to severe, life-threatening situations. Imaging centers must be prepared with trained personnel, readily available medications, equipment, and an ongoing system to educate clinic personnel on the recognition and treatment of ADRs associated with contrast media.
Intravascular Iodinated Contrast Media
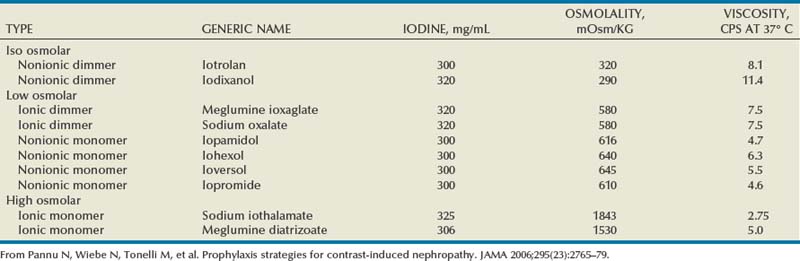
Iodine is the most common element in general use as an intravascular radiologic contrast medium (IRCM). With an atomic weight of 127, iodine has radiopacity, whereas other elements included in IRCM have no radiopacity and act only as carriers of the iodine elements, increasing solubility and reducing toxicity. Four basic types of iodinated IRCM are available for clinical use: ionic monomer, nonionic monomer, ionic dimer, and nonionic dimer. They can be further characterized as being iso-, hyper-, or low-osmolar compared with physiologic osmolality of 300 mOsm/kg H2O (Table 4–3).
All are derived from a 2,4,6 tri-iodinated benzene ring compound with three atoms of iodine in the case of monomers and six atoms of iodine in the case of dimers. The chemical composition of these agents make them highly hydrophilic, low in lipid solubility, and of low binding affinity for protein receptors or membranes. Because they do not enter red blood cells or tissue cells and are rapidly excreted, they are designed for use in imaging and are not therapeutic. Approximately 90% will be eliminated by the kidneys within 12 hours of administration.
Relative to the body’s iron stores, large quantities of iodine are required for imaging enhancement. The total body iodine content, found mainly in the thyroid gland, is 0.01 g and the average daily turnover of iodine is only 0.0001 g. For renal CT imaging a common dose of IRCM will expose the patient to between 25 and 50 g of iodine, which is approximately 400,000 times the daily turnover rate in the human body, but this dose will rarely cause any toxicity or lasting effects (Morris, 1993).
Adverse Reactions to Intravascular Iodinated Contrast Media
Adverse drug reactions (ADR) associated with intravenous contrast media can be divided into two broad categories: idiosyncratic anaphylactoid (IA) and nonidiosyncratic (NI) reactions. IA reactions are most concerning because they are potentially fatal and can occur without any predictable or predisposing factors. Approximately 85% of IA reactions occur during or immediately after injection of IRCM and are more common in patients with a prior ADR to contrast media, asthmatics, diabetics, patients with impaired renal function or diminished cardiac function, and those who are taking β-adrenergic blockers.
The exact mechanism of IA reactions is not known but is thought to be a combination of systemic effects. IA reactions have not been shown to result from a true IgE antibody immunologic reaction to the contrast media (Dawson, 1999). At least four mechanisms may play a role in IA reactions: (1) release of vasoactive substances including histamine; (2) activation of physiologic cascades including complement, kinin, coagulation, and fibrinolytic systems; (3) inhibition of enzymes including cholinesterase, which may cause prolonged vagal stimulation; and (4) the patient’s own anxiety and fear of the actual procedure. IA reactions are not dose dependent. Severe reactions have been reported after only 1 mL injected at the beginning of the procedure and have also occurred after completion of a full dose despite no reaction to the initial test dose (Nelson et al, 1988; Thomsen et al, 1999; ACR, 2008).
Nonidiosyncratic (NI) reactions are dose dependent and consequently related to the osmolality, concentration, volume, and injection rate of the IRCM. Because the concentration of absorbed or free iodine is low, only patients with an underlying iodine deficiency are at risk for increased intake of iodine during contrast imaging. Patients with endemic goiter may develop thyrotoxicosis after injection of IRCM agents.
The hyperosmolar contrast media (HOCM) have an osmolality that is five times greater than physiologic osmolality of body cells (300 mOsm/kg water). The hyperosmolar agents are associated with erythrocyte damage, endothelial damage, vasodilation, hypervolemia, interruption of the blood-brain barrier, and cardiac depression. Chemotoxic reactions to IRCM include cardiac, vascular, neurologic, and renal toxicity. The low osmotic contrast media (LOCM) have an osmolality the same as or slightly higher than physiologic osmolality and are associated with fewer ADRs and toxic events (Morcos, 1999).
Contrast Complications
All contrast ADRs are more common with HOCM (12%) compared with LOCM (3%) (Katayama et al, 1990; Heinrich et al, 2005). Previous adverse reaction to IRCM and a history of asthma are two of the most concerning predisposing conditions predicating an ADR with use of contrast media. Additional factors that may predict an ADR include history of known allergy to iodine, severe cardiac disease, renal insufficiency, dehydration, sickle cell anemia, anxiety, apprehension, hyperthyroidism, and presence of adrenal pheochromocytoma.
Minor Reactions
It is common to have nausea, flushing, pruritus, urticaria, headache, and even emesis after injection of IRCM. These reactions are usually mild and do not require additional treatment. Arm pain can also result from venous spasm or infiltration of the media outside the vein. An H1 receptor blocker like diphenhydramine (Benadryl) PO/IM/IV 1 to 2 mg/kg, up to 50 mg may be helpful in this patient population.
Intermediate Reactions
Worsening or more severe minor reactions including hypotension or bronchospasm occur in 0.5% to 2% of patients. These are usually transient and do not need treatment. If necessary, 4 to 10 mg of chlorphenamine administered orally, IV, or IM; 5 mg of diazepam for anxiety; 100 to 500 mg of hydrocortisone IM or IV; or two to three puffs of beta-agonist inhalators for bronchospasm (bronchiolar dilators such as metaproterenol [Alupent], terbutaline [Brethaire], or albuterol [Proventil or Ventolin]) are administered; repeat as needed.
Severe Reactions
Life-threatening reactions occur in approximately 1/1000 uses for high-osmolar agents and are far less for low-osmolar contrast media, with both types of agents resulting in mortality rates of 1/170,000 uses (Spring et al, 1997). Severe reactions include seizure, laryngeal spasm, bronchospasm, pulmonary edema, cardiac arrhythmia, respiratory collapse, or cardiac arrest (Katayama et al, 1990). Ready access to a crash cart and trained personnel are necessary components of any imaging center. If needed, cardiopulmonary resuscitation is started immediately. Many different medications have been used for the treatment of an acute severe life-threatening reaction to IRCM. However, rapid administration of epinephrine is the treatment of choice for severe contrast reactions. Current guidelines recommend immediate delivery of 0.01 mg/kg of body weight to a maximum of 0.5 mg of 1 : 1000 concentration of epinephrine, injected IM in the lateral thigh as first-line treatment. Subcutaneous injection is much less effective. Intravenous injection can be given with more dilute concentration and must be given slowly (ACR, 2008; Lightfoot et al, 2009).
Large-volume extravasation can be seen with power injections not monitored with electrical skin impedance devices that detect extravasation and arrest the injection process. When large-volume extravasation of IRCM occurs, the result can be cellulitis, edema, and compartment syndrome leading to tissue necrosis. The most severe consequences may not be manifest immediately. Consequently, admission to the hospital for observation or frequent follow-up in the clinic may be necessary in some cases of large-volume extravasation.
Premedication Strategies
No known premedication strategy will eliminate the risk of a severe adverse reaction to IRCM. The regimens suggested in the literature include the use of corticosteroids, antihistamines, H1 and H2 antagonists, and ephedrine. Patients at high risk should be premedicated with corticosteroids and possibly antihistamines 12 to 24 hours before and after use of IRCM. LOCM can be used in these patients. Several premedication regimens have been proposed to reduce the frequency and/or severity of reactions to contrast media. Two frequently used regimens are outlined in Table 4–4.
Table 4–4 Premedication Strategies to Reduce Severity of Reactions to Contrast Media
| Prednisone | 50 mg by mouth at 13 hr, 7 hr, and 1 hr before contrast media injection |
| Plus diphenhydramine (Benadryl)—50 mg IV, IM, or by mouth 1 hr before contrast medium injection | |
| Methylprednisolone (Medrol) | 32 mg by mouth 12 hr and 2 hr before contrast media injection |
| Plus diphenhydramine (Benadryl)—50 mg IV, IM, or by mouth 1 hr before contrast medium injection |
From American College of Radiology Manual on Contrast Media, version 6, pp. 9-10, <http://www.acr.org/SecondaryMainMenuCategories/quality_safety/contrast_manual.aspx> [accessed 01.10.10].
It has been demonstrated that the use of nonionic contrast media combined with a premedication strategy including corticosteroids results in a reduction in reaction rates compared with other protocols for patients who have experienced a prior contrast media–induced reaction. However, no controlled studies are available to determine whether pretreatment alters the incidence of serious reactions. Oral administration of steroids seems preferable to intravascular administration, and prednisone and methylprednisolone are equally effective. If the patient is unable to take oral medication, 200 mg of hydrocortisone IV may be substituted for oral prednisone. One consistent finding is that the steroids should be given at least 6 hours before the injection of contrast media regardless of the route of steroid administration. It is clear that administration for 3 hours or less before contrast does not decrease adverse reactions (Lasser, 1988).
Supplemental administration of an H1 antihistamine (e.g., diphenhydramine), orally or IV, may reduce the frequency of urticaria, angioedema, and respiratory symptoms. In emergency situations, intravenous corticosteroid (e.g., 200 mg hydrocortisone) every 4 hours plus an H1 antihistamine (e.g., 50 mg diphenhydramine) 1 hour before the procedure has been used. In patients who have a prior documented contrast reaction, the use of a different contrast agent has been advocated and may be protective. Switching to a different agent should be in combination with a premedication regimen.
Specific Clinical Considerations
Metformin
Patients with type II diabetes mellitus on metformin oral biguanide hyperglycemic therapy may have an accumulation of the drug after administering IRCM, resulting in biguanide lactic acidosis presenting with vomiting, diarrhea, and somnolence. This condition is fatal in approximately 50% of cases (Wiholm, 1993). Biguanide lactic acidosis is rare in patients with normal renal function. Consequently, in patients with normal renal function and no known comorbidities there is no need to discontinue metformin before IRCM use, nor is there a need to check creatinine following the imaging study. However, in patients with renal insufficiency, metformin should be discontinued the day of the study and withheld for 48 hours. Postprocedure creatinine should be measured at 48 hours and metformin started once kidney function is normal (Bailey and Turner, 1996). It is not necessary to discontinue metformin before gadolinium-enhanced magnetic resonance studies when the amount of gadolinium administered is in the usual dose range of 0.1 to 0.3 mmol per kg of body weight.
Contrast-Induced Nephropathy
Contrast-induced nephropathy (CIN) is defined as a rise in serum creatinine 25% above baseline, or more than 0.5 mg/dL within 3 days following exposure to contrast media, in the absence of an alternative cause. The precise cause of CIN continues to elude investigators but is believed to be a combination of tubular injury and renal ischemia (Katholi et al, 1998). High doses of IRCM can impair renal function in some patients for 3 to 5 days. CIN in patients with normal kidney function is rare (Pannu et al, 2006; Kelly et al, 2008). CIN is the third most common cause of acute kidney failure in the hospitalized patients (Nash et al, 2002). The most common patient-related risk factors are chronic kidney disease (creatinine clearance <60 mL/min), diabetes mellitus, dehydration, congestive heart failure, age, hypertension, low hematocrit, and ventricular ejection fraction less than 40%. The patients at highest risk for developing CIN are those with both diabetes and preexisting renal insufficiency. The most common non–patient-related causes are high-osmolar contrast agents, ionic contrast, increased contrast viscosity, and large-contrast volume infusion (Pannu et al, 2006).
Despite significant discussion on the part of radiologists and urologists, the literature does not support an absolute serum creatinine level that prohibits the use of contrast media. Prevention of CIN has been the subject of many research studies, and the results have been summarized by several different meta-analyses. In these meta-analyses the baseline serum creatinine of study participants ranged from 0.9 to 2.5 mg/dL. In one survey the policies regarding the cutoff value for serum creatinine varied widely among radiology practices. Thirty-five percent of respondents used 1.5 mg/dL, 27% used 1.7 mg/dL, and 31% used 2.0 mg/dL (mean, 1.78 mg/dL) as a cutoff value in patients with no risk factors other than elevated creatinine; threshold values were slightly lower in diabetics (mean 1.68 mg/dL). Patients in end-stage renal disease who have no remaining natural renal function are no longer at risk for CIN and may receive LOCM or IOCM (Elicker et al, 2006).
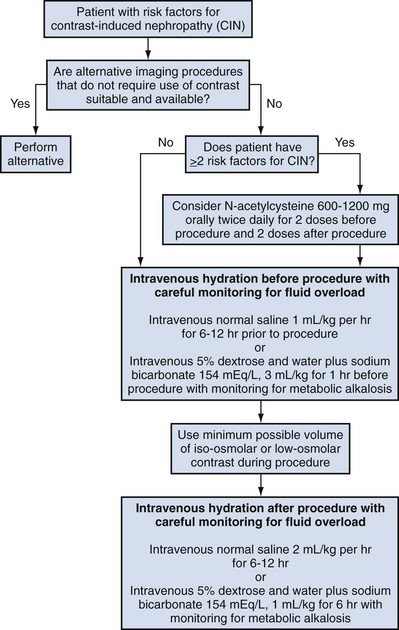
The summary of the meta-analysis for the prevention of CIN after contrast media use supports using hydration, bicarbonate, iso- or low-osmolar contrast media, and N-acetylcysteine. In one review article, N-acetylcysteine was determined to be more protective than hydration alone. Furosemide was found to increase the risk of developing CIN (Pannu et al, 2006; Kelly et al, 2008).
N-acetylcysteine is inexpensive, readily available, administered orally, and associated with few drug interactions or side effects. Its mechanism of protection against CIN is not understood but may serve as a scavenger of oxygen-free radicals and/or augment the vasodilatory effects of nitric oxide in the kidney (Safirstein et al, 2000). Doses used in the different studies ranged from 600 to 1200 mg orally twice a day for 2 doses before the contrast-enhanced study and 2 doses after the procedure (Fig. 4–2).
Magnetic Resonance Imaging Contrast Agents
Because magnetic resonance imaging (MRI) offers previously unseen detailed soft tissue imaging compared with CT, it was initially believed that MRI would not require contrast enhancement. However, by 2005, almost 50% of MRI studies were being performed with contrast media. Extracellular MRI contrast agents contain paramagnetic metal ions. Copper, manganese, and gadolinium were the potential paramagnetic ions for use with MRI. Gadolinium, however, is the most powerful having seven unpaired electrons, but its toxicity required encapsulation by a chelate. Paramagnetic agents like gadolinium are positive enhancers reducing the T1 and T2 relaxation times and increasing tissue signal intensity on T1-weighted images, while having little effect on T2-weighted images.
Although gadolinium chelates can be differentiated on the basis of stability, viscosity, and osmolality, they cannot be differentiated on the basis of efficacy. Acute adverse reactions are encountered less frequently with gadolinium than after administration of iodinated contrast media. The frequency of all acute adverse events after an injection of 0.1 or 0.2 mmol/kg of gadolinium chelate ranges from 0.07% to 2.4%. The vast majority of these reactions are mild including coldness at the injection site, nausea, emesis, headache, warmth or pain at the injection site, paresthesias, dizziness, and itching. Reactions resembling an “allergic” response occur frequently, from 0.004% to 0.7%. Systemic reactions consisting of rash, hives, or urticaria are the most frequent of this group, and rarely bronchospasm. The severe, life-threatening anaphylactoid or nonallergic anaphylactic reactions are exceedingly rare (0.0001% to 0.001%). In a meta-analysis of 687,000 gadolinium doses for MRI, there were only five severe reactions. In another survey based on 20 million administered doses there were 55 cases (0.0003%) of severe reactions. Fatal reactions to gadolinium chelate agents have been reported, but they are extremely rare events (Murphy et al, 1999).
Extracellular MRI agents are known to interfere with some serum chemistry assays. For example, serum calcium tests will often be measured as a false reading of hypocalcemia for 24 hours after MRI with gadolinium enhancement, even though serum calcium is actually in the normal range. Other tests including iron, magnesium, iron binding capacity, and zinc may also have spurious results. Biochemical assessment is more reliable when performed 24 hours after exposure to gadolinium contrast media.
Nephrogenic Systemic Fibrosis
Gadolinium-based contrast media (GBCM) are considered to have no nephrotoxicity at approved dosages for MRI. Magnetic resonance with gadolinium has been used instead of contrast-enhanced CT in those at risk for developing worsening renal failure if exposed to iodinated contrast media. However, nephrogenic systemic fibrosis (NSF) has recently been reported in patients with advanced renal insufficiency (glomerular filtration rate [GFR] <30 mL/min). Nephrogenic systemic fibrosis (NSF) is a fibrosing disease of the skin, subcutaneous tissues, lungs, esophagus, heart, and skeletal muscles. Initial symptoms typically include skin thickening and/or pruritus. Symptoms and signs may develop and progress rapidly, with some affected patients developing contractures and joint immobility within days of exposure. Death may result in some patients, presumably as a result of visceral organ involvement.
In 1997 NSF was described in dialysis patients who had not been exposed to GBCM. The condition was previously known as nephrogenic fibrosing dermopathy. In 2006 and again in 2007 independent reports surfaced defining a strong association with gadolinium-based contrast media (Grobner, 2006; Marckmann et al, 2006). Onset of NSF varies between 2 days and 3 months. Early manifestations include subacute swelling of distal extremities, followed by severe skin induration and later even organ involvement. In a 2007 survey performed by the American College of Radiology, 156 cases of NSF were reported by 27 responding institutions; 140 of these 156 patients were known to have received GBCM. In 78 patients, the specific GBCM was known. Forty-five of them received gadodiamide, 17 gadopentetate dimeglumine, 13 gadoversetamide, and 3 gadobenate dimeglumine. NSF following gadoteridol administration has also been reported. Many of the cases in which agents other than gadodiamide and gadopentetate dimeglumine were used are confounded by the fact that affected patients were injected with other agents as well (ACR, 2008). Patients with chronic kidney disease (CKD) have a 1% to 7% chance of developing NSF after MRI imaging with gadolinium agents (Todd et al, 2007).
Patients with GFR less than 30 mL/min/1.73m2 (not on chronic dialysis) are the most difficult patient population in terms of choosing an imaging modality. They are at risk for CIN if exposed to iodinated contrast media for CT imaging and are also at significant risk of developing NSF if exposed to GBCM during MRI. Recent data suggest that the risk of NSF may be greatest in patients with a GFR of less than 15 mL/min/1.73m2 and much less in patients with GFRs that are higher. Patients with severe chronic kidney disease have a 1% to 7% chance of developing NSF after GBCM MRI (Kanal et al, 2008). In the chronic kidney disease patient population, it is recommended that contrast media be avoided if possible. If MRI contrast media is absolutely essential, use of the lowest possible doses (needed to obtain a diagnostic study) of selected GBCM is recommended. In this setting, the patient should be informed of the risks of GBCM administration and must give their consent to proceed. There is no proof that any GBCM is completely safe in this patient group; however, some have suggested avoiding gadodiamide and considering use of macrocyclic agents (Kanal et al, 2008). Patients with CKD but GRF greater than 30 mL/min/1.73m2 are considered to be at extremely low or no risk for developing NSF if a dose of GBCM of 0.1 mmol/kg or less is used. Patients with GFR greater than 60 mL/min/1.73 m2 do not appear to be at increased risk of developing NSF, and the current consensus is that all GBCM can be administered safely to these patients. In their publications, the American College of Radiology stresses that the current information on NSF and its relationship to GBCM administration is preliminary and further research is necessary to better understand this potentially devastating complication.
Key Points
Contrast Media
Intravenous Urography
Once the mainstay of urologic imaging, the intravenous excretory urographic (IVU) study has essentially been replaced by CT and MRI. With the ability of new scanners to perform axial, sagittal, and coronal reconstruction of the upper tract urinary system, essentially all of the data and information obtained by traditional IVU can be realized with CT imaging. In addition, some parenchymal defects, cysts, and tumors can be better delineated with CT than IVU.
Technique
Bowel prep may help to visualize the entire ureters and upper collecting systems. Patients with chronic constipation may benefit most from complete bowel prep with clear liquids for 12 to 24 hours and an enema 2 hours before the procedure. Most patients will need only clear liquids for 12 hours and an enema 1 hour before the procedure.
Before injection of contrast, a scout radiograph or KUB (kidneys, ureters, bladder) film is taken demonstrating the top of the kidneys and the entire pelvis to the pubic symphysis. This allows determination of adequate bowel prep, confirms correct positioning, and exposes kidney stones or bladder stones.
Contrast is injected as a bolus of 50 to 100 mL of contrast. The nephrogenic phase is captured with a radiograph immediately after injection. In the past, tomograms were used to look for parenchymal defects but now CT or MRI is preferred. A film is taken at 5 minutes and then additional films at 5-minute intervals until the question that prompted the IVU is answered. Abdominal compression may be used to better visualize the ureters. Occasionally oblique films will be used to better define the course of the ureter in the bony pelvis and to precisely differentiate ureteral stones from pelvic calcifications.
Upright films may be helpful in certain situations. In the rare case of suspected symptomatic renal ptosis, IVU can be particularly helpful (Fig. 4–3). Supine films are compared with upright films to measure the degree of ptosis. Such a comparison cannot be made with MRI or CT. In the case of calyceal stones or milk of calcium stones, layering of the contrast can be helpful to evaluate the anatomy of the calyx harboring the stones.
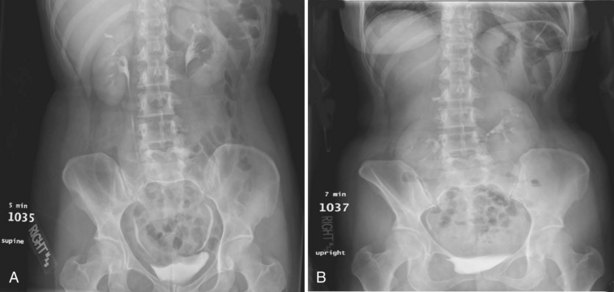
Figure 4–3 Intravenous excretory urogram (IVU) in a 40-year-old female with the complaint of a mobile mass in the right lower quadrant with standing associated with bilateral flank and back pain that resolved in the supine position. A, Supine IVU shows kidneys in the normal position, with normal ureters and proximal collecting systems. B, Standing film shows significant displacement of both kidneys with the right kidney moving onto the pelvis as described by the patient.
Postvoid films are obtained to evaluate the presence of outlet obstruction, prostate enlargement, and bladder filling defects including stones and urothelial cancers.
Plain Abdominal Radiography
The plain abdominal radiograph is a conventional radiography study, which, in urology, is intended to display the kidneys, ureters and bladder. The plain abdominal radiograph may be employed (1) as a primary study or (2) as a scout film in anticipation of contrast media. Plain films are widely used in the management of renal calculus disease. Plain radiography is also useful in evaluation of the trauma patient because it can be performed as a portable study in the trauma unit. Secondary findings on plain radiography such as rib fractures, fractures of the transverse processes of the vertebral bodies, and pelvic fractures may indicate serious associated urologic injuries.
Technique
An abdominal plain radiograph is obtained with the patient in the supine position, using an anterior to posterior exposure. The study typically includes that portion of the anatomy from the level of the diaphragm to the inferior pubic symphysis. It may occasionally be necessary to make two exposures to cover the desired anatomic field. Depending on the indication for the study, oblique films are obtained to clarify the position of structures in relation to the urinary tract. If small bowel obstruction or free peritoneal air is suspected, upright films will be obtained.
Limitations
Although plain film radiography is often used in the evaluation of renal colic, it is unreliable in the demonstration of calculus disease for various reasons: (1) overlying stool and bowel gas may obscure small calculi; (2) stones may be obscured by other structures such as bones or ribs (Fig. 4–4); (3) calcifications in pelvic veins or vascular structures may be confused with ureteral calculi; and (4) stones that are poorly calcified or composed of uric acid may be radiolucent. Nevertheless, plain film radiography is valuable in assessing the suitability of a patient for extracorporeal shock wave lithotripsy because the ability to identify the stone on fluoroscopy is critical to targeting. Furthermore, a KUB film is cost-effective for monitoring residual stone burden after treatment (Fig. 4–5). For complex pathology of the urinary tract, plain abdominal radiography has been supplanted by axial imaging. Plain radiography has a limited role in evaluating soft tissue abnormalities of the urinary tract.
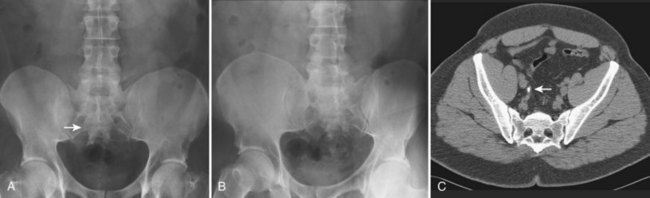
Figure 4–4 A, Right ureteral calculus (arrow) overlying the sacrum is difficult to visualize on the plain film. B, The right posterior oblique study fails to confirm the location of the ureteral calculus. C, Computed tomography confirms this 6-mm calculus in the right ureter at the level of the third sacral segment.
Retrograde Pyelography
Retrograde pyelograms are performed to opacify the ureters and intrarenal collecting system by the retrograde injection of contrast media. Any contrast media that can be used for excretory urography is also acceptable for retrograde pyelography. Attempts should be made to sterilize the urine before retrograde pyelography because there is a risk of introducing bacteria into the upper urinary tracts or into the bloodstream. Although many studies are able to document the presence or absence of dilation of the ureter, retrograde pyelography has the unique ability to document the normalcy of the ureter distal to the level of obstruction and to better define the extent of the ureteral abnormality.
Technique
Retrograde pyelography is usually performed with the patient in the dorsal lithotomy position. An abdominal plain radiograph (scout film) is obtained to ensure that the patient is in the appropriate position to evaluate the entire ureter and intrarenal collecting system. Cystoscopy is performed and the ureteral orifice is identified.
Contrast may be injected through either a nonobstructing catheter or an obstructing catheter. Nonobstructing catheters include whistle tip, spiral tip, or open-ended catheters. Use of nonobstructing catheters allows passage of the catheter into the ureter and up to the collecting system, over a guidewire if necessary. Contrast can then be introduced directly into the upper collecting system, and the ureters can be visualized by injection of contrast as the catheter is withdrawn.
The other commonly employed method is the use of an obstructing ureteral catheter such as a bulb-tip, cone-tip, or wedge-tip catheter. These catheters are inserted into the ureteral orifice and then pulled back against the orifice to effectively obstruct the ureter. Contrast is then injected to opacify the ureter and intrarenal collecting system. Depending on the indication for the study, it is useful to dilute the contrast material to 50% or less with sterile fluid. This prevents subtle filling defects in the collecting system or ureter from being obscured. Contrast is injected slowly, usually requiring from 5 to 8 mL to completely opacify the ureter and intrarenal collecting system in adults (Fig. 4–6). More or less contrast may be required depending on the size of the patient and the capaciousness of the collecting system. Limited use of fluoroscopy while injecting will help prevent overdistension of the collecting system and reduce the risk of extravasation of contrast. Care should be taken to evacuate air bubbles from the syringe and catheter before injection. Such air bubble artifacts could be mistaken for stones or tumors.
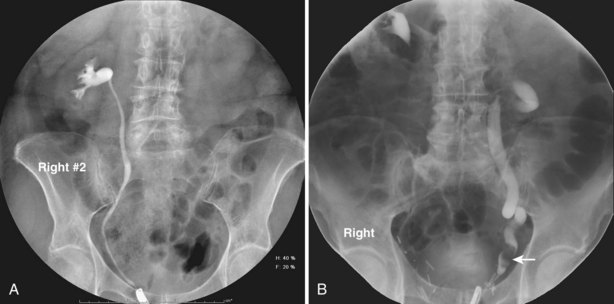
Figure 4–6 A, Right retrograde pyelogram performed using an 8-Fr cone-tipped ureteral catheter and dilute contrast material. The ureter and intrarenal collecting system are normal. B, Left retrograde pyelogram using an 8-Fr cone-tipped ureteral catheter. A filling defect in the left distal ureter (arrow) is a low-grade transitional cell carcinoma. The ureter demonstrates dilation, elongation, and tortuosity, the hallmarks of chronic obstruction.
Historically, when a retrograde pyelogram consisted of a series of radiographs taken at intervals, it was important to document various stages of filling and emptying of the ureter and collecting systems. Because of peristalsis the entire ureter will often not be seen on any given static exposure or view. With current equipment including tables that incorporate fluoroscopy, it is possible to evaluate the ureter during peristalsis in real time, thus reducing the need for static image documentation. Documentary still images or “spot films” may be saved for future comparison. Urologists interpret retrograde pyelograms in real time as they are performed.
Limitations
Retrograde pyelography may be difficult in cases where the bladder is involved with diffuse inflammation or neoplastic changes, especially when bleeding is present. Identification of the ureteral orifices may be assisted by the intravenous injection of indigotindisulfonate sodium or methylene blue in such cases. Changes associated with bladder outlet obstruction may result in angulation of the intramural ureters. This may make cannulation with an obstructing catheter quite difficult. Attempts to cannulate the ureteral orifice may result in trauma to the ureteral orifice and extravasation of contrast material into the bladder wall. The potential for damage to the intramural ureter must be weighed against the potential information to be obtained by the retrograde pyelogram.
Complications
Backflow occurs during retrograde pyelography when contrast is injected under pressure and escapes the collecting system. Contrast may escape the collecting system by one of four routes: Pyelotubular backflow occurs when contrast fills the distal collecting ducts producing opacification of the medullary pyramids (Fig. 4–7A). Pyelosinus backflow occurs when a tear in the calyces at the fornix allows contrast to leak into the renal sinus (Fig. 4–7B). Pyelolymphatic backflow is characterized by opacification of the renal lymphatic channels (Fig. 4–7C). Pyelovenous backflow is seen when contrast enters the venous system, resulting in visualization of the renal vein.
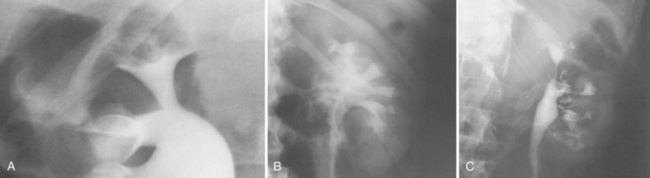
Figure 4–7 Patterns of backflow during retrograde pyelography. A, Pyelotubular backflow. B, Pyelosinus backflow. C, Pyelolymphatic backflow.
Although backflow does not usually cause measurable clinical harm, the potential implications of backflow include (1) introduction of bacteria from infected urine into the vascular system and (2) the absorption of contrast media, which could result in adverse reactions in susceptible patients. It has been demonstrated that the risk of significant urinary tract infection is only about 10% and the risk of sepsis is low when antibiotic prophylaxis therapy is administered before endoscopic procedures (including retrograde pyelography) (Christiano et al, 2000). Although contrast reactions are rare with retrograde pyelography, they have been reported (Johenning, 1980; Weese et al, 1993). In patients with documented severe contrast allergy, prophylactic pretreatment may be appropriate. In those patients considered at risk, care should be taken to inject under low pressures to minimize the probability of backflow and absorption of the contrast into the vasculature system.
Loopography
Loopography is a diagnostic procedure performed in patients who have undergone urinary diversion. Historically the term “loopogram” has been associated with ileal conduit diversion but may be used in reference to any bowel segment serving as a urinary conduit. When imaging patients with a continent diversion involving a reservoir or neobladder, “pouch-o-gram” would be more accurately descriptive. Because an ileal conduit urinary diversion usually has freely refluxing ureterointestinal anastomoses, the ureters and upper collecting systems may be visualized. In other forms of diversion, the ureterointestinal anastomoses may be purposely nonrefluxing. In such circumstances, when opacification of the upper urinary tract is desirable, antegrade ureteral imaging such as IVU, CT, or MRI urography or antegrade nephrostography may be required. When the patient has compromised renal function or is allergic to iodinated contrast material, loopography can be performed with a low risk of systemic absorption (Hudsen et al, 1981).
Technique
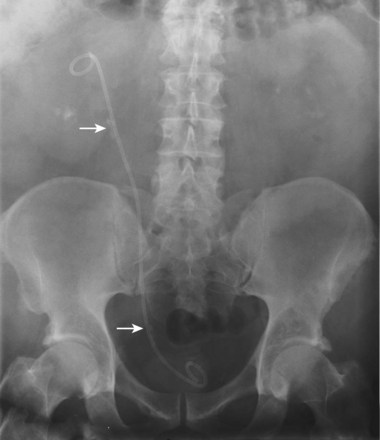
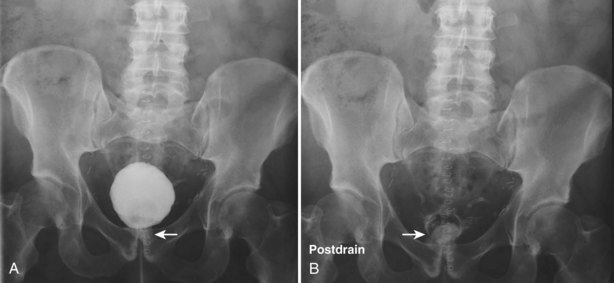
The patient is positioned supine. An abdominal plain radiograph is obtained before the introduction of contrast material (Fig. 4–8A). A commonly employed technique is to insert a small-gauge catheter into the ostomy of the loop, advancing it just proximal to the abdominal wall fascia. The balloon on such a catheter can then be inflated to 5 to 10 mL with sterile water. By gently introducing contrast through the catheter, the loop can be distended, usually producing bilateral reflux into the upper tracts. Oblique films should be obtained in order to evaluate the entire length of the loop (Fig. 4–8B). Because of the angle at which many loops are constructed, a traditional anteroposterior (AP) view will often show a foreshortened loop and could miss a substantial pathology. A drain film should be obtained (Fig. 4–8C). This may demonstrate whether there is obstruction of the conduit.
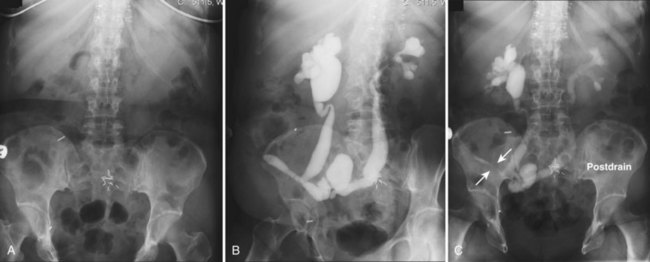
Figure 4–8 Loopography in a patient with epispadias/exstrophy and ileal conduit urinary diversion. The plain film (A) shows wide diastasis of the pubic symphysis. After contrast administration via a catheter placed in the ileal conduit, free reflux of both ureterointestinal anastomoses is demonstrated (B). A postdrain radiograph (C) demonstrates persistent dilation of the proximal loop indicating mechanical obstruction of the conduit (arrows).
Retrograde Urethrography
A retrograde urethrogram is a study meant to evaluate the anterior and posterior urethra. Retrograde urethrography may be particularly beneficial in demonstrating the total length of a urethral stricture, which cannot be negotiated by cystoscopy. Retrograde urethrography also demonstrates the anatomy of the urethra distal to a stricture, which may not be assessable by voiding cystourethrography. Retrograde urethrography may be performed in the office or in the operating room before performing visual internal urethrotomy or formal urethroplasty.
Technique
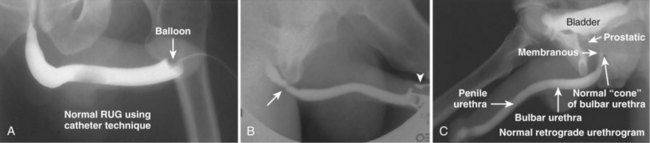
A plain film radiograph is obtained before injection of contrast. The patient is usually positioned slightly obliquely to allow evaluation of the full length of urethra. The penis is placed on slight tension. A small catheter may be inserted into the fossa navicularis with the balloon inflated to 2 mL with sterile water. Contrast is then introduced via catheter-tipped syringe. Alternatively, a penile clamp (e.g., Brodney clamp) may be used to occlude the urethra around the catheter (Fig. 4–9).
Static Cystography
Static cystography is employed primarily to evaluate the structural integrity of the bladder. The shape and contour of the bladder may give information about neurogenic dysfunction or bladder outlet obstruction. Filling defects such as tumors and stones may be appreciated.
Technique
The patient is positioned supine. A plain radiograph is performed to evaluate for stones and residual contrast and to confirm position and technique. The bladder is filled with 200 to 400 mL of contrast depending on bladder size and patient comfort. Adequate filling is important to demonstrate intravesical pathology or bladder rupture. Oblique films should be obtained because posterior diverticula or fistulae may be obscured by the full bladder. A postdrainage film completes the study (Fig. 4–10).
Limitations
Abdominal and pelvic CT is so commonly used in the evaluation of blunt or penetrating trauma to the abdomen that CT cystography is often performed in conjunction with the trauma evaluation. However, studies have shown that conventional static cystography is as sensitive as CT cystography in detecting bladder rupture (Quagliano et al, 2006; Broghammer and Wessells, 2008).
Voiding Cystourethrogram
A voiding cystourethrogram (VCUG) is performed to evaluate the anatomy and physiology of the bladder and urethra. The study provides valuable information regarding the posterior urethra in pediatric patients. VCUG has long been used to demonstrate vesicoureteral reflux.
Technique
The study may be performed with the patient supine or in a semiupright position using a table capable of bringing the patient into the full upright position. A preliminary pelvic plain radiograph is obtained. In children a 5- to 8-Fr feeding tube is used to fill the bladder to the appropriate volume. Patient comfort should be taken into account when determining the appropriate volume. In the adult population a standard catheter may be placed and the bladder filled to 200 to 400 mL. The catheter is removed and a film is obtained. During voiding, AP and oblique films are obtained. The bladder neck and urethra may be evaluated by fluoroscopy during voiding. Bilateral oblique views may demonstrate low-grade reflux, which cannot be appreciated on the AP film. In addition, oblique films will demonstrate bladder or urethral diverticula, which are not always visible in the straight AP projection. Postvoiding films should be performed (Fig. 4–11).
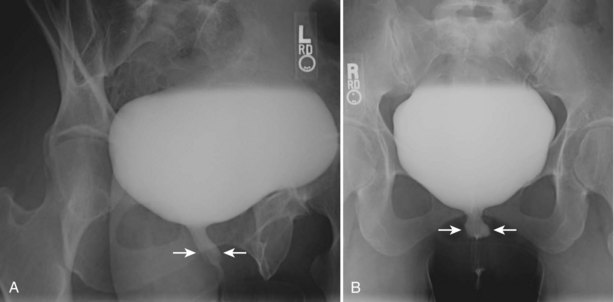
Figure 4–11 A voiding cystourethrography performed for the evaluation of recurrent urinary tract infection in this female patient. A, An oblique film during voiding demonstrates thickening of the midureteral profile (arrows). B, After interruption of voiding, a ureteral diverticulum is clearly visible extending posteriorly and to the left of the midline (arrows).
Limitations
This study requires bladder filling using a catheter. This may be traumatic in children and difficult in some patients with anatomic abnormalities of the urethra or bladder neck. Filling of the bladder may stimulate bladder spasms at low volumes, and some patients are unable to hold adequate volumes for investigation. Bladder filling in patients with spinal cord injuries higher than T6 may precipitate autonomic dysreflexia (Barbaric, 1976; Fleischman and Shah, 1977; Linsenmeyer et al, 1996).
Ultrasonography
The use of ultrasonography is fundamental to the practice of urology. Ultrasonography is a versatile and relatively inexpensive imaging modality that has the unique feature of being the only imaging modality to provide real-time evaluation of urologic organs and structures without the need for ionizing radiation. In order for urologists to best use this technology on behalf of their patients, they must have a mature understanding of the underlying physical principles of ultrasound. They must also understand how the manipulation of ultrasound equipment can affect the quality of ultrasound images. The technical skills required to perform and interpret urologic ultrasonography represent a combination of practical scanning ability and knowledge of the underlying disease process in organs being imaged. In order to communicate the findings appropriately, urologists should understand the nomenclature of ultrasonography and have a specific plan for documentation of each type of study. Understanding how ultrasonography interacts with human tissues will allow urologists to use this modality effectively, appropriately, and safely.
Principles
All ultrasound imaging is the result of the interaction of sound waves with tissues and structures within the human body. Ultrasound waves are produced by applying short bursts of alternating electrical current to a series of crystals housed in the transducer. Alternating expansion and contraction of the crystals via the piezoelectric effect creates a mechanical wave that is transmitted through a coupling medium to the skin and then into the body. The waves that are produced are longitudinal waves. In a longitudinal wave the particle motion is in the same direction as the propagation of the wave (Fig. 4–12). This motion produces areas of rarefaction and compression of tissue in the direction of travel of the ultrasound wave (Fig. 4–13). A portion of the wave is reflected toward the transducer. The transducer then serves as a receiver and “listens” for the returning sound wave reconverting the mechanical to electrical energy. The transducer must be in direct, secure contact with the subject to transmit and receive the reflected sound waves.
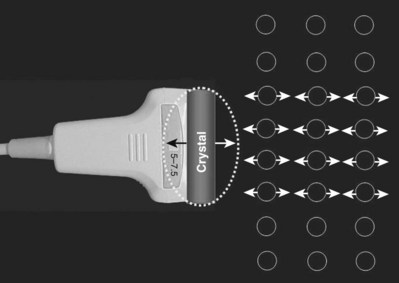
Figure 4–12 The alternating expansion and contraction of the crystal produces longitudinal mechanical waves. In this simplified schematic drawing, the individual molecules (depicted as circles) are displaced in the direction of the propagated wave.
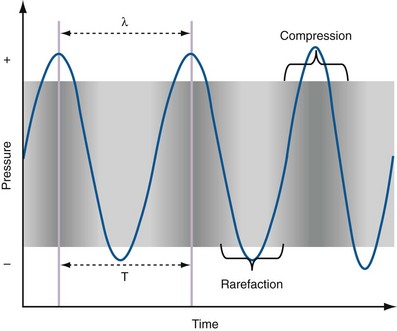
Figure 4–13 Areas of compression alternating with areas of rarefaction are depicted as a sine wave. The wavelength (λ) is the length from peak compression to peak compression in this drawing. This graphic depiction is critical to the understanding of the behavior of sound waves in the human body and of how ultrasound images are generated.
(Adapted from Merritt CRB. Physics of ultrasound. In: Rumack CM, Wilson SR, Charboneau JW, editors: Diagnostic ultrasound. 3rd ed. St Louis: Elsevier; 2005. p. 4.)
The appearance of the image produced by ultrasonography is the result of the interaction of mechanical ultrasound waves with biologic tissues and materials. Because ultrasound waves are transmitted and received at frequent intervals, the images can be rapidly reconstructed and refreshed, providing a real-time image. The frequency of the sound waves used for urologic ultrasound imaging is in the range of 3.5 MHz to 12 MHz.
Mechanical waves are represented graphically as a sine wave alternating between a positive and negative direction from the baseline. Ultrasound waves are described using the standard nomenclature for sine waves. A wavelength (λ) is described as the distance between one peak of the wave and the next peak. The complete path traveled by the wave from one peak to the next is called a cycle. One cycle per second is known as 1 hertz (Hz). The “period” is the time it takes for one complete cycle of the wave.
The “amplitude” of a wave is the maximal excursion in the positive or negative direction from the baseline. Amplitude corresponds to the mechanical energy associated with the sound wave and is a key property in assigning pixel brightness to a gray-scale ultrasound image. The greater the amplitude is, the brighter the corresponding pixel.
Ultrasound Image Generation
The image produced by an ultrasound machine begins with the transducer. In ultrasound imaging, the transducer has a dual function as a sender and receiver. Sound waves are created in short pulses and transmitted into the body and are then at least partially reflected. Reflected mechanical sound waves are received by the transducer and converted back into electrical energy. The transducer acts as a receiver more than 99% of the time. The electrical energy is converted by the ultrasound instrument to an image displayed on a monitor (Fig. 4–14).
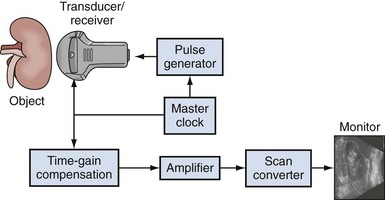
Figure 4–14 In this simplified schematic diagram of ultrasound imaging, the ultrasound wave is produced by virtue of a pulse generator controlled by a master clock. The reflected waves received by the transducer are analyzed for amplitude and transit time within the body. The scan converter produces the familiar picture seen on the monitor. The actual image is a series of vertical lines that are continuously refreshed to produce the familiar real-time, gray-scale image.
Resolution
The resolution of an ultrasound image refers to the ability to discriminate two objects in close proximity to one another. Axial resolution refers to the ability to identify as separate two objects in the direction of the traveling sound wave. Axial resolution is directly dependent on the frequency of sound waves. The higher the sound wave’s frequency is, the better the axial resolution. Lateral resolution refers to the ability to identify separately objects that are equidistant from the transducer. Lateral resolution is a function of the focused width of the ultrasound beam and is a characteristic of the transducer. The location of the narrowest beam width can be adjusted by the user. The more focused the beam is, the better the lateral resolution at that location. Thus image quality can be enhanced by locating the narrowest beam width (focus or focal zone) at the depth of the object or tissue of interest (Fig. 4–15).
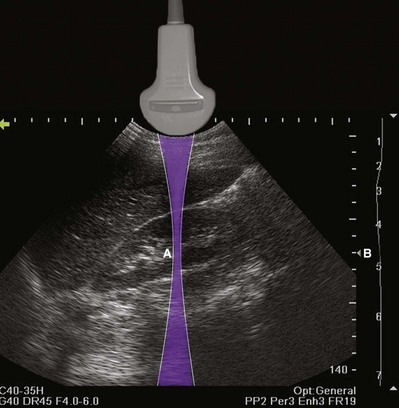
Figure 4–15 The shape of the ultrasound beam is simulated in this drawing (purple). The focal zone (A) is located to produce the best lateral resolution of the medial renal cortex. The location of the focal zone is designated by the caret (B). The location of the focal zone can be adjusted by the operator.
The velocity with which a sound wave travels through tissue is a product of its frequency and wavelength (Fig. 4–16). The average velocity of sound in human tissues is 1540 meters per second. Because the average velocity of sound in tissue is a constant, changes in frequency will result in changes in wavelength.
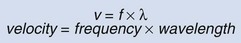
Figure 4–16 The relationship between velocity, frequency, and wavelength of sound waves in tissue. Wavelength and frequency vary in an inverse relationship.
The optimal ultrasound image requires tradeoffs between resolution and depth of penetration. High-frequency transducers of 6 to 10 MHz may be used to image structures near the surface of the body (e.g., testis, pediatric kidney) with excellent resolution. However, deeper structures (e.g., right kidney, bladder) require lower frequencies of 3.5 to 5 MHz to penetrate. Such images will have poorer axial resolution.
Mechanisms of Attenuation
As sound waves transit tissues, energy is lost or attenuated. Mechanisms of attenuation include reflection, scattering, interference, and absorption. Reflection is the key physical phenomenon that allows for information to return to the transducer as mechanical energy. Reflection occurs when ultrasound waves strike an object, a surface, or a boundary (called an interface) between unlike tissues. The shape and size of the object and the angle at which the advancing wave strikes the object are critical determinants of the amount of energy reflected. The amount of energy reflected from an interface is also influenced by the impedance of the two tissues at the interface. Impedance is a property that is influenced by tissue stiffness and density. It is the difference in impedance that allows an appreciation of interfaces between different types of tissue (Table 4–5).
Table 4–5 Density and Impedance of Tissues Encountered During Urologic Ultrasound
| DENSITY | IMPEDANCE | |
|---|---|---|
| Air and other gases | 1.2 | 0.0004 |
| Fat tissue | 952 | 1.38 |
| Water and other clear liquids | 1000 | 1.48 |
| Kidney (average of soft tissue) | 1060 | 1.63 |
| Liver | 1060 | 1.64 |
| Muscle | 1080 | 1.70 |
| Bone and other calcified objects | 1912 | 7.8 |
The impedance difference between perinephric fat and the kidney allows a sharp visual distinction at the interface. If the impedance difference between tissues is small (such as that between liver and kidney), the interface between the tissues will be more difficult to see (Fig. 4–17A). If impedance differences are large, there will be significant reflection of the sound wave producing an acoustical shadow distal to the interface (Fig. 4–17B).
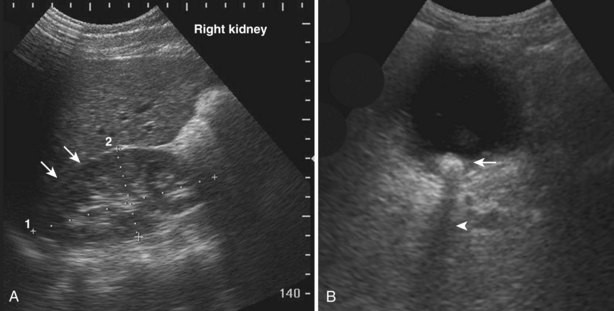
Figure 4–17 A, In this sagittal view of the right kidney, the paucity of perinephric fat and the small impedance difference make it difficult to distinguish the interface between the kidney and the liver (arrows). B, The large impedance difference at the interface between urine and this bladder stone (arrow) results in significant reflection and attenuation of the sound wave. An acoustic shadow is seen distal to the stone (arrowhead).
Scattering occurs when sound waves strike a small or irregular object. The resulting spherical wave overlaps those of surrounding scattering objects (Fig. 4–18).
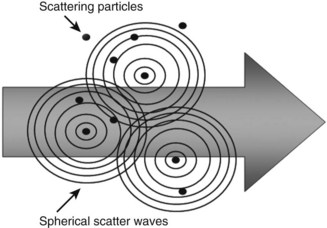
Figure 4–18 Scattering is a phenomenon that occurs when sound waves strike small objects. The resulting pattern of energy dispersal often results in interference.
When interacting sound waves are in phase or out of phase, their amplitude will be enhanced or diminished. This pattern of interference is partially responsible for the echo architecture or texture of organs. One pattern of interference, commonly called “speckling” (Fig. 4–19), is seen in organs with fine, internal histology such as the testis.
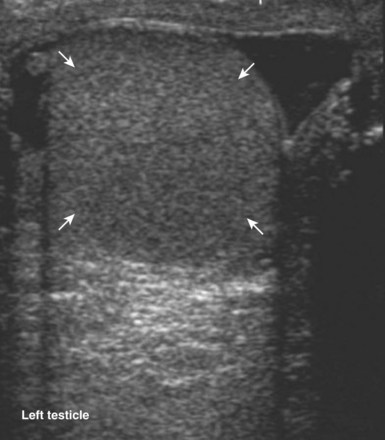
Figure 4–19 Fine internal echogenicity called “speckle” is caused by scattering of sound waves and the resultant pattern of interference. Note the resulting finely granular, homogenous echogenicity (arrows) of the testicular parenchyma.
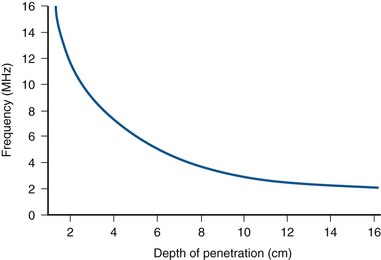
Absorption occurs when the mechanical energy of the ultrasound waves is converted to heat. Absorption is directly proportional to frequency. Therefore the higher the frequency of the incident wave, the greater will be the absorption of energy and the more tissue heating that will result. It follows that higher-frequency waves are more rapidly attenuated and therefore have a limited depth of penetration (Fig. 4–20).
Artifacts
The interaction of ultrasound waves with tissues may produce images that do not reflect the true underlying anatomy. These misrepresentations are called “artifacts.” Artifacts may be misleading but, if recognized, may also assist diagnosis. Acoustical shadowing occurs when there is significant attenuation of sound waves at a tissue interface. Echo information posterior to the interface may be obscured or lost. An anechoic or hypoechoic “shadow” is produced. Under these conditions, three-dimensional objects such as stones may appear as crescentic objects, making it difficult to obtain accurate measurements (Fig. 4–21). Important pathology posterior to such an interface may be missed. This problem may often be overcome by changing the angle of insonation, changing the frequency of the transducer, or changing the focal zone of the transducer.
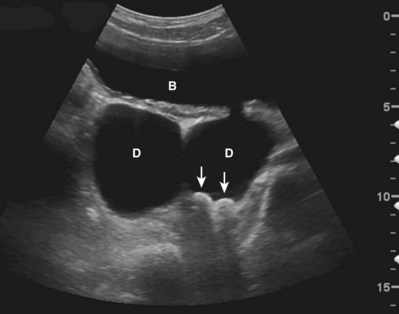
Figure 4–21 In this transverse view of the urinary bladder (B), there are two large bladder diverticula (D). Two stones (arrows) strongly reflect and attenuate the incident sound wave, producing an acoustical shadow. Note that the stones appear crescentic even though they are ovoid in shape.
Increased through transmission is observed when sound waves are less attenuated while passing through a given structure or tissue than by the surrounding tissues. For example, when imaging a simple cyst of the kidney, sound waves passing through the cyst are less attenuated than those passing through the surrounding renal cortex and renal sinus. When the waves transiting the cyst strike the back wall of the cyst and posterior renal tissue, the waves are more energetic on arrival to these tissues. The reflected sound waves are also more energetic and less attenuated as they return to the transducer. The result is that tissue posterior to the cyst appears hyperechoic compared with the surrounding renal tissue, even though the tissues are histologically identical (Fig. 4–22). The effect of this artifact can be mitigated by changing the angle of insonation or adjusting the time-gain compensation (TGC) settings.
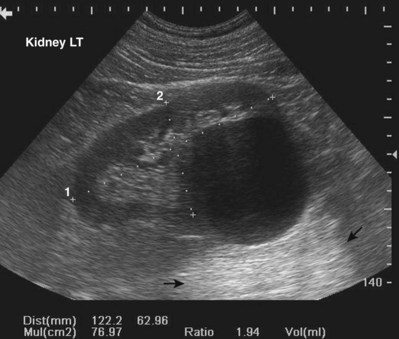
Figure 4–22 Increased thru-transmission (also called distal enhancement) is demonstrated in this longitudinal view of the left kidney. The tissue distal to the cyst appears hyperechoic (indicated by arrows) compared with adjacent tissue.
An edging artifact occurs when sound waves strike a curved surface or interface at an incident angle, resulting in refraction of the wave along the plane of the interface (Fig. 4–23).
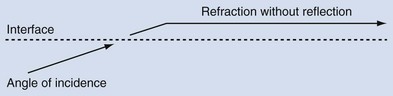
Figure 4–23 When sound waves strike a surface or interface at a “critical angle,” the wave is refracted without significant reflection.
An incident wave at this angle (the critical angle) will not be directly reflected to the transducer, resulting in a hypoechoic “shadow.” This artifact is commonly seen in testicular ultrasonography and transrectal ultrasonography (Fig. 4–24). It can be overcome by changing the angle of insonation.
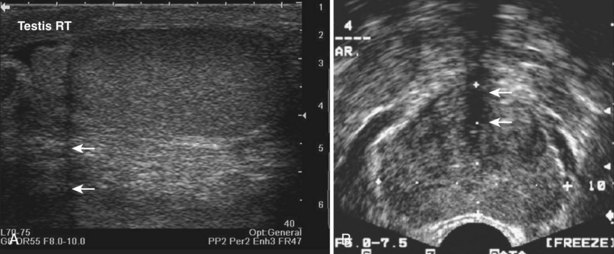
Figure 4–24 A, The curved surface of the tunica albuginea of the upper pole of testis creates a critical angle edging artifact (arrows). B, The rounded surfaces of the lateral lobes of the prostate as they meet in the prostatic urethra create an edging artifact (arrows) in this transverse image of the prostate.
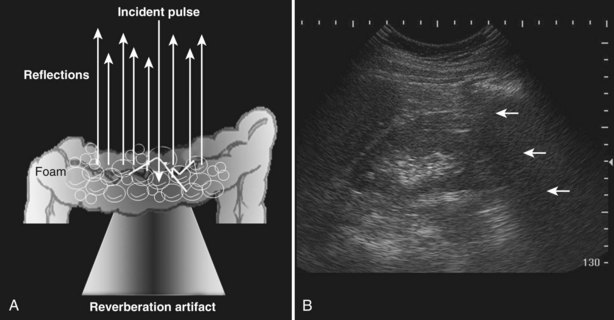
A reverberation artifact results when there are large differences in impedance between two adjacent tissues or surfaces with a strong reflection of the incident wave. The ultrasound wave bounces back and forth (reverberates) between the transducer interface and the reflective interface. With the second transit of the sound wave, the ultrasound equipment interprets a second object that is twice as far away as the first. There is ongoing attenuation of the sound wave with each successive reverberation, resulting in a slightly less intense image displayed on the screen. Therefore echoes are produced, spaced at equal intervals from the transducer but progressively less intense (Fig. 4–25).
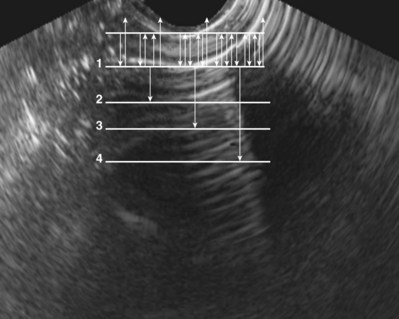
Figure 4–25 Reverberation artifact: The strongly reflective interface is projected with decreasing amplitude as the incident sound wave makes multiple round trips.
The reverberation artifact can also be seen in cases where the incident sound wave strikes a series of smaller reflective objects (such as the gas-fluid mixture in the small bowel), which results in multiple reflected sound waves of various angles and intensity (Fig. 4–26). The resultant echo pattern is a collection of hyperechoic artifactual reflections distal to the structure with progressive attenuation of the sound wave.
Modes of Ultrasound
Gray-Scale Ultrasound
Gray-scale B-mode ultrasonography is the most commonly employed mode of ultrasound. This pulsed-wave technique produces real-time two-dimensional images consisting of shades of gray. The generation of this image involves assigning a pixel brightness to the amplitude of the returning sound waves received by the transducer. The position of the pixel is determined by the duration of the round trip of the sound wave. Individual lines of data are displayed sequentially on the monitor to produce a continuous or real-time image. Evaluation of gray-scale imaging requires the ability to recognize normal patterns of echogenicity from anatomic structures. Variations from these expected patterns of echogenicity indicate disorders of anatomy or physiology.
Doppler Ultrasound
The Doppler ultrasound mode depends on the physical principle of frequency shift when sound waves strike a moving object. The basic principle of Doppler ultrasound is that sound waves of a certain frequency will be shifted or changed on the basis of the direction and velocity of the moving object, as well as the angle of insonation. This phenomenon allows for the characterization of motion, most commonly the motion of blood through vessels, but it may also be useful for detecting the flow of urine.
Color Doppler ultrasonography allows for evaluation of the velocity and direction of motion. A color map may be applied to direction with the most common assignation of the color blue to motion away from the transducer and red for motion toward the transducer. The velocity of motion is designated by the intensity of the color; thus the brighter the color is, the more rapid the motion. Color Doppler may be used to evaluate the presence of absence of blood flow in the kidney, testes, penis, and prostate. It also may be useful in the detection of ureteral “jets” of urine emerging from the ureteral orifices.
Color Flow with Spectral Display is a mode that allows the interrogation of particular areas within an ultrasound image for flow and displays the flow as a continuous wave form. This mode is commonly used to evaluate the pattern and velocity of blood flow in the intrarenal or penile vasculature. The waveform provides information about peripheral vascular resistance in the tissues. The most commonly used index of these velocities is the resistive index. The resistive index is a ratio of peak systolic velocity minus the end-diastolic velocity over the peak systolic velocity. This index is helpful in characterizing a number of clinical conditions including renal artery stenosis, ureteral obstruction, and penile arterial insufficiency.
Power Doppler ultrasonography is a mode that assigns the amplitude of frequency change to a color map. This does not permit evaluation of velocity or direction of flow but is less affected by back-scattered waves and therefore a more sensitive mode for detecting blood flow. Power Doppler is less angle dependent than color Doppler and is three to five times as sensitive as color Doppler ultrasound for detecting flow.
Harmonic Scanning
Harmonic scanning makes use of aberrations related to the nonlinear propagation of sound waves within tissue. These asymmetrically propagated waves generate fewer harmonics, but those that are generated have greater amplitudes. Because these harmonics are not subject to scattering associated with the incident wave, there is less noise associated with the signal. By concentrating on the harmonic frequencies produced within the body and reflected to the transducer, it is possible to produce an image with less artifact and greater resolution (Fig. 4–27).
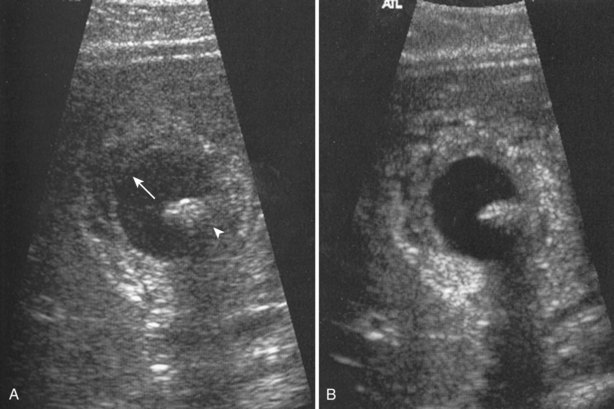
Figure 4–27 A, Standard gray-scale image of a cyst containing a mural nodule (arrowhead). Note the artifactual echogenicity within the cyst (arrow). B, The same structure on harmonic scanning is more clearly seen. There is less artifact within and distal to the cyst.
(From Rumack CM, Wilson, SR, Charboneau JW, Johnson J, editors. Diagnostic ultrasound. 3rd ed. St Louis: Elsevier; 2005. Fig. 1–17, p. 17.)
Spatial Compounding
Spatial compounding is a scanning mode whereby the direction of insonation is electronically altered and a composite image is generated. This technique reduces the amount of artifact and noise, producing a scan of better clarity.
Three-Dimensional Scanning
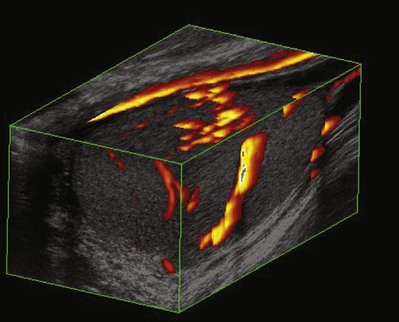
Three-dimensional (3-D) scanning has been used extensively in obstetrics and gynecology but so far has limited application in urology. 3-D scanning produces a composite of images (data set), which can then be manipulated to generate additional views of the anatomy in question (Fig. 4–28). 3-D rendering may be important in procedural planning and precise volumetric assessments (Ghani et al, 2008a, 2008b). 3-D scanning may allow the recognition of some tissue patterns that would otherwise be inapparent on two-dimensional scanning (Mitterberger et al, 2007b; Onik and Barzell, 2008).
Contrast Agents in Ultrasound
Intravenous compounds that contain microbubbles have been used for enhancing the echogenicity of blood and tissue. Microbubbles are distributed in the vascular system and create strong echoes with harmonics when struck by sound waves. The bubbles themselves are rapidly degraded by their interaction with the sound waves. Contrast agents may be useful in prostatic ultrasonography by enhancing the ability to recognize areas of increased vasculature. The use of intravenous ultrasound contrast agents is considered investigational but has shown promise in a number of urologic scanning situations (Mitterberger et al, 2007a; Wink et al, 2008).
Documentation
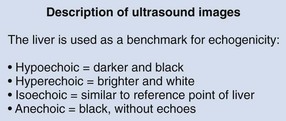
When urologists perform and interpret ultrasound studies, it is important that appropriate nomenclature be used to describe the objects imaged (Fig. 4–29). By convention, the liver is used as a benchmark for echogenicity. If a structure is hypoechoic, it means it is darker than the surrounding tissues. If it is hyperechoic, it means it is brighter than the surrounding tissues. Isoechoic means it is similar to the surrounding tissues. Structures that do not generate echoes are called anechoic. A simple cyst is an example of a structure with an anechoic interior. In general, a high water content causes tissue to appear hypoechoic. In general, a high fat content causes tissue to appear hyperechoic.
By convention, structures imaged by ultrasonography should be oriented so that the superior aspect of the structure is to the left as the image is viewed and the inferior aspect of the structure to the right. With paired structures it is critically important to document right or left. It is useful to use equipment-generated icons to illustrate patient position and the orientation of insonation (Fig. 4–30).
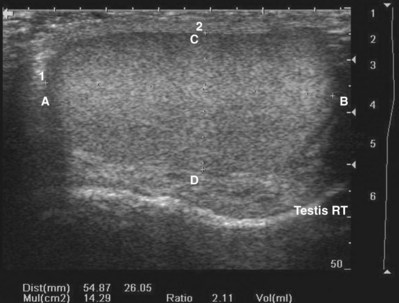
Figure 4–30 In this sagittal image of the right testis, the superior pole of the testis (A) is to the left, the inferior pole of the testis (B) is to the right. The anterior aspect of the testis (C) is at the top of the image and the posterior aspect (D) at the bottom. Without the label, there would be no way to distinguish the right from the left testis.
The appropriate number of images to be captured for documentation is the number necessary to document a systematic and complete examination and to document relevant pathology.
Patient Safety
Diagnostic ultrasonography transmits energy into the patient that has the potential to produce biologic effects. The two main categories of biologic effects are mechanical effects and thermal effects.
The mechanical effects of ultrasonography are torque and streaming. The mechanical effects of an acoustic field may produce a phenomenon called cavitation. Cavitation occurs when small gas-filled bubbles form and then collapse. These collapsing bubbles liberate a large amount of energy, which may cause damage to tissue in certain circumstances. Mechanical effects are most likely to be observed around gas-containing structures such as lung and bowel. The thermal effects of ultrasonography are primarily the result of tissue heating resulting from the absorption of energy. The amount of tissue heating is influenced by several factors including beam focusing, transducer frequency, exposure time, scanning mode, and tissue density.
To assist the sonographer in monitoring the bioeffects of ultrasound, the ultrasonography community has adopted the output display standard (ODS). Two values are typically displayed: the mechanical index (MI) and the thermal index (TI). These indices are calculated estimates of the potential for bioeffects of ultrasonography based on the mode of ultrasonography being used, frequency, power output, and time of insonation. The MI indicates the probability that cavitation will occur. For tissues not containing stabilized gas bodies (lung and intestine), the risk of cavitation is low as long as the MI is less than or equal to 0.7. For structures adjacent to lung or intestine, scanning time should be limited if the MI exceeds 0.4. The TI indicates the probability that tissue temperature within the sonographic field will be increased by 1° C. The precise consequences of tissue heating are not completely understood, but even tissue temperature elevations of up to 6° C are not likely to be dangerous unless exposure time exceeds 60 seconds. The MI and TI are typically displayed on the monitor during ultrasound examinations, and all practitioners should be familiar with the location. It is important to note that these indices are not safety limits.
In general, ultrasonography performed by urologists has a low risk for patient harm as long as standard protocols are followed (Fowlkes, 2008). Although tissue heating may occur, there are no confirmed biologic effects of tissue heating in nonfetal scanning except when they are sustained for extended periods. Users should be aware that for soft tissues not known to contain gas bodies, there is no basis in present knowledge to suggest an adverse nonthermal bioeffect from current diagnostic instruments not exceeding the U.S. Food and Drug Administration output limits (Fowlkes, 2008). Nevertheless, all urologists should endeavor to follow the principles of ALARA, which stands for “As Low As Reasonably Achievable.” The ALARA principle is intended to limit the total energy imparted to the patient during an examination. This can be accomplished by (1) keeping power outputs low, (2) using appropriate scanning modes, (3) limiting examination times, (4) adjusting focus and frequency, and (5) using the cine function during documentation.
In summary, ultrasound scanning offers an excellent, cost-effective modality for diagnosing and treating urologic conditions. The most important factor in ultrasound safety is the informed operator. Urologists should endeavor to perform limited examinations using consistent technique for specific indications. Patient safety and equipment maintenance should be emphasized in all the environments where ultrasound technology is used.
Clinical Urologic Ultrasound
The use of ultrasonography in urology has expanded dramatically because of its profound utility in the clinic and operating room. Long the mainstay of the diagnosis of prostatic disease, ultrasonography is increasingly being used by urologists in the clinical environment for initial diagnosis, interventional management, and longitudinal follow-up of urologic diseases.
Renal Ultrasound
Introduction
Urologists, by virtue of their intimate knowledge of surgical anatomy of the kidneys and retroperitoneum, are uniquely qualified to perform and interpret selected ultrasound examinations of the abdomen. These skills are relevant in both the office and the operating room environment. Urologists generally perform abdominal ultrasonography for a specific clinical indication and less often for general screening of the abdominal contents. Therefore in most clinical situations, a limited retroperitoneal examination is used in urologic practice.
Technique
The transducer normally used for renal ultrasonography is a curved array transducer of 3.5 to 5.0 MHz. Transducers of a higher frequency may be used for pediatric patients. For intraoperative and laparoscopic renal ultrasonography, a linear array transducer of 6 to 10 MHz is typically employed.
Scanning of the right kidney is performed with the patient supine. The kidney is located by beginning in the midclavicular line in the right upper quadrant. In the sagittal plane the transducer is moved laterally until the midsagittal plane of the kidney is imaged. Once the kidney has been imaged anteriorly and posteriorly in the sagittal plane, the probe is rotated 90 degrees counterclockwise. The midtransverse plane will demonstrate the renal hilum containing the renal vein. The kidney is scanned from upper pole to lower pole.
The technique and documentation for left renal ultrasonography is identical to that of the right side. However, the left kidney is slightly more cephalad than the right kidney. Bowel gas is more problematic on the left because of the position of the splenic flexure of the colon. Visualization of the left kidney often requires the patient to be turned into a lateral position. Ultrasound imaging of the left kidney lacks the liver as an acoustic window, and it is sometimes more difficult to image the left kidney in a true sagittal plane.
Indications
Normal Findings
It is helpful during scanning of the kidney to understand its anatomic position within the retroperitoneum. This assists identifying the midsagittal plane, which serves as a reference point for a complete examination (Fig. 4–31).
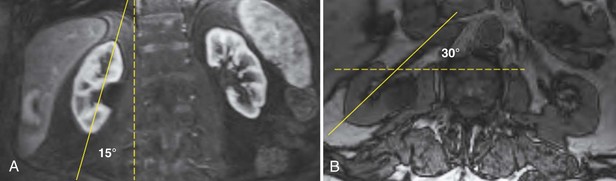
Figure 4–31 The lower pole of the kidney is displaced 15 degrees laterally compared with the upper pole (A). The kidney is rotated 30 degrees posterior to the true coronal plane (B). The lower pole of the kidney is slightly anterior compared with the upper pole.
The adult right kidney in the sagittal view demonstrates a cortex that is usually hypoechoic with respect to the liver. The central band of echoes in the kidney is a hyperechoic area that contains the renal hilar adipose tissue, blood vessels, and collecting system. Acoustic shadowing from ribs overlying the inferior pole can be eliminated by moving the probe to a more lateral position or into the intercostal space. By having the patient take a deep breath, the kidney can be moved inferiorly to assist complete imaging (Fig. 4–32).
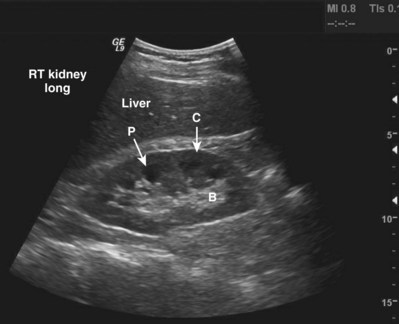
Figure 4–32 Midsagittal plane of the kidney. Note the relative hypoechogenicity of the renal pyramids (P) compared with the cortex (C). The central band of echoes (B) is hyperechoic compared with the cortex. The midsagittal plane will have the greatest length measurement pole to pole. A perfectly sagittal plane will result in a horizontal long axis of the kidney.
The echogenicity of the kidney varies with age. The renal cortex of an infant is relatively hyperechoic compared with that of an adult. In addition, there is a smaller and less apparent central band of echoes in the infant. In the adult, the echogenicity of the renal cortex is usually hypoechoic with respect to the liver (Emamian et al, 1993a). In patients with chronic medical renal diseases the renal cortex is often thinned and isoechoic or hyperechoic with respect to the liver (O’Neill, 2001).
Renal size changes over the lifetime of an individual. Nomograms for pediatric renal size should be consulted. These are based on age, height, and weight of the patient. The average adult kidney measures 10 to 12 cm in length and 4 to 5 cm in width. Measurements of renal volume may be appropriate in cases of severe renal impairment. Renal measurements should be obtained in the midsagittal plane and midtransverse plane. Measurements taken in other than the midsagittal plane and midtransverse may be spuriously low. The thickness of the parenchyma is the average distance between the renal capsule and the central band of echoes. The precise location for making this measurement is somewhat subjective. The midlateral renal parenchyma in the sagittal view is a common choice for obtaining this measurement (Fig. 4–33). Although there is no universal standard, the renal cortical thickness should be greater than 7 mm (Roger et al, 1994), and the renal parenchymal thickness should be greater than 15 mm in adults (Emamian et al, 1993b).
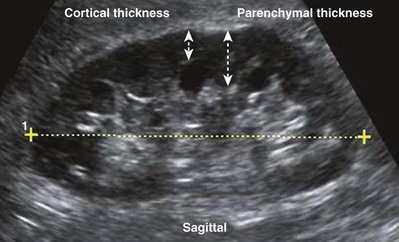
Figure 4–33 The distinction between renal cortical thickness and renal parenchymal thickness is that the renal parenchyma is measured from the central band of echoes to the renal capsule. The renal cortex is measured from the outer margin of the medullary pyramid to the renal capsule.
Doppler ultrasound may be helpful in evaluating the renal artery and renal vein and assessing the vascular resistance in the kidney. Doppler modes may also be useful in evaluating neovascularity associated with renal tumors and in correctly characterizing hypoechoic structures in the renal pelvis such as a parapelvic cyst, the renal vein, or the dilated collecting system.
Limitations
Some patients are not favorable candidates for renal ultrasonography. Obesity, intestinal gas, and physical deformity may be impediments to complete renal evaluation. Renal ultrasonography has poor sensitivity for renal masses less than 2 cm (Warshauer et al, 1988). There is a lack of specificity for renal tumor type except for angiomyolipoma. Angiomyolipoma has characteristics that are distinctive on ultrasonography (highly echoic), but some small renal cell carcinomas have been shown to be indistinguishable from angiomyolipoma by ultrasound criteria (Yamashita et al, 1992; Forman et al, 1993).
Transabdominal Pelvic Ultrasound
Introduction
Transabdominal pelvic ultrasonography is a tremendously versatile tool for the urologist. It is a noninvasive method for evaluating the lower urinary tract and prostate in men and the bladder in women. A curved array transducer of 3.5 to 5 MHz is most commonly employed to perform transabdominal ultrasonography. In pediatric patients a higher-frequency transducer may be used. In cases where only a residual urine or bladder volume is to be determined, an automated bladder scanner is often employed.
Technique
Bladder ultrasonography is most commonly performed with the patient supine and the sonographer on the patient’s right side. The scan should be performed in a warm room, and the patient draped to provide for comfort and privacy. If necessary, a roll may be placed beneath the patient’s hips. Scanning technique depends on the circumstances and the reason for the examination but in general should be performed with a moderately filled bladder. The bladder should be scanned in a sagittal and transverse manner angling the probe into the pelvis so that the bladder can be visualized beneath the pubic bone. Although the prostate cannot be imaged with the same resolution achieved during transrectal scanning, the size and morphology of the prostate can be demonstrated. Although transabdominal scanning is the most common means of evaluating the bladder, the bladder may also be assessed via a transvaginal and transrectal approach. These approaches are useful in patients who are obese or who are not suitable candidates for transabdominal scanning.
Normal Findings
Transabdominal pelvic ultrasonography should include evaluation of the lumen of the bladder, as well as bladder wall configuration and thickness. The presence of specific lesions such as stones or tumors should be documented. The structures immediately surrounding the bladder may also be evaluated including the distal ureters, the prostate in men, and the uterus and ovaries in women (Fig. 4–34). The emergence of urine from the ureteral orifices (ureteral jets) can be demonstrated. The clinical value of demonstrating ureteral jets has been questioned. Up to 10 minutes of continuous observation may be required to verify the absence of a ureteral jet (Fig. 4–35) (Delair and Kurzrock, 2006).
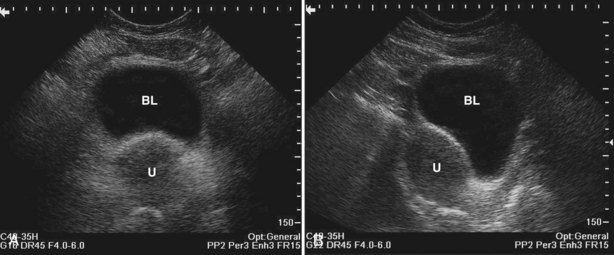
Figure 4–34 A, Transverse view of the bladder in this female patient demonstrates the uterus (U). B, Sagittal view of the bladder shows the uterus posterior to the bladder.
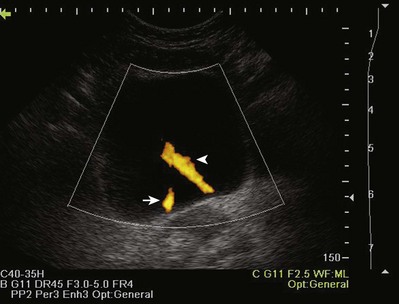
Figure 4–35 In this transverse view of the bladder, urine “jets” emerging from the left (arrow) and right (arrowhead) ureteral orifices are demonstrated by power Doppler.
Bladder volume can be calculated manually by obtaining measurements in the midtransverse and midsagittal planes (Fig. 4–36). Numerous studies have shown that for bladder volumes between 100 and 500 mL, such calculated volumes are within 10% to 20% of the actual bladder volume (Roehrborn et al, 1986).
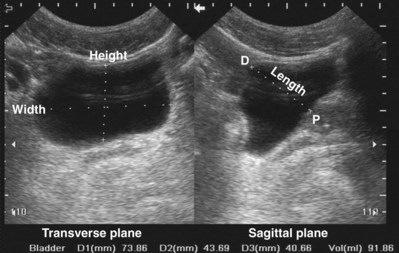
Figure 4–36 Measurement of bladder volume using this formula: bladder volume = width (transverse plane) × height (transverse plane) × length (midsagittal plane) × 0.625. In the sagittal plane, the dome (D) of the bladder is to the left and the prostate (P) to the right.
Measuring bladder wall thickness may assist the clinician in understanding the degree of bladder outlet obstruction (Fig. 4–37). Bladder wall thickness varies depending on the volume of urine in the bladder and on which part of the bladder wall is measured. It has been shown that measuring bladder wall thickness may predict bladder outlet obstruction with greater accuracy than free uroflowmetry, postvoid residual urine, and prostate volume (Oelke et al, 2007).
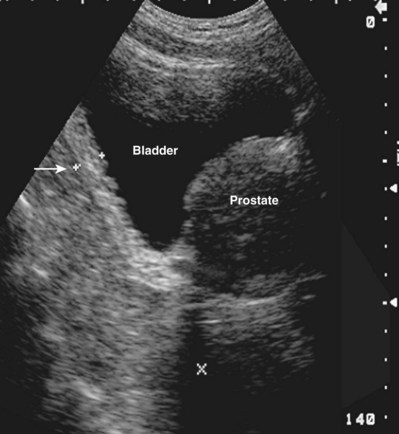
Figure 4–37 Bladder wall thickness may provide information about bladder outlet obstruction. In this sagittal view, bladder wall thickness is measured posteriorly (arrow) near the midline. Note the trabeculation of the relatively hyperechoic bladder wall.
Transabdominal prostatic ultrasonography requires angling the probe beneath the pubic bone. In the transverse plane the transducer is fanned inferiorly until the largest transverse diameter of the prostate is identified. Measurements of the transverse width and height are obtained (Fig. 4–38A). The transducer is then rotated 90 degrees clockwise to produce a true sagittal image of the prostate. The transducer is fanned until the midline is identified. This is recognized by a v-shaped indention at the bladder neck (Fig. 4–38B). Depending on the degree of prostatic hypertrophy and the presence or absence of a middle lobe, this “v” may be more or less apparent and more or less anterior or posterior in its position. A sagittal measurement is made from the bladder neck to the apex of the prostate. The apex of the prostate may be identified by using the hypoechoic urethra as a guide.
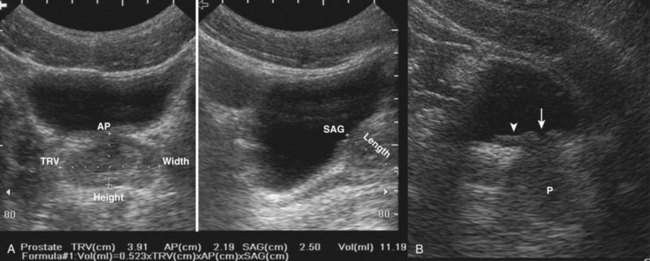
Figure 4–38 A, Transabdominal ultrasound is extremely useful for measuring prostatic volume and evaluating prostatic morphology. The volume of the prostate can be calculated using this formula: prostate volume (mL) = width (cm) × height (cm) × length (cm) × 0.523. B, In this midsagittal view of the prostate, the bladder neck is identified as a V-shaped indentation (arrow). Note the characteristically hyperechoic trigone (arrowhead).
The degree of protrusion of the prostate into the bladder may have some predictive value for bladder outlet obstruction. It has been shown that intravesical prostatic protrusion correlates relatively well with formal urodynamic evaluation of bladder outlet obstruction (Chia et al, 2003; Keqin et al, 2007). The measurement is obtained by drawing a line corresponding to the bladder base on sagittal scan and measuring the perpendicular distance from bladder base to greatest protrusion of the prostate into the bladder (Fig. 4–39).
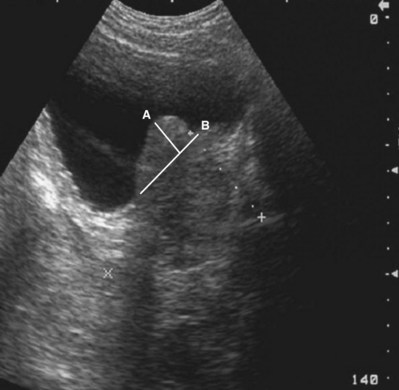
Figure 4–39 In this sagittal view of the prostate, the middle lobe extends into the bladder (A). The bladder base is defined by the line (B). The length of line (A) is the intravesical prostatic protrusion (IPP).
Transabdominal ultrasonography of the prostate is useful in characterizing prostatic urethral length, the size and configuration of the middle lobe of the prostate, and some secondary information about the physiology of bladder outlet obstruction. This information is valuable in treatment planning for bladder outlet obstruction.
Limitations
Transabdominal pelvic ultrasonography yields limited information in patients with an empty bladder. The ability to identify distal ureteral obstruction, bladder stones, and bladder tumors requires a full bladder. Although prostatic morphology and volume can be assessed with an empty bladder, it is much easier when the bladder is full. Pelvic structures may be difficult to evaluate in patients with a protuberant abdomen or panniculus. Automated measurement of bladder volume or residual urine, though using ultrasonography, is not an imaging study. Lack of imaging confirmation can lead to inaccurate residual urine determinations in patients with obesity, clot retention, ascites, bladder diverticulum, or perivesical fluid collection (e.g., urinoma, lymphocele).
Ultrasonography of the Scrotum
Introduction
No aspect of urologic care is better suited to the use of ultrasonography than evaluation of the scrotum. Urologists have a surgical understanding of the anatomy and extensive experience with the diagnosis and treatment of disorders that affect the scrotum. Because the scrotum and its contents are superficial, high-frequency transducers may be employed to yield excellent and detailed anatomic and physiologic information. Imaging information can be correlated with findings on direct physical examination.
Technique
Sound technique is critical to performing adequate ultrasonography of the scrotum. In general, the examination should be carried out in a quiet room that is adequately warm for patient comfort. The patient should be supine with the scrotum supported on a towel or on the anterior thighs. The patient should be draped in such a way as to hold the penis out of the way and to ensure patient privacy. Copious amounts of conducting gel should be used to provide a good interface between the transducer and the scrotal skin because air trapping by scrotal hair will result in unwanted artifacts. Complete but gentle contact between skin and transducer is essential because excessive pressure results in movement of testis or compression of the testis. Compression may change echogenicity and obscure fine anatomic detail. In addition, compression may significantly alter volume measurements.
Scrotal ultrasonography is performed with a high-frequency linear array transducer, generally in the range of 6 to 12 MHz. Transducers may be 4 to 7.5 cm in width. Some sonographers prefer the maneuverability of a 4-cm transducer, whereas others prefer the longer 7.5-cm transducer for its ability to simultaneously image the entire testis in the sagittal plane. Imaging should be done in a systematic fashion and should include sagittal and transverse views of the testis. The sagittal view should proceed from the midline medially and then laterally and from the midtransverse section of the testis to the upper pole and the lower pole of the testis. In addition to the testis, the epididymis and entire scrotal contents should be imaged.
Normal Findings
It is important to document the size and, if appropriate, the volume of the testes. The echo architecture of the testis should be described (Fig. 4–40). It is important to compare the testes for echogenicity because some infiltrative processes may result in diffuse changes in a testis that would only be noticed when that testis is compared with its contralateral mate (Fig. 4–41). For example, lymphomatous or leukemic involvement of the testis may result in a diffusely hypoechoic and homogeneous appearance, which may be unilateral (Mazzu et al, 1995).
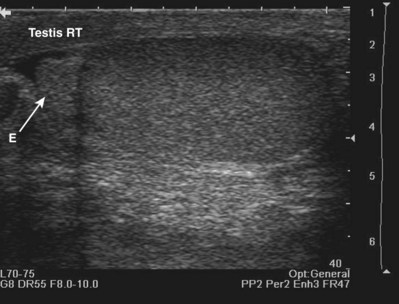
Figure 4–40 In this longitudinal view the head of the epididymis (E) is seen to the left, and the lower pole of the testis is to the right. Normal testicular sonographic anatomy is characterized by a homogeneous finely granular appearance of the testis.
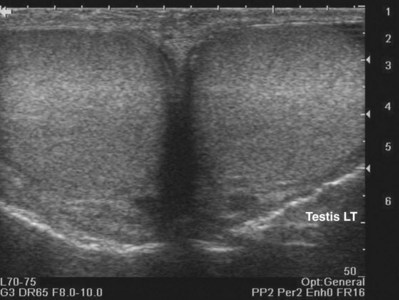
Figure 4–41 Simultaneous bilateral views are important to rule out a diffuse infiltrative process such as lymphoma. A diffuse and homogenous change in echogenicity in one testis could otherwise be unappreciated. In this example, the testes are symmetric and normal.
If paratesticular fluid is present, the epididymis and the testicular and epididymal appendages are more easily identified (Fig. 4–42).
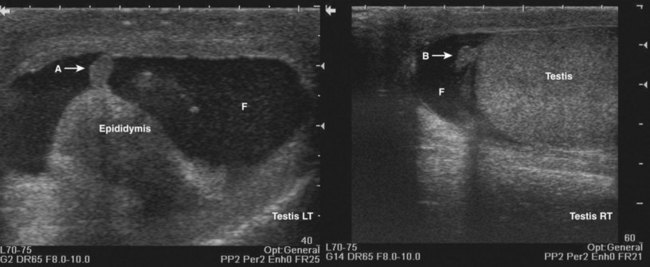
Figure 4–42 The presence of paratesticular fluid (F) permits the identification of the appendix epididymis (A) and the appendix testis (B).
Normal testicular blood flow may be demonstrated with color or power Doppler (Barth and Shortliffe, 1997) (Fig. 4–43). Intratesticular blood flow is low velocity with the average peak systolic velocity (PSV) of less than 10 cm/sec (Middleton et al, 1989). Intratesticular blood flow is primarily supplied by the testicular artery, which ultimately divides to supply the individual testicular septa. The fibrous septa coalesce to form the mediastinum testis, which is a hyperechoic linear structure seen in the sagittal plane (Fig. 4–44).
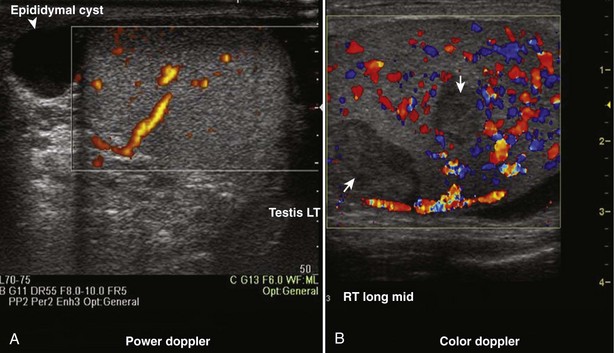
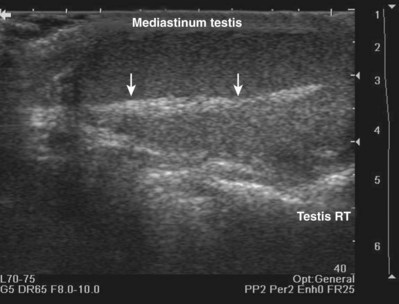
Limitations
Caution should be used when interpreting Doppler flow studies in the evaluation of suspected testicular torsion. The hallmark of testicular torsion is the absence of intratesticular blood flow (Fig. 4–45). Paratesticular flow in epididymal collaterals may appear within hours of torsion. Comparison with the contralateral testis should be performed to ensure that the technical attributes of the study are adequate to demonstrate intratesticular blood flow.
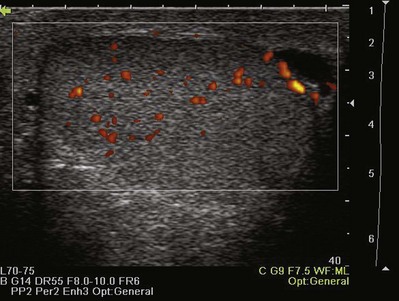
Ultrasonography of the Penis and Male Urethra
Introduction
Ultrasonography of the penis and male urethra provides exquisite anatomic detail and may be used in many cases in lieu of studies requiring ionizing radiation.
Technique
Penile and urethral ultrasonography is performed with a 6- to 12-MHz linear array transducer. The technique for penile and urethral ultrasonography includes imaging the phallus in the longitudinal and transverse plane. The examination should be performed in a systematic fashion beginning at the base of the penis and proceeding distally to the glans. It is possible to get an image of the proximal urethra and corporal bodies by scanning through the scrotum or the perineum.
It may be helpful when evaluating the penile urethra, especially for stricture disease, to inject gel into the urethra in a retrograde fashion. This distends the urethra and allows better identification of urethral anatomy and the anatomy of the corpus spongiosum.
Normal Findings
Transverse scanning of the phallus reveals the two corpora cavernosa dorsally and the urethra ventrally. The sagittal view of the phallus demonstrates the corpora cavernosa with a hyperechoic, double linear structure representing the cavernosal artery (Fig 4–46). The corpus spongiosum is isoechoic to slightly hypoechoic and contains the coapted urethra. The urethra is collapsed except during voiding.
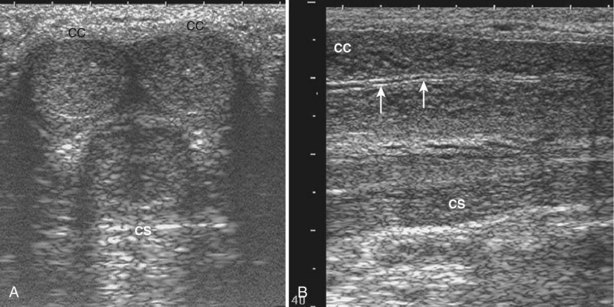
Figure 4–46 A, In the transverse plane scanning from the dorsal surface of the midshaft of the penis the corpora cavernosa (CC) are paired structures seen dorsally while the corpus spongiosum (CS) is seen ventrally in the midline. B, In the parasagittal plane the corporus cavernosum (CC) is dorsal with the relatively hypoechoic corpus spongiosum (CS) seen ventrally. Within the corporus cavernosum the cavernosal artery is identified as a bright hyperechoic structure (arrows).
Transrectal Ultrasonography of the Prostate
Transrectal ultrasonography of the prostate (TRUS) is the sonographic imaging procedure most commonly performed by urologists. The technique, indications, normal findings, and complications are discussed in Chapter 97.
Key Points
Ultrasonography
Nuclear Scintigraphy
Radionuclide imaging is the procedure of choice to evaluate renal obstruction and function. It is sensitive to changes that induce focal or global changes in kidney function. Because neither gadolinium nor iodinated intravenous contrast agents are used, scintigraphy does not damage the kidney, has no lingering toxicity, results in minimal absorbed radiation, and is free from allergic reactions. Compared with other diagnostic imaging studies such as retrograde pyelogram, renal scintigraphy is noninvasive, has minimal risk, minimal discomfort, and allows determination of the function of the kidney.
Once the agent is injected IV, gamma scintillation cameras measure radiation emitted from the radioisotope and digital workstations gather, process, and display the information. There is an extensive list of radiopharmaceuticals used for renal scintigraphy. This section is limited to those agents most commonly used in urologic practice.
Technetium 99m-diethylene triamine pentaacetic acid (99mTc-DTPA) is primarily a glomerular filtration agent (Peters, 1998; Gates, 2004). It is most useful for evaluation of obstruction and renal function. Because it is excreted through the kidney and dependent on glomerular filtration rate (GFR), it is less useful in patients with renal failure because impaired GRF may limit adequate evaluation of the collecting system and ureters. It is readily available and relatively inexpensive (Klopper et al, 1972).
Technetium 99m-dimercaptosuccinic acid (99mTc-DMSA) is cleared by both filtration and secretion.
99mTc-DMSA localizes to the renal cortex with little accumulation in the renal papilla and medulla (Lin et al, 1974). Therefore it is most useful for identifying cortical defects and ectopic or abhorrent kidneys. With these properties, 99mTc-DMSA can distinguish a benign functioning abnormality in the kidney from a space-occupying malignant lesion, which would not have normal renal function. No valuable information on the ureter or collecting system can be obtained with 99mTc-DMSA, but it remains a standard for renal cortical imaging.
Technetium 99m-mercaptoacetyl triglycine (99mTc-MAG3) is an excellent agent for imaging due to its photon emission, 6-hour half-life, and ease of preparation. It is cleared mainly by tubular secretion (Fritzberg et al, 1986). A small amount, approximately 10%, of MAG3 is excreted by extrarenal means and most of this is hepatobiliary excretion (Eshima et al, 1990; Itoh, 2001). Because it is extensively bound to protein in plasma, it is limited in its ability to measure GFR but is an excellent choice for patients with renal insufficiency and urinary obstruction. The tracer is well suited for evaluation of renal function and diuretic scintigraphy. Also, it is an excellent tracer to evaluate renal plasma flow.
Diuretic Scintigraphy
Nuclear medicine imaging plays a crucial role unmet by CT, MRI, or ultrasonography in the diagnosis of upper tract obstruction and its unique characteristics provide noninvasive information regarding dynamic renal function. The diuretic renal scan using 99mTc-MAG3 is able to provide differential renal function and clearance time comparing right and left kidneys, which is pivotal in patient management. The initial phase is the flow phase in which 2-second images are gathered for 2 minutes and then 1-second images for 60 seconds. The flow phase shows renal uptake, background clearance, and abnormal vascular lesions, which may indicate arteriovenous malformations, tumors, or active bleeding. In the second phase the renal phase, time-to-peak uptake is typically between 2 and 4 minutes. The renal phase is the most sensitive indicator of renal dysfunction. One-minute images are taken for 30 minutes. In the final phase, the excretory phase, 1-minute images are taken for 30 minutes. A diuretic (usually furosemide 0.5 mg/kg) is administered when maximum collecting system activity is visualized. The T1/2 is the time it takes for collecting system activity to decrease by 50% from that at the time of diuretic administration. This is highly technician dependent because the diuretic must be given when the collecting system is displaying maximum activity. Transit time through the collecting system in less than 10 minutes is consistent with a normal, nonobstructed collecting system. T1/2 of 10 to 20 minutes shows mild to moderate delay and may be a mechanical obstruction. The patient’s perception of pain after diuretic administration can be helpful for the treating urologist to consider when planning surgery in the patient with middle to moderate obstruction. A T1/2 of greater than 20 minutes is consistent with a high-grade obstruction. Level of obstruction can usually be determined, as can abnormalities such as ureteral duplication (Ell and Gambhir, 2004). A normal renal scan is shown in Figure 4–47.
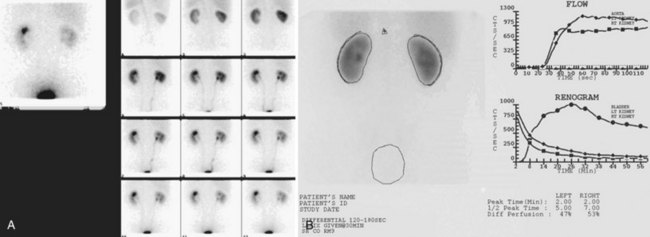
Figure 4–47 A, Technetium 99m mercaptoacetyl triglycine (99mTc-MAG3) perfusion images demonstrate normal, prompt, symmetric blood flow to both kidneys. B, Perfusion time-activity curves demonstrating essentially symmetric flow to both kidneys. Note the rising curve typical of 99mTc-MAG3 flow studies. Dynamic function images demonstrate good uptake of tracer by both kidneys and prompt visualization of the collecting systems. This renogram demonstrates prompt peaking of activity in both kidneys. The downslope represents prompt drainage of activity from the kidneys. Printout of quantitative data shows the differential renal function to be 47% on the left, 53% on the right. The normal half-life for drainage is less than 20 minutes when 99mTc-MAG3 is used. The T1/2 is 5 minutes on the left and 7 minutes on the right, consistent with both kidneys being unobstructed.
Hepatobiliary excretion can cause false-positive readings if the area of intestinal activity or gallbladder activity is included in the area of interrogations during the study (Fig. 4–48).
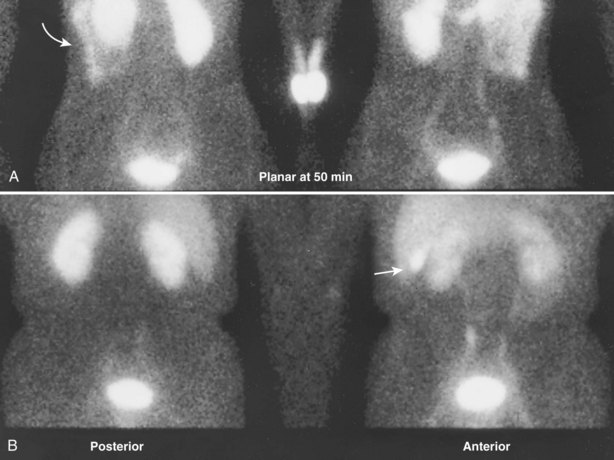
Figure 4–48 Delayed static images in the posterior and anterior projections demonstrate intestinal activity (arrow in A) and gallbladder activity (arrow in B), reflecting a normal mode of excretion of technetium 99m mercaptoacetyl triglycine (99mTc-MAG3). Gallbladder activity, in particular, can cause false-positive interpretation when it overlies activity in the renal collecting system or is inappropriately included in the area of interrogation. Liver activity is variable and tends to be more pronounced in children and patients with renal insufficiency.
The diuretic renal scan is another imaging study where communication with the interpreting physician is vital for correct performance of the test, as well as appropriate interpretation. For example, there are times when patients with unilateral or bilateral ureteral stents are sent for diuretic scintigraphy to determine differential renal function. If a bladder catheter is not placed and open to drainage during the diuretic renal scan, the radiopharmaceutical excreted from the healthy kidney may wash up into or back flow via the ureteral stent into the stented kidney, giving the false-positive appearance to have more function that is physiologically present. This false-positive test may lead to inappropriately reconstructing a kidney that in reality has little or insufficient function.
Nuclear Medicine in Urologic Oncology
Whole Body Bone Scan
Conventional radionuclide imaging in urologic malignancy has long been the standard for detecting bone metastasis. The whole body bone scan or skeletal scintigraphy is the most sensitive method for detecting bone metastasis (Narayan et al, 1988). A “positive” bone scan is not specific for cancer and may require plain film radiography, CT, or MRI to confirm, as well as correlation with prior history of bone fractures, trauma, surgery, or arthritis. In patients with diffuse metastatic bone involvement, the bone scan can be mistaken for normal because there is uniformly increased uptake in the boney structures (Kim et al, 1991).
Positron Emission Tomography
The most recent advance in nuclear scintigraphy is in the detection of primary and metastatic cancer using positron emission tomography (PET). Molecular imaging with PET may help individualize the surgical and medical care of urologic oncology patients. PET is certainly having an impact in general oncology and is being actively investigated for use in urologic malignancies. The exact role in the practice of urology has yet to be determined but will certainly have a great role in the future as more tracers specific to urologic cancers are discovered. Using the combination of nuclear imaging and ever-increasing knowledge about cancer cell biology, radiotracers have been developed to be incorporated into dividing cells or cellular mechanisms involved in the increased metabolic activity of malignancies, which can then be detected using PET imaging. Combining PET with high-resolution CT (PET/CT) has the ability to increase our detection of recurrent or metastatic urologic cancers. Many different isotopes are being investigated for the detection of metastatic disease. One example is 18F fluorodeoxyglucose (FDG), which was first introduced in 1976. This isotope takes advantage of increased glycolysis and decreased dephosphorylation in some malignant cells. The 18F fluorodeoxyglucose is transported into cancer cells, where it is preferentially retained relative to normal tissue. This allows detection of some primary and metastatic cancers using PET/CT imaging.
There are some data on the use of PET/CT in testis cancer, where PET/CT was found to have a higher diagnostic accuracy than CT for staging and restaging in the assessment of a CT-visualized residual mass following chemotherapy for seminoma and nonseminomatous germ cell tumors (Albers et al, 1999; Hain et al, 2000). There may be a role for detection of recurrent nonteratoma disease and the assessment of residual masses after chemotherapy. In a series of seminoma patients who were evaluated postchemotherapy for residual retroperitoneal masses, PET was accurate in 14/14 patients with tumors greater than 3 cm and in 22/23 patients with lesions less than 3 cm. Overall the sensitivity and specificity was 89% and 100%, respectively (De Santis et al, 2004). The accuracy of PET seems to be compromised if performed within 2 weeks of completion of chemotherapy, likely due to decreased metabolism and increased macrophage activity (Eary, 1999). It is recommended that PET/CT be delayed for 4 to 12 weeks following completion of chemotherapy (Shvarts et al, 2002).
PET/ CT may have a promising role in clear cell renal cell carcinoma. An antibody (cG250) recognizing carbonic anhydrase IX has been developed. Carbonic anhydrase IX is a protein related to the unrestrained growth of clear cell renal cancers. A positron-emitting radionuclide (iodine 124) has been attached to the cG250 antibody and injected into renal cell cancer patients. The radionuclide antibody complex attaches to the carbonic anhydrase IX protein from clear cell renal cancer cells and can be detected on PET/CT imaging. Using this scheme in 26 patients with renal tumors, before surgery, there was 94% sensitivity and 100% specificity in renal cell carcinoma (Larson and Schröder, 2008).
At least seven tracers are being investigated for detection of metastatic prostate cancer. Each tracer is directed at a different part of cell function such as glycolysis, amino acid transport, choline kinase activity, fatty acid synthesis, androgen receptor, and bone mineralization. FDG as a PET tracer was investigated in 91 patients with PSA recurrence after radical prostatectomy. FDG-PET was able to detect local or systemic recurrence in only 34% of patients (Schröder et al, 2005).
Few studies have addressed the use of PET in bladder cancer. FDG is renal excreted and not useful in bladder cancer. Only 78% of bladder cancer could be visualized using 11C-methioninie tracer, and PET did not improve local staging of the disease. 11 C-choline was also found to be a poor predictor of primary or metastatic urothelial carcinoma (Ahlstrom et al, 1996; de Jong et al, 2002).
PET/CT in urologic oncology is in its infancy. With a seemingly countless number of potential targets for tracers, it will be many years into the future before it defines its role and use in urology. PET has the capability of demonstrating in vivo gene expression. As a result, the ultimate utility may transcend diagnostic imaging and allow determination of the efficacy of targeted gene therapy.
PET is still in the early stages of investigation for urologic tumors. It is more sensitive for detection of seminoma and nonseminoma after chemotherapy compared with CT imaging.
Key Points
Nuclear Scintigraphy
Computed Tomography
The 1979 Nobel Prize in Medicine and Physiology was awarded to Allan M. Cormack and Sir Godfrey N. Hounsfield for the development of computer-assisted tomography. Although basic principals remain the same, significant advances over the past 30 years have resulted in the development of multidetector CT devices, improving soft tissue detail and allowing the possibility of rapid 3-D reconstruction of the entire genitourinary system.
CT has become one of the most integral parts of urologic practice, and the CT urogram (CTU) has replaced IVU as the imaging modality of choice in modern urology for the workup of hematuria, urologic malignancies, detection of kidney stones, and preoperative planning. As in the case of conventional radiographic imaging, the basis for CT imaging is the attenuation of x-ray photons as they pass through the patient. Tomography is an imaging method that produces 3-D images of internal structures by recording the passage of x-rays as they pass through different body tissues. In the case of CT, a computer reconstructs cross-sectional images of the body on the basis of measurements of x-ray transmission through thin slices of the body tissue (Brant, 1999). A collimated x-ray beam is generated on one side of the patient, and the amount of transmitted radiation is measured by a detector placed on the opposite side of the x-ray beam. These measurements are then repeated systematically, while a series of exposures from different projections is made as the x-ray beam rotates around the patient. The result is production of a 3-D image of internal structures in the human body by recording the passage of different energy waves through various internal structures. Data collected by the detectors is as reconstructed by computerized algorithms to result in a viewable tomographic display.
Several different imaging variables are adjusted to allow adequate, detailed image resolution, while minimizing the time on the scanner and limiting exposure to radiation. The variable application of pitch, beam collimation, detector size, and tube voltage are used by the radiologist and imaging technologist for ideal image requisition. A detailed description of each of these variables is beyond the scope of this chapter. (See “Suggested Readings” later.)
Perhaps the greatest recent advancement in CT is the use of helical image acquisition techniques with multichannel detectors or multidetectors (MDCT). In a helical CT the patient moves through a continuously rotating gantry. The helical raw images are processed using interpolation algorithms in order to visualize the internal structures as sagittal, coronal, or axial reconstructed images. The “single-slice spiral CT,” introduced in 1988, had a single row of detectors and required multiple passes to visualize a small area of interrogation. The scanners in use today have more than 64 rows of detectors, which allow the patient’s entire body to be imaged during a single breath hold, with few or no motion artifacts (Wang and Vannier, 1994; Mahesh, 2002) (Fig. 4–49).
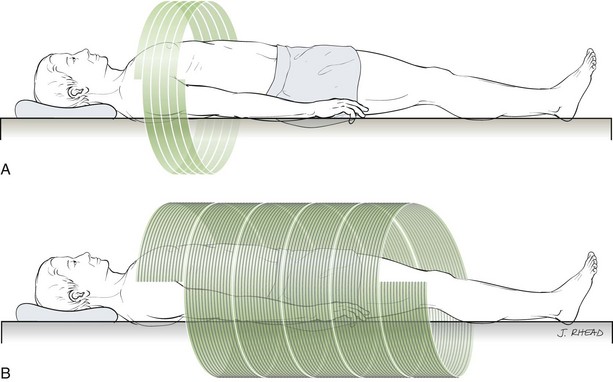
Figure 4–49 A, A computed tomography scanner with a single-row detector requires five circular passes around the patient to image a small area of the patient’s body. B, With a 16-slice, multirow detector the chest, abdomen, and pelvis can be imaged with five circular passes, easily obtained during a single breath hold. The thin slices offered by the 16-slice detector offer much greater detail of internal structures.
MDCT offers the advantages of faster scanning, fewer motion artifacts, thinner imaging sections, more precise diagnostic accuracy, increased concentration of contrast material, shorter scanning time, and significant increase in anatomic coverage with a single scan. For example, a 16-slice MDCT can scan the chest, abdomen, and pelvis in 20 seconds.
Readily available software is capable of 3-D processing of CT images to recreate the urinary system. These 3-D images offer improved preoperative planning, appreciation of proximity to adjacent organs, the ability to define vasculature, and improved communication with patients, who can now easily see their particular pathology and better appreciate the challenges faced by their surgeon (Fig. 4–50).
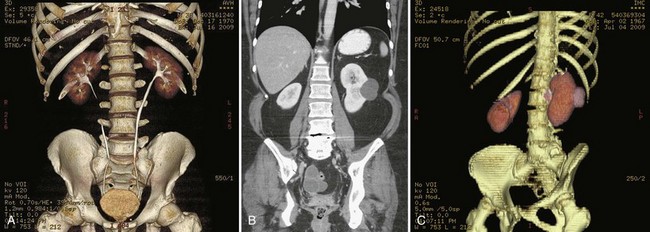
Figure 4–50 A, Three-dimensional (3-D) colored reconstruction of the kidneys ureter and bladder from computed tomography urogram. B, Coronal reconstruction in a patient with a clear cell renal cell carcinoma in a complex renal cystic mass and enhancing mural nodule. C, 3-D Reconstruction of the same patient with slight posterior rotation.
Real-time CT fluoroscopy is now available as an option on new CT imaging equipment. CT fluoroscopy gives a 3-D CT image that is much more detailed and offers greater soft tissue contrast and resolution than conventional CT. The most common use in urology is for biopsy of the kidney. CT fluoroscopy helps to overcome movement of the kidney during respiratory variation. It has also been used for fluid aspiration, drain placement, catheter placement, percutaneous cryoablation, and radiofrequency ablation of renal tumors. One significant disadvantage of CT fluoroscopy is increased radiation exposure to the patient and radiologist or surgeon performing the procedure (Daly et al, 1999; Keat, 2001; Gupta et al, 2006).
The CTU is an excretory urography in which MDCT is used for imaging of the urinary tract. It is indicated in the workup of hematuria, kidney stones, renal masses, renal colic, and urothelial tumors. The CT scan examination starts with the physician’s request for imaging. Radiologists around the world appreciate, from the urologist, a brief description of the question to be answered by the CT scan. Equipped with a better understanding of why the CT was ordered, the radiologist and the CT technician can adjust different CT variables and choose the appropriate contrast media needed to deliver a valuable report back to the ordering urologist.
Urologists often request a CT evaluation of the abdomen and pelvis. An abdominal CT starts at the diaphragm and ends at the iliac crest. If the pelvis is to be imaged, a separate request is usually required. The pelvic CT begins at the iliac crest and terminates at the pubis symphysis. Intravenous contrast may be required for better delineation of soft tissue. Oral contrast is not commonly used in urology but may be helpful in certain cases to differentiate bowel from lymph nodes, scar, or tumor (Fig. 4–51)
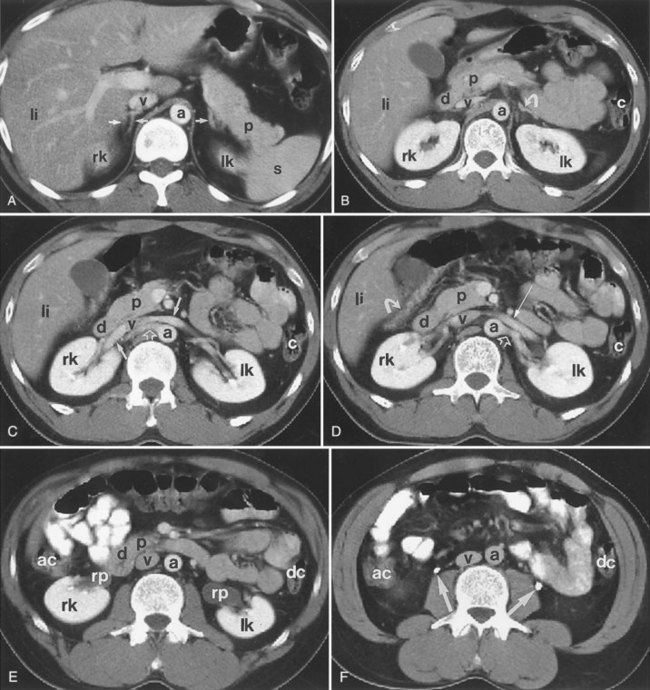
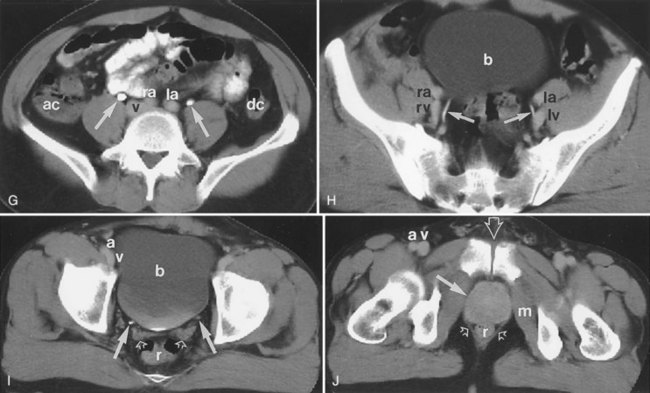
Figure 4–51 Computed tomography (CT) of the abdomen and pelvis demonstrating normal genitourinary anatomy. A, The adrenal glands are indicated with arrows. The upper pole of the right and left kidneys is indicated with rk and lk, respectively. a, aorta; li, liver; p, pancreas; s, spleen; v, inferior vena cava. B, Scan through the upper pole of the kidneys. The left adrenal gland is indicated with an arrow. a, aorta; c, colon; d, duodenum; li, liver; lk, left kidney; p, pancreas; rk, right kidney; v, inferior vena cava. C, Scan through the hilum of the kidneys. The main renal veins are indicated with solid arrows, and the right main renal artery is indicated with an open arrow. a, aorta; c, colon; d, duodenum; li, liver; lk, left kidney; p, pancreas; rk, right kidney; v, inferior vena cava. D, Scan through the hilum of the kidneys slightly caudal to C. The left main renal vein is indicated with a solid straight arrow, and the left main renal artery is indicated with an open arrow. The hepatic flexure of the colon is indicated with a curved arrow. a, aorta; c, colon; d, duodenum; li, liver; lk, left kidney; p, pancreas; rk, right kidney; v, inferior vena cava. E, Scan through the mid to lower polar region of the kidneys. a, aorta; ac, ascending colon; d, duodenum; dc, descending colon; lk, left kidney; p, pancreas; rk, right kidney; rp, renal pelvis; v, inferior vena cava. F, CT scan obtained below the kidneys reveals filling of the upper ureters (arrows). The wall of the normal ureter is usually paper thin or not visible on CT. a, aorta; ac, ascending colon; dc, descending colon; v, inferior vena cava. G, Contrast filling of the midureters (arrows) on a scan obtained at the level of the iliac crest and below the aortic bifurcation. ac, ascending colon; dc, descending colon; la, left common iliac artery; ra, right common iliac artery; v, inferior vena cava. H, The distal ureters (arrows) course medial to the iliac vessels on a scan obtained below the promontory of the sacrum. b, urinary bladder; la, left external iliac artery; lv, left external iliac vein; ra, right external iliac artery; rv, right external iliac vein. I, Scan through the roof of the acetabulum reveals distal ureters (solid arrows) near the ureterovesical junction. The bladder (b) is filled with urine and partially opacified with contrast material. The normal seminal vesicle (open arrows) usually has a paired bow-tie structure with slightly lobulated contour. a, right external iliac artery; r, rectum; v, right external iliac vein. J, Scan at the level of the pubic symphysis (open arrow) reveals the prostate gland (solid arrow). a, right external iliac artery; m, obturator internus muscle; r, rectum; v, right external iliac vein.
Hounsfield Units
A single CT image generated by the scanner is divided into many tiny blocks of different shades of black and white called pixels. The actual grayscale of each pixel on a CT depends on the amount of radiation absorbed at that point, which is termed an attenuation value. Attenuation values are expressed in Hounsfield units (HU). The HU scale or attenuation value is based on a reference scale where air is assigned a value of −1000 HU and dense bone is assigned the value of +1000 HU. Water is assigned 0 HU.
Urolithiasis
Patients presenting to the emergency department with abdominal pain or renal colic are frequently evaluated with CT imaging. The use of nonenhanced CT imaging to identify urolithiasis was first reported in 1995 (Smith et al, 1995) and has now become the standard diagnostic tool to evaluate renal colic. It offers the advantages over IVU of avoiding contrast and has the ability to diagnose other abdominal abnormalities that can also cause abdominal pain. MDCT can readily diagnose radiolucent stones that may not have been seen on IVU, as well as small stones even in the distal ureter (Federle et al, 1981). With the exception of some indinavir stones, all renal and ureteral stones can be detected on helical CT scan (Schwartz et al, 1999). In the workup of urolithiasis, the unenhanced CT has a sensitivity ranging between 96% and 100% and specificity ranging between 92% and 100% (Memarsadeghi et al, 2005). Stones in the distal ureter can be difficult to differentiate between pelvic calcifications. In these cases the urologist needs to look for other signs of obstruction that indicate the presence of a stone including ureteral dilation, inflammatory changes in the perinephric fat, hydronephrosis, and a soft tissue rim surrounding the calcification within the ureter. The soft tissue rim around a stone represents irritation and edema in the ureteral wall (Heneghan et al, 1997; Dalrymple et al, 2000) (Fig. 4–52).
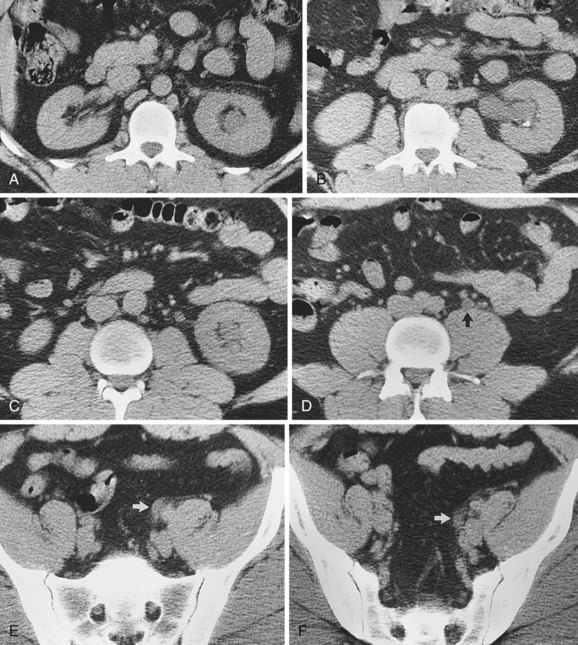
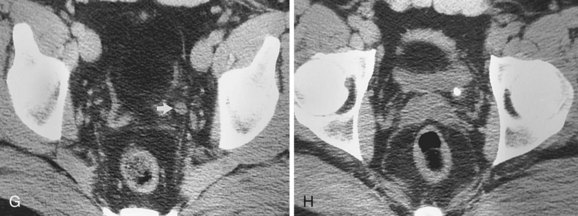
Figure 4–52 Computed tomography of the abdomen and pelvis in a patient with an obstructing ureteral stone at the level of the ureterovesical junction (UVJ). A, Level of the left upper pole. Mild renal enlargement, caliectasis, and perinephric stranding are apparent. B, Level of the left renal hilum. Left pyelectasis with a dependent stone, mild peripelvic and perinephric stranding, and a retroaortic left renal vein are shown. C, Level of the left lower pole. Left caliectasis, proximal ureterectasis, and mild periureteral stranding are present. D, Level of the aortic bifurcation. The dilated left ureter (arrow) has lower attenuation than do nearby vessels. E, Level of the upper portion of the sacrum. A dilated left ureter (arrow) crosses anteromedial to the common iliac artery. F, Level of the midsacrum. A dilated left ureter (arrow) is accompanied by periureteral stranding. G, Level of the top of the acetabulum showing a dilated pelvic portion of the left ureter (arrow). H, Level of the UVJ. The impacted stone with a “cuff” or “tissue rim” sign that represents the edematous wall of the ureter.
(Reprinted from Talner LB, O’Reilly PH, Wasserman NF. Specific causes of obstruction. In: Pollack HM, McClennan BL, Dyer R, Kenney PJ, editors. Clinical urography. 2nd ed. Philadelphia: WB Saunders; 2000.)
Stone patients are frequently subjected to radiation exposure as part of diagnosis, treatment, and follow-up. Increasing awareness of the potential long-term adverse effects of radiation exposure has encouraged urologists and radiologists to discover means to decrease the amount of radiation exposure. The low-dose unenhanced helical CT scan is gaining increasing popularity for initial diagnosis of renal colic suspected to be due to urolithiasis and for follow-up in stone patients. Using low-dose CT protocols, the specificity and sensitivity of unenhanced low-dose helical CT scan are approximately 96% and 97%, respectively. Low-dose techniques offer a 99% positive at 90%-negative predictive value for urolithiasis. The end result is a 50% to 75% decrease in the patient’s total radiation exposure for each CT obtained (Liu et al, 2000; Hamm et al, 2002; Kalra et al, 2005).
Cystic and Solid Renal Masses
The frequent CT imaging in emergency department patients has resulted in an increase in the detection of incidental renal masses. Using CT imaging the mass can be characterized as a simple or complex cyst or a solid mass. On the basis of the HU attenuation scale we would expect simple cysts to have HU near zero (Fig. 4–53).
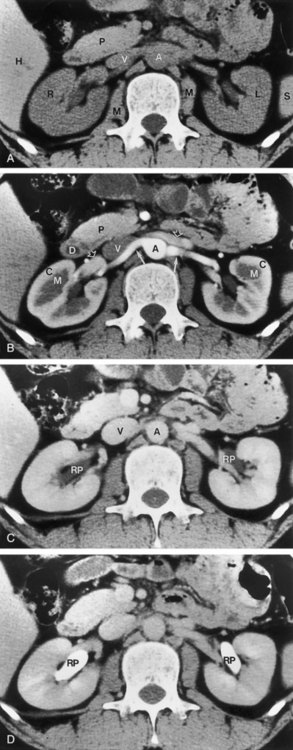
Figure 4–53 Renal computed tomography (CT) demonstrating normal nephrogenic progression. A, Unenhanced CT scan obtained at the level of the renal hilum shows right (R) and left (L) kidneys of CT attenuation values slightly less than those of the liver (H) and pancreas (P). A, abdominal aorta; M, psoas muscle; S, spleen; V, inferior vena cava. B, Enhanced CT scan obtained during a cortical nephrographic phase, generally 25 to 80 seconds after contrast medium injection, reveals increased enhancement of the renal cortex (C) relative to the medulla (M). The main renal artery is indicated with solid arrows bilaterally. Main renal veins (open arrows) are less opacified with respect to the aorta (A) and arteries. D, duodenum; P, pancreas; V, inferior vena cava. C, CT scan obtained during the homogeneous nephrographic phase, generally between 85 and 120 seconds after contrast medium administration, reveals a homogeneous, uniform, increased attenuation of the renal parenchyma. The wall of the normal renal pelvis (RP) is paper thin or not visible on the CT scan. A, abdominal aorta; V, inferior vena cava. D, CT scan obtained during the excretory phase shows contrast medium in the renal pelvis (RP) bilaterally; this starts to appear approximately 3 minutes after contrast medium administration.
When the unenhanced CT images of a renal mass are compared with the enhanced images obtained in the cortical medullary or nephrogenic phase, an increase in HU (measured in the area of the renal mass) by 15 to 20 HU confirms the presence of a solid enhancing mass, which is usually renal cancer. The presence of fat, which should enhance less than 10 HU, is diagnostic for angiomyolipoma. A hyperdense cyst shows no change in density between the postcontrast and delayed-phase images (Fig. 4–54).
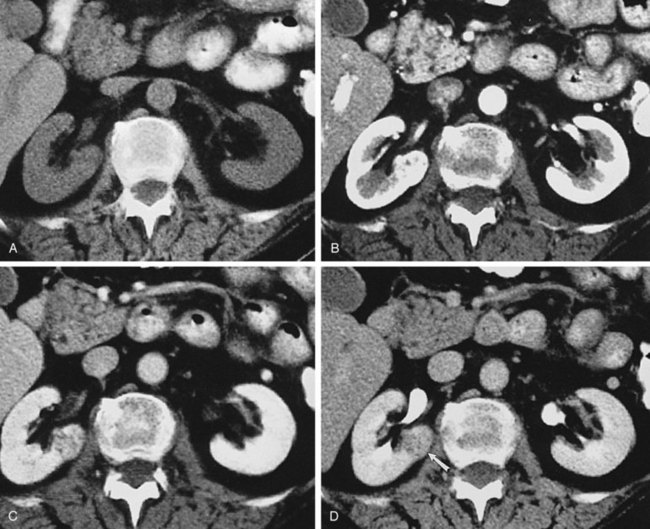
Figure 4–54 Small renal cell carcinoma in the infrahilar lip of the right kidney is not easily seen on unenhanced image (A). On corticomedullary phase image (B), the lesion is subtly visible as a hyperenhancing focus within the renal medulla. On nephrographic (C) and pyelographic phase (D) images, the full extent of the lesion (arrow) within the medulla and cortex is depicted.
(Reprinted from Brink JA, Siegel CL. Computed tomography of the upper urinary tract. In: Pollack HM, McClennan BL, Dyer R, Kenney PJ, editors. Clinical urography. 2nd ed. Philadelphia: WB Saunders; 2000.)
Complex cystic masses are usually characterized on the basis of the Bosniak classification system. The most important criteria used to differentiate a lesion that should be considered for surgery versus a nonsurgical lesion is the presence or absence of tissue vascularity or enhancement. Bosniak category I, II, and IIF lesions do not enhance to any measurable degree. Category I lesions are simple cysts and considered to be benign. Category II lesions are more complicated and may have calcifications, high attenuation fluid, and several thin septae. Category III lesions are more complex, have small areas of calcification, and may also have irregular walls or septate where there is measurable enhancement. Cystic lesions discovered on CT scan that are difficult to categorize as either II or III are now currently categorized as IIF. Category IV lesions are cystic masses that meet all the criteria of category III but also have enhancing soft tissue components adjacent or independent of the wall or septum of the cyst. Bosniak III and IV lesions have an increased likelihood of being malignant and require close follow-up or surgical extirpation (Bosniak, 1997; Isreal and Bosniak, 2005).
Hematuria
The CTU is one of the most common studies ordered for the workup of gross or microscopic hematuria. With MDCT it is possible to perform a comprehensive evaluation of the patient with one single examination (Chai et al, 2001). The study images the abdomen and pelvis and typically includes four different phases. The first scan is an unenhanced CT to distinguish between different masses that can be present in the kidney and uncover kidney stones that would later be obscured by the excretion of contrast into the renal collecting system. At 30 to 70 seconds after contrast injection, the corticomedullary phase is captured with another pass through the MDCT, helping to define vasculature and perfusion. The nephrogenic phase occurs between 90 to 180 seconds after injection of contrast and, when compared with the nonenhanced images, allows sensitive detection and characterization of renal masses. The final phase is the excretory phase, imaged approximately 3 to 5 minutes after injection of contrast. The excretory phase allows complete filling of the collecting system and usually allows visualization of the ureter (Joudi et al, 2006) (see Fig. 4–54).
CTU has been shown to be sensitive in detecting upper tract urothelial cancers. In one series of 57 patients with hematuria, 38 were found to have urothelial carcinoma. CT urography detected 37/38 urothelial cancers for a sensitivity of 97%, compared with retrograde pyelogram, which detected 31/38 lesions and had a sensitivity of 82%. Approximately 90% of malignant upper tract lesions can be detected with CT urography (McCarthy and Cowan, 2002; Lang et al, 2003; Caoili et al, 2005). CT urography is not as sensitive as cystoscopy for the detection of urothelial tumors in the bladder. Only large bladder tumors are visualized with CT imaging studies as filling defect in the lumen of the bladder. Carcinoma in situ cannot be visualized on CT scanning and therefore cystoscopy is still an important part of a comprehensive hematuria workup.
Magnetic Resonance Imaging
CT imaging remains the mainstay of urologic cross-sectional body imaging; however, MRI is increasingly being applied to the genitourinary system. With constant improvements in technology, MRI is gradually narrowing the overall resolution quality gap between it and CT. A significant advantage of MRI is the excellent contrast resolution of soft tissue, without the need for contrast in many situations. Currently MRI is used when patients cannot be given iodinated contrast and when tissue findings in the urinary system cannot be resolved using CT or ultrasonography.
To obtain magnetic resonance images, the patient is placed on a gantry that passes through the bore of the magnet. When exposed to a magnet field of sufficient strength, the free water protons in the patient orient themselves along the magnetic field’s z-axis. This is the head-to-toe axis, straight through the bore of the magnet. A radiofrequency (RF) antenna or “coil” is placed over the body part to be imaged. It is the coil that transmits the RF pulses through the patient. When the RF pulse stops, protons release their energy, which is detected and processed to obtain the magnetic resonance image. A magnetic resonance sequence exploits the body’s different tissue characteristics and the particular manner that each type of tissue absorbs and then releases this energy.
Weighting of the image depends on how the energy is imparted through the physics of the pulse sequence and whether the energy is released quickly or slowly. Images are described as being T1 or T2 weighted. The T1-weighted images are generated by the time to return to equilibrium in the z-axis. The T2-weighted images are generated by the time required to return to equilibrium in the xy-axis. On T1-weighted magnetic resonance images, fluid has a low signal and appears dark. T2-weighted magnetic resonance images have a high signal and appear bright. In the kidney this translates into the cortex having a higher signal or being brighter than the medulla, which gives off a lower signal and is darker (Fig. 4–55).
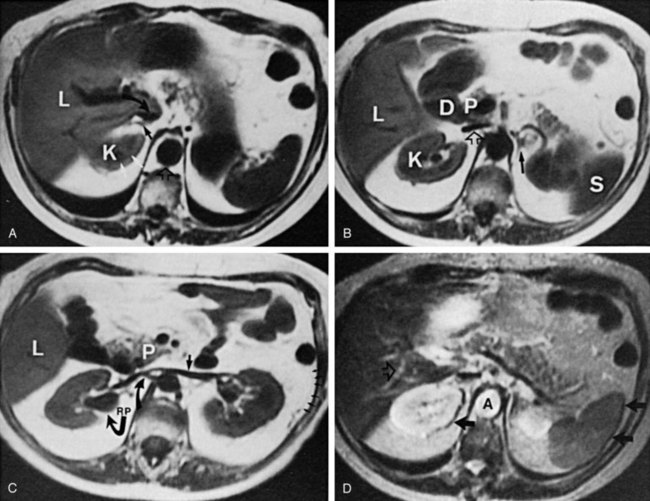
Figure 4–55 Magnetic resonance imaging (MRI) of the upper abdomen and kidneys. Axial MRI (T1-weighted) was taken through the level of the upper pole of the left kidney (K). The renal medulla is of lower signal intensity (white arrows) than the cortex, and it appears darker. The right adrenal gland (arrow) is identified with an inverted-V configuration, immediately posterior to the inferior vena cava (curved arrow). The inferior vena cava and the aorta (open short arrow) demonstrate the flow void phenomenon and appear low in signal intensity. B, T1-weighted, short TR/TE (TR = 400 msec, TE = 20 msec) scan performed 1.5 cm below that shown in A. The left adrenal gland is now identified (black arrow). The liver (L), kidney (K), spleen (S), duodenum (D), pancreas (P), and inferior vena cava (open arrow) are also noted. C, T1-weighted, short TR/TE (TR = 400 msec, TE = 20 msec) scan through the renal hilum is shown. The left renal vein is identified (short arrow) as it traverses anterior to the aorta and enters the inferior vena cava. The right renal artery (upper curved arrow) is identified posterior to the inferior vena cava. The somewhat diluted extrarenal pelvis (RP) is identified as a structure of low-signal intensity arising in the hilum. A minimal amount of renal sinus fat is identified as a high-signal region surrounding the renal pelvis. Gerota fascia is visualized faintly (short arrows) on the left. Also identified are the liver (L) and the pancreas (P). D, T2-weighted image in the midabdomen. The kidney is of higher signal intensity than the liver or spleen. Chemical shift artifact is demonstrated (arrows). The aorta (A) and intrahepatic vessels (open arrow) are of high signal intensity owing to the gradient moment nulling techniques that have been employed to minimize motion artifacts in this patient.
(Reprinted from Kressel HY, Chen Q, Prasad P, Hatabu H. Magnetic resonance imaging. In: Pollack HM, McClennan BL, Dyer R, Kenney PJ, editors. Clinical urography. 2nd ed. Philadelphia: WB Saunders; 2000.)
Intravenous gadolinium contrast enhancement can be used in renal imaging to augment the relaxation of protons on T1-weighted images, making the kidney brighter and increasing the chance of detecting and characterizing a renal mass. Urine in the bladder has low-signal intensity or appears dark on T1-weighted images and demonstrates high-signal intensity or is bright on T2-weighted images (Bassignani, 2006) (Fig. 4–56) (Table 4–6).
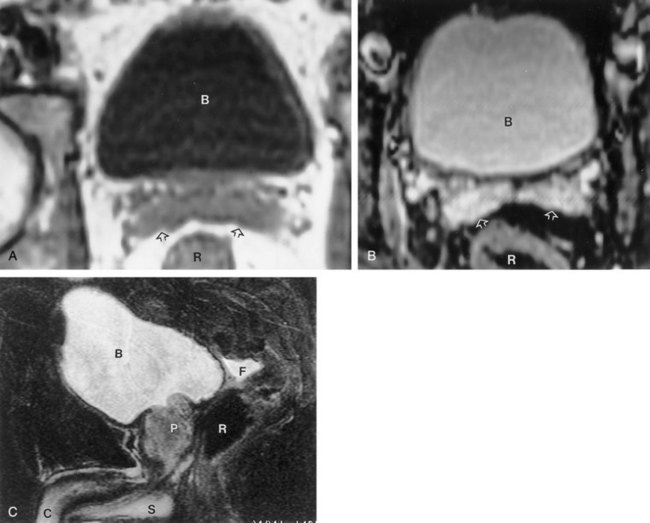
Figure 4–56 Normal bladder. Urine in the bladder (B) is low in signal intensity on the axial T1-weighted spin-echo image (A) and markedly high in signal intensity on the T2-weighted fast spin-echo image (B). The seminal vesicles (open arrows) are intermediate in signal intensity on the T1-weighted image and markedly bright on the T2-weighted image. R, rectum. C, Sagittal T2-weighted fast spin-echo image shows the relation of the bladder (B) to the prostate (P). There is a minimal amount of fluid in the rectovesical recess (F). C, corpora cavernosa; R, rectum; S, corpora spongiosa.
Table 4–6 Characteristics of Magnetic Resonance T1- and T2-Weighted Images
| T1-WEIGHTED | T2-WEIGHTED | |
|---|---|---|
| Body fluid: bladder, gallbladder, cerebrospinal fluid | Low signal or dark | High signal or bright |
| Fat | High signal or bright | High signal or bright |
| Kidney | Cortex high signal or bright Medulla low signal or dark |
High signal or bright |
Indications
MRI is indicated in the evaluation of solid renal masses, cystic renal masses, staging of renal malignancy, evaluation of venous structures, determination of vena cava involvement by renal cell carcinoma, and characterization of adrenal pathology. MRI is an imaging modality preferred over CT scanning in patients with a history of contrast allergy, compromised renal function, or suspected renal vein or vena cava involvement of renal cell carcinoma.
Some patients are not suited for imaging using MRI or have implants that make MRI dangerous. Patients who should not undergo MRI are those who have difficulty with breath holding, severe claustrophobia, pacemakers, sterile magnetic implants, retained magnetic foreign bodies, cochlear implants, neurovascular aneurysm clips, or cardiac defibrillators. MRI is also a poor choice to evaluate the presence of urolithiasis because stones do not have signal characteristics that allow them to be detected.
MRI for urologic abnormalities usually requires 30 minutes inside the bore of the magnet. Patients are required to hold their breath for 20 to 30 seconds during the imaging sequence. Patients who are not cooperative or have difficulty holding their breath will compromise the quality and value of the magnetic resonance study.
Renal Magnetic Resonance Imaging
MRI is superior to CT imaging in the workup for renal cell carcinoma when surgical planning related to invasion into the renal vein or inferior vena cava is required. MRI can detect venous invasion with the sensitivity of 100% compared with 79% for CT imaging (Kallman et al, 1992). MRI is equivalent to CT scanning detecting renal tumors of 1 cm or greater and also in detecting lymphadenopathy associated with renal cell cancer (Pretorius et al, 2000).
The most important characteristic of a solid neoplasm is the presence of enhancement. Magnetic resonance enhancement is evaluated by comparing nonenhanced T1-weighted images to gadolinium-enhanced T1-weighted images. Any detectable lesion is assessed for measurable increase in signal intensity after gadolinium contrast administration. If the lesion is brighter on the postcontrast image and increases in signal intensity by more than 15%, it is declared enhancing and is consistent with renal cancer. Benign lesions including angiomyolipomas will also enhance with gadolinium contrast. However, on T1-weighted images high-signal fat content will be detected. Neither MRI nor CT imaging can differentiate an oncocytoma from renal cell carcinoma (Pretorius et al, 2000).
Simple cysts have similar characteristics on ultrasound, CT, and MRI. Complex cysts can also be differentiated or characterized on MRI. Hemorrhage within the cyst results in a high signal on T1-weighted images because of the paramagnetic effects of blood breakdown products (Roubidoux, 1994). Proteinaceous contents within a cyst can also yield high signal on T1-weighted images, and on T2-weighted images old hemorrhage results in a black ring along the cyst wall. For benign, complex cysts there should be no enhancement of any component of the cyst (Israel et al, 2004). Because MRI is insensitive to calcifications, any calcifications present on the lining of a complex cyst are not seen on MRI. When evaluating independent risk factors for renal cell carcinoma, enhancement of the cyst wall was more sensitive and specific for the presence of renal cell carcinoma than were calcifications on the cyst wall. On CT scan, calcifications can cause artifact that can inhibit the ability to detect enhancement of small nodules within the wall of a complex cyst. MRI has the advantage of not being influenced by calcifications embedded within the wall of a complex cyst. Therefore MRI is more likely to detect enhancement of a renal cell carcinoma in the wall of the complex cyst compared with CT imaging when mural calcifications are present (Israel and Bosniak, 2003).
Adrenal Magnetic Resonance Imaging
MRI has proven to be of great value in the evaluation of the adrenal gland. MRI can easily separate adrenal adenomas from adrenal metastasis without using intravenous contrast. The high lipid content in adenomas makes them more readily differentiated from malignant processes that do not have high lipid content (Dunnick and Korobkin, 2002). The pheochromocytoma is also characterized by MRI without the need for contrast enhancement, avoiding a potential hypertensive crisis that has been associated with iodine contrast media in these patients. Pheochromocytoma, adrenal cortical carcinoma, and metastatic lesions to the adrenal gland are usually of high signal intensity or bright on T2-weighted images (Korobkin et al, 1996). The benign adrenal myolipoma is easily demonstrated on T1-weighted images because fat within these lesions has a high signal or is bright compared with surrounding tissue (Fig. 4–57).
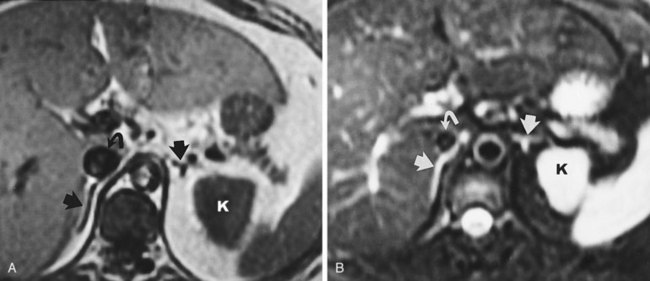
Figure 4–57 Magnetic resonance imaging of normal adrenals. A, Axial T1-weighted image (two-dimensional flash, TR = 130 msec, TE = 4 msec) shows the normal adrenals (straight arrows). Note the vena cava (curved arrow) and the left kidney (K). B, Axial T2-weighted image (TR = 2000 msec/TE = 100 msec) with fat suppression of the same patient. The adrenals appear relatively hyperintense.
(Reprinted from Mitty H, Parsons RB. Adrenal embryology, anatomy, and imaging techniques. In: Pollack HM, McClennan BL, Dyer R, Kenney PJ, editors. Clinical urography. 2nd ed. Philadelphia: WB Saunders; 2000.)
Using MRI artifact referred to as chemical shift, MRI can define benign lipid-containing adenomas. The term chemical shift describes an artifact that occurs when approximately the same amount of lipid and water are in the same volume being imaged. The two different signals of these components cancel one another out when the chemical shift is maximized. The lipid-sensitive sequence is performed in two separate sequences of one scan. In one sequence known as “in phase,” chemical shift artifact is at a minimum and the signals of lipid and water are additive. In the second sequence or “opposed phase,” chemical shift artifact is at a maximum and the signals of lipid and water cancel one another, resulting in the adrenal mass being darker on the opposed phase images compared with the in-phase images. Loss of signal on chemical shift MRI is 95% sensitive and 100% specific for adrenal adenoma (Hood et al, 1999; Israel et al, 2004; Elsayes et al, 2005).
Geise RA, Morin RL. Radiation management in uroradiology. In Clinical urography, 2nd ed, Philadelphia: WB Saunders; 2000:13-18.
2008 American College of Radiology Manual on contrast media, version 6. 〈http://www.acr.org/SecondaryMainMenuCategories/quality_safety/contrast_manual.aspx〉, 2008.
Grainger RG, Thomsen HS, Morcos SK. Intravascular contrast media for radiology, CT and MRI. In Adam A, Dixon A, editors: Grainger & Allison’s diagnostic radiology, 5th ed, Philadelphia: Elsevier, 2008.
Manakas C, Nakada SY. Computed tomography: fundamentals of image acquisition and clinical utility. AUA Update Series. 2009:28. lesson 13
Pannu N, Wiebe N, Tonelli M, et al. Prophylaxis strategies for contrast-induced nephropathy. JAMA. 2006;295(23):2765-2779.
Fulgham PF. Basic ultrasound DVD. Linthicum, MD: Urologic Ultrasound DVD Series, American Urological Association; 2007.
Fulgham PF. Abdominal ultrasound DVD. Linthicum, MD: Urologic Ultrasound DVD Series, American Urological Association; 2008.
Gilbert BR. Ultrasound of the male genitalia DVD. Linthicum, MD: Urologic Ultrasound DVD Series, American Urological Association; 2008.
Holland CK, Fowlkes JB. Biologic effects and safety. In: Rumack CM, Wilson SR, Charboneau JW, Johnson J, editors. Diagnostic ultrasound. 3rd ed. St. Louis: Elsevier Mosby; 2005:35-53.
Merritt CRB. Physics of ultrasound. In: Rumack CM, Wilson SR, Charboneau JW, Johnson J, editors. Diagnostic ultrasound. 3rd ed. St. Louis: Elsevier Mosby; 2005:3-34.
O’Neill WC. Atlas of renal ultrasonography. Philadelphia: WB Saunders; 2001.
Rifkin MD, Cochlin MD, Goldberg BB. Imaging of the scrotum and contents. London: Martin Dunitz Ltd; 2002.
Scoutt LM, Burns P, Brown JL, et al. Ultrasound evaluation of the urinary tract. In Clinical urography, 2nd ed, Philadelphia: WB Saunders; 2000:388-472.
Thurston W, Wilson SR. The urinary tract. In: Rumack CM, Wilson SR, Charboneau JW, Johnson J, editors. Diagnostic ultrasound. 3rd ed. St. Louis: Elsevier; 2005:321-393.
Ell PJ, Gambhir SS. Nuclear medicine in clinical diagnosis and treatment, 3rd ed. London: Churchill-Livingstone; 2004.
Goldfarb CR, Srivastava NC, Grotas AB, et al. Radionuclide imaging in urology. Urol Clin North Am. 2006;33(3):319-328.
Larson SM, Schoder H. Advances in positron emission tomography applications for urologic cancers. Curr Opin Urol. 2008;18:65-70.
Peters AM. Scintigraphic imaging of renal function. Exp Nephrol. 1998;6(5):391-397.
Shvarts O, Han KR, Seltzer M, et al. Positron emission tomography in urologic oncology. Cancer Control. 2002;9(4):335-342.
Dalrymple NC, Casford B, Raiken DP, et al. Pearls and pitfalls in the diagnosis of ureterolithiasis with unenhanced helical CT. Radiographics. 2000;20(2):439-447.
Israel GM, Bosniak MA. An update of the Bosniak renal cyst classification system. Urology. 2005;66(3):484-488.
Joudi FN, Kuehn DM, Williams RD. Maximizing clinical information obtained by CT. Urol Clin North Am. 2006;33(3):287-300.
Manakas CM, Nakada SY. Computerized tomography: fundamental of image acquisition and clinical usefulness. AUA Update Series. 2009;28(13):113-119.
Radiation Management in Uroradiology
Geise RA, Morin RL. Radiation management in uroradiology. In: Pollack HM, McClennan BL, editors. Clinical urography. 2nd ed. Philadelphia: WB Saunders; 2000:13-14.
National Council on Radiation Protection and Measurements (NCRP); Report No. 116—Limitation of Exposure to Ionizing Radiation. Bethesda, MD, 1993.
National Research Council of the National Academies, Board on Radiation Effects Research. Health risks from exposure to low levels of ionizing radiation, BEIR VII Phase 2. National Academies Press, Washington, DC, 2006. 〈www.nap.edu〉.
2008 American College of Radiology (ACR) Manual on contrast media. 6th ed. http://www.acr.org/SecondaryMainMenuCategories/quality_safety/contrast_manual.aspx, 2008. Access on Web site
2008 American College of Radiology (ACR) Manual on contrast media. 6th ed, http://www.acr.org/SecondaryMainMenuCategories/quality_safety/contrast_manual.aspx, 2008.
Bailey CJ, Turner RC. Metformin. N Engl J Med. 1996;334:574-579.
Dawson P. Contrast media interactions with endothelium and the blood. In: Dawson P, Cosgrove DO, Grainger RG, editors. Textbook of contrast media. Oxford (UK): Isis Medical Media; 1999:191-210.
Elicker BM, Cypel YS, Weinreb JC. IV contrast administration for CT: a survey of practices for the screening and prevention of contrast nephropathy. AJR. 2006;186:1651-1658.
Grobner T. Gadolinium: a specific trigger for the development of nephrogenic fibrosing dermopathy and nephrogenic systemic fibrosis? Nephrol Dial Transplant. 2006;21:1104-1108.
Heinrich MC, Kuhlmann MK, Grgic A, et al. Cytotoxic effects of ionic high-osmolar, nonionic monomeric, and nonionic iso-osmolar dimeric iodinated contrast media on renal tubular cells in vitro. Radiology. 2005;235:843-849.
Kanal E, Broome DR, Martin DR, Thomsen HS. Response to the FDA’s May 23, 2007, nephrogenic systemic fibrosis update. Radiology. 2008;246:11-14.
Katayama H, Yamaguchi K, Kozuka T, et al. Adverse reactions to ionic and non-ionic contrast media. A report from the Japanese committee on the safety of contrast media. Radiology. 1990;175:621-628.
Katholi RE, Woods WTJr, Taylor GL, et al. Oxygen free radicals and contrast nephropathy. Am J Kidney Dis. 1998;32:64-71.
Kelly AM, Dwamena B, Cronin P, et al. Meta-analysis: effectiveness of drugs for preventing contrast-induced nephropathy. Ann Intern Med. 2008;148(4):284-294.
Lasser EC. Pretreatment with corticosteroids to prevent reactions to IV contrast material: overview and implications. AJR Am J Roentogenol. 1988;150:257-259.
Lightfoot CB, Abraham RJ, Mammen T, et al. Survey of radiologist’s knowledge regarding the management of severe contrast material induced allergic reactions. Radiology. 2009;251:691-696.
Marckmann P, Skov L, Rossen K, et al. Nephrogenic systemic fibrosis: suspected causative role of gadodiamide used for contrast-enhanced magnetic resonance imaging. J Am Soc Nephrol. 2006;17:2359-2362.
Morcos SK. Contrast medium–induced nephrotoxicity. In: Dawson P, Cosgrove DO, Grainger RG, editors. Textbook of contrast media. Oxford (UK): Isis Medical Media; 1999:135-148.
Morris TW. X-ray contrast media: where are we now and where are we going? Radiology. 1993;188:11-16.
Murphy KP, Szopinski KT, Cohan RH, et al. Occurrence of adverse reactions to gadolinium-based contrast material and management of patients at increased risk: a survey of the American Society of Neuroradiology Fellowship Directors. Acad Radiol. 1999;6:656-664.
Nash K, Hafeez A, Hou S. Hospital-acquired renal insufficiency. Am J Kidney Dis. 2002;39:930-936.
Nelson RC, Anderson FAJr, Birnbaun BA, et al. Contrast media extravasation during dynamic CT: detection with an extravasation detection accessory. Radiology. 1988;209:837-843.
Pannu N, Wiebe N, Tonelli M, et al. Prophylaxis strategies for contrast-induced nephropathy. JAMA. 2006;295(23):2765-2779.
Thomsen HS, Muller RN, Mattrey RF. Trends in contrast media. Germany: Springer-Verlag; 1999.
Safirstein R, Andrade L, Vieira JM. Acetylcysteine and nephrotoxic effects of radiographic contrast agents—a new use for an old drug. N Engl J Med. 2000;343:210-212.
Spring DB, Bettman MA, Barkan HE. Deaths related to iodinated contrast media reported spontaneously to US Food and Drug Administration 1978–1994: effect of the availability of low-osmolality contrast media. Radiology. 1997;204:333-337.
Todd DJ, Kagan A, Chibnik LB, Kay J. Cutaneous changes of nephrogenic systemic fibrosis: predictor of early mortality and association with gadolinium exposure. Arthritis Rheum. 2007;56:3433-3441.
Wiholm BE, Myrhed M. Metformin-associated lactic acidosis in Sweden 1977–1991. Eur J Clin Pharmacol. 1993;44:589-591.
Christiano AP, Hollowell CM, Kim H, et al. Double-blind randomized comparison of single-dose ciprofloxacin versus intravenous cefazolin in patients undergoing outpatient endourologic surgery. Urology. 2000;55:182-185.
Johenning PW. Reactions to contrast material during retrograde pyelography. Urology. 1980;16:442-443.
Weese DL, Greenberg HM, Zimmern PE. Contrast media reactions during voiding cystourethrography or retrograde pyelography. Urology. 1993;41:81-84.
Hudson HC, Kramer SA, Anderson EE. Identification of ureteroileal obstruction in retrograde loopogram. Urology. 1981;17:147-148.
Broghammer J, Wessells H. Acute management of bladder and urethral trauma. AUA Update Series. 2008;27(24):221-231.
Quagliano PV, Delair SM, Malhotra AK. Diagnosis of blunt bladder injury: a prospective comparative study of computed tomography cystography and conventional retrograde cystography. J Trauma. 2006;61:410-421.
Barbaric ZL. Autonomic dysreflexia in patients with spinal cord lesions: complication of voiding cystourethrography and ileal loopography. AJR. 1976;127:93-295.
Fleischman S, Shah P. Autonomic dysreflexia: an unusual radiologic complication. Radiology. 1977;124:695-697.
Linsenmeyer TA, Campagnolo DI, Chou I. Silent autonomic dysreflexia during voiding in men with spinal cord injuries. J Urol. 1996;155:519-522.
Ghani KR, Pilcher J, Patel U, et al. Three-dimensional ultrasound reconstruction of the pelvicaliceal system: an in-vitro study. World J Urol. 2008;26:493-498.
Ghani KR, Pilcher J, Rowland D, et al. Portable ultrasonography and bladder volume accuracy—a comparative study using three-dimensional ultrasonography. Urology. 2008;72:24-28.
Mitterberger M, Pinggera GM, Horninger W, et al. Comparison of contrast enhanced color Doppler targeted biopsy to conventional systematic biopsy: impact on Gleason score. J Urol. 2007;178:464-468.
Mitterberger M, Pinggera GM, Pallwein L, et al. The value of three-dimensional transrectal ultrasonography in staging prostate cancer. BJU Int. 2007;100:47-50.
Onik G, Barzell W. Transperineal 3D mapping biopsy of the prostate: an essential tool in selecting patients for focal prostate cancer therapy. Urol Oncol. 2008;26:506-510.
Wink M, Frauscher F, Cosgrove D, et al. Contrast-enhanced ultrasound and prostate cancer; a multicentre European research coordination project. Eur Urol. 2008;54:982-993.
Fowlkes JB, Bioeffects Committee of the American Institute of Ultrasound in Medicine. American Institute of Ultrasound in Medicine consensus report on potential bioeffects of diagnostic ultrasound: executive summary. J Ultrasound Med. 2008;27:503-515.
O’Neill WC. Atlas of renal ultrasonography. Philadelphia: WB Saunders; 2001. p. 41
Emamian SA, Nielsen MB, Pedersen JF, et al. Sonographic evaluation of renal appearance in 665 adult volunteers. Acta Radiol. 1993;34:482.
Emamian SA, Nielsen MB, Pedersen JF, et al. Kidney dimensions at sonography: correlation with age, sex, and habitus in 665 adult volunteers. AJR. 1993;160:83.
Forman HP, Middleton WD, Melson GL, et al. Hyperechoic renal cell carcinomas: increase in detection at US. Radiology. 1993;188:431-434.
Roger SD, Beale AM, Cattell WR, et al. What is the value of measuring renal parenchymal thickness before renal biopsy? Clin Radiol. 1994;49:45.
Warshauer DM, McCarthy SM, Street L, et al. Detection of renal masses: sensitivities and specificities of excretory urography/linear tomography, US and CT. Radiology. 1988;169:363-365.
Yamashita Y, Takahashi M, Watanabe O, et al. Small cell carcinoma pathologic and radiologic correlation. Radiology. 1992;184:493-498.
Transabdominal Pelvic Ultrasound
Chia SJ, Heng CT, Chan SP, Foo KT. Correlation of intravesical prostatic protrusion with bladder outlet obstruction. BJU Int. 2003;91:371-374.
Delair S, Kurzrock E. Clinical utility of ureteral jets: disparate opinions. J Endourol. 2006;20:111-114.
Keqin Z, Zhishun X, Jing Z, et al. Clinical significance of intravesical prostatic protrusion in patients with benign prostatic enlargement. Urology. 2007;70:1096-1099.
Oelke M, Hofner K, Jonas U, et al. Diagnostic accuracy of noninvasive tests to evaluate bladder outlet obstruction in men: detrusor wall thickness, uroflowmetry, postvoid residual urine, and prostate volume. Eur Urol. 2007;52:827-835.
Roehrborn CG, Chinn HK, Fulgham PF, et al. The role of transabdominal ultrasound in the preoperative evaluation of patients with benign prostatic hypertrophy. J Urol. 1986;135:1190-1193.
Ultrasonography of the Scrotum
Barth RA, Shortliffe LD. Normal pediatric testis: comparison of power Doppler and color Doppler US in the detection of blood flow. Radiology. 1997;204:2289-2393.
Mazzu D, Jeffrey RB, Ralls PW. Lymphoma and leukemia involving the testicles: finding son gray-scale and color Doppler sonography. AJR. 1995;164:645-647.
Middleton WD, Thorn DA, Nelson GL. Color Doppler ultrasound of the normal testis. AJR. 1989;152:293.
Ahlstrom H, Malmstrom PU, Letocha H, et al. Positron emission tomography in the diagnosis and staging of urinary bladder cancer. Acta Radiol. 1996;37:180-185.
Albers P, Bender H, Yilmaz H, et al. Positron emission tomography in the clinical staging of patients with stage I and stage II testicular germ cell tumors. Urology. 1999;53:808-811.
de Jong I, Pruim J, Elsinga PH, et al. Visualization of bladder cancer using (11)C-cholone PET: first clinical experience. Eur J Nucl Med Mol Imaging. 2002;29:1283-1288.
De Santis M, Becherer A, Bokemeyer C, et al. 2–18fluoro-deoxy-D-glucose positron emission tomography is a reliable predictor for viable tumor in postchemotherapy seminoma: an update of the prospective multicentric SEMPET trial. J Clin Oncol. 2004;22(6):1034-1039.
Eary JF. Nuclear medicine in cancer diagnosis. Lancet. 1999;354:853-857.
Ell PJ, Gambhir SS. Nuclear medicine in clinical diagnosis and treatment, 3rd ed. London: Churchill-Livingstone; 2004.
Eshima D, Fritzberg AR, Taylor AJr. 99mTc renal tubular function agents: current status. Semin Nucl Med. 1990;20:28-40.
Fritzberg AR, Kasina S, Echima D. Synthesis and biological evaluation of Technetium-99M MAG3 as a hippuran replacement. J Nucl Med. 1986;27:111-116.
Gates GF. Filtration fraction and its implications for radionuclide renography using diethylenetriaminepentaacetic acid and mercaptoacetyltriglycine. Clin Nucl Med. 2004;29:231-237.
Hain SF, O’Doherty MJ, Timothy AR, et al. Fluorodeoxyglucose PET in the initial staging of germ cell tumors. Eur J Nucl Med. 2000;27:590-594.
Itoh K. 99mTc-MAG3: review of pharmacokinetics, clinical application to renal diseases and quantification of renal function. Ann Nucl Med. 2001;15:179-190.
Kim SE, Kim DY, Lee DS, et al. Absent or faint uptake on bone scan-etiology and significance in metastatic bone disease. Clin Nucl Med. 1991;16:545-550.
Klopper JF, Hauser W, Atkins HL. Evaluation of 99mTc-DTPA for the measurement of glomerular filtration rate. J Nucl Med. 1972;13:107-110.
Larson SM, Schröder H. Advances in positron emission tomography applications for urologic cancers. Curr Opin Urol. 2008;18(1):65-70.
Lin TH, Khentigan A, Winchell HS. A 99mTc-chelate substitute for organoradiomercurial renal agents. J Nucl Med. 1974;15:34-35.
Narayan P, Lillian D, Hellstrom W, et al. The benefits of combining early radionuclide renal scintigraphy with routine bone scans in patients with prostate cancer. J Urol. 1988;140:1448-1553.
Peters AM. Scintigraphic imaging of renal function. Exp Nephrol. 1998;6:391-397.
Schröder H, Hermann K, Gonen M, et al. 2-(18F)fluoro-2-deoxyglucose positron emission tomography for the detection of disease in patients with prostate-specific antigen relapse after radical prostatectomy. Clin Cancer Res. 2005;11:4761-4769.
Shvarts O, Han K, Seltzer M, et al. Positron emission tomography in urologic oncology. Cancer Control. 2002;9(4):335-342.
Bosniak MA. Diagnosis and management of patients with complicated cystic lesions of the kidney. AJR Am J Roentgenol. 1997;169(3):819-821.
Brant W. Basic principles. In: Brant WE, Helms CA, editors. Fundamentals of diagnostic radiology. 2nd ed. Baltimore: Williams & Wilkins; 1999:3-21.
Caoili EM, Coahn RH, Inampudi P, et al. MDCT urography of upper tract urothelial neoplasms. AJR Am J Roentgenol. 2005;184(6):1873-1881.
Chai RY, Jhaveri K, Saini S, et al. Comprehensive evaluation of patients with hematuria on multi-slice computed tomography scanner: protocol design and preliminary observations. Australas Radiol. 2001;45(4):536-538.
Dalrymple NC, Casford B, Raiken DP, et al. Pearls and pitfalls in the diagnosis of ureterolithiasis with unenhanced helical CT. Radiographics. 2000;20(2):439-447.
Daly B, Krebs TL, Wong-You-Cheong JJ, Wang SS. Percutaneous abdominal and pelvic interventional procedures using CT fluoroscopy guidance. AJR Am J Roentgenol. 1999;173(3):637-644.
Federle MP, McAninch JW, Kaiser JA, et al. Computed tomography of urinary calculi. AJR Am J Roentgenol. 1981;136(2):255-258.
Gupta A, Allaf ME, Kavoussi LR, et al. Computerized tomography guided percutaneous renal cryoablation with the patient under conscious sedation: initial clinical experience. J Urol. 2006;175:447-452.
Hamm M, Knoplfe E, Wartenberg S, et al. Low dose unenhanced helical computerized tomography for the evaluation of acute flank pain. J Urol. 2002;167(4):1687-1691.
Heneghan JP, Dalrymple NC, Verga M, et al. Soft tissue “rim” sign in the diagnosis of ureteral calculus with the use of unenhanced helical CT. Radiology. 1997;202(3):709-711.
Israel GM, Bosniak MA. An update of the Bosniak renal cyst classification system. Urology. 2005;66(3):484-488.
Joudi FN, Kuehn DM, Willimas RD. Maximizing clinical information obtained by CT. Urol Clin North Am. 2006;33:287-300.
Kalra MK, Maher MM, D’Souza RV, et al. Detection of urinary tract stones at low-radiation-dose CT with z-axis automatic tube current modulation: phantom and clinical studies. Radiology. 2005;235(2):523-529.
Keat N. Real-time CT and CT fluoroscopy. Br J Radiol. 2001;74:1088-1090.
Lang EK, Macchia RJ, Thomas R. Improved detection of renal pathologic features on multi-phasic helical CT compared with IVU in patients presenting with microscopic hematuria. Urology. 2003;61(3):528-532.
Liu W, Esler SJ, Kenny BJ, et al. Low dose nonenhanced helical CT of renal colic: assessment of ureteric stone detection and measurement of effective dose equivalent. Radiology. 2000;215(1):51-54.
Mahesh M. Search for isotropic resolution in CT from conventional through multiple-row detector. Radiographics. 2002;22:949-962.
McCarthy CL, Cowan NC. Multidetector computed tomography urography for urothelial imaging. Radiol Common. 2002;225:137. Abstract
Memarsadeghi M, Heinz-Peer G, Helbich TH, et al. Unenhanced multi-detector row CT in patients suspected of having urinary stone disease: effect of section width on diagnosis. Radiology. 2005;235(2):530-536.
Schwartz BF, Schenkman N, Armenakas NA, et al. Imaging characteristics of indinavir calculi. J Urol. 1999;161:1085-1087.
Smith RC, Rosenfield AT, Choe KA. Acute flank pain: comparison of the non-contrast- enhanced CT and intravenous urography. Radiology. 1995;194(3):789-794.
Wang G, Vannier MW. Longitudinal resolution in volumetric x-ray CT: analytic comparison between conventional and helical CT. Med Phys. 1994;421:433.
Bassignani MJ. Understanding and interpreting MRI of the genitourinary tract. Urol Clin North Am. 2006;33:301-317.
Dunnick NR, Korobkin M. Imaging of adrenal incidentalomas: current status. AJR Am J Roentgenol. 2002;179(3):559-568.
Elsayes KM, Narra VR, Leyendecker JR, et al. MRI of adrenal and extra adrenal pheochromocytoma. AJR AM J Roentgenol. 2005;184(3):860-867.
Hood MN, Ho VB, Smirniotopoulos JG, et al. Chemical shift: the artifact and clinical tool revisited. Radiographics. 1999;19(2):357-371.
Israel GM, Bosniak MA. Calcification in cystic renal masses: is it important in diagnosis? Radiology. 2003;226(1):47-52.
Israel GM, Hindman N, Bosniak MA. Evaluation of cystic renal masses: comparison of CT and MR imaging by using the Bosniak classification system. Radiology. 2004;231(2):365-371.
Israel GM, Korobkin M, Wang C, et al. Comparison of unenhanced CT and chemical shift MRI in evaluating lipid-rich adrenal adenomas. AJR Am J Roentgenol. 2004;183(1):215-219.
Kallman DA, King BF, Hattery RR, et al. Renal vein and inferior vena cava tumor thrombus in renal cell carcinoma: CT, ultrasound, MRI and venacavography. J Comput Assist Tomogr. 1992;16(2):240-247.
Korobkin M, Giordano TJ, Brodeur FJ, et al. Adrenal adenomas: relationship between histologic lipid and CT and MRI findings. Radiology. 1996;200(3):743-747.
Pretorius ES, Wickstrom ML, Siegelman ES. MR imaging of renal neoplasms. Magn Reson Imaging Clin North Am. 2000;8(4):813-836.
Roubidoux MA. MR imaging of hemorrhage and iron and deposition in the kidney. Radiographics. 1994;14(5):1033-1044.