CHAPTER 17 Properties of the Vasculature
The vasculature consists of a closed system of tubes or vessels that distributes blood from the heart to the tissues and returns blood from the tissues to the heart. It can be divided into three components: the arterial system, which takes blood from the heart and distributes it to the tissues; the venous system, which returns blood from the tissues to the heart; and the microcirculation, which separates the arterial and venous systems and is the site where nutrients and cellular waste products are exchanged between blood and tissues. These components of the vasculature are presented in this chapter. In addition, the properties of blood flow to specific vascular beds and tissues are considered. As an introduction to this material, the physics of blood/fluid flow through the vasculature (i.e., hemodynamics) is reviewed.
HEMODYNAMICS
The physics of fluid flow through rigid tubes provides a basis for understanding the flow of blood through blood vessels, even though the blood vessels are not rigid tubules (i.e., they are distensible) and blood is not a simple homogeneous fluid. Knowledge of these physical principles underlies understanding of the interrelationships among velocity of blood flow, blood pressure, and the dimensions of the various components of the systemic circulation.
Velocity of the Bloodstream
Velocity, as relates to fluid movement, is the distance that a particle of fluid travels with respect to time, and it is expressed in units of distance per unit time (e.g., cm/sec). This is in contrast to flow, which is the rate of displacement of a volume of fluid, and it is expressed in units of volume per unit time (e.g., cm3/sec). In a rigid tube, velocity (v) and flow (Q) are related to one another by the cross-sectional area (A) of the tube:

The interrelationships among velocity, flow, and area are shown in Figure 17-1. Because conservation of mass requires that the fluid flowing through a rigid tube be constant, the velocity of the fluid will vary inversely with the cross-sectional area. Thus, fluid flow velocity is greatest in the section of the tube with the smallest cross-sectional area and slowest in the section of the tube with the greatest cross-sectional area.
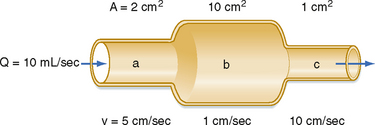
Figure 17-1 As fluid flows through a tube of variable cross-sectional area, A, the linear velocity, v, varies inversely with the cross-sectional area.
As shown in Figure 15-3, velocity decreases progressively as blood traverses the arterial system. At the capillaries, velocity decreases to a minimal value. As the blood then passes centrally through the venous system toward the heart, velocity progressively increases again. The relative velocities in the various components of the circulatory system are related only to the respective cross-sectional areas.
Relationship between Velocity and Pressure
The total energy in a hydraulic system consists of three components: pressure, gravity, and velocity. The velocity of blood flow can have an important effect on the pressure within the tube. Consider the effect of velocity on pressure in a tube with different cross-sectional areas (Fig. 17-2). An ideal fluid flows in this system, in which the total energy remains constant. The total pressure within the tube equals the lateral (static) pressure plus the dynamic pressure. The gravitational component can be neglected because the tube is horizontal. The total pressures in segments A, B, and C will be equal, provided that the energy loss from viscosity is negligible (viz., this fluid is an “ideal fluid”). The effect of velocity on the dynamic component (Pdyn) can be estimated from
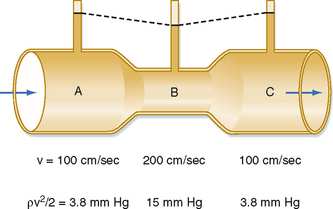
Figure 17-2 In a narrow section, B, of a tube, the linear velocity, v, and hence the dynamic component of pressure, ρv2/2, are greater than in the wide sections, A and C, of the same tube. If the total energy is virtually constant throughout the tube (i.e., if the energy loss because of viscosity is negligible), the lateral pressure in the narrow section will be less than the lateral pressure in the wide sections of the tube.

where ρ is the density of the fluid (g/cm3) and v is velocity (cm/sec). The fluid has a density of 1 g/cm3. In section A, the lateral pressure is 100 mm Hg; note that 1 mm Hg equals 1330 dynes/cm2. From Equation 17-2, Pdyn = 5000 dynes/cm2, or 3.8 mm Hg. In the narrow section B of the tube where the velocity is twice as great, Pdyn = 20,000 dynes/cm2, or 15 mm Hg. Thus, the lateral pressure in section B will be 15 mm Hg less than the total pressure, whereas the lateral pressure in sections A and C will be only 3.8 mm Hg less. In most arterial locations, the dynamic component will be a negligible fraction of the total pressure. However, at sites of an arterial constriction or obstruction, the high flow velocity is associated with a large kinetic energy, and therefore the dynamic pressure component may increase significantly. Hence, the pressure would be reduced and perfusion of distal segments will be correspondingly decreased. This example helps explain how pressure changes in a vessel that is narrowed by atherosclerosis or spasm of the blood vessel wall. That is, in narrowed sections of a tube, the dynamic component increases significantly because the flow velocity is associated with a large kinetic energy.
Relationship between Pressure and Flow
The most fundamental law that governs the flow of fluids through cylindrical tubes was derived empirically by the French physiologist Poiseuille. He was primarily interested in the physical determinants of blood flow, but he replaced blood with simpler liquids in his measurements of flow through glass capillary tubes. His work was so precise and important that his observations have been designated Poiseuille’s law.
Poiseuille’s Law
Poiseuille’s law applies to the steady (i.e., nonpulsatile) laminar flow of newtonian fluids through rigid cylindrical tubes. A newtonian fluid is one whose viscosity remains constant, and laminar flow is the type of motion in which the fluid moves as a series of individual layers, with each layer moving at a velocity different from that of its neighboring layers (Fig. 17-3). In the case of laminar flow through a tube, the fluid consists of a series of infinitesimally thin concentric tubes sliding past one another. Despite the differences between the vascular system (i.e., flow is pulsatile, the vessels are not rigid cylinders, and blood is not a newtonian fluid), Poiseuille’s law does provide valuable insight into the determinants of blood flow through the vascular system.
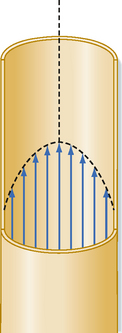
Figure 17-3 When flow is laminar, all elements of the fluid move in streamlines that are parallel to the axis of the tube; the fluid does not move in a radial or circumferential direction. The layer of fluid in contact with the wall is motionless; the fluid that moves along the central axis of the tube has the maximal velocity.
Poiseuille’s law describes the flow of fluids through cylindrical tubes in terms of flow, pressure, the dimensions of the tube, and the viscosity of liquid.
where
As is clear from the equation, flow through the tube will increase as the pressure gradient is increased, and it will decrease as either the viscosity of the fluid or the length of the tube increases. The radius of the tube is a critical factor in determining flow because it is raised to the fourth power. As described later, the radius of a tube is a major determinant of the resistance to flow.
Resistance to Flow
In electrical theory, Ohm’s law states that the resistance, R, equals the ratio of voltage drop, E, to current flow, I.

Similarly, in fluid mechanics, hydraulic resistance, R, may be defined as the ratio of the pressure drop, Pi − Po, to flow, Q.

For the steady, laminar flow of a newtonian fluid through a cylindrical tube, the physical components of hydraulic resistance may be appreciated by rearranging Poiseuille’s law to give the hydraulic resistance equation:
Thus, when Poiseuille’s law applies, the resistance to flow depends only on the dimensions of the tube and the characteristics of the fluid.
The principal determinant of resistance to blood flow through any vessel is the caliber of the vessel because resistance varies inversely as the fourth power of the radius of the tube. In Figure 17-4, the resistance to flow through small blood vessels was measured and the resistance per unit length of vessel (R/l) was plotted against the vessel diameter. As shown, resistance is highest in the capillaries (diameter of 7 μm), and it diminishes as the vessels increase in diameter on the arterial and venous sides of the capillaries. Values of R/l are virtually proportional to the fourth power of the diameter (or radius) of the larger vessels on both sides of the capillaries.
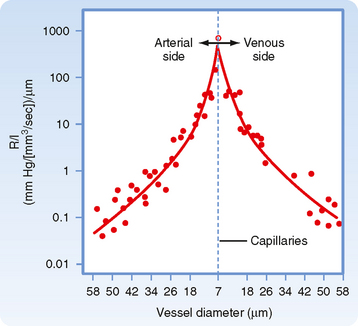
Figure 17-4 Resistance per unit length (R/l) for individual small blood vessels. The capillaries, with a diameter of 7 μm, are denoted by the vertical dashed line. Resistances of the arterioles are plotted to the left and resistances of the venules to the right of the vertical dashed line. For both types of vessels, the resistance per unit length is inversely proportional to the fourth power of the vessel diameter (D).
(Redrawn from Lipowsky HH et al: Circ Res 43:738, 1978.)
Changes in vascular resistance occur when the caliber of vessels changes. The most important factor that leads to a change in vessel caliber is contraction of the circular smooth muscle cells in the vessel wall. Changes in internal pressure also alter the caliber of blood vessels and therefore alter the resistance to blood flow through these vessels. Blood vessels are elastic tubes. Hence, the greater the transmural pressure (i.e., the difference between internal and external pressure) across the wall of a vessel, the greater the caliber of the vessel and the less its hydraulic resistance.
It is apparent from Figure 15-3 that the greatest drop in pressure occurs in the very small arteries and arterioles. However, capillaries, which have a mean diameter of about 7 μm, have the greatest resistance to blood flow. Nevertheless, it is the arterioles, not the capillaries, that have the greatest resistance of all the different varieties of blood vessels that lie in series with one another (as in Fig. 15-3). This seeming paradox is related to the relative numbers of parallel capillaries and parallel arterioles. Most simply, there are far more capillaries than arterioles in the systemic circulation, and total resistance across the many capillaries arranged in parallel is much less than total resistance across the fewer arterioles arranged in parallel. In addition, arterioles have a thick coat of circularly arranged smooth muscle fibers that can vary the lumen radius. Even small changes in radius alter resistance greatly, as can be seen from the hydraulic resistance equation (Equation 17-6), wherein R varies inversely with r4.
Resistances in Series and in Parallel
In the cardiovascular system, the various types of vessels listed along the horizontal axis in Figure 15-3 lie in series with one another. The individual members of each category of vessels are ordinarily arranged in parallel with one another (Fig. 15-1). Thus, capillaries throughout the body are in most instances parallel elements, except for the renal vasculature (in which the peritubular capillaries are in series with the glomerular capillaries) and the splanchnic vasculature (in which the intestinal and hepatic capillaries are aligned in series with each other). The total hydraulic resistance of components arranged in series or in parallel can be derived in the same manner as those for analogous combinations of electrical resistance.
Resistance of Vessels in Series.
Three hydraulic resistances, R1, R2, and R3, are arranged in series in the system depicted in Figure 17-5. The pressure drop across the entire system (i.e., the difference between inflow pressure, Pi, and outflow pressure, Po) consists of the sum of the pressure drops across each of the individual resistances (equation a). In steady state, the flow, Q, through any given cross section must equal the flow through any other cross section. By dividing each component in equation a by Q (equation b), it is evident from the definition of resistance (Equation 17-5) that for resistances in series, the total resistance, Rt, of the entire system equals the sum of the individual resistances, that is,
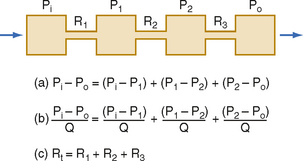
Figure 17-5 For resistances (R1, R2, and R3) arranged in series, total resistance, Rt, equals the sum of the individual resistances. P, pressure; Q, flow.
Resistance of Vessels in Parallel.
For resistances in parallel, as illustrated in Figure 17-6, inflow and outflow pressure is the same for all tubes. In steady state, the total flow, Qt, through the system equals the sum of the flows through the individual parallel elements (equation a). Because the pressure gradient (Pi − Po) is identical for all parallel elements, each term in equation a may be divided by that pressure gradient to yield equation b. From the definition of resistance, equation c may be derived. This equation states that for resistances in parallel, the reciprocal of the total resistance, Rt, equals the sum of the reciprocals of the individual resistances, that is,
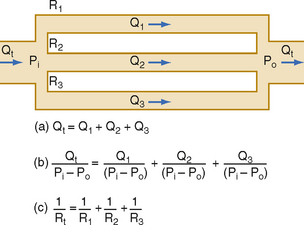
Figure 17-6 For resistances (R1, R2, and R3) arranged in parallel, the reciprocal of the total resistance, Rt, equals the sum of the reciprocals of the individual resistances. P, pressure; Q, flow.

By considering a few simple illustrations, some of the fundamental properties of parallel hydraulic systems become apparent. For example, if the resistances of the three parallel elements in Figure 17-6 were all equal, then

Therefore, from Equation 17-8,

By equating the reciprocals of these terms,

Thus, the total resistance is less than the individual resistances. For any parallel arrangement, the total resistance must be less than that of any individual component. For example, consider a system in which a tube with very high resistance is added in parallel to a low-resistance tube. The total resistance of the system must be less than that of the low-resistance component by itself because the high-resistance component affords an additional pathway, or conductance, for flow of fluid.
Consider the physiological relationship between the total peripheral resistance (TPR) of the entire systemic vascular bed and the resistance of one of its components, such as the renal vasculature. TPR is the ratio of the arteriovenous (AV) pressure difference (Pa − Pv) to the flow through the entire systemic vascular bed (i.e., the cardiac output, Qt). The renal vascular resistance (Rr) would be the ratio of the same AV pressure difference (Pa − Pv) to renal blood flow (Qr).
In an individual with an arterial pressure of 100 mm Hg, a peripheral venous pressure of 0 mm Hg, and a cardiac output of 5000 mL/min, TPR will be 0.02 mm Hg/mL/min, or 0.02 PRU (peripheral resistance units). Normally, blood flow through one kidney would be approximately 600 mL/min. Renal resistance would therefore be 100 mm Hg ÷ 600 mL/min, or 0.17 PRU, which is 8.5 times greater than TPR. An organ such as the kidney, which weighs only about 1% as much as the whole body, has a vascular resistance much greater than that of the entire systemic circulation. Hence, it is not surprising that the resistance to flow would be greater for a component organ, such as the kidney, than for the entire systemic circulation because the systemic circulation has many more alternative pathways for blood to flow than just one kidney.
Laminar and Turbulent Flow
Under certain conditions, fluid flow in a cylindrical tube will be laminar, as illustrated in Figure 17-3. As the fluid moves through the tube, a thin layer of fluid in contact with the tube wall adheres to the wall and hence is motionless. The layer of fluid just central to this external lamina must shear against this motionless layer, and therefore the layer moves slowly, but with a finite velocity. Similarly, the next more central layer moves still more rapidly; the longitudinal velocity profile is that of a paraboloid (Fig. 17-3). The fluid elements in any given lamina remain in that lamina as the fluid moves longitudinally along the tube. The velocity at the center of the stream is maximal and equal to twice the mean velocity of flow across the entire cross section of the tube.
Irregular motions of the fluid elements may develop in the flow of fluid through a tube; such flow is called turbulent. In these conditions, fluid elements do not remain confined to definite laminae, but rapid, radial mixing occurs (Fig. 17-7). Greater pressure is required to force a given flow of fluid through the same tube when the flow is turbulent than when it is laminar. In turbulent flow, the pressure drop is approximately proportional to the square of the flow rate, whereas in laminar flow, the pressure drop is proportional to the first power of the flow rate. Hence, to produce a given flow, a pump such as the heart must do considerably more work if turbulence develops.
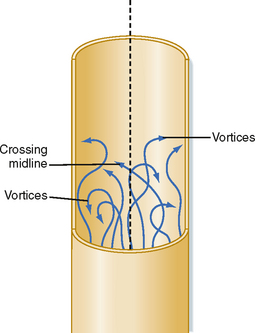
Figure 17-7 In turbulent flow the elements of the fluid move irregularly in axial, radial, and circumferential directions. Vortices frequently develop.
Whether turbulent or laminar flow will exist in a tube under given conditions may be predicted on the basis of a dimensionless number called Reynold’s number (NR). This number represents the ratio of inertial to viscous forces. For a fluid flowing through a cylindrical tube,

where ρ = fluid density, D = tube diameter, v = mean velocity, and η = viscosity. For NR of 2000 or greater, the flow will usually be laminar; for NR of 3000 or greater, the flow will be turbulent; and for NR between 2000 and 3000, the flow will be transitional between laminar and turbulent. Equation 17-12 indicates that high fluid densities, large tube diameters, high flow velocities, and low fluid viscosities predispose to turbulence. In addition to these factors, abrupt variations in tube dimensions or irregularities in the tube walls may produce turbulence.
Shear Stress on the Vessel Wall
As blood flows through a vessel, it exerts a force on the vessel wall parallel to the wall. This force is called a shear stress (τ). Shear stress is directly proportional to the flow rate and viscosity of the fluid:

Turbulence is usually accompanied by audible vibrations. Turbulent flow within the cardiovascular system may be detected with a stethoscope during physical examination. When the turbulence occurs in the heart, the resultant sound is termed a murmur; when it occurs in a vessel, the sound is termed a bruit. In severe anemia, functional cardiac murmurs (murmurs not caused by structural abnormalities) are frequently detectable. The physical basis for such murmurs resides in (1) the reduced viscosity of blood in anemia and (2) the high flow velocities associated with the high cardiac output that usually prevails in anemic patients.
Blood clots, or thrombi, are more likely to develop in turbulent than in laminar flow. A problem with the use of artificial valves in the surgical treatment of valvular heart disease is that thrombi may occur in association with the prosthetic valve. The thrombi may be dislodged and occlude a crucial blood vessel. It is important to design such valves to avert turbulence.
In certain types of arterial disease, particularly hypertension, the subendothelial layers of vessels tend to degenerate locally, and small regions of the endothelium may lose their normal support. The viscous drag on the arterial wall may cause a tear between a normally supported and an unsupported region of the endothelial lining. Blood may then flow from the vessel lumen through the rift in the lining and dissect between the various layers of the artery. Such a lesion is called a dissecting aneurysm. It occurs most often in the proximal portions of the aorta and is extremely serious. One reason for its predilection for this site is the high velocity of blood flow, with associated large shear rate (du/dy) values at the endothelial wall. Shear stress at the vessel wall also influences many other vascular functions, such as the permeability of the vessel walls to large molecules, the synthetic activity of endothelial cells, the integrity of the formed elements in blood, and blood coagulation. An increase in shear stress on the endothelial wall is also an effective stimulus for the release of nitrous oxide (NO) from vascular endothelial cells; NO is a potent vasodilator (see Microcirculation and Lymphatics).
Rheologic Properties of Blood
The viscosity of a given newtonian fluid at a specified temperature will be constant over a wide range of tube dimensions and flows. However, for a non-newtonian fluid such as blood, viscosity may vary considerably as a function of tube dimensions and flows. Therefore, the term viscosity does not have a unique meaning for blood. The term apparent viscosity is frequently used for the derived value of blood viscosity obtained under the particular conditions of measurement.
Rheologically, blood is a suspension of formed elements, principally erythrocytes, in a relatively homogeneous liquid, the blood plasma. Because blood is a suspension, the apparent viscosity of blood varies as a function of the hematocrit (ratio of the volume of red blood cells to the volume of whole blood). The viscosity of plasma is 1.2 to 1.3 times that of water. The upper curve in Figure 17-8 shows that blood with a normal hematocrit ratio of 45% has an apparent viscosity 2.4 times that of plasma.* In severe anemia, blood viscosity is low. With greater hematocrit ratios, the slope of the curve increases progressively; it is especially steep at the upper range of erythrocyte concentrations.
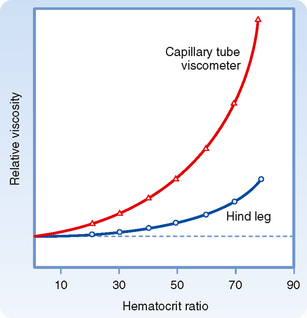
Figure 17-8 The apparent viscosity of whole blood, relative to that of plasma, increases at a progressively greater rate as the hematocrit ratio increases. For any given hematocrit ratio, the apparent viscosity of blood is less when measured in a biological viscometer (such as the blood vessels) than in a conventional capillary tube viscometer.
(Redrawn from Levy MN, Share L: Circ Res 1:247, 1953.)
For any given hematocrit ratio, the apparent viscosity of blood, relative to that of water, depends on the dimensions of the tube used in estimating the viscosity. Figure 17-9 demonstrates that the apparent viscosity of blood diminishes progressively as tube diameter decreases below a value of about 0.3 mm. The diameters of the highest-resistance blood vessels, the arterioles, are considerably less than this critical value. This phenomenon therefore reduces the resistance to flow in blood vessels that possess the greatest resistance. The influence of tube diameter on apparent viscosity is explained in part by the actual change in blood composition as it flows through small tubes. The composition of blood changes because the red blood cells tend to accumulate in the faster axial stream, whereas plasma tends to flow in the slower marginal layers. Because the axial portions of the bloodstream contain a greater proportion of red cells and this axial portion will move at greater velocity, the red cells tend to traverse the tube in less time than plasma does. Measurement has shown that red cells do travel faster than plasma through these vascular beds. Furthermore, the hematocrit ratios of the blood contained in the small blood vessels of various tissues are lower than those in blood samples withdrawn from large arteries or veins.
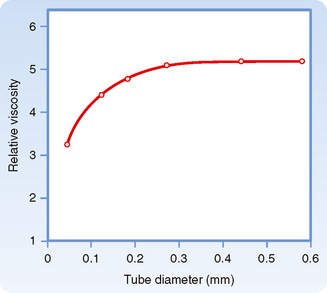
Figure 17-9 The viscosity of blood relative to that of water increases as a function of tube diameter up to a diameter of about 0.3 mm.
(Redrawn from Fåhraeus R, Lindqvist T: Am J Physiol 96:562, 1931.)
The physical forces responsible for the drift of erythrocytes toward the axial stream and away from the vessel walls when blood is flowing at normal rates are not fully understood. One factor is the great flexibility of red blood cells. At low flow rates, like those in the microcirculation, rigid particles do not migrate toward the central axis of a tube, whereas flexible particles do. The concentration of flexible particles near the tube’s central axis is enhanced by increasing the shear rate.
The apparent viscosity of blood diminishes as the flow rate is increased (Fig. 17-10), a phenomenon called shear thinning. The greater the flow, the greater the rate that one lamina of fluid shears against an adjacent lamina. The greater tendency for erythrocytes to accumulate in the axial laminae at higher flow rates is partly responsible for this non-newtonian behavior. However, a more important factor is that at very slow flow rates, the suspended cells tend to form aggregates, which increases blood viscosity. As flow is increased, this aggregation decreases, and so also does the apparent viscosity of blood (Fig. 17-10).
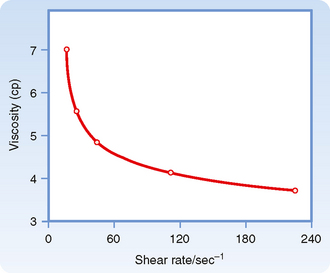
Figure 17-10 Decrease in the viscosity of blood (centipoise) at increasing rates of shear (sec−1). The shear rate refers to the velocity of one layer of fluid relative to that of the adjacent layers and is directionally related to the rate of flow.
(Redrawn from Amin TM, Sirs JA: Q J Exp Physiol 70:37, 1985.)
The tendency for erythrocytes to aggregate at low flow depends on the concentration of the larger protein molecules in plasma, especially fibrinogen. For this reason, changes in blood viscosity with flow rate are much more pronounced when the concentration of fibrinogen is high. In addition, at low flow rates, leukocytes tend to adhere to the endothelial cells of the microvessels and thereby increase the apparent viscosity of the blood.
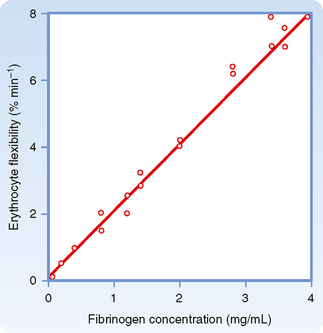
The deformability of erythrocytes is also a factor in shear thinning, especially when hematocrit ratios are high. The mean diameter of human red blood cells is about 7 μm, yet they are able to pass through openings with a diameter of only 3 μm. As blood with densely packed erythrocytes flows at progressively greater rates, the erythrocytes become more and more deformed. Such deformation diminishes the apparent viscosity of blood. The flexibility of human erythrocytes is enhanced as the concentration of fibrinogen in plasma increases (Fig. 17-11). If the red blood cells become hardened, as they are in certain spherocytic anemias, shear thinning may diminish.
THE ARTERIAL SYSTEM
Arterial Elasticity
The systemic and pulmonary arterial systems distribute blood to the capillary beds throughout the body. The arterioles are high-resistance vessels of this system that regulate the distribution of flow to the various capillary beds. The aorta, the pulmonary artery, and their major branches have a large amount of elastin in their walls, which makes these vessels highly distensible (i.e., compliant). This distensibility serves to dampen the pulsatile nature of blood flow that results from the heart pumping blood intermittently. When blood is ejected from the ventricles during systole, these vessels distend, and during diastole, they recoil back and propel the blood forward (Fig. 17-12). Thus, the intermittent output of the heart is converted to a steady flow through the capillaries.
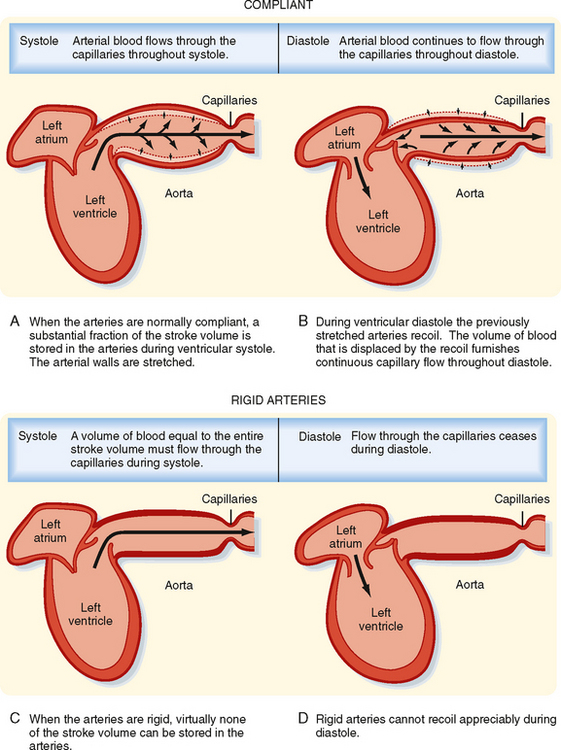
Figure 17-12 A to D, When the arteries are normally compliant, blood flows through the capillaries throughout the cardiac cycle. When the arteries are rigid, blood flows through the capillaries during systole, but flow ceases during diastole.
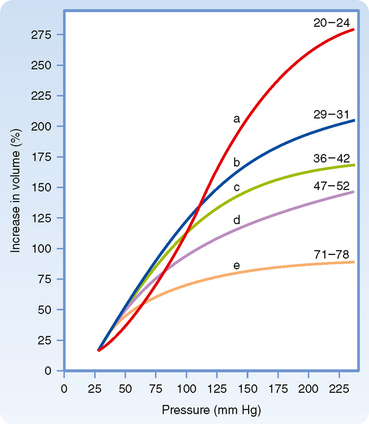
As people age, the elastin content of the large arteries is reduced and replaced by collagen. This reduces arterial compliance (Fig. 17-13). Thus, with age, systolic pressure increases, as does the difference between systolic and diastolic blood pressure, called the pulse pressure (see below).
The elastic nature of the large arteries also reduces the work of the heart. If these arteries were rigid rather than compliant, the pressure would rise dramatically during systole. This increased pressure would require the ventricles to pump against a large load (i.e., afterload) and thus increase the work of the heart. Instead, as blood is ejected into these vessels, they distend, and the resultant increase in systolic pressure, and thus the work of the heart, is reduced.
Determinants of Arterial Blood Pressure
Arterial blood pressure is routinely measured in patients, and it provides a useful estimate of their cardiovascular status. Arterial pressure can be defined as mean arterial pressure, which is the pressure averaged over time, and as systolic (maximal) and diastolic (minimal) arterial pressure within the cardiac cycle (Fig. 17-14). The difference between systolic and diastolic pressure is termed pulse pressure.
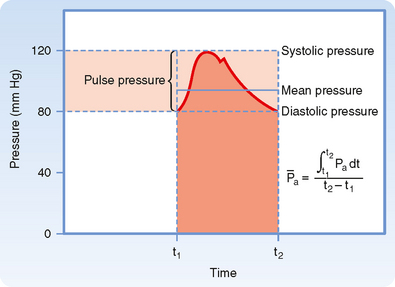
Figure 17-14 Arterial systolic, diastolic, pulse, and mean pressure. Mean arterial pressure ( ) represents the area under the arterial pressure curve (shaded area) divided by the duration of the cardiac cycle (t2 − t1).
The determinants of arterial blood pressure are arbitrarily divided into “physical” and “physiological” factors (Fig. 17-15). The two physical factors or fluid mechanical characteristics are fluid volume (i.e., blood volume) within the arterial system and the static elastic characteristics (compliance) of the system. The physiological factors are cardiac output (which equals heart rate × stroke volume) and peripheral resistance.
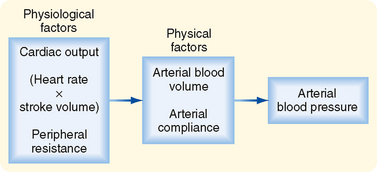
Figure 17-15 Arterial blood pressure is determined directly by two major physical factors: arterial blood volume and arterial compliance. These physical factors in turn are affected by certain physiological factors, namely, cardiac output (heart rate × stroke volume) and peripheral resistance.
Mean Arterial Pressure
Mean arterial pressure, , may be estimated from an arterial blood pressure tracing by measuring the area under the pressure curve and dividing this area by the time interval involved (Fig. 17-14). Alternatively, can be satisfactorily approximated from the measured values of systolic (Ps) and diastolic (Pd) pressure by means of the following formula:
Consider that mean arterial pressure depends on only two physical factors: mean blood volume in the arterial system and arterial compliance (Fig. 17-16). Arterial volume, Va, in turn depends on the rate of inflow, Qh, into the arteries from the heart (cardiac output) and on the rate of outflow, Qr, from the arteries through the resistance vessels (peripheral runoff). These relationships are expressed mathematically as
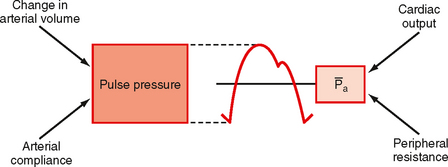
Figure 17-16 The two physical determinants of pulse pressure are arterial compliance (Ca) and the change in arterial volume. The two physiological determinants of mean arterial pressure () are cardiac output and total peripheral resistance.

where dVa/dt is the change in arterial blood volume per unit time. If Qh exceeds Qr, arterial volume increases, the arterial walls are stretched further, and pressure rises. The converse happens when Qr exceeds Qh. When Qh equals Qr, arterial pressure remains constant. Thus, increases in cardiac output raise mean arterial pressure, as do increases in peripheral resistance. Conversely, decreases in cardiac output or peripheral resistance decrease mean arterial pressure.
Arterial Pulse Pressure
Arterial pulse pressure is systolic pressure minus diastolic pressure. It is principally a function of just one physiological factor, stroke volume, which determines the change in arterial blood volume (a physical factor) during ventricular systole. This physical factor, plus a second physical factor (arterial compliance), determines the arterial pulse pressure (Fig. 17-16).
Stroke Volume.
As described previously, mean arterial pressure depends on cardiac output and peripheral resistance. During the rapid ejection phase of systole, the volume of blood introduced into the arterial system exceeds the volume that exits the system through the arterioles. Arterial pressure and volume therefore rise to a peak pressure, which is systolic pressure. During the remainder of the cardiac cycle (i.e., ventricular diastole), cardiac ejection is zero, and peripheral runoff now greatly exceeds cardiac ejection. The resultant decrement in arterial blood volume thus causes pressure to fall to a minimum, which is diastolic pressure. The effect of stroke volume on pulse pressure when arterial compliance is constant is illustrated in Figure 17-17.
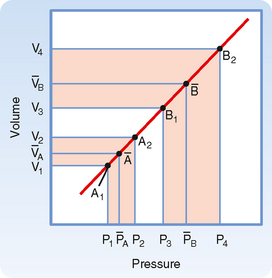
Figure 17-17 Effect of a change in stroke volume on pulse pressure in a system in which arterial compliance remains constant over the prevailing range of pressures and volumes. A larger volume increment [(V4 − V3) > (V2 − V1)] results in a greater mean pressure  and a greater pulse pressure [(P4 − P3) > (P2 − P1)].
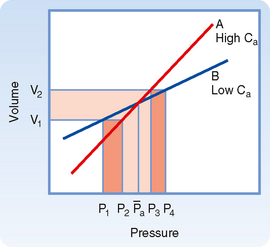
Arterial Compliance.
Arterial compliance also affects pulse pressure. This relationship is illustrated in Figure 17-18. When cardiac output and TPR are constant, a decrease in arterial compliance results in an increase in pulse pressure. Diminished arterial compliance also imposes a greater workload on the left ventricle (i.e., increased afterload), even if stroke volume, TPR, and mean arterial pressure are equal in the two individuals.
Total Peripheral Resistance and Arterial Diastolic Pressure.
As previously discussed, if the heart rate and stroke volume remain constant, an increase in TPR will increase mean arterial pressure. When arterial compliance is constant, an increase in TPR leads to proportional increases in systolic and diastolic pressure such that the pulse pressure is unchanged (Fig. 17-19, A). However, arterial compliance is not linear. As mean arterial pressure increases and the artery is stressed, compliance decreases (Fig. 17-19, B). Because of the decrease in arterial compliance with increased arterial pressure, pulse pressure will increase when arterial pressure is elevated.
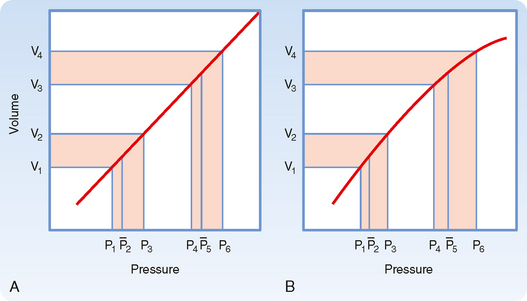
Figure 17-19 Comparison of the effects of a given change in peripheral resistance on pulse pressure when the pressure-volume curve for the arterial system is either rectilinear (A) or curvilinear (B). The increment in arterial volume is the same for both conditions [(V4 − V3) = (V2 −V1)].
Arterial pulse pressure affords valuable clues about a person’s stroke volume, provided that arterial compliance is essentially normal. Patients who have severe congestive heart failure or who have suffered a severe hemorrhage are likely to have a very small arterial pulse pressure because their stroke volumes are abnormally small. Conversely, individuals with large stroke volumes, as in aortic valve regurgitation, are likely to have an increased arterial pulse pressure. Similarly, well-trained athletes at rest tend to have large stroke volumes because their heart rates are usually low. The prolonged ventricular filling times in these individuals induce the ventricles to pump a large stroke volume, and hence their pulse pressure is large.
Peripheral Arterial Pressure Curves
The radial stretch of the ascending aorta brought about by left ventricular ejection initiates a pressure wave that is propagated down the aorta and its branches. The pressure wave travels much faster than the blood itself does. This pressure wave is the “pulse” that can be detected by palpating a peripheral artery.
In chronic hypertension, a condition characterized by a persistent elevation in TPR, the arterial pressure-volume curve resembles that shown in Figure 17-19, B. Because arteries become substantially less compliant when arterial pressure rises, an increase in TPR will elevate systolic pressure more than it will elevate diastolic pressure. Diastolic pressure is elevated in such individuals, but ordinarily not more than 10 to 40 mm Hg above the average normal level of 80 mm Hg. Not uncommonly, however, systolic pressure is elevated by 50 to 100 mm Hg above the average normal level of 120 mm Hg. The combination of increased resistance and diminished arterial compliance is represented in Figure 17-20.
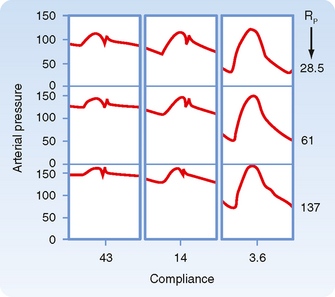
Figure 17-20 Changes in aortic pressure induced by changes in arterial compliance and peripheral resistance (Rp) in an isolated heart preparation. As compliance was reduced from 43 to 14 to 3.6 units, pulse pressure increased significantly.
(Modified from Elizinga G, Westerhof N: Circ Res 32:178, 1973.)
The velocity of the pressure wave varies inversely with arterial compliance. In general, transmission velocity increases with age, thus confirming the observation that the arteries become less compliant with advancing age. Velocity also increases progressively as the pulse wave travels from the ascending aorta toward the periphery. This increase in velocity reflects the decrease in vascular compliance in the more distal than in the more proximal portions of the arterial system.
The arterial pressure contour becomes distorted as the wave is transmitted down the arterial system. This distortion in the pressure wave contour is demonstrated in Figure 17-21. These changes in contour are pronounced in young individuals, but they diminish with age. In elderly patients, the pulse wave may be transmitted virtually unchanged from the ascending aorta to the periphery.
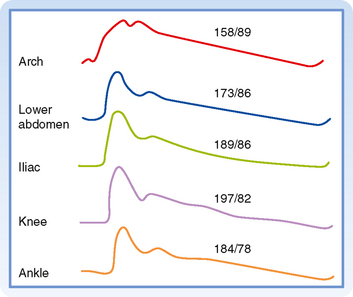
Figure 17-21 Arterial pressure curves recorded from various sites. Aside from the increasing delay in the onset of the initial pressure rise, three major changes occur in the arterial pulse contour as the pressure wave travels distally. First, the systolic portions of the pressure wave become narrowed and elevated. In the figure, the systolic pressure at the level of the knee was 39 mm Hg greater than that recorded in the aortic arch. Second, the high-frequency components of the pulse, such as the incisura (i.e., the notch that appears at the end of ventricular ejection), are damped out and soon disappear. Third, a hump may appear on the diastolic portion of the pressure wave, at a point in the pressure wave just beyond the locus at which the incisura had initially appeared.
(From Remington JW, O’Brien LJ: Am J Physiol 218:437, 1970.)
Damping of the high-frequency components of the arterial pulse is largely caused by the elastic properties of the arterial walls. Several factors, including wave reflection and resonance, vascular tapering, and pressure-induced changes in transmission velocity, contribute to peaking of the arterial pressure wave.
Blood Pressure Measurement in Humans
In hospital intensive care units, needles or catheters may be introduced into the peripheral arteries of patients to measure arterial blood pressure directly by means of strain gauges. Ordinarily, blood pressure is estimated indirectly by means of a sphygmomanometer.
When blood pressure readings are taken from the arm, systolic pressure may be estimated by palpating the radial artery at the wrist (palpatory method). While pressure in the cuff exceeds the systolic level, no pulse is perceived. As pressure falls just below the systolic level (Fig. 17-22, A), a spurt of blood passes through the brachial artery under the cuff during the peak of systole, and a slight pulse will be felt at the wrist.
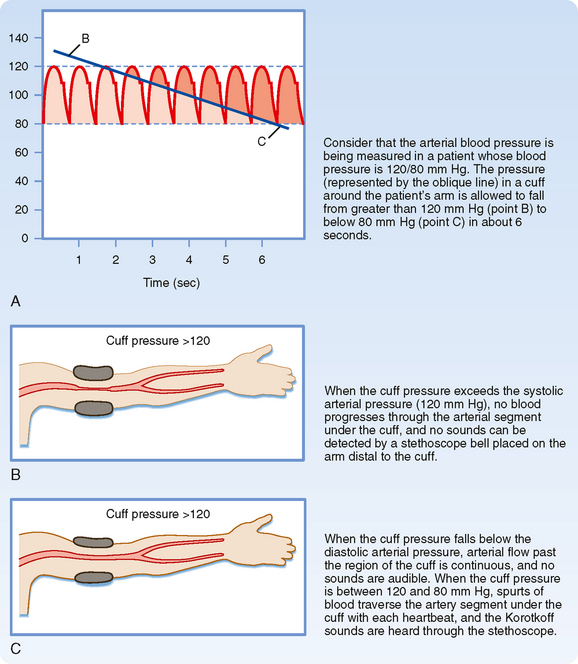
The auscultatory method is a more sensitive and therefore a more precise technique for measuring systolic pressure, and it also permits diastolic pressure to be estimated. The practitioner listens with a stethoscope applied to the skin of the antecubital space over the brachial artery. While the pressure in the cuff exceeds systolic pressure, the brachial artery is occluded and no sounds are heard (Fig. 17-22, B). When the inflation pressure falls just below the systolic level (120 mm Hg in Fig. 17-22, A), a small spurt of blood escapes the occluding pressure of the cuff, and slight tapping sounds (called Korotkoff sounds) are heard with each heartbeat. The pressure at which the first sound is detected represents systolic pressure. It usually corresponds closely with the directly measured systolic pressure. As the inflation pressure of the cuff continues to fall, more blood escapes under the cuff per beat and the sounds become louder. When the inflation pressure approaches the diastolic level, the Korotkoff sounds become muffled. When the inflation pressure falls just below the diastolic level (80 mm Hg in Fig. 17-22, A), the sounds disappear; the pressure reading at this point indicates diastolic pressure. The origin of the Korotkoff sounds is related to the discontinuous spurts of blood that pass under the cuff and meet a static column of blood beyond the cuff; the impact and turbulence generate audible vibrations. Once the inflation pressure is less than diastolic pressure, flow is continuous in the brachial artery, and sounds are no longer heard (Fig. 17-22, C).
THE VENOUS SYSTEM
Capacitance and Resistance
Veins are elements of the circulatory system that return blood to the heart from tissues. Moreover, veins constitute a very large reservoir that contains up to 70% of the blood in the circulation. The reservoir function of veins makes them able to adjust blood volume returning to the heart, or preload, so that the needs of the body can be matched when cardiac output is altered (see Chapter 19). This high capacitance is an important property of veins.
The hydrostatic pressure in postcapillary venules is about 20 mm Hg, and it decreases to around 0 mm Hg in the thoracic venae cavae and right atrium. Hydrostatic pressure in the thoracic venae cavae and right atrium is also termed central venous pressure. Veins are very distensible and have very low resistance to blood flow. This low resistance allows movement of blood from peripheral veins to the heart with only small reductions in central venous pressure. Moreover, veins control filtration and absorption by adjusting postcapillary resistance (see later) and assist in the cardiovascular adjustments that accompany changes in body position.
The ability of veins to participate in these various functions depends on their distensibility, or compliance. Venous compliance varies with the position in the body such that veins in the lower limb are less compliant than those at or above the level of the heart. Veins in the lower limbs are also thicker than those in the brain or upper limbs. The compliance of veins, like that of arteries, decreases with age, and the vascular thickening that occurs is accompanied by a reduction in elastin and an increase in collagen content.
Variations in venous return are achieved by adjustments in venomotor tone, respiratory activity (see Chapter 19), and orthostatic stress or gravity.
Gravity
Gravitational forces may profoundly affect cardiac output. For example, soldiers standing at attention for a long time may faint because gravity causes blood to pool in the dependent blood vessels and thereby reduces cardiac output. Warm ambient temperatures interfere with the compensatory vasomotor reactions, and the absence of muscular activity exaggerates these effects. Gravitational effects are amplified in airplane pilots during pullout from dives. The centrifugal force in the footward direction may be several times greater than the force of gravity. Pilots characteristically black out momentarily during the pullout maneuver as blood is drained from the cephalic regions and pooled in the lower parts of the body.
Some explanations that have been advanced to explain the gravitationally induced reduction in cardiac output are inaccurate. For example, it has been argued that when an individual is standing, the force of gravity impedes venous return to the heart from the dependent regions of the body. This statement is incomplete because it ignores the gravitational counterforce on the arterial side of the same vascular circuit, and this counterforce facilitates venous return. Moreover, it ignores the effect of gravity in causing venous pooling. When standing upright, gravity will cause blood to accumulate in the lower extremities and distend both the arteries and veins. Because venous compliance is so much greater than arterial compliance, this distention occurs more on the venous than on the arterial side of the circuit.
The hemodynamic effects of such venous distention (venous pooling) resemble those caused by the hemorrhage of an equivalent volume of blood from the body. When an adult person shifts from a supine position to a relaxed standing position, 300 to 800 mL of blood pools in the legs. This pooling may reduce cardiac output by about 2 L/min. The compensatory adjustments to assumption of a standing position are similar to the adjustments to blood loss (see also Chapter 19). There is a reflex increase in heart rate and cardiac contractility. In addition, both arterioles and veins constrict, with the arterioles being affected to a greater extent than the veins.
Muscular Activity and Venous Valves
When a recumbent person stands but remains at rest, the pressure in the veins rises in the dependent regions of the body (Fig. 17-23). The venous pressure (Pv) in the legs increases gradually and does not reach an equilibrium value until almost 1 minute after standing. The slowness of this rise in Pv is attributable to the venous valves, which permit flow only toward the heart. When a person stands, the valves prevent blood in the veins from falling toward the feet. Hence, the column of venous blood is supported at numerous levels by these valves. Because of these valves, the venous column can be thought of as consisting of many discontinuous segments. However, blood continues to enter the column from many venules and small tributary veins, and the pressure continues to rise. As soon as the pressure in one segment exceeds that in the segment just above it, the intervening valve is forced open. Ultimately, all the valves are open and the column is continuous.
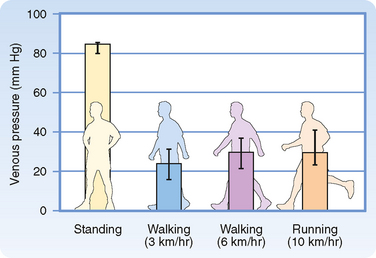
Figure 17-23 Mean pressures (±95% confidence intervals) in the foot veins of 18 human subjects during quiet standing, walking, and running.
(From Stick C et al: J Appl Physiol 72:2063, 1992.)
Some of the drugs used to treat chronic hypertension interfere with the reflex adaptation to standing. Similarly, astronauts exposed to weightlessness lose their adaptations after a few days in space, and they experience pronounced difficulties when they first return to earth. When such astronauts and other individuals with impaired reflex adaptations stand, their blood pressure may drop substantially. This response is called orthostatic hypotension, which may cause lightheadedness or fainting.
The superficial veins in the neck are ordinarily partially collapsed when a normal individual is sitting or standing. Venous return from the head is conducted largely through the deeper cervical veins, which are protected from collapse because they are tethered to surrounding structures. When central venous pressure is abnormally elevated, the superficial neck veins are distended, and they do not collapse even when the subject sits or stands. Such cervical venous distention is an important clinical sign of congestive heart failure.
The auxiliary pumping mechanism generated by skeletal muscle contractions is much less effective in people with varicose veins in their legs. The valves in these defective veins do not function properly, and therefore when the leg muscles contract, the blood in the leg veins is forced in the retrograde as well as the antegrade direction. Thus, when an individual with varicose veins stands or walks, venous pressure in the ankles and feet is excessively high. The consequent high capillary pressure leads to the accumulation of edema fluid in the ankles and feet.
Precise measurement reveals that the final level of Pv in the feet during quiet standing is only slightly greater than that in a static column of blood extending from the right atrium to the feet. This finding indicates that the pressure drop caused by blood flow from the foot veins to the right atrium is very small. This very low resistance justifies considering all the veins as a common venous compliance in the circulatory system model illustrated in Chapter 19.
When an individual who has been standing quietly begins to walk, venous pressure in the legs decreases appreciably (Fig. 17-23). Because of the intermittent venous compression exerted by the contracting leg muscles and because of the operation of the venous valves, blood is forced from the veins toward the heart. Hence, muscular contraction lowers the mean venous pressure in the legs and serves as an auxiliary pump. Furthermore, muscular contraction prevents venous pooling and lowers capillary hydrostatic pressure. In this way, muscular contraction reduces the tendency for edema fluid to collect in the feet during standing.
MICROCIRCULATION AND LYMPHATICS
The circulatory system supplies the tissues with blood in amounts that meet the body’s requirements for O2 and nutrients. The capillaries, whose walls consist of a single layer of endothelial cells, permit rapid exchange of gases, water, and solutes with interstitial fluid. The muscular arterioles, which are the major resistance vessels, regulate regional blood flow to the capillary beds. Venules and veins serve primarily as collecting channels and storage vessels.
The lymphatic system is composed of lymphatic vessels, nodes, and lymphoid tissue. This system collects the fluid and proteins that have escaped from blood and transports them back into the veins for recirculation in blood. In this section we examine in detail the network of the smallest blood vessels of the body, as well as the lymphatic vessels.
Microcirculation
The microcirculation is defined as the circulation of blood through the smallest vessels of the body—arterioles, capillaries, and venules. Arterioles (5 to 100 μm in diameter) have a thick smooth muscle layer, a thin adventitial layer, and an endothelial lining (see Fig. 15-2). Arterioles give rise directly to capillaries (5 to 10 μm in diameter) or in some tissues to metarterioles (10 to 20 μm in diameter), which then give rise to capillaries (Fig. 17-24). Metarterioles can either bypass the capillary bed and connect to venules or directly connect to the capillary bed. Arterioles that give rise directly to capillaries regulate flow through these capillaries by constriction or dilation. The capillaries form an interconnecting network of tubes with an average length of 0.5 to 1 mm.
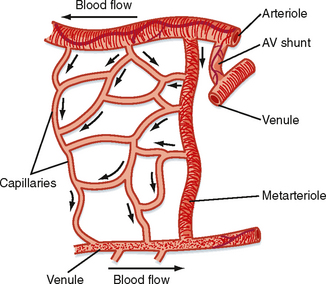
Figure 17-24 Composite schematic drawing of the microcirculation. The circular structures on the arteriole and venule represent smooth muscle fibers, and the branching solid lines represent sympathetic nerve fibers. The arrows indicate the direction of blood flow.
Functional Properties of Capillaries
In metabolically active organs, such as the heart, skeletal muscle, and glands, capillary density is high. In less active tissues, such as subcutaneous tissue or cartilage, capillary density is low. Capillary diameter also varies. Some capillaries have diameters smaller than those of erythrocytes. Passage through these tiny vessels requires the erythrocytes to become temporarily deformed. Fortunately, normal erythrocytes are quite flexible.
Blood flow in capillaries depends chiefly on the contractile state of arterioles. The average velocity of blood flow in capillaries is approximately 1 mm/sec; however, it can vary from zero to several millimeters per second in the same vessel within a brief period. These changes in capillary blood flow may be random or rhythmic. The rhythmic oscillatory behavior of capillaries is caused by contraction and relaxation (vasomotion) of the precapillary vessels (i.e., the arterioles and small arteries).
Vasomotion is an intrinsic contractile behavior of vascular smooth muscle and is independent of external input. Changes in transmural pressure (intravascular minus extravascular pressure) also influence the contractile state of precapillary vessels. An increase in transmural pressure, caused either by an increase in venous pressure or by dilation of arterioles, results in contraction of the terminal arterioles. A decrease in transmural pressure causes precapillary vessel relaxation (see Chapter 18). Humoral and possibly neural factors also affect vasomotion. For example, when increased transmural pressure causes the precapillary vessels to contract, the contractile response can be overridden and vasomotion abolished. This effect is accomplished by metabolic (humoral) factors when the O2 supply becomes too low for the requirements of parenchymal tissue, as occurs in skeletal muscle during exercise.
Although a reduction in transmural pressure relaxes the terminal arterioles, blood flow through the capillaries cannot increase if the reduction in intravascular pressure is caused by severe constriction of the upstream microvessels. Large arterioles and metarterioles also exhibit vasomotion. However, their contraction does not usually completely occlude the lumen of the vessel and arrest blood flow, whereas contraction of the terminal arterioles may arrest blood flow. Thus, the flow rate in capillaries may be altered by contraction and relaxation of small arteries, arterioles, and metarterioles.
Blood flow through the capillaries has been called nutritional flow because it provides for exchange of gases and solutes between blood and tissue. Conversely, blood flow that bypasses the capillaries as it passes from the arterial to the venous side of the circulation has been termed nonnutritional, or shunt, flow (Fig. 17-24). In some areas of the body (e.g., fingertips, ears), true AV shunts exist (see Chapter 18). However, in many tissues, such as muscle, anatomic shunts are lacking. Even in the absence of these shunts, nonnutritional flow can occur. In tissues with metarterioles, nonnutritional flow may be continuous from arteriole to venule during low metabolic activity, when many precapillary vessels are closed. When metabolic activity increases in these tissues, more precapillary vessels open to permit capillary perfusion.
True capillaries lack smooth muscle and are therefore incapable of active constriction. Nevertheless, the endothelial cells that form the capillary wall contain actin and myosin, and they can alter their shape in response to certain chemical stimuli.
Because of their narrow lumens (i.e., small radius), the thin-walled capillaries can withstand high internal pressures without bursting. This property can be explained in terms of the law of Laplace:

where
The Laplace equation applies to very thin-walled vessels, such as capillaries. Wall tension opposes the distending force (Pr) that tends to pull apart a theoretical longitudinal slit in the vessel (Fig. 17-25). Transmural pressure in a blood vessel in vivo is essentially equal to intraluminal pressure because extravascular pressure is generally negligible. To calculate wall tension, pressure in mm Hg is converted to dynes per square centimeter according to the equation P = hρg, where h is the height of an Hg column in centimeters, ρ is the density of Hg in g/cm3, and g is gravitational acceleration in cm/s2. For a capillary with a pressure of 25 mm Hg and a radius of 5 × 10⁻⁴ cm, the pressure (2.5 cm Hg × 13.6 g/cm3 × 980 cm/sec2) is 3.33 × 10⁴ dyne/cm. Wall tension is then 16.7 dyne/cm2. For an aorta with a pressure of 100 mm Hg and a radius of 1.5 cm, wall tension is 2 × 10⁵ dyne/cm. Thus, at the pressures normally found in the aorta and capillaries, the wall tension of the aorta is about 12,000 times greater than that of the capillaries. In a person standing quietly, capillary pressure in the feet may reach 100 mm Hg. Even under such conditions, capillary wall tension increases to a value that is still only one three-thousandth of the wall tension in the aorta at the same internal pressure.
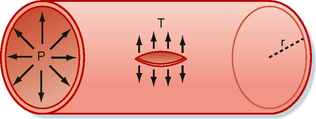
Figure 17-25 Diagram of a small blood vessel to illustrate the law of Laplace: T = Pr, where P = intraluminal pressure, r = radius of the vessel, and T = wall tension as the force per unit length tangential to the vessel wall. Wall tension acts to prevent rupture along a theoretical longitudinal slit in the vessel.
The diameter of the resistance vessels (arterioles) is determined by the balance between the contractile force of the vascular smooth muscle and the distending force produced by intraluminal pressure. The greater the contractile activity of the vascular smooth muscle of an arteriole, the smaller its diameter. In small arterioles, contraction can continue to the point at which the vessel is completely occluded. Occlusion is caused by infolding of the endothelium and by trapping of blood cells in the vessel.
With a progressive reduction in intravascular pressure, vessel diameter decreases (as does vessel wall tension—the law of Laplace) and blood flow eventually ceases, although pressure within the arteriole is still greater than tissue pressure. The pressure that causes flow to cease has been called the critical closing pressure, and its mechanism is still controversial. This critical closing pressure is low when vasomotor activity is reduced by inhibition of sympathetic nerve activity in the vessel and is increased when vasomotor tone is enhanced by activation of the vascular sympathetic nerve fibers.
If the heart becomes greatly distended with blood during diastole, as may occur with cardiac failure, it functions less efficiently. More energy is required (greater wall tension) for the distended heart to eject a given volume of blood per beat than is required for a normal undilated heart. The less efficient pumping of a distended heart is an example of Laplace’s law, which states that the tension in the wall of a vessel or chamber (in this case the ventricles) equals transmural pressure (pressure across the wall, or distending pressure) times the radius of the vessel or chamber. The Laplace relationship ordinarily applies to infinitely thin-walled vessels, but it can be applied to the heart if correction is made for wall thickness. The equation is σ = Pr/w, where σ = wall stress, P = transmural pressure, r = radius, and w = wall thickness.
Vasoactive Role of the Capillary Endothelium
For many years, the endothelium of capillaries was thought to be an inert single layer of cells that served solely as a passive filter to permit the passage of water and small molecules across the blood vessel wall and to retain blood cells and large molecules (proteins) within the vascular compartment. However, the endothelium is now recognized to be an important source of substances that cause contraction or relaxation of vascular smooth muscle.
One of these substances is prostacyclin (PGI2). PGI2 can relax vascular smooth muscle via an increase in cAMP (Fig. 17-26). PGI2 is formed in the endothelium from arachidonic acid, and the process is catalyzed by PGI2 synthase. The mechanism that triggers synthesis of PGI2 is not known. However, PGI2 may be released by an increase in shear stress caused by accelerated blood flow. The primary function of PGI2 is to inhibit platelet adherence to the endothelium and platelet aggregation and thus prevent intravascular clot formation. PGI2 also causes relaxation of vascular smooth muscle.
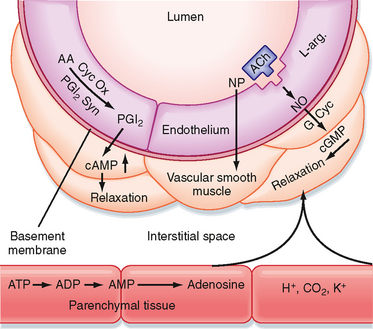
Figure 17-26 Endothelium- and non–endothelium-mediated vasodilation. Prostacyclin (PGI2) is formed from arachidonic acid (AA) by the action of cyclooxygenase (Cyc Ox) and prostacyclin synthase (PGI2 Syn) in the endothelium and elicits relaxation of the adjacent vascular smooth muscle via increases in cAMP. Stimulation of the endothelial cells with acetylcholine (ACh) or other agents (see text) results in the formation and release of an endothelium-derived relaxing factor identified as nitric oxide (NO). NO stimulates guanylyl cyclase (G Cyc) to increase cGMP in the vascular smooth muscle to produce relaxation. The vasodilator agent nitroprusside (NP) acts directly on vascular smooth muscle. Substances such as adenosine, H+, CO2, and K+ can arise in the parenchymal tissue and elicit vasodilation by direct action on vascular smooth muscle.
Of far greater importance in endothelium-mediated vascular dilation is the formation and release of nitric oxide (NO), a component of endothelium-derived relaxing factor (Fig. 17-26). When endothelial cells are stimulated by acetylcholine or other vasodilator agents (ATP, bradykinin, serotonin, substance P, histamine), NO is released. These agents do not cause vasodilation in blood vessels lacking the endothelium. NO (synthesized from L-arginine) activates guanylyl cyclase in vascular smooth muscle to increase [cGMP], which produces relaxation by decreasing myofilament sensitivity to [Ca++]. Release of NO can be stimulated by the shear stress of blood flow on the endothelium. The drug nitroprusside also increases cGMP by acting directly on vascular smooth muscle; it is not endothelium mediated. Vasodilator agents such as adenosine, H+, CO2, and K+ may be released from parenchymal tissue and act locally on resistance vessels (Fig. 17-26).
Injury to the endothelium of blood vessels precedes atherosclerosis. The protective effect (antiatherogenic) of the endothelium resides in several properties. Thus, the endothelium regulates adhesion of leukocytes to the vessel wall, suppresses the proliferation of vascular smooth muscle cells, maintains a vessel lining that resists the formation of thrombi, and regulates vascular smooth muscle tone. All these functions involve the action of NO. As indicated previously, production of NO is regulated by many substances and by shear stress acting on the vessel wall.
Acetylcholine also causes the release of an endothelium-dependent hyperpolarizing factor that underlies the relaxation of adjacent smooth muscle. Although arachidonic acid metabolites have been suggested, the factor remains unknown. Moreover, how the factor reaches vascular smooth muscle (diffusion through the extracellular space or passage via myoepithelial junctions) is unclear. Nevertheless, there are diverse ways by which endothelial cells communicate with vascular smooth muscle.
The endothelium can also synthesize endothelin, a potent vasoconstrictor peptide. Endothelin can affect vascular tone and blood pressure in humans and may be involved in such pathological states as atherosclerosis, pulmonary hypertension, congestive heart failure, and renal failure.
Passive Role of the Capillary Endothelium
Transcapillary Exchange.
Solvent and solute move across the capillary endothelial wall by three processes: diffusion, filtration, and pinocytosis. Diffusion is the most important process for transcapillary exchange and pinocytosis is the least important.
DIFFUSION
Under normal conditions, only about 0.06 mL of water per minute moves back and forth across the capillary wall per 100 g of tissue as a result of filtration and absorption. In contrast, 300 mL of water per minute per 100 g of tissue moves across the capillary wall by diffusion, a 5000-fold difference.
When filtration and diffusion are related to blood flow, about 2% of the plasma passing through the capillaries is filtered. In contrast, the diffusion of water is 40 times greater than the rate at which it is brought to the capillaries by blood flow. The transcapillary exchange of solutes is also primarily governed by diffusion. Thus, diffusion is the key factor in providing exchange of gases, substrates, and waste products between capillaries and tissue cells.
The process of diffusion is described by Fick’s law (see also Chapter 1):

where
 = concentration gradient of the solute
For diffusion across a capillary wall, Fick’s law can also be expressed as
where
The PS product provides a convenient expression of available capillary surface area because the intrinsic permeability of the capillary is rarely altered much under physiological conditions (capillary permeability may be altered as with a bee sting).
In capillaries, diffusion of lipid-insoluble molecules is restricted to water-filled channels or pores. Movement of solute across the capillary endothelium is complex and involves corrections for attractions between solute and solvent molecules, interactions between solute molecules, pore configuration, and charge on the molecules relative to charge on the endothelial cells. Such solute motion is not simply a matter of random thermal movement of molecules down a concentration gradient. For small molecules, such as water, NaCl, urea, and glucose, the capillary pores offer little restriction to diffusion (i.e., they have a low reflection coefficient—see later). Diffusion of these substances is so rapid that the mean concentration gradient across the capillary endothelium is extremely small. The greater the size of the lipidinsoluble molecules, the more restricted their diffusion through capillaries. Diffusion eventually becomes minimal when the molecular weight of the molecules exceeds about 60,000. With small molecules, the only limitation to net movement across the capillary wall is the rate at which blood flow transports the molecules to the capillary. Transport of these molecules is said to be flow limited.
With flow-limited small molecules, the concentration of the molecule in blood reaches equilibrium with its concentration in interstitial fluid at a location near the origin of the capillary from its parent arteriole. Its concentration falls to negligible levels near the arterial end of the capillary (Fig. 17-27, A). If the flow is large, the small molecule can still be present at a distant locus downstream in the capillary. A somewhat larger molecule will move farther along the capillary before it reaches an insignificant concentration in blood. Furthermore, the number of still larger molecules that enter the arterial end of the capillary but cannot pass through the capillary pores equals the number that leaves the venous end of the capillary (see Fig. 17-27, A).

Figure 17-27 Flow- and diffusion-limited transport from capillaries (Cap) to tissue. A, Flow-limited transport. The smallest water-soluble inert tracer particles (blue dots) reach negligible concentrations after passing only a short distance down the capillary. Larger particles (circles) with similar properties travel farther along the capillary before reaching an insignificant intracapillary concentration. Both substances cross the interstitial fluid (ISF) and reach the parenchymal tissue (Cell). Because of their size, more of the smaller particles are taken up by the tissue cells. The largest particles cannot penetrate the capillary pores and hence do not escape from the capillary lumen except by pinocytotic vesicle transport. An increase in the volume of blood flow or an increase in capillary density increases tissue supply of the diffusible solutes. Note that capillary permeability is greater at the venous end of the capillary (also in the venule, not shown) because of the larger number of pores in this region. B, Diffusion-limited transport. When the distance between the capillaries and parenchymal tissue is large as a result of edema or low capillary density, diffusion becomes a limiting factor in the transport of solutes from capillary to tissue, even at high rates of capillary blood flow.
With large molecules, diffusion across the capillaries becomes the limiting factor (diffusion limited). That is, the permeability of a capillary to a large solute molecule limits its transport across the capillary wall. Diffusion of small lipid-insoluble molecules is so rapid that diffusion limits blood-tissue exchange only when distances between capillaries and parenchymal cells are great (e.g., tissue edema or very low capillary density) (Fig. 17-27, B).
Movement of lipid-soluble molecules across the capillary wall is not limited to capillary pores (only about 0.02% of the capillary surface) but also occurs directly through the lipid membranes of the entire capillary endothelium. Consequently, lipid-soluble molecules move rapidly between blood and tissue. The degree of lipid solubility (oil-to-water partition coefficient) provides a good index of the ease of transfer of lipid molecules through the capillary endothelium.
O2 and CO2 are both lipid soluble, and they readily pass through endothelial cells. Calculations based on (1) the diffusion coefficient for O2, (2) capillary density and diffusion distances, (3) blood flow, and (4) tissue O2 consumption indicate that the O2 supply of normal tissue at rest and during activity is not limited by diffusion or by the number of open capillaries.
Measurements of the partial pressure of O2 (PO2) and O2 saturation of blood in microvessels indicate that in many tissues, O2 saturation at the entrance of capillaries has decreased to about 80% as a result of diffusion of O2 from arterioles and small arteries. Moreover, CO2 loading and the resulting intravascular shifts in the oxyhemoglobin dissociation curve occur in the precapillary vessels. Hence, in addition to gas exchange at the capillaries, O2 and CO2 pass directly between adjacent arterioles and venules and possibly between arteries and veins (countercurrent exchange). This countercurrent exchange represents a diffusional shunt of gas away from the capillaries; this shunt may limit the supply of O2 to the tissue at low blood flow rates.
CAPILLARY FILTRATION.
The permeability of the capillary endothelial membrane is not uniform. Thus, the liver capillaries are quite permeable, and albumin escapes from them at a rate several times greater than that from the less permeable muscle capillaries. Furthermore, permeability is not uniform along the length of the capillary. The venous ends are more permeable than the arterial ends, and permeability is greatest in the venules, a property attributed to the greater number of pores in these regions.
Where does filtration occur? Some water passes through the capillary endothelial cell membranes, but most flows through apertures (pores) in the endothelial walls of the capillaries (Figs. 17-28 and 17-29). The pores in skeletal and cardiac muscle capillaries have diameters of about 4 nm. There are clefts between adjacent endothelial cells in mouse cardiac muscle, and the gap at the narrowest point is about 4 nm. The clefts (pores) are sparse and represent only about 0.02% of the capillary surface area. Pores are absent in cerebral capillaries, where the blood-brain barrier blocks the entry of many small molecules.
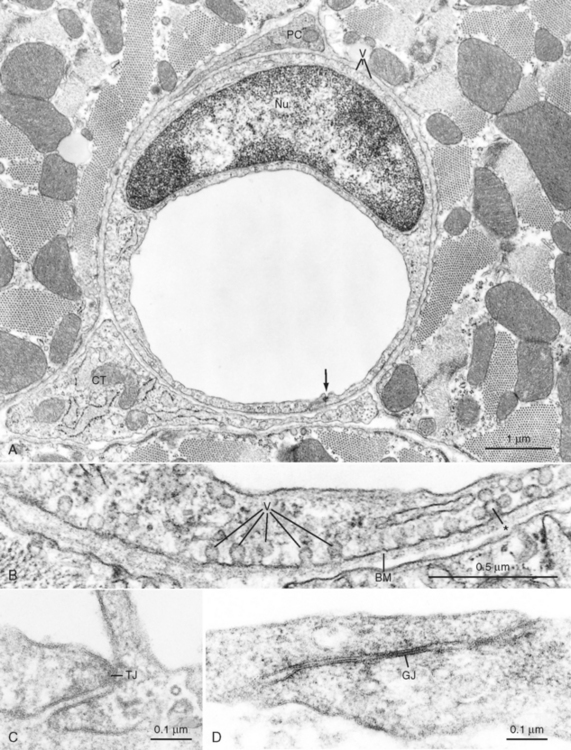
Figure 17-28 A, Cross-sectioned capillary in a mouse ventricular wall. The luminal diameter is approximately 4 μm. In this thin section, the capillary wall is formed by a single endothelial cell (Nu, endothelial nucleus), which forms a functional complex (arrow) with itself. The thin pericapillary space is occupied by a pericyte (PC) and a connective tissue (CT) cell (“fibroblast”). Note the numerous endothelial vesicles (V). B, Detail of the endothelial cell in A showing plasmalemmal vesicles (V) attached to the endothelial cell surface. These vesicles are especially prominent in vascular endothelium and are involved in transport of substances across the blood vessel wall. Note the complex alveolar vesicle (asterisk). BM, basement membrane. C, Junctional complex in a capillary of a mouse heart. “Tight” junctions (TJ) typically form in these small blood vessels and appear to consist of fusions between apposed endothelial cell surface membranes. D, Interendothelial junction in a muscular artery of monkey papillary muscle. Although tight junctions similar to those of capillaries are found in these large blood vessels, extensive junctions that resemble gap junctions in the intercalated disks between myocardial cells often appear in arterial endothelium (example shown at GJ).
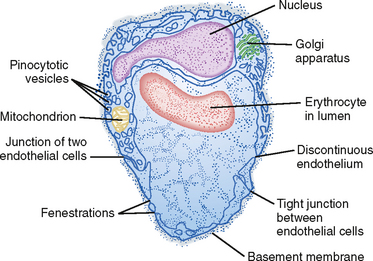
Figure 17-29 Diagrammatic sketch of an electron micrograph of a composite capillary in cross section.
In addition to clefts, some of the more porous capillaries (e.g., in the kidney, intestine) contain fenestrations 20 to 100 nm wide, whereas other capillaries (e.g., in the liver) have a discontinuous endothelium (Fig. 17-29). Fenestrations and discontinuous endothelium permit the passage of molecules that are too large to pass through the intercellular clefts of the endothelium.
The direction and magnitude of water movement across the capillary wall can be estimated as the algebraic sum of the hydrostatic and osmotic pressure that exists across the membrane. An increase in intracapillary hydrostatic pressure favors movement of fluid from the vessel interior to the interstitial space, whereas an increase in the concentration of osmotically active particles within vessels favors movement of fluid into the vessels from the interstitial space (Fig. 17-30).
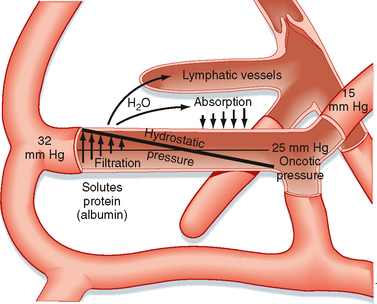
Figure 17-30 Schematic representation of the factors responsible for filtration and absorption across the capillary wall and the formation of lymph.
Hydrostatic Forces.
Hydrostatic pressure (blood pressure) within capillaries is not constant. Instead, it depends on arterial and venous pressure and on precapillary (arterioles) and postcapillary (venules and small veins) resistance. An increase in arterial or venous pressure elevates capillary hydrostatic pressure, whereas a reduction in arterial or venous pressure has the opposite effect. An increase in arteriolar resistance or closure of arteries reduces capillary pressure, whereas a greater resistance to flow in venules and veins increases capillary pressure.
Hydrostatic pressure is the principal force in capillary filtration. A given change in venous pressure produces a greater effect on capillary hydrostatic pressure than does the same change in arterial pressure. About 80% of an increase in venous pressure is transmitted back to the capillaries.
Capillary hydrostatic pressure (Pc) varies from tissue to tissue. Average values, obtained from direct measurements in human skin, are about 32 mm Hg at the arterial end of capillaries and about 15 mm Hg at the venous end of capillaries at the level of the heart (Fig. 17-30). As discussed previously, when a person stands, hydrostatic pressure increases in the legs and decreases in the head.
Tissue pressure, or more specifically interstitial fluid pressure (Pi) outside the capillaries, opposes capillary filtration. Pc − Pi constitutes the driving force for filtration. Normally, Pi is close to zero, so Pc essentially represents the hydrostatic driving force.
Osmotic Forces.
The key factor that restrains fluid loss from capillaries is the osmotic pressure of plasma proteins (such as albumin). This osmotic pressure is called colloid osmotic pressure or oncotic pressure (πp). The total osmotic pressure of plasma is about 6000 mm Hg (reflecting the presence of electrolytes and other small molecules), whereas oncotic pressure is only about 25 mm Hg. This small oncotic pressure is an important factor in fluid exchange across the capillary because plasma proteins are essentially confined to the intravascular space, whereas electrolytes are virtually equal in concentration on both sides of the capillary endothelium. The relative permeability of solute to water influences the actual magnitude of osmotic pressure. The reflection coefficient (σ) is the relative impediment to the passage of a substance through the capillary membrane. The reflection coefficient of water is zero and that of albumin (to which the endothelium is essentially impermeable) is 1. Filterable solutes have reflection coefficients between 0 and 1. In addition, different tissues have different reflection coefficients for the same molecule. Hence, movement of a given solute across the endothelial wall varies with the tissue. True oncotic pressure (π) is defined by the following equation (see also Chapter 1):
where
Albumin is the most important plasma protein determining oncotic pressure. The average albumin molecule (molecular weight of 69,000) is approximately half the size of the average globulin molecule, and it is present at almost twice the concentration as that of globulins (4.5 versus 2.5 g/dL of plasma). Albumin also exerts a greater osmotic force than can be accounted for solely on the basis of its concentration in plasma. Therefore, it cannot be completely replaced by inert substances of appropriate molecular size, such as dextran. This additional osmotic force becomes disproportionately great at high concentrations of albumin (as in plasma), and this force is weak to absent in dilute solutions of albumin (as in interstitial fluid). The reason for this activity of albumin is its negative charge at normal blood pH. Albumin binds a small number of Cl− ions, which increases the negative charge and hence the ability to retain more Na+ inside the capillaries (see Chapter 2). This small increase in the electrolyte concentration of plasma over that of interstitial fluid produced by the negatively charged albumin enhances its osmotic force to that of an ideal solution containing a solute with a molecular weight 37,000. If albumin had a molecular weight of 37,000, it would not be retained by the capillary endothelium because of its small size. Hence, albumin could not function as a counterforce to capillary hydrostatic pressure. If albumin did not exert this enhanced osmotic force, a concentration of about 12 g of albumin/dL of plasma would be required to achieve a plasma oncotic pressure of 25 mm Hg. Such a high albumin concentration would greatly increase blood viscosity and hence would increase resistance to blood flow through the vascular system.
With prolonged standing, particularly when associated with some elevation of venous pressure in the legs (such as that caused by pregnancy) or with sustained increases in venous pressure (as seen in congestive heart failure), filtration is greatly enhanced, and it exceeds the capacity of the lymphatic system to remove the capillary filtrate from the interstitial space.
The concentration of plasma proteins may also change in different pathological states and thus alter the osmotic force and movement of fluid across the capillary membrane. The plasma protein concentration is increased in dehydration (e.g., water deprivation, prolonged sweating, severe vomiting, diarrhea). In this condition, water moves by osmotic force from the tissues to the vascular compartment. In contrast, the plasma protein concentration is reduced in some renal diseases because of its loss in urine, and edema may occur.
When capillary injury is extensive, as in severe burns, intravascular fluid and plasma protein leak into the interstitial space in the damaged tissues. The protein that escapes from the vessel lumen increases the oncotic pressure of the interstitial fluid. This greater osmotic force outside the capillaries leads to additional fluid loss and possibly to severe dehydration of the patient.
Small amounts of albumin escape from the capillaries and enter the interstitial fluid, where they exert a very small osmotic force (0.1 to 5 mm Hg). This force, πi, is small because the concentration of albumin in interstitial fluid is low and because at low concentrations, albumin cannot enhance the osmotic force as much as it does at high concentrations.
Balance of Hydrostatic and Osmotic Forces.
The relationship between hydrostatic pressure and oncotic pressure and the role of these forces in regulating fluid passage across the capillary endothelium were expounded by Starling in 1896. This relationship constitutes the Starling hypothesis. It can be expressed by the equation

where
Filtration occurs when the algebraic sum is positive; absorption occurs when it is negative.
Traditionally, filtration was considered to occur at the arterial end of the capillary and absorption was considered to occur at its venous end because of the gradient of hydrostatic pressure along the capillary. This scheme is true for an idealized capillary (Fig. 17-30). However, in well-perfused capillaries, arteriolar vasoconstriction can reduce Pc such that absorption is allowed transiently. With continued vasoconstriction, absorption will diminish with time because fluid absorption increases πi (the interstitial protein concentration rises) and decreases Pi. Direct observations have revealed that many capillaries only filter, whereas others only absorb. In some vascular beds (e.g., the renal glomerulus), hydrostatic pressure in the capillary is high enough to cause filtration along the entire length of the capillary. In other vascular beds (e.g., the intestinal mucosa), the hydrostatic and oncotic forces are such that absorption occurs along the whole capillary.
Capillary pressure depends on several factors, the principal one being the contractile state of the precapillary vessel. Normally, arterial pressure, venous pressure, postcapillary resistance, interstitial fluid hydrostatic and oncotic pressure, and plasma oncotic pressure are relatively constant. A change in precapillary resistance influences fluid movement across the capillary wall. Because water moves so quickly across the capillary endothelium, the hydrostatic and osmotic forces equilibrate along the entire capillary. Hence, in the normal state, filtration and absorption across the capillary wall are well balanced. Only a small percentage (2%) of the plasma that flows through the vascular system is filtered. Of this, about 85% is absorbed in the capillaries and venules. The remainder returns to the vascular system as lymph fluid, along with the albumin that escapes from the capillaries.
In the lungs, mean capillary hydrostatic pressure is only about 8 mm Hg (see Chapter 22). Because plasma oncotic pressure is 25 mm Hg and lung interstitial fluid pressure is approximately 15 mm Hg, the net force slightly favors reabsorption. Despite the predominance of reabsorption, pulmonary lymph is formed. This lymph consists of fluid that is osmotically withdrawn from the capillaries by the small amount of plasma protein that escapes through the capillary endothelium.
In pathological conditions, such as left ventricular failure or mitral valve stenosis, pulmonary capillary hydrostatic pressure may exceed plasma oncotic pressure. When this occurs, it may cause pulmonary edema, a condition in which excessive fluid accumulates in the pulmonary interstitium. This fluid accumulation seriously interferes with gas exchange in the lungs.
Capillary Filtration Coefficient.
The rate of fluid movement (Qf) across the capillary membrane depends not only on the algebraic sum of the hydrostatic and osmotic forces across the endothelium (ΔP) but also on the area (Am) of the capillary wall available for filtration, the distance (Δx) across the capillary wall, the viscosity (η) of the filtrate, and the filtration constant (k) of the membrane. These factors may be expressed by the equation

The dimensions of Qr are units of flow per unit of pressure gradient across the capillary wall per unit of capillary surface area. This expression, which describes the flow of fluid through the membrane pores, is essentially Poiseuille’s law for flow through tubes.
Because the thickness of the capillary wall and the viscosity of the filtrate are relatively constant, they can be included in the filtration constant k. If the area of the capillary membrane is not known, the rate of filtration can be expressed per unit weight of tissue. Hence, the equation can be simplified to

where kt is the capillary filtration coefficient for a given tissue and the units for Qf are milliliters per minute per 100 g of tissue per mm Hg pressure.
In any given tissue, the filtration coefficient per unit area of capillary surface, and hence capillary permeability, is not changed by various physiological conditions, such as arteriolar dilation and capillary distention, or by such adverse conditions as hypoxia, hypercapnia, or reduced pH. When capillaries are injured (as by toxins or severe burns), significant amounts of fluid and protein leak out of the capillaries into the interstitial space. This increase in capillary permeability is reflected by an increase in the filtration coefficient.
Because capillary permeability is constant under normal conditions, the filtration coefficient can be used to determine the relative number of open capillaries (i.e., the capillary surface area available for filtration in tissue). For example, the increased metabolic activity of contracting skeletal muscle relaxes the precapillary resistance vessels and hence opens more capillaries. This process, called capillary recruitment, increases the filtering surface area.
Disturbances in Hydrostatic-Osmotic Balance.
Relatively small changes in arterial pressure may have little effect on filtration. The change in pressure may be countered by adjustments in precapillary resistance vessels (autoregulation; see Chapter 18) so that hydrostatic pressure remains constant in the open capillaries. However, a severe reduction in mean arterial pressure usually evokes arteriolar constriction mediated by the sympathetic nervous system. This response may occur in hemorrhage, and it is often accompanied by a fall in venous pressure. These changes reduce capillary hydrostatic pressure. However, the low blood pressure in hemorrhage causes a decrease in blood flow (and hence in O2 supply) to the tissue, with the result that vasodilator metabolites accumulate and relax the arterioles. Precapillary vessel relaxation also occurs because of the reduced transmural pressure (autoregulation, see Chapter 18). Consequently, absorption predominates over filtration, and fluid moves from the interstitium into the capillary. These responses to hemorrhage constitute one of the compensatory mechanisms used by the body to restore blood volume (see Chapter 19).
An increase in venous pressure alone, as occurs in the feet when a person stands up, would elevate capillary pressure and enhance filtration. However, the increase in transmural pressure closes precapillary vessels (myogenic mechanism; see Chapter 18), and hence the capillary filtration coefficient actually decreases. This reduction in capillary surface available for filtration prevents large amounts of fluid from leaving the capillaries and entering the interstitial space.
In a normal individual, the filtration coefficient (kt) for the whole body is about 0.006 mL/min/100 g of tissue/mm Hg. For a 70-kg man, an elevation in venous pressure of 10 mm Hg for 10 minutes would increase filtration from capillaries by 342 mL. Edema does not usually occur because the fluid is returned to the vascular compartment by the lymphatic vessels. When edema develops, it usually appears in the dependent parts of the body, where the hydrostatic pressure is greatest, but its location and magnitude are also determined by the type of tissue. Loose tissues, such as the subcutaneous tissue around the eyes or in the scrotum, are more prone than firm tissues, such as in a muscle, or encapsulated structures, such as in a kidney, to collect larger quantities of interstitial fluid.
PINOCYTOSIS
Some transfer of substances across the capillary wall can occur in tiny pinocytotic vesicles. These vesicles (Figs. 17-28 and 17-29), formed by pinching off of the endothelial cell membrane, can take up substances on one side of the capillary wall, move them across the cell by kinetic energy, and deposit their contents on the other side—a process termed transcytosis. The amount of material transported in this way is very small relative to that moved by diffusion. However, pinocytosis may be responsible for the movement of large (30 nm) lipid-insoluble molecules between blood and interstitial fluid. The number of pinocytotic vesicles in endothelium varies among tissues (muscle > lung > brain), and the number increases from the arterial to the venous end of the capillary.
Lymphatics
The terminal vessels of the lymphatic system consist of a widely distributed, closed-end network of highly permeable lymph capillaries. These lymph capillaries resemble blood capillaries, with two important differences: tight junctions are not present between endothelial cells, and fine filaments anchor lymph vessels to the surrounding connective tissue. With muscular contraction, these fine strands pull on the lymphatic vessels to open spaces between the endothelial cells and permit the entrance of protein and large particles into the lymphatic vessels. The lymph capillaries drain into larger vessels that finally enter the right and left subclavian veins, where they connect with the respective internal jugular veins.
Only cartilage, bone, epithelia, and tissues of the central nervous system lack lymphatic vessels. These vessels return the plasma capillary filtrate to the circulation. This task is accomplished by means of tissue pressure, and it is facilitated by intermittent skeletal muscle activity, lymphatic vessel contractions, and an extensive system of one-way valves. In this respect, lymphatic vessels resemble veins, although the larger lymphatic vessels do have thinner walls than the corresponding veins, and they contain only a small amount of elastic tissue and smooth muscle.
The volume of fluid transported through the lymphatics in 24 hours is about equal to the body’s total plasma volume. The lymphatics return about a fourth to half of the circulating plasma proteins to the blood in a day. These vessels are the only means whereby the protein that leaves the vascular compartment can be returned to blood. Net back-diffusion of protein into the capillaries cannot occur against the large protein concentration gradient. If the protein were not removed by the lymph vessels, it would accumulate in interstitial fluid and act as an oncotic force that draws fluid from the blood capillaries and produces edema.
In addition to returning fluid and protein to the vascular bed, the lymphatic system filters the lymph at the lymph nodes and removes foreign particles such as bacteria. The largest lymphatic vessel, the thoracic duct, not only drains the lower extremities but also returns the protein lost through the permeable liver capillaries. Moreover, the thoracic duct carries substances absorbed from the gastrointestinal tract. The principal substance is fat, in the form of chylomicrons.
Lymph flow varies considerably. The flow from resting skeletal muscle is almost nil, and it increases during exercise in proportion to the degree of muscular activity. It is increased by any mechanism that enhances the rate of blood capillary filtration; such mechanisms include increased capillary pressure or permeability and decreased plasma oncotic pressure. When either the volume of interstitial fluid exceeds the drainage capacity of the lymphatics or the lymphatic vessels become blocked, interstitial fluid accumulates and gives rise to clinical edema.
CORONARY CIRCULATION
Functional Anatomy of Coronary Vessels
The right and left coronary arteries arise at the root of the aorta behind the right and left cusps of the aortic valve, respectively. These arteries provide the entire blood supply to the myocardium. The right coronary artery principally supplies the right ventricle and atrium. The left coronary artery, which divides near its origin into the anterior descending and the circumflex branches, mainly supplies the left ventricle and atrium. There is some overlap between the regions supplied by the left and right arteries. In humans, the right coronary artery is dominant (supplying most of the myocardium) in about 50% of individuals. The left coronary artery is dominant in another 20%, and the flow delivered by each main artery is about equal in the remaining 30%. The epicardial distribution of the coronary arteries and veins is illustrated in Figure 17-31.
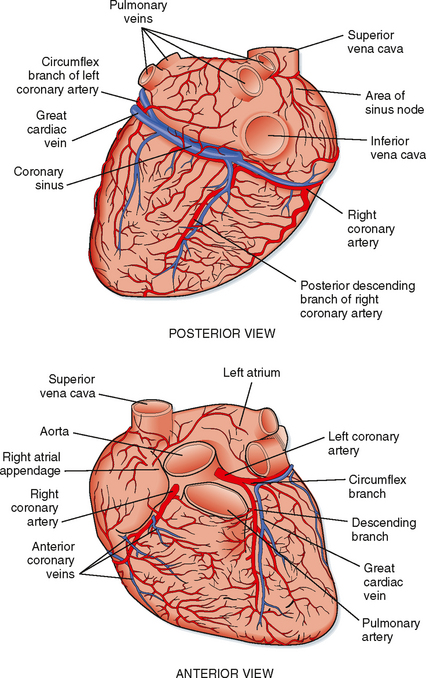
Figure 17-31 Anterior and posterior surfaces of the heart illustrating the location and distribution of the principal coronary vessels.
Coronary arterial blood passes through the capillary beds; most of it returns to the right atrium through the coronary sinus. Some of the coronary venous blood reaches the right atrium via the anterior coronary veins. In addition, vascular communications directly link the myocardial vessels with the cardiac chambers; these communications are the arteriosinusoidal, arterioluminal, and thebesian vessels. The arteriosinusoidal channels consist of small arteries or arterioles that lose their arterial structure as they penetrate the chamber walls, where they divide into irregular, endothelium-lined sinuses. These sinuses anastomose with other sinuses and with capillaries, and they communicate with the cardiac chambers. The arterioluminal vessels are small arteries or arterioles that open directly into the atria and ventricles. The thebesian vessels are small veins that connect capillary beds directly with the cardiac chambers and also communicate with the cardiac veins. All the minute vessels of the myocardium communicate in the form of an extensive plexus of subendocardial vessels. However, the myocardium does not receive significant nutritional blood flow directly from the cardiac chambers.
Factors That Influence Coronary Blood Flow
Physical Factors
The primary factor responsible for perfusion of the myocardium is aortic pressure. Changes in aortic pressure generally evoke parallel directional changes in coronary blood flow. This is caused in part by changes in coronary perfusion pressure. However, the major factor in the regulation of coronary blood flow is a change in arteriolar resistance engendered by changes in the metabolic activity of the heart. When the metabolic activity of the heart increases, coronary resistance decreases; when cardiac metabolism decreases, coronary resistance increases (see Chapter 18).
If a cannulated coronary artery is perfused by blood from a pressure-controlled reservoir, perfusion pressure can be altered without changing aortic pressure and cardiac work. The relationship between initial and steady-state blood flow is shown in the experiment in Figure 17-32. This is an example of autoregulation of blood flow, which is discussed in Chapter 18. Blood pressure is kept within narrow limits by baroreceptor reflex mechanisms. Hence, changes in coronary blood flow are mainly caused by changes in the diameter of coronary resistance vessels in response to the metabolic demands of the heart.
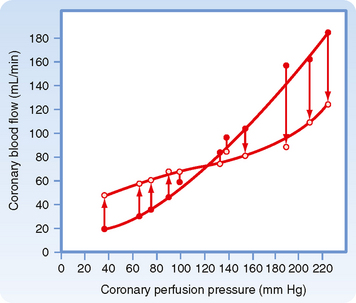
Figure 17-32 Pressure-flow relationships in the coronary vascular bed. At constant aortic pressure, cardiac output, and heart rate, coronary artery perfusion pressure was abruptly increased or decreased from the control level indicated by the point where the two lines cross. The closed circles represent the flows that were obtained immediately after the change in perfusion pressure; the open circles represent the steady-state flows at the new pressures. There is a tendency for flow to return toward the control level (autoregulation of blood flow), and this is most prominent over the intermediate pressure range (about 60 to 180 mm Hg).
(From Berne RM, Rubio R: Coronary circulation. In Handbook of Physiology (sect 2): The Cardiovascular System: The Heart, vol 1. Bethesda, MD, American Physiological Society, 1979.)
In addition to providing the pressure to move blood through the coronary vessels, the heart also affects its blood supply by the squeezing effect (extravascular compression) of the contracting myocardium on its own blood vessels. The patterns of coronary flow in the left and right coronary arteries are shown in Figure 17-33.
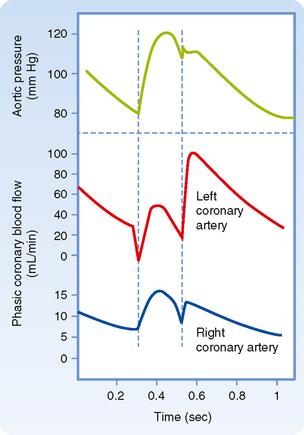
Figure 17-33 Comparison of phasic coronary blood flow in the left and right coronary arteries. Extravascular compression is so great during early ventricular systole that blood flow in the large coronary arteries supplying the left ventricle is briefly reversed. Maximal left coronary inflow occurs in early diastole, when the ventricles have relaxed and extravascular compression of the coronary vessels is virtually absent. After an initial reversal in early systole, left coronary blood flow follows the aortic pressure until early diastole, when it rises abruptly and then declines slowly as aortic pressure falls during the remainder of diastole.
Left ventricular myocardial pressure (pressure within the wall of the left ventricle) is greatest near the endocardium and least near the epicardium. This pressure gradient does not normally impair endocardial blood flow because the greater blood flow to the endocardium during diastole compensates for the greater blood flow to the epicardium during systole. Measurements of coronary blood flow indicate that blood flow to the epicardial and endocardial halves of the left ventricle is approximately equal under normal conditions. Because extravascular compression is greatest at the endocardial surface of the ventricle, the equality of epicardial and endocardial blood flow indicates that the tone of the endocardial resistance vessels is less than that of the epicardial vessels.
The minimal extravascular resistance and absence of left ventricular work during diastole can be used to improve myocardial perfusion in patients with damaged myocardium and low blood pressure. In a method called counterpulsation, an inflatable balloon is inserted into the thoracic aorta through a femoral artery. The balloon is inflated during each ventricular diastole and deflated during each systole. This procedure enhances coronary blood flow during diastole by raising diastolic pressure at a time when coronary extravascular resistance is lowest. Furthermore, it reduces cardiac energy requirements by lowering aortic pressure (afterload) during ventricular ejection.
The flow pattern in the right coronary artery is similar to that in the left coronary artery (Fig. 17-33). In contrast to the left ventricle, reversal of blood flow does not occur in the right ventricle in early systole because the thin right ventricle develops a lower pressure during systole. Hence, systolic blood flow constitutes a much greater proportion of total coronary inflow than it does in the left coronary artery.
The extent to which extravascular compression restricts coronary inflow can be readily seen when the heart is suddenly arrested in diastole or with the induction of ventricular fibrillation. Figure 17-34, A, depicts mean left coronary flow when the vessel was perfused with blood at a constant pressure from a reservoir. When ventricular fibrillation was electrically induced, an immediate and substantial increase in blood flow occurred. A subsequent increase in coronary resistance over a period of many minutes reduced myocardial blood flow to below the level that existed before induction of ventricular fibrillation (Fig. 17-34, B, just before stellate ganglion stimulation).
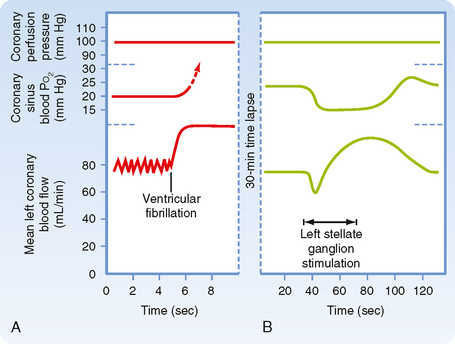
Figure 17-34 A, Unmasking of the restricting effect of ventricular systole on mean coronary blood flow by induction of ventricular fibrillation during perfusion of the left coronary artery at constant pressure. With the onset of ventricular fibrillation, coronary blood flow increases abruptly because extravascular compression is removed. Flow then gradually returns toward and often falls below the prefibrillation level. This increase in coronary resistance that occurs despite the removal of extravascular compression demonstrates the heart’s ability to adjust its blood flow to meet its energy requirements. B, Effect of cardiac sympathetic nerve stimulation on coronary blood flow and coronary sinus blood O2 tension in a fibrillating heart during perfusion of the left coronary artery at constant pressure. (Berne RM: Unpublished observations.)
When diastolic pressure in the coronary arteries is abnormally low (such as in severe hypotension, partial coronary artery occlusion, or severe aortic stenosis), the ratio of endocardial to epicardial blood flow falls below a value of 1. This ratio indicates that blood flow to the endocardial regions is more severely impaired than that to the epicardial regions of the ventricle. There is also an increase in the gradient of myocardial lactic acid and myocardial adenosine concentrations from epicardium to endocardium. For this reason, the myocardial damage observed in atherosclerotic heart disease (e.g., after coronary occlusion) is greatest in the inner wall of the left ventricle.
Tachycardia and bradycardia have dual effects on coronary blood flow. A change in heart rate mainly alters diastole. In tachycardia, the proportion of time spent in systole, and consequently the period of restricted inflow, increases. However, this mechanical effect is overridden by the dilation of coronary resistance vessels associated with the increased metabolic activity of the more rapidly beating heart. With bradycardia the opposite occurs; coronary inflow is less restricted (more time in diastole), but so are the metabolic (O2) requirements of the myocardium.
Neural and Neurohumoral Factors
Stimulation of cardiac sympathetic nerves markedly increases coronary blood flow. However, the increase in flow is associated with an increased heart rate and more forceful systole. The stronger contraction and the tachycardia tend to restrict coronary flow. The increase in myocardial metabolic activity, however, tends to dilate coronary resistance vessels. The increase in coronary blood flow evoked by cardiac sympathetic nerve stimulation reflects the sum of these factors. In perfused hearts in which the mechanical effect of extravascular compression is eliminated by cardiac arrest or by ventricular fibrillation, an initial coronary vasoconstriction is often observed. After this initial vasoconstriction, the metabolic effect evokes vasodilation (see Fig. 17-34, B).
Furthermore, when β-adrenergic receptor blockade eliminates the positive chronotropic and inotropic effects, activation of the cardiac sympathetic nerves increases coronary resistance. These observations indicate that the primary action of the sympathetic nerve fibers on the coronary resistance vessels is vasoconstriction.
α-Adrenergic receptors (constrictors) and βadrenergic receptors (dilators) are present on the coronary vessels. Coronary resistance vessels also participate in the baroreceptor and chemoreceptor reflexes, and the sympathetic constrictor tone of the coronary arterioles can be modulated by such reflexes. Nevertheless, coronary resistance is predominantly under local nonneural control.
Vagus nerve stimulation slightly dilates the coronary resistance vessels, and activation of the carotid and aortic chemoreceptors can slightly decrease coronary resistance via the vagus nerves to the heart. Failure of strong vagal stimulation to increase coronary blood flow is not due to lack of muscarinic receptors on the coronary resistance vessels because intracoronary administration of acetylcholine elicits marked vasodilation.
Metabolic Factors
A striking characteristic of the coronary circulation is the close relationship between the level of myocardial metabolic activity and the magnitude of coronary blood flow (Fig. 17-35). This relationship is also found in a denervated heart and in a completely isolated heart, either in the beating or in the fibrillating state. The fibrillating ventricles can fibrillate for many hours when the coronary arteries are perfused with arterial blood from some external source. As already noted, a fibrillating heart uses less O2 than a pumping heart does, and blood flow to the myocardium is reduced accordingly.
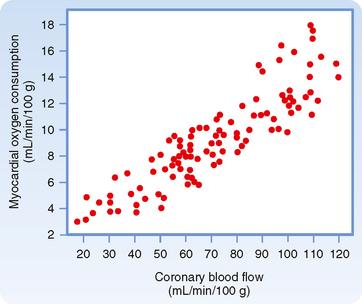
Figure 17-35 Relationship between myocardial O2 consumption and coronary blood flow during a variety of interventions that increase or decrease the myocardial metabolic rate.
(From Berne RM, Rubio R: Coronary circulation. In Handbook of Physiology (sect 2): The Cardiovascular System: The Heart, vol 1. Bethesda, MD, American Physiological Society, 1979.)
The mechanisms that link the cardiac metabolic rate and coronary blood flow remain unsettled. However, it appears that a decrease in the ratio of O2 supply to O2 demand releases vasodilator substances from the myocardial cells into the interstitial fluid, where they relax the coronary resistance vessels. Decreases in arterial blood O2 content or in coronary blood flow and increases in metabolic rate all decrease the O2 supply-demand ratio (Fig. 17-36). As a consequence, vasodilator substances are released. These substances dilate the arterioles and thereby adjust the O2 supply to the O2 demand. A decrease in O2 demand diminishes the release of vasodilators and permits greater expression of basal tone.
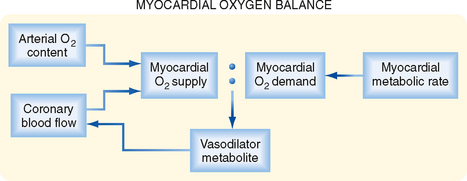
Figure 17-36 Imbalance in the O2 supply–O2 demand ratio alters coronary blood flow by the rate of release of a vasodilator metabolite from cardiomyocytes. A decrease in the ratio elicits an increase in vasodilator release, whereas an increase in the ratio has the opposite effect.
Numerous metabolites mediate the vasodilation that accompanies increased cardiac work. Accumulation of vasoactive metabolites can also account for the increase in blood flow that results from a brief period of ischemia (i.e., reactive hyperemia—see Chapter 18). The duration of the enhanced coronary flow after release of the briefly occluded vessel is, within certain limits, proportional to the duration of the period of occlusion. Among the factors implicated in reactive hyperemia are ATP-sensitive K+ (KATP) channels, NO, CO2, H+, K+, hypoxia, and adenosine.
Of these agents, the key factors appear to be adenosine, NO, and opening of the KATP channels. The contributions of each of these agents and their interaction under basal conditions and during increased myocardial activity are complex. A reduction in oxidative metabolism in vascular smooth muscle reduces ATP synthesis, which in turn opens KATP channels and causes hyperpolarization. This change in potential reduces entry of Ca++ and relaxes coronary vascular smooth muscle to increase flow. A reduction in ATP also opens KATP channels in cardiac muscle and generates an outward current that reduces the duration of the action potential and limits entry of Ca++ during phase 2 of the action potential. This action may serve a protective role during periods of imbalance between O2 supply and demand. Additionally, the release of vasodilators, such as NO and adenosine, dilates the arterioles and thereby adjusts the O2 supply to the O2 demand. At low concentrations, adenosine appears to activate endothelial KATP channels and to enhance release of NO. Conversely, at higher concentrations, adenosine acts directly on vascular smooth muscle by activating KATP channels. Decreased O2 demand would sustain the ATP level, as well as reduce the amount of vasodilator substances released and permit greater expression of basal tone. If production of all three agents is inhibited, coronary blood flow is reduced, both at rest and during exercise. Furthermore, contractile dysfunction and signs of myocardial ischemia become evident.
According to the adenosine hypothesis, a reduction in myocardial O2 tension produced by inadequate coronary blood flow, hypoxemia, or increased metabolic activity of the heart leads to release of adenosine from the myocardium. Adenosine enters the interstitial fluid space to reach the coronary resistance vessels and induces vasodilation by activating adenosine receptors. However, it cannot be responsible for the increased coronary flow observed during prolonged enhancement of cardiac metabolic activity because release of adenosine from cardiac muscle is transitory. Little evidence exists that CO2, H+, or O2 play a significant direct role in the regulation of coronary blood flow. Factors that alter coronary vascular resistance are illustrated in Figure 17-37.
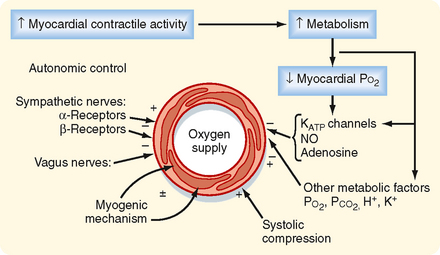
Effects of Diminished Coronary Blood Flow
Most of the O2 in coronary arterial blood is extracted during one passage through the myocardial capillaries. Thus, the supply of O2 to myocardial cells is flow limited; any substantial reduction in coronary blood flow will curtail O2 delivery to the myocardium because O2 extraction is nearly maximal even when blood flow is normal.
A reduction in coronary flow that is neither too prolonged nor too severe to induce myocardial necrosis can still cause substantial (but temporary) dysfunction of the heart. A relatively brief period of severe ischemia followed by reperfusion can result in pronounced mechanical dysfunction (myocardial stunning). However, the heart eventually recovers fully from the dysfunction. Pathophysiologically, the basis for myocardial stunning appears to be a result of intracellular Ca++ overload, initiated during the period of ischemia, combined with the generation of OH− and superoxide free radicals early in the period of reperfusion. These changes impair the responsiveness of myofilaments to Ca++.
Coronary Collateral Circulation and Vasodilators
In the normal human heart, there are virtually no functional intercoronary channels. Abrupt occlusion of a coronary artery or one of its branches leads to ischemic necrosis and eventual fibrosis of the areas of myocardium supplied by the occluded vessel. However, if a coronary artery narrows slowly and progressively over a period of days or weeks, collateral vessels develop and may furnish sufficient blood to the ischemic myocardium to prevent or reduce the extent of necrosis. Collateral vessels may develop between branches of occluded and nonoccluded arteries. They originate from preexisting small vessels that undergo proliferative changes of the endothelium and smooth muscle. These changes may occur in response to wall stress and to chemical agents, including vascular endothelial growth factor (VEGF) released by the ischemic tissue.
Myocardial stunning may be evident in patients who have suffered an acute coronary artery occlusion. If the patient is treated sufficiently early by coronary bypass surgery or balloon angioplasty and if adequate blood flow is restored to the ischemic region, the myocardial cells in this region may recover fully. However, for many days or even weeks, the contractility of the myocardium in the affected region may be grossly subnormal.
Prolonged reductions in coronary blood flow (myocardial ischemia) may critically and permanently impair the mechanical and electrical behavior of the heart. Diminished coronary blood flow as a consequence of coronary artery disease (usually coronary atherosclerosis) is one of the most common causes of serious cardiac disease. The ischemia may be global (affects an entire ventricle) or regional (affects some fraction of the ventricle). The impairment in mechanical contraction of the affected myocardium is produced not only by the diminished delivery of O2 and metabolic substrates but also by the accumulation of potentially harmful substances (e.g., K+, lactic acid, H+) in the cardiac tissues. If the reduction in coronary flow to any region of the heart is sufficiently severe and prolonged, necrosis of the affected cardiac cells will result.
The term myocardial hibernation is used to describe the phenomenon in which cellular metabolism is down-regulated in cells whose function is impaired by inadequate delivery of O2 and nutrients. Myocardial hibernation occurs mainly in patients with coronary artery disease, just as myocardial stunning does. The coronary blood flow in these patients is diminished persistently and significantly, and the mechanical function of the heart is impaired. If coronary blood flow is restored to normal by bypass surgery or angioplasty, mechanical function returns to normal.
CUTANEOUS CIRCULATION
The O2 and nutrient requirements of the skin are relatively small. Unlike other body tissues, the supply of O2 and nutrients is not the chief factor in the regulation of cutaneous blood flow. The primary function of the cutaneous circulation is to maintain a constant body temperature. Thus, the skin undergoes wide fluctuations in blood flow, depending on whether the body needs to lose or conserve heat. Changes in ambient and internal body temperature activate mechanisms responsible for alterations in skin blood flow.
Numerous surgical attempts have been made to enhance the development of coronary collateral vessels. However, the techniques used do not increase the collateral circulation over and above that produced by coronary artery narrowing alone. When discrete occlusions or severe narrowing occurs in coronary arteries, as in coronary atherosclerosis, the lesions can be bypassed with an artery or a vein graft. Frequently, the narrow segment can be dilated by inserting a balloon-tipped catheter into the diseased vessel via a peripheral artery and then inflating the balloon. Distention of the vessel by balloon inflation (angioplasty) can produce lasting dilation of a narrowed coronary artery (Fig. 17-38), particularly when a drug-eluting stent (the drugs help prevent restenosis) is inserted during angioplasty.
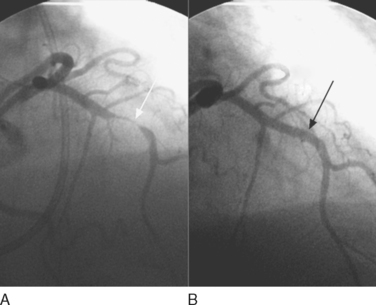
Figure 17-38 A, Angiogram (intracoronary radiopaque dye) of a person with marked narrowing of the left anterior descending (LAD) branch of the left coronary artery (white arrow). B, The same segment of the coronary artery after angioplasty and insertion of a drug-eluting stent.
(Courtesy Dr. Michael Azrin.)
Many drugs are available for use in patients with coronary artery disease to relieve angina pectoris, the chest pain associated with myocardial ischemia. These compounds include organic nitrates/nitrites, Ca++ channel antagonists, and β-adrenoceptor antagonists. Organic nitrates and nitrites are metabolized to NO. NO dilates the great veins to reduce venous return (preload), thereby reducing cardiac work (see Chapter 19) and myocardial O2 requirements. In addition, NO dilates the coronary arteries to increase collateral flow. Importantly, organic nitrates/nitrites do not interfere with coronary autoregulation. Calcium channel antagonists also cause vasodilation; none selectively dilates the coronary vessels. β-Adrenoceptor antagonists reduce the heart rate to indirectly increase coronary flow and oppose the reflex tachycardia seen with organic nitrates/nitrites.
In patients with marked narrowing of a coronary artery, administration of dipyridamole, a vasodilator, can fully dilate normal vessel branches that are parallel to the narrowed segment and thereby reduce the head of pressure to the partially occluded vessel. The reduced pressure to the narrowed vessel will further compromise blood flow to the ischemic myocardium. This phenomenon is known as coronary steal, and it occurs because dipyridamole acts by blocking the cellular uptake and metabolism of endogenous adenosine. Notably, dipyridamole interferes with coronary autoregulation.
REGULATION OF SKIN BLOOD FLOW
Neural Factors
The skin contains essentially two types of resistance vessels: arterioles and arteriovenous anastomoses. AV anastomoses shunt blood from the arterioles to the venules and venous plexuses; hence, they bypass the capillary bed. Such anastomoses are found in the fingertips, palms of the hands, toes, soles of the feet, ears, nose, and lips. AV anastomoses differ morphologically from arterioles; the anastomoses are either short, straight, or long coiled vessels, about 20 to 40 μm in luminal diameter, and they have thick muscular walls richly supplied with nerve fibers (Fig. 17-39). These vessels are almost exclusively under sympathetic neural control, and they dilate maximally when their nerve supply is interrupted. Conversely, reflex stimulation of the sympathetic fibers to these vessels may constrict them and obliterate the vascular lumen. Although AV anastomoses do not exhibit basal tone, they are highly sensitive to vasoconstrictor agents such as epinephrine and norepinephrine. Furthermore, AV anastomoses are not under metabolic control, and they do not show reactive hyperemia or autoregulation of blood flow. Thus, regulation of blood flow through these anastomotic channels is governed principally by the nervous system in response to reflex activation by temperature receptors or from higher centers of the central nervous system.
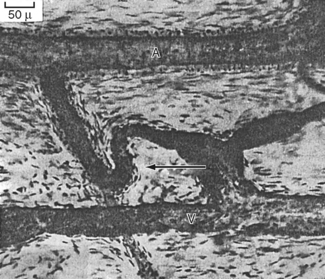
Figure 17-39 AV anastomosis in the ear injected with Berlin blue. A, artery; V, vein; arrow points to an AV anastomosis. The walls of the AV anastomosis in the fingertips are thicker and more cellular.
(From Pritchard MML, Daniel PM: J Anat 90:309, 1956.)
The fingers and toes of some individuals are very sensitive to cold. On exposure to cold, the arterioles to the fingers and toes constrict. The consequent ischemia results in localized blanching of the skin associated with tingling, numbness, and pain. The blanching is followed by cyanosis (a dark blue color of the skin) and later by redness as the arterial spasm subsides. The cause of this condition, called Raynaud’s disease, is unknown.
Most of the resistance vessels in the skin exhibit some basal tone and are under dual control of the sympathetic nervous system and local regulatory factors. However, neural control predominates. Stimulation of sympathetic nerve fibers induces vasoconstriction, and cutting the sympathetic nerves induces vasodilation. After chronic denervation of the cutaneous blood vessels, the degree of tone that existed before denervation is gradually regained over a period of several weeks. This restoration of tone is accomplished by an enhancement of basal tone. Denervation of the skin vessels results in enhanced sensitivity to catecholamines in circulation (denervation hypersensitivity).
Parasympathetic vasodilator nerve fibers do not innervate cutaneous blood vessels. However, stimulation of the sweat glands, which are innervated by sympathetic cholinergic fibers, dilates the skin resistance vessels. Sweat contains an enzyme that lyses a protein (kallidin) in the tissue fluid to produce bradykinin, a polypeptide with potent vasodilator properties. Bradykinin, formed locally, dilates the arterioles and increases blood flow to the skin.
Certain skin vessels, particularly those in the head, neck, shoulders, and upper part of the chest, are regulated by higher centers in the brain. Blushing, in response to embarrassment or anger, and blanching, in response to fear or anxiety, are examples of cerebral inhibition and stimulation, respectively, of the sympathetic nerve fibers to the affected cutaneous regions.
In contrast to AV anastomoses in the skin, the resistance vessels display autoregulation of blood flow and reactive hyperemia. If the arterial inflow to a limb is stopped by inflating a blood pressure cuff briefly, the skin becomes bright red below the point of vascular occlusion when the cuff is subsequently deflated. The increased cutaneous blood flow (reactive hyperemia) is also manifested by distention of the superficial veins in the affected extremity.
The Role of Temperature in the Regulation of Skin Blood Flow
The primary function of the skin is to maintain a constant internal environment and protect the body from adverse changes. Ambient temperature is one of the most important external variables with which the body must contend. Exposure to cold elicits a generalized cutaneous vasoconstriction that is especially pronounced in the hands and feet. This response is chiefly mediated by the nervous system. Arrest of the circulation to a hand by a pressure cuff plus immersion of that hand in cold water induces vasoconstriction in the skin of the other extremities that are exposed to room temperature. When the circulation to the chilled hand is not occluded, the reflex generalized vasoconstriction is caused in part by the cooled blood that returns to the general circulation. This returned blood then stimulates the temperature-regulating center in the anterior hypothalamus, which also responds to direct application of cold to evoke cutaneous vasoconstriction.
The skin vessels of the cooled hand also respond directly to cold. Moderate cooling or a brief exposure to severe cold (0° C to 15° C) constricts the resistance and capacitance vessels, including the AV anastomoses. Prolonged exposure to severe cold evokes a secondary vasodilator response. Prompt vasoconstriction and severe pain are elicited by immersion of the hand in ice water. However, this response is soon followed by dilation of the skin vessels, with reddening of the immersed part and alleviation of the pain. With continued immersion of the hand, alternating periods of constriction and dilation occur, but the skin temperature rarely drops as much as it did in response to the initial vasoconstriction. Prolonged severe cold, of course, damages tissue. The rosy faces of people exposed to a cold environment are examples of cold vasodilation. However, blood flow through the skin of the face may be greatly reduced despite the flushed appearance. The red color of the slowly flowing blood is mainly caused by reduced O2 uptake by the cold skin and the cold-induced shift of the oxyhemoglobin dissociation curve to the left (see Chapter 23).
Direct application of heat to the skin not only dilates the local resistance and capacitance vessels and AV anastomoses but also reflexly dilates blood vessels in other parts of the body. The local effect is independent of the vascular nerve supply, whereas the reflex vasodilation is a combined response to stimulation of the anterior hypothalamus by the returning warmed blood and stimulation of cutaneous heat receptors in the heated regions of the skin.
The close proximity of the major arteries and veins permits countercurrent heat exchange between them. Cold blood that flows in veins from a cooled hand toward the heart takes up heat from adjacent arteries; this warms the venous blood and cools the arterial blood. Heat exchange takes place in the opposite direction when the extremity is exposed to heat. Thus, heat conservation is enhanced during exposure of extremities to cold environments, and heat conservation is minimized during exposure of the extremities to warm environments.
Skin Color: Relationship to Skin Blood Volume, Oxyhemoglobin, and Blood Flow
Skin color is determined mainly by the pigment content. However, the degree of pallor or ruddiness is mainly a function of the amount of blood in the skin, except when the skin is very dark. With little blood in the venous plexus, the skin appears pale, whereas with moderate to large quantities of blood in the venous plexus, the skin displays a color. This color may be red, blue, or some shade between, depending on the degree of oxygenation of the blood. A combination of vasoconstriction and reduced hemoglobin can impart an ashen gray color to the skin. A combination of venous engorgement and reduced hemoglobin content can impart a dark purple hue.
Skin color provides little information about the rate of cutaneous blood flow. Rapid blood flow may be accompanied by pale skin when the AV anastomoses are open, and slow blood flow may be associated with red skin when the skin is exposed to cold.
SKELETAL MUSCLE CIRCULATION
The rate of blood flow in skeletal muscle varies directly with the contractile activity of the tissue and the type of muscle. Blood flow and capillary density in red muscle (slow twitch, high oxidative capacity) are greater than in white muscle (fast twitch, low oxidative capacity). In resting muscle, the precapillary arterioles contract and relax intermittently. Thus, at any given moment, most of the capillary bed is not perfused and total blood flow through quiescent skeletal muscle is low (1.4 to 4.5 mL/min/100 g). During exercise, the resistance vessels relax and muscle blood flow may increase to 15 to 20 times the resting level, depending on the intensity of the exercise.
Regulation of Skeletal Muscle Blood Flow
Neural and local factors regulate muscle circulation. Physical factors such as arterial pressure, tissue pressure, and blood viscosity influence muscle blood flow. However, another physical factor, the squeezing effect of the active skeletal muscle, affects blood flow in the vessels. With intermittent contractions, inflow is restricted, and as previously described, venous outflow is enhanced. The venous valves prevent backflow of blood between contractions and thereby aid in the forward propulsion of blood. With strong sustained contractions, as occurs during exercise, the vascular bed can be compressed to the point where blood flow actually ceases temporarily.
Neural Factors
The resistance vessels of muscle possess a high degree of basal tone; they also display tone in response to continuous low-frequency activity in the sympathetic vasoconstrictor nerve fibers. The basal firing frequency of sympathetic vasoconstrictor fibers is only about 1 to 2 per second, and maximal vasoconstriction occurs at frequencies of about 10 per second.
Vasoconstriction evoked by sympathetic nerve activity is caused by the local release of norepinephrine. Intraarterially injected norepinephrine elicits only vasoconstriction (α-adrenergic receptor). In contrast, low doses of epinephrine produce vasodilation (β-adrenergic receptor), whereas large doses cause vasoconstriction.
Baroreceptor reflexes greatly influence the tonic activity of the sympathetic nerves. An increase in carotid sinus pressure dilates the muscle vascular bed, whereas a decrease in carotid sinus pressure elicits vasoconstriction (Fig. 17-40). When sympathetic constrictor tone is high, the decrease in blood flow evoked by common carotid artery occlusion is small, but the increase in flow after the release of occlusion is large. The vasodilation produced by baroreceptor stimulation is caused by inhibition of sympathetic vasoconstrictor activity.
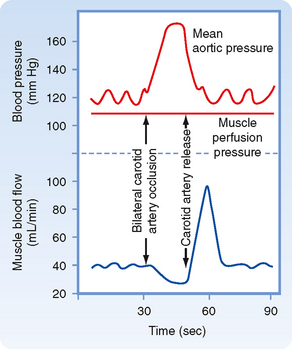
Figure 17-40 Evidence for participation of the muscle vascular bed in vasoconstriction and vasodilation mediated by the carotid sinus baroreceptors after common carotid artery occlusion and release. In this preparation, the sciatic and femoral nerves constituted the only direct connection between the hind leg muscle mass and the rest of the dog. The muscle was perfused by blood at a constant pressure that was completely independent of the animal’s arterial pressure.
(Redrawn from Jones RD, Berne RM: Am J Physiol 204:461, 1963.)
The resistance vessels in skeletal muscle contribute significantly to maintenance of arterial blood pressure because skeletal muscle constitutes a large fraction of the body’s mass and hence the muscle vasculature constitutes the largest vascular bed. Participation of the skeletal muscle vessels in vascular reflexes is important in maintaining normal arterial blood pressure.
A comparison of the sympathetic neural effects on the blood vessels of muscle and skin is summarized in Figure 17-41. Note that the lower the basal tone of the skin vessels, the greater their constrictor response; also note the absence of active cutaneous vasodilation.
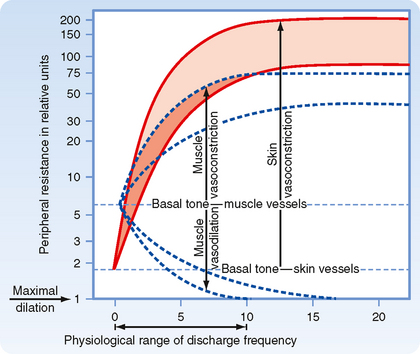
Local Factors
In active skeletal muscle, blood flow is regulated by metabolic factors. In resting muscle, neural factors predominate, and they superimpose neurogenic tone on basal tone (Fig. 17-41). Cutting the sympathetic nerves to muscle abolishes the neural component of vascular tone, and it unmasks the intrinsic basal tone of the blood vessels. The neural and local mechanisms that regulate blood flow oppose each other, and during muscle contraction the local vasodilator mechanism supervenes. However, during exercise, strong sympathetic nerve stimulation slightly attenuates the vasodilation induced by locally released metabolites.
CEREBRAL CIRCULATION
Blood reaches the brain through the internal carotid and vertebral arteries. The vertebral arteries join to form the basilar artery, which in conjunction with branches of the internal carotid arteries, forms the circle of Willis.
A unique feature of the cerebral circulation is that it lies within a rigid structure, the cranium. Because the intracranial contents are incompressible, any increase in arterial inflow must be associated with a comparable increase in venous outflow. The volume of blood and extravascular fluid can vary considerably in most body tissues. In the brain, however, the volume of blood and extravascular fluid is relatively constant; a change in one of these fluid volumes must be accompanied by a reciprocal change in the other. Unlike most other organs, the rate of total cerebral blood flow is maintained within a narrow range; in humans, it averages 55 mL/min/100 g of brain.
Regulation of Cerebral Blood Flow
Of all body tissues, the brain is the least tolerant of ischemia. Interruption of cerebral blood flow for as little as 5 seconds leads to loss of consciousness, and ischemia lasting just a few minutes results in irreversible tissue damage. Local regulatory mechanisms and reflexes originating in the brain maintain cerebral circulation at a relatively constant level.
Neural Factors
The cerebral vessels are innervated by cervical sympathetic nerve fibers that accompany the internal carotid and vertebral arteries into the cranial cavity. The importance of neural regulation of the cerebral circulation is controversial. The sympathetic control of cerebral vessels appears to be weaker than that in other vascular beds, and the contractile state of cerebrovascular smooth muscle appears to depend mainly on local metabolic factors.
Local Factors
Generally, total cerebral blood flow is relatively constant. However, regional blood flow in the brain is associated with regional neural activity. For example, movement of one hand results in increased blood flow only in the hand area of the contralateral sensorimotor and premotor cortex. In addition, talking, reading, and other stimuli to the cerebral cortex are associated with increased blood flow in the appropriate regions of the contralateral cortex (Fig. 17-42). Glucose uptake also corresponds with regional cortical neuronal activity. Thus, when the retina is stimulated by light, uptake of glucose is enhanced in the visual cortex.
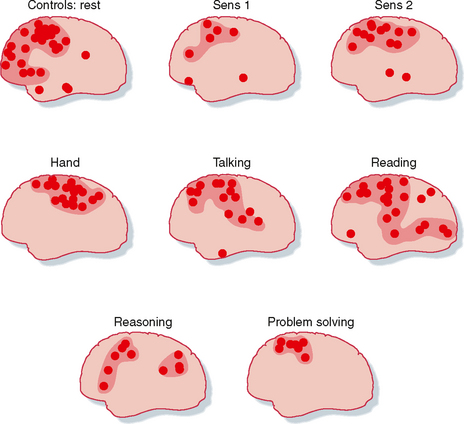
Figure 17-42 Effects of different stimuli on regional blood flow in the contralateral human cerebral cortex. Sens 1, low-intensity electrical stimulation of the hand; Sens 2, high-intensity electrical stimulation of the hand (pain).
(Redrawn from Ingvar DH: Brain Res 107:181, 1976.)
The cerebral vessels are very sensitive to CO2 tension. Increases in arterial blood CO2 tension (PCO2) elicit marked cerebral vasodilation; inhalation of 7% CO2 increases cerebral blood flow twofold. Conversely, decreases in PCO2, as caused by hyperventilation, diminish cerebral blood flow. CO2 causes these changes by altering perivascular (and probably intracellular vascular smooth muscle) pH, which in turn alters arterial resistance to flow. By independently changing PCO2 and the bicarbonate concentration, pial vessel (vessels of the pia mater) diameter and blood flow were shown to be inversely related to pH, regardless of the level of PCO2.
Elevated intracranial pressure, as caused by a brain tumor, results in an increase in systemic blood pressure. This response, called Cushing’s phenomenon, is apparently evoked by ischemic stimulation of vasomotor regions in the medulla. Cushing’s phenomenon helps maintain cerebral blood flow in such conditions as expanding intracranial tumors.
CO2 can diffuse to vascular smooth muscle from brain tissue or from the lumen of the vessels, whereas H+ in blood is prevented from reaching arteriolar smooth muscle by the blood-brain barrier. Hence, the cerebral vessels dilate when the [H+] of cerebrospinal fluid is increased, but these vessels dilate only minimally in response to an increase in the [H+] of arterial blood.
[K+] also affects cerebral blood flow. Hypoxia, electrical stimulation of the brain, and seizures elicit rapid increases in cerebral blood flow and in perivascular [K+]. The increases in [K+] are similar in magnitude to those that produce pial arteriolar dilation when K+ is applied topically to these vessels. However, the increase in [K+] is not sustained throughout the period of cerebral stimulation. Thus, only the initial increase in cerebral blood flow can be attributed to the release of K+.
Adenosine affects cerebral blood flow. Adenosine levels in the brain increase in response to ischemia, hypoxemia, hypotension, hypocapnia, electrical stimulation of the brain, and induced seizures. Topically applied adenosine is a potent dilator of the pial arterioles. Any intervention that either reduces the O2 supply to the brain or increases the O2 requirements of the brain results in the rapid (within 5 seconds) formation of adenosine in cerebral tissue. Unlike the changes in pH or K+, the adenosine concentration of the brain increases with initiation of the change in O2 supply, and it remains elevated throughout the period of O2 imbalance. The adenosine that is released into cerebrospinal fluid during cerebral ischemia becomes incorporated into adenine nucleotides in cerebral tissue. These local factors—pH, K+, and adenosine—may all act in concert to adjust cerebral blood flow to the metabolic activity of the brain.
The cerebral circulation displays reactive hyperemia and excellent autoregulation when arterial blood pressure is between 60 and 160 mm Hg. Mean arterial pressures below 60 mm Hg result in reduced cerebral blood flow and then syncope, whereas mean pressures above 160 mm Hg may lead to increased permeability of the blood-brain barrier and consequently to cerebral edema. Hypercapnia or any other potent vasodilator abolishes autoregulation of cerebral blood flow. None of the candidates for metabolic regulation of cerebral blood flow account for this phenomenon. Hence, autoregulation of cerebral blood flow is probably mediated by a myogenic mechanism, but experimental proof is still lacking.
INTESTINAL CIRCULATION
Anatomy
The gastrointestinal tract is supplied by the celiac, superior mesenteric, and inferior mesenteric arteries. The superior mesenteric artery carries more than 10% of the cardiac output. Small mesenteric arteries form an extensive vascular network in the submucosa of the gastrointestinal tract (Fig. 17-43). The arterial branches penetrate the longitudinal and circular muscle layers of the tract, and they give rise to third- and fourth-order arterioles. Some third-order arterioles in the submucosa supply the tips of the villi.
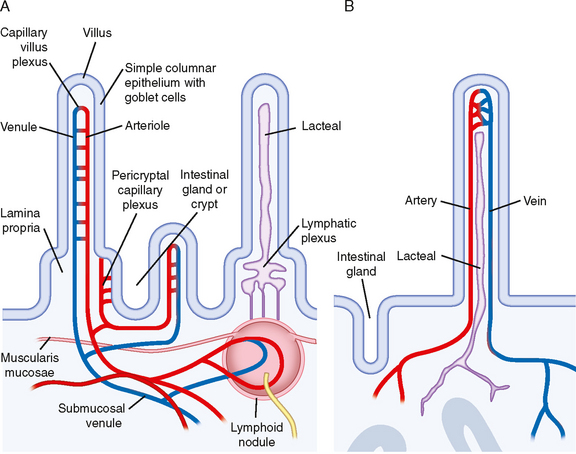
Figure 17-43 Microcirculation pattern of the small intestine. A, Capillary plexuses arise from arterioles in the villus and also in the crypt. Blood leaves the crypt via venules that enter the portal circulation. B, Lymphatic vessels (lacteals) originate within the villus and eventually form a plexus at the base of the villus.
(Redrawn from Kierszenbaum A: Histology and Cell Biology: An Introduction to Pathology. Philadelphia, Mosby, 2002.)
The direction of blood flow in the capillaries and venules in a villus is opposite that in the main arteriole (Fig. 17-43). This arrangement is a countercurrent exchange system. Effective countercurrent exchange also permits diffusion of O2 from arterioles to venules. At low blood flow rates, a substantial portion of the O2 may be shunted from arterioles to venules near the base of the villus. This reduces the O2 supply to the mucosal cells at the tip of the villus. When intestinal blood flow is very low, shunting of O2 is so great that extensive necrosis of the intestinal villi takes place.
Neural Regulation
Neural control of the mesenteric circulation is almost exclusively sympathetic. Increased sympathetic activity, through α-adrenergic receptors, constricts the mesenteric arterioles and capacitance vessels. These receptors are prepotent in the mesenteric circulation. However, β-adrenergic receptors are also present, so the agonist isoproterenol causes vasodilation.
In response to aggressive behavior or to artificial stimulation of the hypothalamic “defense” area, pronounced vasoconstriction occurs in the mesenteric vascular bed. This vasoconstriction shifts blood flow from the less important intestinal circulation to the more crucial skeletal muscles, heart, and brain.
Autoregulation
Autoregulation of blood flow in the intestinal circulation is not as well developed as in other vascular beds. The principal mechanism responsible for autoregulation is metabolic, although a myogenic mechanism probably also participates (see Chapter 18). The adenosine concentration in mesenteric venous blood rises fourfold after brief arterial occlusion. It also rises during enhanced metabolic activity of the intestinal mucosa, such as during absorption of food. Adenosine, a potent vasodilator in the mesenteric vascular bed, may be the principal metabolic mediator of autoregulation. However, K+ and altered osmolality may also contribute to autoregulation.
O2 consumption of the small intestine is more rigorously controlled than blood flow. Experiments have shown that O2 uptake of the small intestine remains constant when arterial perfusion pressure is varied between 30 and 125 mm Hg.
Functional Hyperemia
Food ingestion increases intestinal blood flow. Secretion of certain gastrointestinal hormones contributes to this hyperemia. Gastrin and cholecystokinin augment intestinal blood flow, and they are secreted when food is ingested. Absorption of food also affects intestinal blood flow. Undigested food has no vasoactive influence, whereas several products of digestion are potent vasodilators. Among the various constituents of chyme, the principal mediators of mesenteric hyperemia are glucose and fatty acids.
HEPATIC CIRCULATION
Anatomy
Blood flow to the liver is normally about 25% of cardiac output. Hepatic blood flow is derived from two sources: the portal vein (about 75%) and the hepatic artery. Because portal venous blood has already passed through the gastrointestinal capillary bed, much of the O2 of the portal vein blood flow has already been extracted. The hepatic artery delivers the remaining 25% of the blood, which is fully saturated with O2. Hence, about three fourths of the O2 used by the liver is derived from hepatic arterial blood.
The small branches of the portal vein and hepatic artery give rise to terminal portal venules and hepatic arterioles (Fig. 17-44). These terminal vessels enter the hepatic acinus (the functional unit of the liver) at its center. Blood flows from these terminal vessels into the sinusoids, which constitute the capillary network of the liver. The sinusoids radiate toward the periphery of the acinus, where they connect with the terminal hepatic venules. Blood from these terminal venules drains into progressively larger branches of the hepatic veins, which are tributaries of the inferior vena cava.
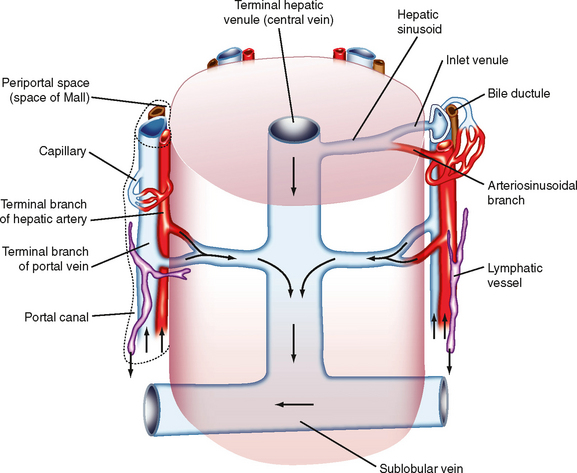
Figure 17-44 Microcirculation of the hepatic acinus. Arrows indicate the direction of blood flow from the terminal portions of the hepatic artery and portal vein to the sinusoids. The mixture of arterial and venous blood flows into the central vein and then passes into the sublobular vein.
(Redrawn from Ross MH, Pawling W: Histology: A Text and Atlas: with Correlated Cell and Molecular Biology. Philadelphia, Lippincott Williams & Wilkins, 2006.)
Hemodynamics
Mean blood pressure in the portal vein is about 10 mm Hg, and mean blood pressure in the hepatic artery is about 90 mm Hg. The resistance of the vessels upstream to the hepatic sinusoids is considerably greater than that of the downstream vessels. Consequently, the pressure in the sinusoids is only 2 or 3 mm Hg greater than that in the hepatic veins and inferior vena cava. The ratio of presinusoidal to postsinusoidal resistance in the liver is much greater than it is in almost any other vascular bed. Hence, drugs and other interventions that alter presinusoidal resistance usually affect pressure in the sinusoids and fluid exchange across the sinusoidal wall only slightly. However, changes in hepatic and central venous pressure are transmitted almost quantitatively to the hepatic sinusoids, and they profoundly affect the transsinusoidal exchange of fluids.
Regulation of Flow
Blood flow in the portal venous and hepatic arterial systems varies reciprocally. When blood flow is curtailed in one system, flow increases in the other but does not fully compensate for the decreased flow in the first system.
The portal venous system does not autoregulate. As portal venous pressure and flow are raised, resistance either remains constant or decreases. The hepatic arterial system does autoregulate, however, and adenosine may be involved in this adjustment of blood flow.
The liver tends to maintain constant O2 consumption because O2 extraction from hepatic blood is very efficient. As the rate of O2 delivery to the liver varies, the liver compensates by an appropriate change in the fraction of O2 extracted from blood. Such extraction is facilitated by the distance between the presinusoidal vessels at the acinar center and the postsinusoidal vessels at the periphery of the acinus (Fig. 17-44). The substantial distance between these types of vessels prevents countercurrent exchange of O2, contrary to the countercurrent exchange that occurs in an intestinal villus.
The sympathetic nerves constrict the presinusoidal resistance vessels in the portal venous and hepatic arterial systems. Neural effects on the capacitance vessels are more important, however. The liver contains about 15% of the total blood volume of the body. Under appropriate conditions, as in response to hemorrhage, about half of the hepatic blood volume can be rapidly expelled by constriction of the capacitance vessels (see also Chapter 19). Hence, the liver is an important blood reservoir in humans.
When central venous pressure is elevated, as in congestive heart failure, large volumes of plasma water transude from the liver into the peritoneal cavity; this accumulation of fluid in the abdomen is known as ascites. Extensive fibrosis of the liver, as in hepatic cirrhosis, markedly increases hepatic vascular resistance and thereby raises pressure substantially in the portal venous system. The consequent increase in capillary hydrostatic pressure through the splanchnic circulation also leads to extensive fluid transudation into the abdominal cavity. The pressure may likewise rise substantially in other veins that anastomose with the portal vein. For example, the esophageal veins may enlarge considerably to form esophageal varices. These varices may rupture and lead to severe, frequently fatal internal bleeding. To prevent these grave problems associated with elevated portal venous pressure in cirrhosis of the liver, an anastomosis (portacaval shunt) is often inserted surgically between the portal vein and inferior vena cava to lower portal venous pressure.
FETAL CIRCULATION
In Utero
Fetal circulation differs from that of postnatal infants. Most importantly, the fetal lungs are functionally inactive, and the fetus depends completely on the placenta for O2 and nutrients. Oxygenated fetal blood from the placenta passes through the umbilical vein to the liver. Approximately half the flow from the placenta passes through the liver, and the remainder bypasses the liver and reaches the inferior vena cava through the ductus venosus (Fig. 17-45). In the inferior vena cava, blood from the ductus venosus joins the blood returning from the lower part of the trunk and the extremities. This combined stream in turn merges with blood from the liver through the hepatic veins.
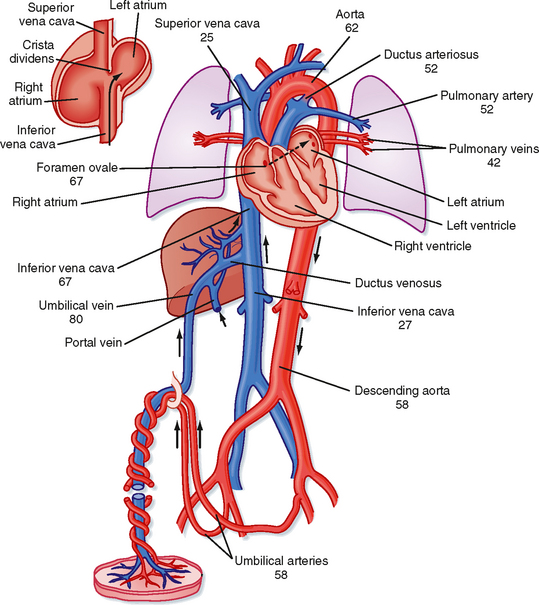
Figure 17-45 Schematic diagram of the fetal circulation. The numbers represent the percent O2 saturation of the blood flowing in the indicated blood vessel. Fetal blood that leaves the placenta is 80% saturated, but the saturation of the blood that passes through the foramen ovale is reduced to 67%. This reduction in O2 saturation is caused by mixing with desaturated blood returning from the lower part of the body and the liver. Addition of the desaturated blood from the lungs reduces the O2 saturation of left ventricular blood to 62%, which is the level of saturation of the blood reaching the head and upper extremities. The blood in the right ventricle, which is a mixture of desaturated superior vena caval blood, coronary venous blood, and inferior vena caval blood, is only 52% saturated with O2. When the major portion of this blood traverses the ductus arteriosus and joins that pumped by the left ventricle, the resulting O2 saturation of the blood traveling to the lower part of the body and back to the placenta is 58%. The inset at upper left illustrates the direction of flow of a major portion of the inferior vena caval blood through the foramen ovale to the left atrium.
(Data from Dawes GS et al: J Physiol 126:563, 1954.)
The streams of blood tend to maintain their identities in the inferior vena cava and are divided into two streams of unequal size by the edge of the interatrial septum (crista dividens). The larger stream, which contains mainly blood from the umbilical vein, is shunted from the inferior vena cava to the left atrium through the foramen ovale (Fig. 17-45). The other stream passes into the right atrium, where it merges with blood returning from the upper parts of the body through the superior vena cava and with blood from the myocardium.
Unlike in adults, the ventricles in a fetus operate essentially in parallel. Only a tenth of right ventricular output passes through the lungs because the pulmonary vascular resistance of the fetus is high. The remainder passes from the pulmonary artery through the ductus arteriosus to the aorta at a point distal to the origins of the arteries to the head and upper extremities. Blood flows from the pulmonary artery to the aorta because pulmonary vascular resistance is high and the diameter of the ductus arteriosus is as large as that of the descending aorta.
The large volume of blood that passes through the foramen ovale into the left atrium is joined by blood returning from the lungs, and it is pumped out by the left ventricle into the aorta. Most of the blood in the ascending aorta goes to the head, upper thorax, and arms; the remainder joins blood from the ductus arteriosus and supplies the rest of the body. The amount of blood pumped by the left ventricle is about half that pumped by the right ventricle. The major fraction of the blood that passes down the descending aorta comes from the ductus arteriosus and right ventricle and flows by way of the two umbilical arteries to the placenta.
O2 saturation of blood occurs at various loci (Fig. 17-45). Thus, the tissues that receive the most highly saturated blood are the liver, heart, and upper parts of the body, including the head.
At the placenta, the chorionic villi dip into the maternal sinuses, and O2, CO2, nutrients, and metabolic waste products are exchanged across the membranes. The barrier to exchange prevents equilibration of O2 between the two circulations at normal rates of blood flow. Therefore, the PO2 of the fetal blood that leaves the placenta is very low. Were it not for the fact that fetal hemoglobin has a greater affinity for O2 than adult hemoglobin does, the fetus would not receive an adequate O2 supply. The fetal oxyhemoglobin dissociation curve is shifted to the left. Therefore, at equal pressures of O2, fetal blood carries significantly more O2 than maternal blood does.
In early fetal life, the high glycogen levels that prevail in cardiac myocytes may protect the heart from acute periods of hypoxia. Glycogen levels decrease in late fetal life, and they reach adult levels by term.
Circulatory Changes That Occur at Birth
The umbilical vessels have thick muscular walls that react to trauma, tension, sympathomimetic amines, bradykinin, angiotensin, and changes in PO2. In animals in which the umbilical cord is not tied, hemorrhage of the newborn is minimized by constriction of these large umbilical vessels in response to the stimuli cited earlier.
Closure of the umbilical vessels increases TPR and the arterial blood pressure of the infant. When blood flow through the umbilical vein ceases, the ductus venosus, a thick-walled vessel with a muscular sphincter, closes. The factor that initiates closure of the ductus venosus is unknown.
If a pregnant woman is subjected to hypoxia, the reduced blood PO2 in the fetus evokes tachycardia and an increase in blood flow through the umbilical vessels. If the hypoxia persists or if flow through the umbilical vessels is impaired, fetal distress occurs and is manifested initially as bradycardia.
Immediately after birth, the asphyxia caused by constriction or clamping of the umbilical vessels, together with cooling of the body, activates the respiratory center of the newborn infant. As the lungs fill with air, pulmonary vascular resistance decreases to about 10% of the value that existed before lung expansion. This change in vascular resistance is not caused by the presence of O2 in the lungs because the change is just as great if the lungs are filled with N2. However, filling the lungs with liquid does not reduce pulmonary vascular resistance.
After birth, left atrial pressure is raised above that in the inferior vena cava and right atrium by (1) the decrease in pulmonary resistance, with the consequent large flow of blood through the lungs to the left atrium; (2) the reduction of flow to the right atrium caused by occlusion of the umbilical vein; and (3) the increased resistance to left ventricular output produced by occlusion of the umbilical arteries. Reversal of the pressure gradient across the atria abruptly closes the valve over the foramen ovale, and the septal leaflets fuse over a period of several days.
The decrease in pulmonary vascular resistance causes the pressure in the pulmonary artery to fall to about half its previous level (to about 35 mm Hg). This change in pressure, coupled with a slight increase in aortic pressure, reverses the flow of blood through the ductus arteriosus. However, within several minutes, the large ductus arteriosus begins to constrict. This constriction produces turbulent flow, which is manifested as a murmur in newborn infants. Constriction of the ductus arteriosus is progressive and usually complete within 1 to 2 days after birth. Closure of the ductus arteriosus appears to be initiated by the high PO2 of the arterial blood passing through it; pulmonary ventilation with O2 closes the ductus, whereas ventilation with air low in O2 opens this shunt vessel. Whether O2 acts directly on the ductus or through the release of a vasoconstrictor substance is not known.
At birth, the walls of the two ventricles are about equal in thickness. In addition, the muscle layer of the pulmonary arterioles is thick; this thickness is partly responsible for the high pulmonary vascular resistance of the fetus. After birth, the thickness of the walls of the right ventricle diminishes, as does the muscle layer of the pulmonary arterioles. In contrast, the left ventricular walls become thicker. These changes progress over a period of weeks after birth.
The ductus arteriosus occasionally fails to close after birth. In the newborn, this congenital cardiovascular abnormality, called patent ductus arteriosus, can sometimes be corrected by the administration of nonsteroidal antiinflammatory agents such as ibuprofen. If this does not result in closure of the ductus or if the child is older, closure must be achieved surgically.

Filtration occurs when the algebraic sum of these terms is positive; absorption occurs when it is negative.