Use of Standardized Tests in Pediatric Practice
1 List the characteristics of commonly used standardized pediatric tests.
2 Describe the differences between norm- and criterion-referenced tests and give the purpose of each type of test.
3 Describe the differences between performance- and observation-based tests.
4 Explain the descriptive statistics used in standardized pediatric tests.
5 Discuss the types of standard scores used in standardized pediatric tests.
6 Explain the concepts of reliability and validity.
7 Discuss the importance of test validity.
8 Describe the procedures necessary to become a competent user of standardized tests.
9 Understand the ethical considerations involved in the use of standardized tests.
10 Demonstrate knowledge of standardized test applications to information found in a case study.
What are standardized tests, and why are they important to occupational therapists A test that has been standardized has uniform procedures for administration and scoring.63 This means that examiners must use the same instructions, materials, and procedures each time they administer the test, and they must score the test using criteria specified in the test manual. A number of standardized tests are in common use. Most schoolchildren have taken standardized achievement tests that assess how well they have learned the required grade-level material. College students are familiar with the Scholastic Aptitude Test (SAT), the results of which can affect decisions on admission at many colleges and universities. Intelligence tests, interest tests, and aptitude tests are other examples of standardized tests frequently used with the general public.
Pediatric occupational therapists use standardized tests to help determine the eligibility of children for therapy services, to monitor their progress in therapy, and to make decisions on the type of intervention that would be most appropriate and effective for them. Standardized tests provide precise measurements of a child’s performance in specific areas, and this performance is described as a standard score. The standard score can be used and understood by other occupational therapists and child development professionals familiar with standardized testing procedures.
Using anthropometric measurements and psychophysical testing to measure intelligence, Galton and Cattell developed the initial concept of standardized assessments of human performance late in the 19th century. The first widespread use of human performance testing was initiated in 1904, when the minister of public education in Paris formed a commission to create tests that would help to identify “mentally defective children,” with the goal of providing them with an appropriate education. Binet and Simon developed the first intelligence test for this purpose. Terman and Merrill incorporated many of Binet and Simon’s ideas into the construction of the Stanford-Binet Intelligence Scale,60 which remains widely used today.58 Although intelligence was the first human attribute to be tested in a standardized manner, tests have been developed over the past several decades that assess children’s developmental status, cognition, gross and fine motor skills, language and communication skills, school readiness, school achievement, visual-motor skills, visual-perceptual skills, social skills, and other behavioral domains. Although the number and types of tests have changed radically since the time of Simon and Binet, the basic reason for using standardized tests remains the same: to identify children who may need special intervention or programs because their performance in a given area is outside the norm, or average, for their particular age.
The use of standardized tests requires a high level of responsibility on the part of the tester. The occupational therapist who uses a standardized test must be knowledgeable about scoring and interpreting the test, must know for whom the test is and is not appropriate, and must understand how to report and discuss a child’s scores on the test. The tester must also be aware of the limitations of standardized tests in providing information about a child’s performance deficits. This, in turn, requires a working knowledge of standardized testing concepts and procedures, familiarity with the factors that can affect performance on standardized tests, and awareness of the ethics and responsibilities of testers when using standardized tests.
This chapter introduces pediatric standardized testing used by occupational therapists. The purposes and characteristics of standardized tests are discussed, technical information about standardized tests is presented, practical tips to help the student become a competent user of standardized assessments are given, and ethical considerations are explained. The chapter concludes with a summary of the advantages and disadvantages of standardized tests and a case study that incorporates the concepts presented in the chapter into a “real life” testing scenario. Throughout the chapter, several standardized assessments commonly used by pediatric occupational therapists are highlighted to illustrate the concepts of test administration, scoring, and interpretation.
INFLUENCES ON STANDARDIZED TESTING IN PEDIATRIC OCCUPATIONAL THERAPY
When standardized tests became widely used in pediatric practice in the 1970s and 1980s, the tests available for occupational therapists focused primarily on the developmental domains of gross motor skills, fine motor skills, and visual-motor/visual-perceptual skills. These early tests were developed by educators and psychologists. The first pediatric standardized test developed by an occupational therapist was the Southern California Sensory Integration Tests (SCSIT), published by A. Jean Ayres in 1972.3 The SCSIT assessed sensory integration and praxis, domains that were of specific interest to occupational therapists, and was instrumental in defining the measurement standards in these areas.
In the ensuing years, the number of standardized tests created by and for pediatric occupational therapists has increased dramatically, and the number of behavioral and performance domains assessed has expanded. This evolution in standardized testing in occupational therapy has been influenced by developments both inside and outside the profession. Some key developments are briefly summarized next:
• Individuals with Disabilities Education Act (IDEA) Part B defined the role of occupational therapy as a related service in school-based settings for children age 3 to 21 years. In this setting, standardized tests provide information that is used to determine children’s eligibility for services, measure progress, and develop individualized education programs (IEPs).
• IDEA Part C created federal support for family-centered services for children age 0 to 3 and their families. Occupational therapy is a supportive service that participates in multidisciplinary evaluations to determine eligibility for services, assessment of family needs, resources, and priorities to support development of an individualized family service plan (IFSP), and periodic review of progress. Standardized tests of children’s developmental status, caregiver–child interactions, and the home environment are an important part of this process.
• The development of occupational therapy frameworks that consider environmental characteristics and the performance of activities within daily contexts expanded evaluation to include information about how individuals engage with their environment and how environments may support or inhibit participation in daily life. This new focus required the development of evaluation procedures that assessed characteristics of the environment and the quality of children’s interactions within the environment. Key frameworks that define this person-environment interaction include the model of human occupation,40 the ecology of human performance,20 and the person-environment-occupation model.43
• The development of client-centered models of practice that advocated involvement of the client and family in the evaluation and intervention planning process required the development of evaluation methods that collected information from clients about their needs, priorities, and satisfaction with their performance. The Canadian Occupational Performance Measure (COPM) is frequently used for this purpose.42 In pediatric practice this information is generally collected from parents/caregivers and teachers. Increasingly, however, the importance of obtaining information directly from children is being acknowledged, and evaluation methods to obtain this information are being developed.38,41
• Recognition of the limitations of collecting evaluation data focused on sensorimotor skills and the need to address multiple aspects of children’s occupational performance created a call for a “top down” evaluation process,13 whereby initial focus of the evaluation shifted to the quality and quantity of children’s engagement in daily occupations. Assessments such as the School Function Assessment (SFA)14 and the Pediatric Evaluation of Disability Inventory (PEDI)34 incorporate this approach to assessment.
• The International Classification of Functioning, Disability, and Health (ICF) identified three levels of focus for interventions: body structure or function (impairment), whole body movements or activities (activity limitations), and involvement in life situations (participation restrictions).66 Incorporation of participation restrictions as an area of intervention created a new focus on the effect of impairments or activity limitations on children’s ability to participate in all aspects of daily life. As a result, methods to assess children’s participation needed to be developed. Participation measures are incorporated into some standardized pediatric assessments such as the SFA14 and the Miller Function & Participation Scales (M-FUN).48 In addition, children’s participation is evaluated in the Children’s Assessment of Participation and Enjoyment (CAPE) and Preferences for Activities of Children (PAC).41
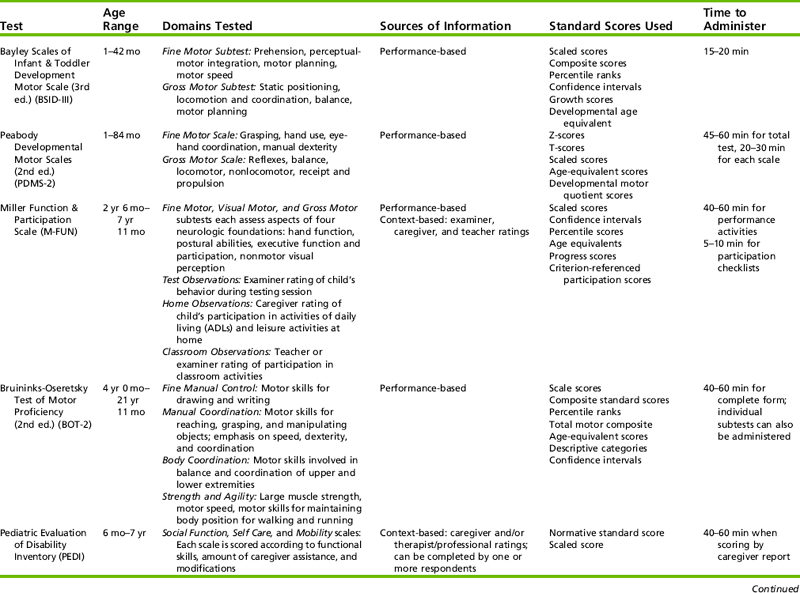
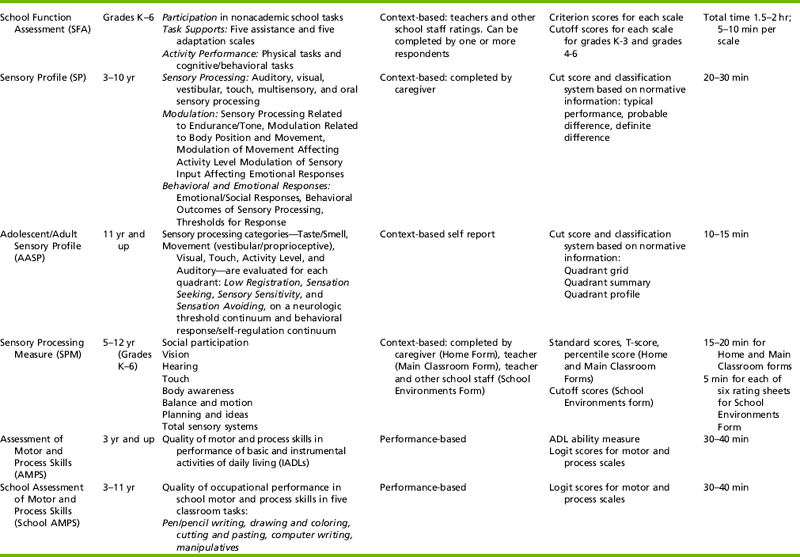
The preceding discussion illustrates how evolution of the occupational therapy profession has contributed to the ongoing development of standardized testing practices. One of the most significant changes in standardized testing over the past 30 years involves the inclusion of multiple information sources in the standardized testing process. Pediatric occupational therapists no longer draw conclusions about a child’s abilities and needs based only on the child’s performance on test items administered in a highly structured setting. Context-based assessments allow therapists to obtain information about children’s performance and participation in a variety of daily contexts based on information provided by adults who are familiar with the child and in some cases from the children themselves. These multiple sources of information provide a well-rounded picture of how personal and environmental factors interact to influence children’s ability to engage productively in age-appropriate occupations. Table 8-1 lists some of the most commonly used pediatric standardized assessments.
PURPOSES OF STANDARDIZED TESTS
Standardized tests are used for several reasons. For example, a standardized test can be used as a screening tool to assess large numbers of children quickly and briefly and identify those who may have delays and are in need of more in-depth testing. Examples of screening tests frequently used by occupational therapists include the Miller Assessment for Preschoolers (MAP),46 the revised Denver Developmental Screening Test (Denver-II),28 and the FirstSTEP (Screening Test for Evaluating Preschoolers).47
Screening tests typically assess several developmental domains, and each domain is represented by a small number of items (Table 8-2). Screening tests generally take 20 to 30 minutes and can be administered by professionals or by paraprofessionals such as classroom aides, nurse’s aides, or teaching assistants. Therapists who work in settings that primarily serve typically developing children (e.g., a public school system or Head Start program) may become involved in developmental screening activities. In addition, occupational therapists frequently use assessment tools to evaluate children with specific developmental problems. Therefore it is important for all therapists to be aware of the strengths and weaknesses of specific tests used in their settings. Although the screening tools mentioned are not discussed in greater depth, the concepts of developing, administering, scoring, and interpreting standardized tests (discussed later in this chapter) should also be considered when using screening tools.
TABLE 8-2
Developmental Domains Assessed in Four Screening Tools
| Screening Tool | Age Range | Domains Assessed |
| Denver Developmental Screening Test (Revised) | 1 mo–6 yr | Personal-social, fine motor adaptive, language, gross motor |
| Developmental Indicators for Assessment of Learning (Revised) | 2.5–6 yr | Motor, language, concepts |
| FirstSTEP: Screening Test for Evaluating Preschoolers | 2 yr, 9 mo–6 yr, 2 mo | Cognition, communication, physical, social and emotional, adaptive functioning |
| Miller Assessment for Preschoolers | 2 yr, 7 mo–5 yr, 8 mo | Foundations, coordination, verbal, nonverbal, complex tasks |
Occupational therapists most frequently use standardized tests as in-depth assessments of various areas of occupation and performance skills. Standardized tests are used for four main purposes:
1. to assist in the determination of a medical or educational diagnosis
2. to document a child’s developmental and functional status
Assistance with Medical or Educational Diagnoses
A primary purpose of standardized tests is to assist in the determination of a diagnosis through use of normative scores that compare the child’s performance with that of an age-matched sample of children. Standardized tests are frequently used to determine if a child has developmental delays or functional deficits significant enough to qualify the child for remedial services such as occupational therapy. Many funding agencies and insurance providers use the results of standardized testing as one criterion in deciding whether a child will receive occupational therapy intervention. In school-based practice, standard scores are helpful for identifying specific student problems that may indicate that the involvement of an occupational therapist is appropriate. Funding approval for special services generally depends on documentation of a predetermined degree of delay or deficit in one or more developmental or academic domains, and standardized test results are an important component of this documentation. The results of standardized testing performed by occupational therapists, when used in conjunction with testing done by other professionals, can help physicians or psychologists arrive at a medical or educational diagnosis.
Documentation of Developmental and Functional Status
Another purpose of standardized testing is to document a child’s status. Many funding and service agencies require periodic reassessment to provide a record of a child’s progress and to determine if the child continues to qualify for services. Standardized testing is often a preferred way of documenting progress because the results of the most current assessment can be compared with those of earlier ones. Periodic formal reassessment can also provide valuable information to the therapist working with the child. Careful scrutiny of a child’s test results can help identify areas of greatest and least progress. This can assist the therapist in prioritizing intervention goals. Many parents are also interested in seeing the results of their child’s periodic assessments. Standardized tests used in periodic assessments must be chosen carefully so that areas of occupation or performance skills addressed in the intervention plan are also the focus of the standardized testing.
A discussion about the child’s progress in areas that may not be measured by standardized testing should accompany the discussion of test performance. Structured or unstructured observations of the child’s play, academic, social, and/or self-care performance; interviews with the caretaker or teacher about the child’s home or school routine; the developmental, educational, and medical histories; and a review of pertinent medical or educational records are equally important components of the assessment process (see Chapter 7 for more information about the assessment process).
Planning of Intervention Programs
A third purpose of standardized testing is program planning. Standardized tests provide information about a child’s level of function, and they help therapists determine the appropriate starting point for therapy intervention. Most commonly, criterion-referenced standardized tests are used as the basis for developing goals and objectives for individual children and for measuring progress and change over time. Criterion-referenced tests are used extensively in educational settings and include such tools as the Hawaii Early Learning Profile (HELP)51; the Assessment, Evaluation, and Programming System for Infants and Children9; and the SFA.14 Criterion-referenced tests are described in more detail in the following section.
Measurement Instruments for Research Studies
Due to the psychometric properties of standardized tests, standard scores obtained from these tests can be statistically manipulated and analyzed. This allows test scores to be used for both descriptive and experimental research. Standardized tests can be used to obtain descriptive data about particular populations or groups. Experimental studies compare scores obtained before and after interventions, or compare two different interventions for efficacy. Data obtained through descriptive and experimental studies enhance our knowledge about client groups, and provide evidence regarding the efficacy of occupational therapy interventions.
CHARACTERISTICS
As stated earlier, standardized tests have uniform procedures for administration and scoring. These standard procedures permit the results of a child’s tests to be compared either with his or her performance on a previous administration of the test or with the test norms developed by administration of the test to a large number of children.
Standardized tests characteristically include a test manual that describes the purpose of the test (i.e., what the test is intended to measure). The manual should also describe the intended population for the test. For pediatric assessments, this generally refers to the age range of children for whom the test was intended, but it may also refer to specific diagnoses or types of functional impairments. Test manuals also contain technical information about the test, such as a description of the test development and standardization process, characteristics of the normative sample, and studies done during the test development process to establish reliability and validity data. Finally, test manuals contain detailed information about the administration, scoring, and interpretation of the test scores.
Another characteristic of standardized tests is that they are composed of a fixed number of items. Items may not be added or subtracted without affecting the standard procedure for test administration. Most tests have specific rules about the number of items that should be administered to ensure a standardized test administration. These rules may differ significantly from test to test. For instance, the Bruininks-Oseretsky Test of Motor Proficiency (2nd ed.) (BOT-2) specifies that within each subtest the entire item set be administered regardless of the child’s age.10 In contrast, the Bayley Scales of Infant and Toddler Development (3rd ed.) (BSID-III) has 17 start points for the test.7 Examiners are instructed to begin testing at the start point corresponding to the child’s chronologic age (or corrected age, if the child was born prematurely) and to move to easier or more difficult items, depending on the child’s performance. Box 8-1 explains how to compute ages corrected for prematurity.
BOX 8-1 Calculating the Chronologic Age and Corrected Age
Many standardized tests require that the examiner calculate the child’s exact age on the date of testing. The method for calculating both the chronologic and the corrected age is presented below.
CALCULATING THE CHRONOLOGIC AGE
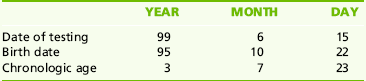
First, the date of testing and the child’s birth date are recorded in the following order:

Beginning on the right (the Day category), the day, month, and year of the child’s birth date are subtracted from the date of testing. In the above example, the child’s chronologic age is 4 years, 3 months, 5 days at the time of testing.
The convention in calculating age is, if the number of days in the chronologic age is 15 or less, the month is rounded down. Therefore in the above example, the child’s age would be stated as 4 years, 3 months, or 4-3. If the number of days in the chronologic age is between 16 and 30, the month is rounded up. If the above child’s chronologic age had been 4 years, 3 months, 16 days, the chronologic age would be expressed as 4 years, 4 months, or 4-4.
Sometimes, “borrowing” is necessary to subtract the birth date from the date of testing correctly:
Begin with the Day category. Twenty-two cannot be subtracted from 15 without borrowing from the Month category. One month must be borrowed and placed in the Day category. One month equals 30 days; 30 is added to the 15 days in the Date of testing, giving a total of 45. Twenty-two is subtracted from 45, leaving 23 days. Moving to the Month category, 1 month has been borrowed by the Day category, leaving 5 months. Because 10 cannot be subtracted from 5, 1 year must be borrowed from the Year category. One year equals 12 months; therefore, 12 will be added to the 5 in the Month category for Date of testing, totaling 17. Ten is subtracted from 17, leaving 7 months. Moving to the Year category, 1 year has been borrowed by the Month category, leaving 98. Ninety-five can be subtracted from 98, leaving 3 years. Therefore this child’s chronologic age is 3 years, 7 months, 23 days. Using the rounding convention as discussed, the month is rounded up, giving a chronologic age of 3 years, 8 months.
Corrected age is used for children who were born prematurely to “correct” for the number of weeks they were born prior to the due date. Generally, the age is corrected until the child turns 2 years of age, although this convention can vary. Given 40 weeks’ gestation as full term, the amount of correction is the difference between the actual gestational age at birth and the 40 weeks’ full-term gestational age. Therefore a child born at 30 weeks’ gestation is 10 weeks, premature. Many practitioners consider 36 or 37 weeks or above to be full-term gestation; therefore, children with a gestational age of 36 weeks or above do not receive a corrected age. Because there is some variation in how and when corrected age is used, it is wise for the therapist to learn the procedures of his or her facility and to adhere to them when calculating corrected age.
If the expected due date and birth date are both known, subtracting the birth date from the due date yields an exact measurement of prematurity.

This child is 3 months, 8 days premature. To calculate corrected age, subtract the prematurity value from the chronologic age:
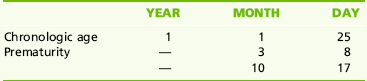
The child’s corrected age is 10 months, 17 days or, when rounded, 11 months.
A third characteristic of standardized tests is fixed protocol for administration. The term fixed protocol for administration refers to the way each item is administered and the number of items administered. Generally, the protocol for administration specifies the verbal instruction or demonstration to be provided, the number of times the instructions can be repeated, and the number of attempts the child is allowed on the item. For some tests, instructions for each item are printed in the manual, and the tester is expected to read the instructions verbatim to the child without deviating from the text. However, other tests allow for more freedom of instruction, especially when the test involves a physical activity (Figure 8-1).
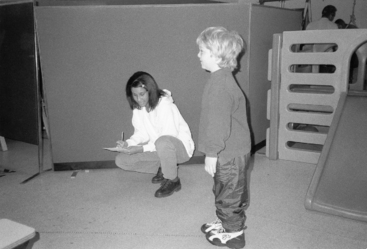
FIGURE 8-1 A therapist prepares to test a child on the broad jump item from the Bruininks-Oseretsky Test of Motor Proficiency 2.
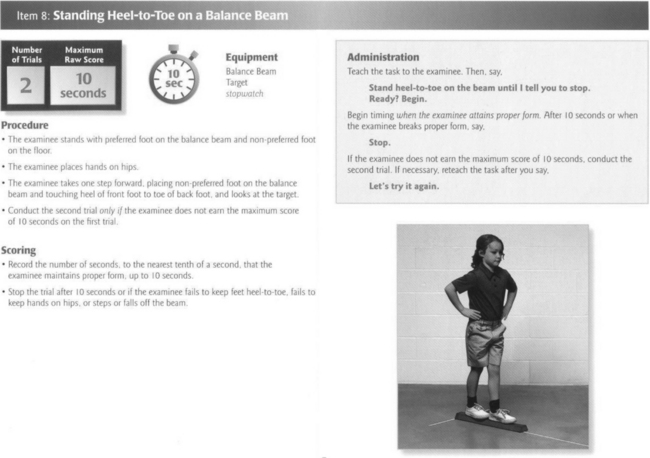
Standardized tests also have a fixed guideline for scoring. Scoring guidelines usually accompany the administration guidelines and specify what the child’s performance must look like to receive a passing score on the item. Depending on the nature of the item, passing performance may be described using text, a picture, or a diagram. The administration and scoring guidelines for a test item from the BOT-2 are shown in Figure 8-2. In this example, the instructions to be given to the child are printed in bold type. Also included are the criteria for a passing score on the item, examples of incorrect responses, the number of trials and the time allowed for completion of the item. This example (Figure 8-2) describes how to present the item and what constitutes a passing score and includes a diagram of what a passing performance looks like.
TYPES OF STANDARDIZED TESTS
The two main types of standardized tests are norm-referenced tests and criterion-referenced tests. Many pediatric occupational therapists use both types in their practices. Each type has a specific purpose, and it is important for testers to be aware of the purpose of the test they are using.
A norm-referenced test is developed by giving the test in question to a large number of children, usually several hundred or more. This group is called the normative sample, and norms, or average scores, are derived from this sample. When a norm-referenced test is administered, the performance of the child being tested is compared with that of the normative sample. The purpose of norm-referenced testing, then, is to determine how a child performs in relation to the average performance of the normative sample.
Test developers generally attempt to include children from a variety of geographic locations, ethnic and racial backgrounds, and socioeconomic levels so that the normative sample is representative of the population of the United States, based on the most recent U.S. Census data. Generally, the normative sample is composed of children who have no developmental delays or conditions, although some tests include smaller subsamples of clinical populations as a means of determining whether the test discriminates between children whose development is proceeding normally and those who have known developmental delays.
Norm-referenced tests address one or more areas of behavior. If the test evaluates more than one area, each area typically has one or more subtests. For instance the BOT-2 assesses performance in four motor-area composites: fine manual control, manual coordination, body coordination, and strength and agility. Items are chosen to represent a broad range of skills within these composite areas. Additionally, items are chosen to incorporate materials and activities that are reasonably familiar and typical for children of the age group being tested. A child’s performance on an individual test item is not as important as the overall subtest or area score. However, it is important for the therapist to observe the quality and characteristics of a child’s performance on each item, as these qualitative observations provide important information to complement the obtained standard scores.
Norm-referenced tests have standardized protocols for administration and scoring. The tester must adhere to these protocols so that each test administration is as similar as possible to that of the normative sample. This is necessary to compare any child’s performance fairly with that of the normative sample.
Sometimes the examiner must deviate from the standard protocol because of special needs of the child being tested. For instance, a child with visual impairments may need manual guidance to cut with scissors, or a child with cerebral palsy may need assistance stabilizing the shoulder and upper arm to reach and grasp a crayon. If changes are made in the standardized procedures, the examiner must indicate this in the summary of assessment, and standard scores cannot be used to describe that child’s performance in comparison with the normative sample.
Norm-referenced tests have specific psychometric properties. They have been analyzed by statisticians to obtain score distributions, mean or average scores, and standard scores. This is done to achieve the primary objective of norm-referenced tests: comparability of scores with the normative sample. A test under development initially has a much larger number of items than the final version of the test. Through pilot testing, items are chosen or rejected based partly on how well they statistically discriminate between children of different ages and/or abilities. Items are not chosen primarily for their relevance to functional skills. Consequently, some norm-referenced tests are not intended to link test performance with specific objectives or goals for intervention. Other norm-referenced tests, such as the Sensory Profile, are designed to specifically evaluate the effect of sensory processes on functional performance in daily life and, when combined with other evaluation and observation data, to allow therapists to develop intervention goals. A portion of the Sensory Profile questionnaire is presented in Figure 8-3.
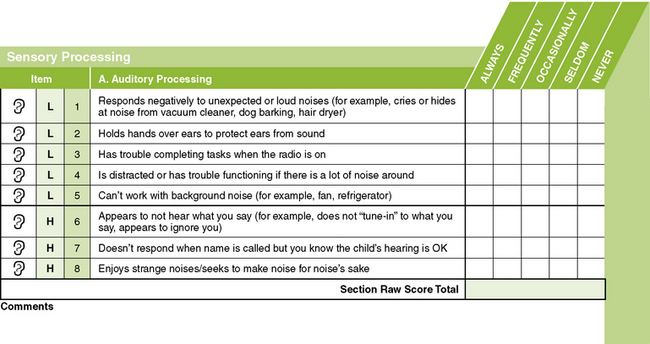
FIGURE 8-3 A portion of the caregiver questionnaire for the Sensory Profile. From Dunn, W. [1999]. Sensory Profile user’s manual. San Antonio, TX: Psychological Corporation.
A criterion-referenced test, by contrast, is designed to provide information on how children perform on specific tasks. The term criterion-referenced refers to the fact that a child’s performance is compared with a particular criterion, or level of performance of a particular skill. The goal of a criterion-referenced test is to determine which skills a child can and cannot accomplish, thereby providing a focus for intervention. In general the content of a criterion-referenced test is detailed and in some cases may relate to specific behavioral or functional objectives. The intent of a criterion-referenced test is to measure a child’s performance on specific tasks rather than to compare the child’s performance with that of his or her peers.
Many developmental checklists have been field tested and then published as criterion-referenced tests. The HELP is a good example of a developmental checklist designed to be used with children from birth to 3 years of age. It contains a large number of items in each of the domains of gross motor, fine motor, language, cognitive, social-emotional, and self-help skills. Each item correlates with specific intervention objectives. For instance, if a child is not able to pass Fine Motor item 4.81, Snips with Scissors, a list of intervention ideas are presented in the HELP activity guide.30 The activity guide is meant to accompany the test and is designed to help the therapist or educator by providing ideas for developmentally appropriate activities to address areas of weakness identified in the criterion-based assessment. The administration protocol for this item and the associated intervention activities are presented in Boxes 8-2 and 8-3.
Administration and scoring procedures may or may not be standardized on a criterion-referenced test. The HELP has standard procedures for administering and scoring each item. In contrast, the SFA is a judgment-based questionnaire completed by one or more school professionals familiar with the child’s performance at school.14 Criteria for rating the child’s performance on each item are provided. School professionals are encouraged to collaborate in determining ratings and to use these ratings as a basis for designing an intervention plan. Figure 8-4 shows a category of activity performance with the associated rating scale. Many other criterion-referenced tests take the form of checklists, in which the specific performance needed to receive credit on an item is not indicated. Many therapist-designed tests for use in a particular facility or setting are nonstandardized, criterion-referenced tests.
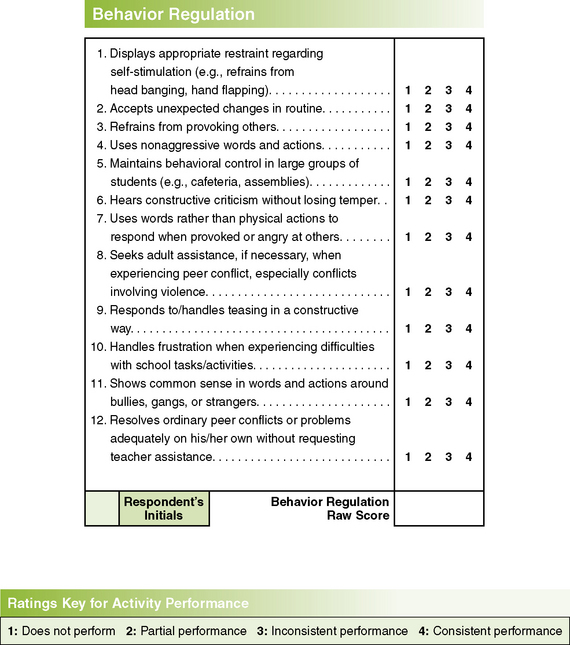
FIGURE 8-4 One category of activity performance and corresponding rating scale for the School Function Assessment (SFA). From Coster, W., Deeney, T., Haltiwanger, J., & Haley, S. [1998]. School Function Assessment. San Antonio, TX: Psychological Corporation.
Criterion-referenced tests are not subjected to the statistical analyses performed on norm-referenced tests. No mean score or normal distribution is calculated; a child may pass all items or fail all items on a particular test without adversely affecting the validity of the test results. The purpose of the test is to learn exactly what a child can accomplish, not to compare the child’s performance with that of the peer group. This goal is also reflected in the test development process for criterion-referenced tests. Items are generally chosen based on a process of task analysis or identification of important developmental milestones rather than for their statistical validity. Therefore the specific items on a criterion-referenced test have a direct relationship with functional skills and can be used as a starting point for generating appropriate goals and objectives for therapy intervention. To be useful for intervention planning, the summary scores from criterion-referenced tests should relate closely to the child’s current pattern of performance.26
The characteristics of norm- and criterion-referenced tests are compared in Table 8-3. As is shown in the table, some tests are both norm-referenced and criterion-referenced. This means that although the items have been analyzed for their ability to perform statistically, they also reflect functional or developmental skills that are appropriate for intervention. These tests permit the therapist to compare a child’s performance with that of peers in the normative sample, and they also provide information about specific skills that may be appropriate for remediation.
TABLE 8-3
Comparison of Norm-Referenced and Criterion-Referenced Tests
| Characteristic | Norm-Referenced Test | Criterion-Referenced Test |
| Purpose | Comparison of child’s performance with normative sample | Comparison of child’s performance with a defined list of skills |
| Content | General; usually covers a wide variety of skills | Detailed; may cover specific objectives or developmental milestones |
| Administration and scoring | Always standardized | May be standardized or nonstandardized |
| Psychometric properties | Normal distribution of scores; means, standard deviations, and standard scores computed | No score distribution needed; a child may pass or fail all items |
| Item selection | Items chosen for statistical performance; may not relate to functional skills or therapy objectives | Items chosen for functional and developmental importance; provides necessary information for developing therapy objectives |
| Examples | BSID-III; PDMS-2; BOT-2; PEDI | PDMS-2, PEDI, HELP, Gross-Motor Function Measure, SFA |
BOT-2, Bruininks-Oseretsky Test of Motor Proficiency (2nd ed.); BSID-III, Bayley Scales of Infant and Toddler Development (3rd ed.); HELP, Hawaii Early Learning Profile; PDMS, Peabody Developmental Motor Scales; PEDI, Pediatric Evaluation of Disability Inventory; SFA, School Function Assessment.
The Peabody Developmental Motor Scales (2nd ed.) (PDMS-2) is an example of both a norm- and criterion-referenced test. Although the PDMS-2 has been subjected to the statistical analyses used in norm-referenced tests, many individual items on the test also represent developmental milestones that can be addressed as part of the intervention plan. The SFA, although primarily a criterion-referenced test, provides a criterion score and standard error for each raw score based on a national standardization sample.
TECHNICAL ASPECTS
The following discussion of the technical aspects of standardized tests focuses on the statistics and test development procedures used for norm-referenced tests. Information on how standard scores are obtained and reported is included, as well as on how the reliability and validity of a test are evaluated. It is the responsibility of the test author to provide initial data on test reliability and validity. However, these test characteristics are never definitively determined, and ongoing evaluation of validity and reliability is necessary. A knowledge of technical aspects of standardized tests is important to occupational therapists for the following reasons:
1. Therapists must be able to analyze and select standardized tests appropriately, according to the child’s age and functional level and the purpose of testing.
2. Therapists must be able to interpret and report scores from standardized tests accurately.
3. Therapists must be able to explain test results to caregivers and other professionals working with the child in a clear, understandable manner.
Presented next is information on (1) descriptive statistics, (2) standard scores, (3) correlation coefficients, (4) reliability, and (5) validity.
Descriptive Statistics
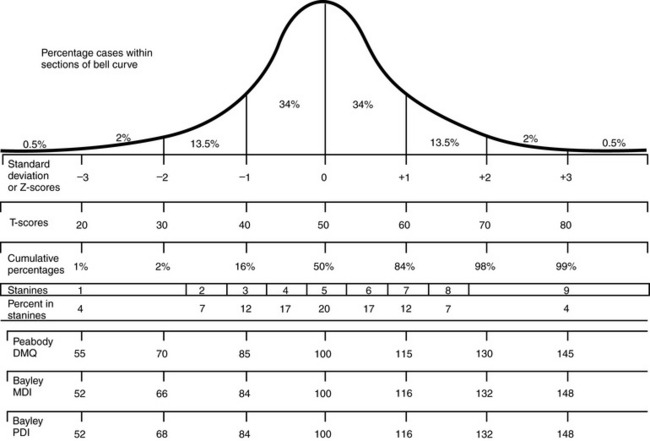
Descriptive statistics provide information about the characteristics of a particular group. Many human characteristics, such as height, weight, head size, and intelligence, are represented by a distribution called the normal curve (or bell-shaped curve) (Figure 8-5). The pattern of performance on most norm-referenced tests also follows this curve. The greatest number of people receive a score in the middle part of the distribution, with progressively smaller numbers receiving scores at either the high or the low end. Descriptive statistics also provide information about where members of a group are located on the normal curve. The two types of descriptive statistics are the measure of central tendency and the measure of variability.
The measure of central tendency indicates the middle point of the distribution for a particular group, or sample, of children. The most frequently used measure of central tendency is the mean, which is the sum of all the scores for a particular sample divided by the number of scores. It is computed mathematically using a simple formula

where Σ means to sum, X is each individual score, and n is the number of scores in the sample (the mean is also often called the average score).
Another measure of central tendency is the median, which is simply the middle score of a distribution. Half the scores lie below the median and half above it. The median is the preferred measure of central tendency when outlying or extreme scores are present in the distribution. The following distribution of scores is an example:

The mean score is 12 [i.e., (2 + 3 + 13 + 14 + 17 + 17 + 18) ÷ 7]. The median, or middle score, is 14. In this case the score of 14 is a more accurate representation of the middle point of these scores than is the score of 12 because the two low scores, or outliers, in the distribution pulled down the value of the mean.
The measure of variability determines how much the performance of the group as a whole deviates from the mean. Measures of variability are used to compute the standard scores used in standardized tests. As with measures of central tendency, measures of variability are derived from the normal curve. The two measures of variability discussed are the variance and the standard deviation.
The variance is the average of the squared deviations of the scores from the mean. In other words, it is a measure of how far the score of an average individual in a sample deviates from the group mean. The variance is computed using the following formula:
where S2 is the variance, Σ (X − X)2 is the sum of each individual score minus the mean score, and n is the total number of scores in the group. The standard deviation is simply the square root of the variance. To illustrate, calculations are provided for the mean, the variance, and the standard deviation for the following set of scores from a hypothetical test:

To calculate the mean, the following equation is used:
To calculate the variance, the mean must be subtracted from each score, and that value then must be squared:
The squared values are summed and then divided by the total number of scores:
The variance of this score distribution is 16. The standard deviation is simply the square root of the variance, or 4.
The standard deviation (SD) is an important number because it is the basis for computing many standard scores. In a normal distribution (see Figure 8-5), 68% of the people in the distribution score within 1 SD of the mean (±1 SD); 95% score within 2 SD of the mean (±2 SD); and 99.7% score within 3 SD of the mean (±3 SD). In the score distribution with a mean of 22 and a standard deviation of 4, three of the five scores were within 1 SD of the mean (22±4; a score range of 18 to 26), and all five scores were within 2 SD of the mean (22±8; a score range of 14 to 30). The standard deviation, then, determines the placement of scores on the normal curve. By showing the degree of variability in the sample, the standard deviation reveals how far the scores can be expected to range from the mean value.
Standard Scores
Standardized tests are scored in several different ways. Scoring methods include Z-scores, T-scores, deviation intelligence quotient (IQ) scores, developmental index scores, percentile scores, and age-equivalent scores.
The Z-score is computed by subtracting the mean for the test from the individual’s score and dividing it by the standard deviation, using the following equation:

For the score distribution above (i.e., 17 19 21 25 28), the person receiving the score of 17 would have a Z-score of (17 – 22) ÷ 4 = –1.25. The person receiving the score of 28 would have a Z-score of (28 – 22) ÷ 4 = 1.5. The negative value of the first score indicates that the Z-score value is below the mean for the test, and the positive value of the second score indicates that the Z-score value is above the mean. Generally, a Z-score value of –1.5 or less is considered indicative of delay or deficit in the area measured, although this can vary, depending on the particular test.
The T-score is derived from the Z-score. In a T-score distribution, the mean is 50 and the standard deviation is 10. The T-score is computed using the following equation:

For the two Z-scores computed above, the T-score values are as follows: for the first Z-score of –1.25, the T-score is 10(–1.25) + 50 = 37.50. For the second Z-score of 1.5, the T-score is 10(1.5) + 50 = 65. Note that all T-scores have positive values, but because the mean of a T-score distribution is 50, any number below 50 indicates a score below the mean. Because the standard deviation of the T distribution is 10, the first score of 37.50 is slightly more than 1 SD below the mean. The second score of 65 is 15 points, or 1.5 SD, above the mean.
Two other standard scores that are frequently seen in standardized tests are the deviation IQ score and the developmental index score. Deviation IQ scores have a mean of 100 and a standard deviation of either 15 or 16. These are the IQ scores obtained from such tests as the Stanford-Binet61 or the Wechsler Intelligence Scale for Children (WISC).65 On these tests, individuals with IQ scores 2 SD below the mean (IQs of 70 and 68, respectively) are considered to have an intellectual disability. Individuals with IQ scores 2 SD above the mean (IQs of 130 and 132, respectively) are considered gifted. Developmental index scores are used in developmental tests such as the PDMS-2 and the BSID-III. Like the deviation IQ scores, they have a mean of 100 and a standard deviation of 15 or 16. Children who receive a developmental index score of 2 SD below the mean (index score of 68 or 70) in one or more skill areas are considered to be in need of remedial services. In many cases children who receive developmental index scores lower than –1.5 SD (index score of 85) may also be recommended for occupational therapy services.
Two other types of scores (i.e., percentile scores and age-equivalent scores) are frequently used in standardized tests. These are not standard scores in the strictest sense, because they are computed directly from raw scores rather than through the statistically derived measures of central tendency and variability. However, they give an indication of a child’s performance relative to that of the normative sample.
The percentile score is the percentage of people in a standardization sample whose score is at or below a particular raw score. A percentile score of 60, for instance, indicates that 60% of the people in the standardization sample received a score that was at or below the raw score corresponding to the 60th percentile. Tests that use percentile scores generally include a table in the manual by which raw scores can be converted to percentile scores. These tables usually indicate at what percentile rank performance is considered deficient. Raw scores can be converted to percentile rank (PR) scores by a simple formula:

Using the previous sample data (i.e., 17 19 21 25 28), percentile ranks for the highest and lowest scores can be computed. The raw score of 17 is the lowest score in the distribution and is the only score of 17. Therefore the equation is as follows:
The highest score in the distribution is 28; therefore four people have lower scores and one person received a score of 28. The equation is as follows:
In this distribution, then, the lowest score is at the 10th percentile and the highest score is at the 90th percentile.
Although PR scores can be easily calculated and understood, they have a significant disadvantage: the percentile ranks are not equal in size across the score distribution. Distances between percentile ranks are much smaller in the middle of the distribution than at the ends; consequently, improving a score from the 50th to the 55th percentile requires much less effort than improving a score from the 5th to the 10th percentile (see Figure 8-5). As a result, an improvement in performance by a child functioning at the lower end of the score range may not be reflected in the PR score the child achieves. Other standard scores are more sensitive at measuring changes in the performance of children who fall at the extreme ends of the score distribution.
The age-equivalent score is the age at which the raw score is at the 50th percentile. The age-equivalent score generally is expressed in years and months, e.g., 4-3 (i.e., 4 years, 3 months). It is a score that is easily understood by parents and caregivers who may not be familiar with testing concepts or terminology. However, age-equivalent scores have significant disadvantages. Although they may provide a general idea of a child’s overall developmental level, it may be misleading to say, for example, that a 4-year-old is functioning at the 2.5-year level. The age-equivalent score may be more or less an average of several developmental domains, some of which may be at the 4.5-year level and some at the 1.5-year level. Therefore the child’s performance may be highly variable and may not reflect that of a typical 2.5-year-old. In addition, because the age-equivalent score represents only the score that a child of a particular age who is performing at the 50th percentile would receive, a child who is performing within normal limits for his or her age but whose score is below the 50th percentile would receive an age-equivalent score below his or her chronologic age. This can cause parents or caregivers to conclude incorrectly that the child has delays. Age equivalents, then, are a type of standard score that can contribute to an understanding of a child’s performance, but they are the least psychometrically sound, can be misleading, and should be used only with the greatest caution.
Correlation Coefficients
Test manuals often report correlation coefficients when describing the test’s reliability and validity. A correlation coefficient tells the degree or strength of the relationship between two scores or variables. Although the standard scores are used to compute individual scores, correlation coefficients are used to determine the relationship between scores from one measurement and those from another. Correlation coefficients range from –1.00 to +1.00. A correlation coefficient of 0.00 indicates that no relationship exists between the two variables measured. Any relationship that occurs is strictly by chance. The closer the correlation coefficient is either to –1.00 to +1.00, the stronger is the relationship between the two variables. A negative correlation means that a high score on one variable is accompanied by a low score on the other variable. A positive correlation means that a high score on one variable is accompanied by a high score on the other variable and that a low score on one variable is accompanied by a low score on the other variable.
Examples of two variables that generally have a fairly high positive correlation are height and weight. Taller individuals are also generally heavier than shorter individuals. However, this is not always true. Some tall individuals are light, and some short individuals are heavy. Consequently, the correlation between height and weight for a given population is a positive value, but it is not a perfect 1.00. Examples of two variables that are unrelated are eye color and height. The correlation coefficient for these two variables for any population is close to zero, because a person’s eye color cannot be predicted by the individual’s height.
An example of two variables that have a negative correlation might be hours spent studying and hours spent watching television. A student who spends many hours studying probably watches fewer hours of television, and a student who watches many hours of television probably spends fewer hours studying. Hence, a negative relationship exists between these two variables. As one variable increases, the other decreases. Several different correlation coefficients may be calculated, depending on the type of data used. Some correlation coefficients commonly used in test manuals include the Pearson Product-Moment Correlation Coefficient or Pearson r, the Spearman Rank-Order Correlation Coefficient, and the Intraclass Correlation Coefficient (ICC).
Why are correlation coefficients important As the following sections on reliability and validity illustrate, correlation coefficients are important tools for evaluating the properties of a test. Knowledge of test characteristics helps testers know how best to use a test and makes them aware of the strengths and limitations of individual tests.
Reliability
The reliability of a test describes the consistency or stability of scores obtained by one individual when tested on two different occasions with different sets of items or under other variable examining conditions.63 For instance, if a child is given a test and receives a score of 50 and 2 days later is given the same test and receives a score of 75, the reliability of the test is questionable. The difference between the two scores is called the error variance of the test, which is a result of random fluctuations in performance between the two testing sessions. Some amount of random error variance is expected in any test situation because of variations in such things as mood, fatigue, or motivation. Error variance can also be caused by environmental characteristics such as light, temperature, or noise. However, it is important that error variance caused by variations in examiners or by the characteristics of the test itself be minimal. Confidence in the scores obtained requires that the test have adequate reliability over a number of administrations and low error variance.
Most standardized tests evaluate two or three forms of reliability. The three forms of reliability most commonly used in pediatric standardized tests are (1) test–retest reliability, (2) inter-rater reliability, and (3) standard error of measurement (SEM).
Test–Retest Reliability
Test–retest reliability is a measurement of the stability of a test over time. It is obtained by giving the test to the same individual on two different occasions. In the evaluation of test–retest reliability for a pediatric test, the time span between test administrations must be short to minimize the possibility of developmental changes occurring between the two test sessions. However, the time span between tests should not be so short that the child may recall items administered during the first test session, thereby improving his or her performance on the second test session (this is called the learning, or practice, effect).
Generally, the time span between testing sessions is no more than 1 week for infants and very young children and no more than 2 weeks for older children. During the process of test development, test–retest reliability is evaluated on a subgroup of the normative sample. The size and composition of the subgroup should be specified in the manual. The correlation coefficient between the scores of the two test sessions is calculated. This coefficient is the measure of the test–retest reliability. A test that has a high test–retest reliability coefficient is more likely to yield relatively stable scores over time. That is, it is affected less by random error variance than is a test with a low test–retest reliability coefficient. When administering a test with a low test–retest reliability coefficient, the examiner has less confidence that the score obtained is a true reflection of the child’s abilities. If the child were tested at a different time of day or in a different setting entirely, different results might be obtained.
A sample of 197 children was evaluated twice within 2 weeks (mean retest interval of 6 days) to assess the test–retest reliability (stability) of the BSID-III Motor Scale.7 Overall stability coefficients were 0.80 for the Fine Motor Scale, 0.82 for the Gross Motor Scale, and 0.83 for the Motor Composite. Test–retest stability was slightly higher for the older age groups. The performance of a young child often varies within short periods because it is highly influenced by variables such as mood, hunger, sleepiness, and irritability. The test–retest reliability coefficients for 50 children tested twice within 1 week with the PDMS-2 ranged from 0.73 for the Fine Motor Quotient and 0.84 for the Gross Motor Quotient for 2- to 11-month-old children to 0.94 for the Fine Motor Quotient and 0.93 for the Gross Motor Quotient for 12- to 17-month-old children.27
To evaluate test–retest reliability of the Sensory Processing Measure (SPM),50 a rating scale of sensory processing, praxis, and social participation in home and school environments for children age 5 to 12, caregivers and teachers of 77 typically developing children completed the rating scale two times within a 2-week interval. Correlation coefficients for the scales ranged from .94 to .98. These three examples of good to excellent test–retest reliability are typical examples of scales that measure children’s sensory processing and motor performance. The rapid and variable development of young children and the practice effect are two factors that negatively influence the tests’ stability over time. The test–retest reliability of a test is critical to its use as a measure of the child’s progress or of intervention efficacy.
Inter-rater Reliability
Inter-rater reliability refers to the ability of two independent raters to obtain the same scores when scoring the same child simultaneously. Inter-rater reliability is generally measured on a subset of the normative sample during the test development process. This is often accomplished by having one rater administer and score the test while another rater observes and scores at the same time. The correlation coefficient calculated from the two raters’ scores is the inter-rater reliability coefficient of the test. It is particularly important to measure inter-rater reliability on tests for which the scoring may require some judgment on the part of the examiner.
Although the scoring criteria for many test items are specific on most tests, scoring depends to a certain extent on individual judgment, and scoring differences can arise between different examiners. A test that has a low inter-rater reliability coefficient is especially susceptible to differences in scoring by different raters. This may mean that the administration and scoring criteria are not stated explicitly enough, requiring examiners to make judgment calls on a number of items. Alternatively, it can mean that the items on the test call for responses that are too broad or vague to permit precise scoring.
No universal agreement has been reached regarding the minimum acceptable coefficient for test–retest and inter-rater reliability. The context of the reliability measurement, the type of test, and the distribution of scores are some of the variables that can be taken into account when determining an acceptable reliability coefficient. One standard suggested by Urbina and used by a number of examiners is 0.80.63
Not all tests have test–retest or inter-rater reliability coefficients that reach the 0.80 level. Lower coefficients indicate greater variability in scores. When examiners use a test that has a reliability coefficient below 0.80, scores must be interpreted with great caution. For example, if one subtest of a test of motor development has test–retest reliability of 0.60, the examiner who uses it to measure change over time must acknowledge that a portion of the apparent change between the first and second test administration is a result of the error variance of the test.
The inter-rater reliability of the M-FUN48 was evaluated by having pairs of examiners score the performance of 29 children on the M-FUN using the scoring rubrics developed for the standardization edition of the test. One examiner administered and scored while the second examiner observed and scored independently. Correlation coefficients were 0.91 for Visual Motor, 0.93 for Fine Motor, and 0.91 for Gross Motor. A second aspect of inter-rater reliability, decision agreement, was also evaluated. Decision agreement is the degree to which examiner’s scores agree in the identification of a child as performing in the average range or as having an impairment. Since standardized tests are used frequently to qualify children for services, it is important to know whether different examiners can consistently identify whether or not a child has impairments. On the M-FUN, decision agreement was 96% for Visual Motor, 97% for Fine Motor, and 93% for Gross Motor. The results of the inter-rater reliability studies on the M-FUN suggest that examiners can reliably score children’s performance and based on the obtained scores can make reliable determinations about the presence of impairment.
Inter-rater reliability for the PDMS-2 was evaluated using a slightly different method. Sixty completed test protocols were randomly selected from the normative sample and were independently scored by two examiners. The resulting correlation coefficients were 0.97 for the Gross Motor Composite and 0.98 for the Fine Motor Composite.27 It should be noted that this method of determining reliability is not based on two independent observations of the child’s performance but on review of completed scoring protocols. Hence, potential error related to the way examiners interpreted and applied the scoring criteria to determine scores on individual items was not addressed. This could result in spuriously high inter-rater reliability coefficients. In a test such as the DTVP-II, in which scores are based on a written record of the child’s response, inter-rater reliability is excellent. When two individuals scored 88 completed DTVP-II protocols, the interscorer reliability was 0.98.35
When individual subtests of a comprehensive test have a low reliability coefficient, it is generally not recommended that the standard scores from the subtests be reported. Often the reliability coefficient of the entire test is much higher than that of the individual subtests. One reason for this is that reliability increases with the number of items on a test. Because subtests have fewer items than the entire test, they are more sensitive to fluctuations in the performance or scoring of individual items. When this occurs, it is best to describe subtest performance qualitatively, without reporting standard scores.
Standard scores can be reported for the total, or comprehensive, test score. Examiners should consult the reliability information in the test manual before deciding how to report test scores for individual subtests and for the test as a whole. The inter-rater reliability coefficients reported in the manual are estimates based on the context and conditions under which they were studied by the test developers. This reliability coefficient is an estimate; inter-rater reliability may vary when children are tested in different contexts or when examiners have differing levels of training and experience.
Examiners can exert some control over the inter-rater reliability of tests they use frequently. It is good practice for examiners to check inter-rater reliability with more experienced colleagues when learning a new standardized test before beginning to administer the test to children in the clinical setting. Also, periodic checking of inter-rater reliability with colleagues who are administering the same standardized tests is a good practice. Some simple methods for assessing inter-rater reliability are discussed in more detail later in the chapter.
For context-based tests, inter-rater reliability is generally not a meaningful indicator of the psychometric integrity of the test, since each individual who contributes information to the test does so based on knowledge of the child in a specific environment with unique demands. However, since different raters may be evaluating the child on similar constructs, some agreement between ratings should be expected. This is known as cross-rater concordance, and is a measure of the validity of the instrument rather than reliability. For instance, on the SPM, concordance between caregiver (home) and teacher (school) ratings ranged from a coefficient of 0.31 for balance and motion to 0.55 for planning and ideas. These represent moderate to high correlations, but are lower than minimum inter-rater reliability standards for performance-based tests. These results are acceptable for a context-based instrument, and reflect the importance of gathering data on children’s ability to engage in daily life tasks, activities, and occupations based on observations of the child over time in daily environments.
Standard Error of Measurement
The standard error of measurement (SEM) is a statistic used to calculate the expected range of error for the test score of an individual. It is based on the range of scores an individual might obtain if the same test were administered a number of times simultaneously, with no practice or fatigue effects. Obviously, this is impossible; the SEM, therefore, is a theoretical construct. However, it is an indicator of the possible error variance in individual scores.
The SEM creates a normal curve for the individual’s test scores, with the obtained score in the middle of the distribution. The child has a higher probability of receiving scores in the middle of the distribution than at the extreme ends. The SEM is based on the standard deviation of the test and the test’s reliability (usually the test–retest reliability). The SEM can be calculated using the following formula:

where SEM is the standard error of measurement, SD is the standard deviation, and r is the reliability coefficient for the test (test–test reliability coefficients are the ones most commonly used). Once the SEM has been calculated for a test, that value is added to and subtracted from the child’s obtained score. This gives the range of expected scores for that child, a range known as the confidence interval. The SEM corresponds to the standard deviation for the normal curve: 68% of the scores in a normal distribution fall within 1 SD on either side of the mean, 95% of the scores fall within 2 SD on either side of the mean, and 99.7% of the scores fall within 3 SD on either side of the mean. Similarly, a child receives a score within 1 SEM on either side of his or her obtained score 68% of the time; a score within 2 SEM of the obtained score 95% of the time; and a score within 3 SEM of the obtained score 99.7% of the time.
Generally, test manuals report the 95% confidence interval. As can be seen by the equation above, when the SD of the test is high or the reliability is low, the SEM increases. A larger SEM means that the range of possible scores for an individual child is much greater (i.e., a larger confidence interval) and consequently that there is a greater degree of possible error variance for the child’s score. This means that the examiner is less confident that any score obtained for a child on that test represents the child’s true score.
An example may help to illustrate this point. Two tests are given, both consisting of 50 items and both testing the same skill area. One test has an SD of 1.0 and a test–retest reliability coefficient of 0.90. The SEM for that test is calculated as follows:
The second test has an SD of 5.0 and a test–retest reliability coefficient of 0.75. The SEM for that test would be calculated as follows:
Using the SEM, a 95% confidence interval can be calculated for each test. A 95% confidence interval is 2 SEM; therefore, test 1 has a confidence interval of ±0.64 points from the obtained score, or a total of 1.28 points. Test 2 has a confidence interval of ±5 points, or a total of 10 points. If both tests were available for a particular client, an examiner could use test 1 with much more confidence that the obtained score is truly representative of that individual’s abilities and is not caused by random error variance of the test.
Occupational therapists who use standardized tests should be aware of how much measurement error a test contains so that the potential range of performance can be estimated for each individual. Currently, the trend is to report standardized test results as confidence intervals rather than as individual scores.17,32 Several tests, such as the BSID-III, the M-FUN, and the BOT-2, include confidence intervals for subtest or scaled scores so that examiners can determine the potential score range for each child. According to Bayley, “Confidence intervals also serve as a reminder that measurement error is inherent in all test scores and that the observed test score is only an estimate of true ability” (p. 104).7
Consideration of the SEM is especially important when the differences between two scores are evaluated (e.g., when the progress a child has made with therapy over time is evaluated).63 If the confidence intervals of the two test scores overlap, it may be incorrect to conclude that any change has occurred. For instance, a child is tested in September and receives a raw score of 60. The child is tested again in June with the same test and receives a raw score of 75. Comparison of the two raw scores would seem to indicate that the child has made substantial progress. However, the scores should be considered in light of an SEM of 5.0. Using a 95% confidence interval (the 95% confidence interval is 2 SEM on either side of the obtained score), the confidence interval for the first score is 50 to 70, and the confidence interval of the second score is 65 to 85.
Based on the two test scores, it cannot be conclusively stated that the child has made progress because the confidence intervals overlap. It is conceivable that a substantial amount of the difference between the first and second scores is a result of error variance rather than actual change in the child’s abilities. (See the article by Cunningham-Amundson and Crowe for a more in-depth discussion of the use of the SEM in pediatric assessment, particularly the effect of the SEM in the interpretation of test scores and the qualification of children for remedial services.16)
Validity
Validity is the extent to which a test measures what it says it measures.63 For example, it is important for testers to know that a test of fine motor development actually measures fine motor skills and not gross motor or perceptual skills. The validity of a test must be established with reference to the particular use for which the test is being considered.63 For instance, a test of fine motor development is probably highly valid as a measure of fine motor skills. It is less valid as a measure of visual motor skills and has low validity as a measure of gross motor skills.
The information on validity reported in test manuals has been obtained during the test development process. In addition, after a test becomes available commercially, clinicians and researchers continue to evaluate validity and to publish the results of their validation studies. This information about test validity can help examiners make decisions about appropriate uses of standardized tests. The four categories of validity are construct-related validity, content-related validity, criterion-related validity, and Rasch analysis.
Construct-Related Validity
Construct-related validity is the extent to which a test measures a particular theoretic construct. Some constructs frequently measured by pediatric occupational therapists include fine motor skills, visual-perceptual skills, self-care skills, gross motor skills, and functional performance at home or school. There are many ways to determine construct validity, a few of which are discussed in this chapter.
One method of establishing construct validity involves investigating how well a test discriminates among different groups of individuals. For instance, a developmental test (e.g., BSID-III, PDMS-2, BOT-2) is expected to differentiate between the performance of older and younger children. Older children should receive higher scores than younger children, providing clear evidence of developmental progression with advancing age. Because these tests are also intended to discriminate typically developing children from children with developmental delays, children in specific diagnostic categories should receive lower scores than children with no documented deficits. This type of construct validity analysis is termed the “known groups” method.54
For example, during the development process for the Sensory Profile,18 the sensory processing patterns of children in the following clinical groups were evaluated: attention deficit hyperactivity disorder, autism/pervasive developmental disorder, fragile X disorder, sensory modulation disorder, and other disabilities. The scores for children in each of these groups differed from that of the standardization sample, with the score ranges for all factors generally lower than those for the standardization sample. This indicates that the Sensory Profile is able to differentiate children with typical sensory processing from those who have sensory processing differences. In addition, score patterns for various clinical groups were identified, allowing therapists to compare client scores with those of the corresponding clinical group. Subsequent research using the Sensory Profile has identified specific differences in sensory processing scores and sensory processing profiles for children with Asperger’s syndrome, autism, fragile X disorder, and fetal alcohol syndrome.21,29,55,62,64
Factor analysis can be used as another method of establishing construct-related validity. Factor analysis is a statistical procedure for determining relationships between test items. In a test of motor skills that includes gross motor items and fine motor items, factor analysis is expected to identify two factors on which items showed the strongest correlation, one composed mostly of gross motor items and one composed mostly of fine motor items. Factor analysis of the Sensory Integration and Praxis Tests (SIPT)4 resulted in identification of four primary factors. The constructs that emerged from the analysis demonstrated that the test primarily measures praxis (motor planning). The constructs measured were visual-perceptual skills (related to praxis); somatosensory-praxis skills; bilateral integration and sequencing of movements; and praxis on verbal command.5 Factor analysis helped establish the functions that are measured by the SIPT and that can be used to interpret the results of testing individual children.
The third method of establishing construct-related validity requires repeated administration of a test before and after a period of intervention. For example, a group of children are given a test of visual-perceptual skills and subsequently receive intervention focused on improving those skills. They are then retested with the same test and the difference in scores is analyzed. A rise in test scores supports the assertion that the test measured visual-perceptual skills and provides evidence of construct-related validity.
Content-Related Validity
Content-related validity is the extent to which the items on a test accurately sample a particular behavior domain. For instance, to test self-care skills, it is impractical to ask a child to perform every conceivable self-care activity. A sample of self-care activities must be chosen for inclusion on the test, and conclusions can be drawn about the child’s abilities on the basis of the selected items. Examiners must have confidence that self-care skills are adequately represented so that accurate conclusions regarding the child’s self-care skills can be made. Test manuals should show evidence that the authors have systematically analyzed the domain being tested. Content validity is established by review of the test content by experts in the field, who reach some agreement that the content is, in fact, representative of the behavioral domain to be measured.
Criterion-Related Validity
Criterion-related validity is the ability of a test to predict how an individual performs on other measurements or activities. To establish criterion-related validity, the test score is checked against a criterion, an independent measure of what the test is designed to predict. The two forms of criterion-related validity are concurrent validity and predictive validity.
Concurrent validity describes how well test scores reflect current performance. The degree of relationship between the test and the criterion is described with a correlation coefficient. Most validity correlation coefficients range from 0.40 to 0.80; a coefficient of 0.70 or above indicates that performance on one test can predict performance on a second test.
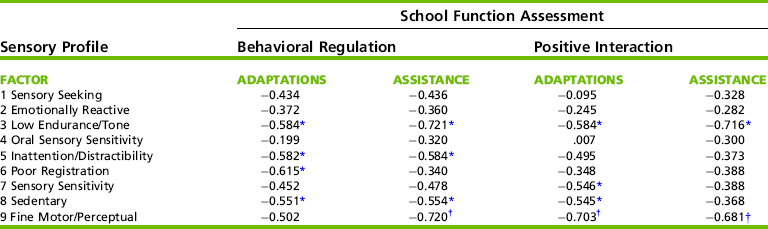
Concurrent validity is examined in the test development process to determine the relationship between a new test and existing tests that measure a similar construct. For instance, during the development of the Sensory Profile, children were scored with both the Sensory Profile and the SFA. The SFA was chosen because some aspects of children’s performance at school depend on sensory processing and modulation.18 High correlations between SFA performance items and the Fine Motor/Perceptual factor on the Sensory Profile were expected, because both tests address hand use. In addition, the SFA socialization and behavior interaction sections were expected to correlate highly with the modulation sections and factors on the Sensory Profile, because problems with regulating sensory input could result in problems with generating appropriate responses. The scores on the two tests were compared for a random sample of 16 children enrolled in special education programs. Portions of the correlational data are presented in Table 8-4. The correlations are negative because of the different scoring systems on the two tests; lower scores are desirable on the SFA but undesirable on the Sensory Profile.
TABLE 8-4
Correlations between the Sensory Profile and the School Function Assessment
*Correlation is significant at the 0.05 level (2-tailed).
†Correlation is significant at the 0.01 level (2-tailed).
Modified from Dunn, W. (1999). Sensory Profile user’s manual (p. 54). San Antonio, TX: Psychological Corporation.
As Table 8-4 shows, there are areas of moderate to high correlation and areas of low correlation between the two tests. Factor 9, which consists of items describing product-oriented behaviors, correlated strongly with three sections of the SFA. Factors 3, 6, and 8 on the Sensory Profile contain items that indicate low responsiveness, whereas Factor 5 contains items indicating overresponsiveness. These four factors correlated moderately with the Behavioral Regulation and Positive Interaction sections of the SFA, suggesting relationships between sensory processing and modulation, and children’s social/behavioral repertoires.18 This pattern of correlation coefficients supports the research hypotheses about relationships between the constructs measured by the two tests and also supports the validity of the Sensory Profile as a measure of sensory processing and modulation.
In contrast with concurrent validity, predictive validity identifies the relationship between a test given in the present and some measure of performance in the future. Establishing predictive validity is a much lengthier process than establishing other forms of validity because often several years must elapse between the first and second testing sessions. The predictive validity of a test often is not well documented until it has been in use for several years. Barbosa, Campbell, and Berbaum studied the predictive validity of the Test of Infant Motor Performance (TIMP).6 These researchers examined how well the TIMP, when administered shortly after birth, predicted the infant’s outcome at 12 months. Using a sample of 96 at-risk infants recruited from special care nurseries, the infants were categorized as developmentally delayed, cerebral palsy, or typical at 12 months on the basis of their scores on the Alberta Infant Motor Scale and physician’s clinical judgment. The TIMP scores at 13 weeks correctly classified all of the infants at 12 months. Two items, hand-to-mouth and fingering objects, were identified as highly accurate predictors of cerebral palsy (i.e., children with cerebral palsy did not exhibit fingering or hand-to-mouth movements).
One final point about criterion-related validity: the meaningfulness of the comparison between a test and its criterion measure depends on both the quality of the test and the quality of the criterion. Because no single measure of criterion-related validity provides conclusive evidence of the test’s validity, multiple investigations should be undertaken. Important standardized assessments undergo extensive evaluation of validity after publication. The resulting information helps the test user decide when and with whom the test results are most valid.
In summary, validity is an important but sometimes elusive concept that rests on a number of judgments by authors of the tests, users of the tests, and experts in the field of occupational therapy. It is important to remember that validity is not an absolute and that a test that is valid in one setting or with one group of children may not be valid for other uses. Test users must not assume that because a test has been developed and published for commercial distribution, it is universally useful and appropriate. An examiner must apply his or her clinical knowledge and experience, knowledge of normal and abnormal development, and understanding of an individual child’s situation when deciding whether a test is a valid measure of the child’s abilities.
Rasch Model of Measurement
The Rasch models of measurement1 have been used to develop item scaling for several tests in the field of occupational therapy. The SFA, the PEDI,34 and the Assessment of Motor and Process Skills (AMPS)23,24 have used Rasch methodology in the test development process. Rasch methodology has also been used to develop a school version of the AMPS (School AMPS).2,25
A test instrument developed using Rasch methodology must meet several assumptions.14 The construct being measured (e.g., activities of daily living) can be represented as a continuous function with measurement covering the full range of possible performance from dependent to independent. The instrument (or individual scale of the instrument) measures one characteristic (or construct) of performance, and each item represents a sample of the characteristics measured. The scale provides estimates of item difficulty that are independent of the sample of persons tested, and an individual’s ability estimate is independent of the specific items tested.
The Rasch model generates a hierarchical ranking of items on the test from easiest to most difficult, creating a linear scale of items from ordinal observations. With the items ranked along the continuum within each skill area, an individual’s performance can be assessed in light of an item’s difficulty rather than against a normative sample. The ranking of items creates an expected pattern of mastery of items; the model predicts that more difficult items on the continuum are mastered only after easier items have been. Therefore therapists who administer an assessment tool developed using Rasch methodology generally can assume that the most appropriate goals for intervention will be the items and/or skills immediately above the items successfully passed by the client.
Occupational therapy tests developed using Rasch methodology emerge from a different philosophical base than traditional standardized tests. The two main methods of data collection are naturalistic observation and parent/teacher/caregiver report. The tasks observed are the ones the child engages in daily (e.g., schoolwork, self-care, social participation, mobility) rather than items administered in a controlled testing situation. Intervention recommendations can be generated directly from the child’s observed and/or reported performance and participation.
Tests developed using the Rasch model are not considered norm-referenced tests because individual performance is not compared against that of a normative sample. However, the Rasch model provides an objective measure of performance that can be linked directly to desired occupational performance outcomes. The Rasch model has been applied to a variety of rating scales and traditional measurement instruments to assess disablement and functional status.33,56 It is a model that can be used alone or in conjunction with traditional test development and measurement theory to produce measurement tools that provide a clearer connection between the assessment process and intervention planning.
BECOMING A COMPETENT TEST USER
The amount of technical information presented here might make the prospect of learning to administer a standardized test seem daunting. However, potential examiners can take a number of specific steps to ensure that they administer and score a test reliably. These steps also help examiners interpret test results accurately so that they provide a valid representation of each child’s abilities. This section discusses the process of learning to administer and interpret any standardized test, be it a screening tool or a comprehensive assessment.
Choosing the Appropriate Test
The therapist’s first step is to decide which test, or tests, to learn. A number of standardized tests used by pediatric occupational therapists address a wide age span and a number of different performance skills and areas of occupation. The examiner must decide which tests are most likely to meet the assessment needs of his or her particular work setting and of the children served in that setting. For instance, an occupational therapist working in an early intervention setting might use the BSID-III or the PEDI.34 A therapist working in preschools might use the M-FUN or the PDMS-2. A therapist working in a school-based setting might use the SFA, the School AMPS, or BOT-2. Instruments such as the PEDI or the AMPS can be used in a variety of settings.
A number of other standardized tests are available that assess more specialized areas of function, such as the SIPT, the Developmental Test of Visual-Motor Integration,8 the Sensory Profile, or the DTVP-II. Examiners should consult with other therapists working in their practice settings to determine which tests are most commonly used. In addition, they should examine the characteristics of the children referred to them for assessment to determine which tests are most appropriate. Some children may not be able to comply with standardized testing procedures. In particular, children who are diagnosed with an autism spectrum disorder often do not cooperate with a structured testing environment. Occupational therapists evaluating these children often make adjustments in the standardized testing procedures or use nonstandardized assessments.59 Observation-based standardized tests that obtain information from adult ratings or observation of the child in typical daily contexts are a useful alternative. See Table 8-1 for a list of selected standardized tests arranged by information source.
Learning the Test
Once a decision has been made about which test to learn, the therapist should read the test manual carefully. In addition to administration and scoring techniques, the technical attributes of the test should be studied. Particular attention should be paid to the size and composition of the normative sample, the reliability coefficients, the validation data, and the intended population for the test. The examiner should determine the standardized administration procedures and whether they can be altered for children with special needs. He or she should also understand how the scores should be reported and interpreted if the standardized procedure is changed.
It may also be appropriate to consult other sources for information about a test. The Seventeenth Mental Measurements Yearbook31 and Tests in Print VII49 publish descriptions and critical reviews of commercially available standardized tests written by testing experts. These resources can also be accessed online through most university library systems. In addition, published studies of the validity or reliability of tests relevant to pediatric occupational therapists appear throughout the occupational therapy literature.
The next step in learning a test is to observe it being administered by an experienced examiner. If possible, the therapist should also discuss administration, scoring, and interpretation of the test results. One observation may suffice; however, it may be helpful to watch several administrations of the test to children of different ages and abilities. Observation is an excellent way to learn how other examiners deal with the practical aspects of testing (e.g., arranging test materials, sequencing test items, handling unexpected occurrences, managing behavior). A discussion with the examiner about the interpretation of a child’s performance can also be extremely helpful for acquiring an understanding of how observed behaviors are translated into conclusions and recommendations.
Once these preparatory activities have been completed, the learner should practice administering the test. Neighborhood children, friends, or relatives can be recruited to be “pilot subjects.” It is a good idea to test several children whose ages are similar to those for whom the test is intended. Testing children, rather than adults, provides the realism of the mechanical, behavioral, and management issues that arise with a clinical population (Figure 8-6).
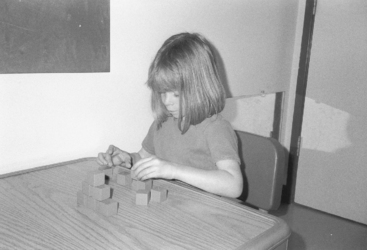
Checking Inter-rater Reliability
When possible, an experienced examiner should observe the testing and simultaneously score the items as a check of inter-rater reliability (Research Note 8-1). A simple way to assess inter-rater agreement is to use point-by-point agreement.37 With this technique, one examiner administers and scores the test while the other observes and scores (Figure 8-7). The two examiners then compare their scores on each item. The number of items on which the examiners assigned the same score is then added.
 RESEARCH NOTE 8-1
The purpose of this study was to evaluate inter-rater agreement and construct validity of the Revised Knox Preschool Play Scale. Two raters who were trained separately evaluated 38 typically developing children, ages 36 to 72 months. For each child, the raters observed two 15-minute free-play sessions. For the overall play age, the scores of the two raters were within 8 months of each other 86.8% of the time; for the 4 dimension scores, they were within 12 months of each other 91.7% to 100% of the time; and for the 12 category scores, they were within one age level of each other 81.8% to 100% of the time. Construct validity results showed a general match between the children’s chronological ages and their overall play age scores. The authors made three recommendations for future instrument development: (1) provide more detail on how to interpret and score play behaviors, (2) provide guidelines for using open-ended questions to children to clarify play scenarios, and (3) consider allowing use of a prompt by the examiner so that a greater variety of play behaviors can be observed.
• Two raters can achieve acceptable consistency in scoring this instrument.
• The scores on the test reflect a developmental progression in play skills, supporting the construct validity of the instrument.
• If a child’s score is within 8 months of chronological age, play skills should be considered age-appropriate. If scores are more than 8 months below chronological age, additional assessment should be considered.
• Information obtained in this study provides occupational therapists with psychometric data to support the use of this instrument for evaluating play skills of preschool children.
• Recommendations made by the authors could improve the validity and reliability of the instrument.
Jankovich M., Mullen J., Rinear E., Tanta K., & Deitz, J.(2008). Revised Knox Preschool Play Scale: Interrater agreement and construct validity. American Journal of Occupational Therapy, 62, 221–227.
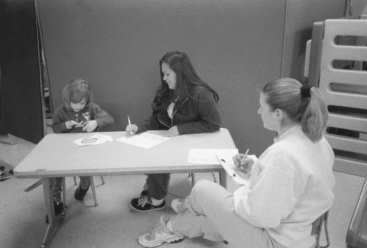
Inter-rater agreement then is computed using this formula:

where A equals the number of items on which there was agreement and D equals the number of items on which there was disagreement.
The following example illustrates point-by-point agreement.
Two examiners score a test of 10 items. The child receives either a pass (+) or fail (–) for each item. The scores for each examiner are shown in Table 8-5. According to the data, the raters agreed on 7 of the 10 items. They disagreed on items 2, 7, and 9.
TABLE 8-5
Raters’ Scores for Point-by-Point Agreement
| Item | Rater 1 | Rater 2 |
| 1 | + | + |
| 2 | + | − |
| 3 | + | + |
| 4 | − | − |
| 5 | − | − |
| 6 | + | + |
| 7 | − | + |
| 8 | − | − |
| 9 | − | + |
| 10 | + | + |
Their point-by-point agreement would be calculated as follows:

This means that the examiners agreed on the scores for 70% of the items. To benefit from this exercise, the two examiners should discuss the items on which they disagreed and their reasons for giving the scores they did. A new examiner may not understand the scoring criteria and may be making scoring errors as a result. The experienced examiner can help clarify scoring criteria. This procedure helps bring the new examiner’s administration and scoring techniques in line with the standardized procedures.
The point-by-point agreement technique can also be used for periodic reliability checks by experienced examiners, and it is particularly important if the examiners may be testing the same children at different times. No universally agreed-on standard exists for a minimum acceptable level for point-by-point agreement. However, 80% is probably a good guideline. Examiners would be well advised to aim for agreement in the range of 90% if possible. Organization of the testing environment and materials can improve reliability by creating a standard structured environment.
Selecting and Preparing the Optimal Testing Environment
The testing environment should meet the specifications stated in the test manual. Generally, the manual specifies a well-lighted room free of visual or auditory distractions. If a separate room is not available, a screen or room divider can be used to partition off a corner of the room. An example of an appropriate test setup is shown in Figure 8-8.
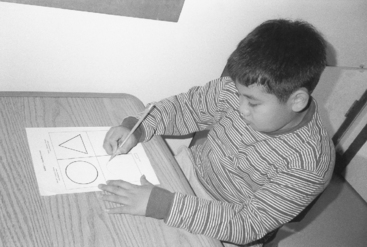
FIGURE 8-8 A child completes a portion of the visual-motor subtest of the Bruininks-Oseretsky Test of Motor Proficiency 2.
Testing should be scheduled at a time when the child is able to perform optimally. For young children, caregivers should be consulted about the best time of day for testing so that the test session does not interfere with naps or feedings. Older children’s school or other activities should be considered in the scheduling of assessments. For instance, a child who has just come from recess or a vigorous physical education session may have decreased endurance for gross motor activities.
The test environment should be ready before the child arrives. Furniture should be appropriately sized so that children sitting at a table can rest their feet flat on the floor and can comfortably reach items on the table. If a child uses a wheelchair or other adaptive seating, he or she should be allowed to sit in the equipment during testing. Infants or young children generally are best seated on the caregiver’s lap unless particular items on the test specify otherwise. The examiner should place the test kit where he or she can easily access the items but not where the child can see or reach the kit. Often a low chair placed next to the examiner’s chair is a good place to put a test kit.
Each examiner should consider what adaptations are necessary to administer the test efficiently. In many cases a test manual is too large and unwieldy to have at hand during testing, and the score sheet does not provide enough information about administration and scoring criteria. Examiners have developed many ways to meet this need. A common method is preparation of a cue card on which the examiner records specific criteria for administration and scoring, including the instructions to be read to the child. This can be accomplished by making a series of note cards, putting color codes on a score sheet, or developing a score sheet with administration information.
Administering Test Items
Most important, the examiner must be so familiar with the test that his or her attention can be focused on the child’s behavior and not on the mechanics of administering the test. This is a critical part of preparation, because much valuable information can be lost if the examiner is unable to observe carefully the quality of the child’s responses because he or she instead must devote energy to finding test materials or looking through the test manual. In addition, young children’s attention spans can be short, and the examiner must be able to take full advantage of the limited time the child is able to attend to the activities.
Familiarity with the test also allows the examiner to change the pace of activities if necessary. The child can be given a brief break to play, have a snack, or use the bathroom while the examiner interviews the caregiver or jots down notes. Most standardized tests have some flexibility about the order or arrangement of item sets, and an examiner who knows the test can use this to his or her advantage. Sometimes, because of the child’s fatigue or behavior or because of time constraints, a test cannot be administered completely in one session. Most tests provide guidelines for administering the test in two sessions, and examiners should be familiar with these guidelines before starting to test.
Interpreting the Test
Before administering the test, the examiner should read the test interpretation section of the examiner’s manual and discussion interpretation of the test with experienced examiners. It is essential for examiners to understand what conclusions can and cannot be drawn about a child’s performance based on the items administered and standard scores obtained. In addition to the guidelines and interpretation standards specified in the test manual, the examiner must take into account a number of other factors when interpreting an individual child’s test score. The following questions should be asked when interpreting test results:
• How representative or typical was the child’s response to the testing situation If the child did not appear to perform optimally during testing, what influenced the child’s performance When the parent observes the testing, the examiner should ask the parent if the child’s performance was typical. The parent’s judgment of the child’s performance during testing can be included in the report of findings.
• How closely does the information obtained by the occupational therapist concur with standardized or nonstandardized test results, observations or reports by caregivers, teachers, or other professionals Possible reasons for discrepancies can include different performance demands or expectations in various environments, differences in characteristics and environmental supports provided to the child, differing levels of tolerance for children’s behavior, or discrepant ability in different developmental or performance domains (may be identified when several disciplines are evaluating a child).
• Were there any strategies used during the testing that were either particularly effective or ineffective in organizing, motivating, or facilitating the child’s best performance Evaluating and discussing the efficacy of management strategies can provide important information to augment test results and recommendations.
• Did the tests administered provide a complete picture of the child’s occupational performance and participation, or is additional testing, observation, or interview required
Evaluating the Clinical Usefulness of the Test
The final area of preparation is to evaluate the clinical usefulness of the test. The learner should discuss the test with colleagues: What are its strengths and weaknesses What important information does it give What information needs to be collected through other techniques For which children does it seem to work especially well and for which is it an especially poor choice Can it be adapted for children with special needs Does it measure what it says it measures Do other tests do a better job of measuring the same behavioral domain Is it helpful for program planning or program evaluation An ongoing dialog is an important way to ensure that the process of standardized testing meets the needs of the children, families, therapists, and service agencies that use the tests. The steps to becoming a competent user of standardized tests are summarized in Box 8-4.
ETHICAL CONSIDERATIONS IN TESTING
All pediatric occupational therapists who use standardized tests in their practice must be aware of their responsibilities to the children they evaluate and their families. Urbina has discussed several ethical issues relevant to standardized testing, including (1) examiner competency, (2) client privacy, (3) communication of test results, and (4) cultural bias.63
Examiner Competency
Examiner competency was discussed in detail in the previous section. However, it is important to reemphasize here that examiners must achieve a minimal level of competency with a test before using it in practice. Along with knowing how to administer and score a test, a competent examiner should know for whom the test is intended and for what purpose. This also means knowing when it is not appropriate to use a particular standardized instrument. The examiner should be able to evaluate the technical merits of the test and should know how these characteristics may affect its administration and interpretation. The examiner also should be aware of the many things that can affect a child’s performance on a test, such as hunger, fatigue, illness, or distractions, as well as sources of test or examiner error.
The competent examiner draws conclusions about a child’s performance on a standardized test only after considering all available information about the child. Such information can include the results of nonstandardized tests, informal observations, caregiver interviews, and reviews of documentation from other professionals. It is extremely important to put a child’s observed performance on standardized testing in the context of all sources of information about the child; this ensures a more accurate and meaningful interpretation of standard scores.
Client Privacy
The Privacy Rule of the Health Insurance Portability and Accountability Act (HIPAA) mandates that all recipients of health care services be notified of their privacy rights; that they have access to their medical information, including provision of copies at their request; and that they be notified of any disclosure of medical information for purposes other than treatment or billing. For minor children, the parent or legal guardian must provide consent prior to initiation of any evaluation or intervention procedures. Agencies have different forms and processes for obtaining consent, and examiners must be aware of the procedures for their particular institution. Informed consent generally is obtained in writing and consists of an explanation of the reasons for testing, the types of tests to be used, the intended use of the tests and their consequences (i.e., program placement or qualification for remedial services), and the testing information that will be released and to whom it will be released. Parents/guardians should be given a copy of the summary report and should be informed about who will receive the additional copies. If test scores or other information will be used for research purposes, additional consent procedures must be followed.
Verbal exchanges about the child should be limited. Although it is often necessary to discuss a case with a colleague for the purposes of information sharing and consultation, it is not acceptable to have a casual conversation about a particular child in the elevator, lunchroom, or hallway. If others overhear the conversation, a violation of confidentiality could result.
Communication of Test Results
Reports should be written in language that is understandable to a nonprofessional, with a minimum of jargon. Each report should be objective in tone, and the conclusions and recommendations should be clearly stated. When the results of tests are discussed, the characteristics of the person receiving the information should be taken into account.
Speaking with other professionals and speaking with family members require different communication techniques. When sharing assessment results with family members, the examiner should be aware of the general level of education and, in the case of bilingual families, the level of proficiency with English. Even if family members have a reasonable capability in the English language, it may be a good idea to have an interpreter available. Often the family members most skilled in English act as interpreters. However, this may not be the optimal arrangement for sessions in which test results are discussed because of the technical nature of some of the information. The ideal interpreter is one who is familiar with the agency and the kinds of testing and services it offers and who has developed techniques for helping examiners offer information in an understandable and culturally meaningful way.
When presenting information to family members, examiners must also consider the anticipated emotional response. A parent who hears that his young child has developmental delays may be emotionally devastated. Therefore the information should be communicated sensitively. Every child has strengths and attributes that can be highlighted in the discussion of his or her overall performance. The examiner should also avoid any appearance of placing blame on the parent for the child’s difficulties, because many parents are quick to blame themselves for their child’s problems. The tone of any discussion should be objective, yet positive, with the emphasis placed on sharing information and making joint decisions about a plan of action.
Cultural Bias
A number of authors have discussed the cultural bias inherent in standardized tests.44,45,53,63 Tests developed primarily on a white, middle-class population may not be valid when used with children from diverse cultural backgrounds. It is important for examiners to be aware of the factors that may influence how children from diverse cultures perform on standardized tests.
Children who have not had any experience with testing may not understand the unspoken rules about test taking. They may not understand the importance of doing a task within a time limit or of following the examiner’s instructions. They may not be motivated to perform well on tasks because the task itself has no intrinsic meaning to them. The materials or activities may be seen as irrelevant, or the child, having had no experience with the kinds of materials used in the tests, may not know how to interact with them. Establishing a rapport may be difficult either because of language barriers or because of a cultural mismatch between the child’s social interaction patterns and those of the examiner. If the examiner is aware of these potential problems, steps can be taken to minimize possible difficulties.
The caregiver or an interpreter can be present to help put the child more at ease. The caregiver can be questioned about the child’s familiarity with the various test materials; this information can help the examiner determine whether the child’s failure to perform individual items is the result of unfamiliarity with the materials or of inability to complete the task. The caregiver can also be shown how to administer some items, particularly those involving physical contact or proximity to the child. This may make the situation less threatening for the child. However, if these adjustments are made, standard procedure has been violated, and it may be inappropriate to compute a standard score. Even so, the test can provide a wealth of descriptive information about the child’s abilities.
Standardized tests should be used cautiously with children from diverse cultures. Occupational therapists who find themselves frequently evaluating children from cultural or ethnic groups that are underrepresented in the normative samples of most standardized tests may want to consider developing “local norms” on frequently used instruments that reflect the typical patterns of performance among children of that culture. This information can help provide a more realistic appraisal of children’s strengths and needs. Several studies have evaluated the performance of children from different countries and/or different cultural groups on pediatric standardized tests developed in the United States and identified differences in test outcomes.11,12,15,22,36,39 In addition, observation of the child in a variety of contexts and communication with the family, caregivers, and others familiar with the child are essential to the assessment process.
Clearly, when using standardized tests, occupational therapists must have a number of skills beyond the ability simply to administer test items. Professional communication skills are essential when administering tests and reporting information. Awareness of family and cultural values helps put the child’s performance in a contextual framework. An understanding of the professional and ethical responsibilities involved in dealing with sensitive and confidential information is also extremely important. A competent examiner brings all of these skills into play when administering, scoring, interpreting, and reporting the results of standardized tests.
ADVANTAGES AND DISADVANTAGES OF STANDARDIZED TESTING
Standardized tests have allowed occupational therapists and other professionals to develop a more scientific approach to assessment, and the use of tests that give statistically valid numeric scores has helped give the assessment process more credibility. However, standardized tests are not without their drawbacks. This section discusses the advantages and disadvantages of using standardized tests, and presents suggestions on how to make test results more accurate and meaningful.
Advantages
Standardized tests have several characteristics that make them a unique part of the assessment inventory of pediatric occupational therapists. For example, they are tests that in general are well known and commercially available. This means that a child’s scores on a particular test can be interpreted and understood by therapists in other practice settings or geographic locations.
Standard scores generated by standardized tests allow testers from a variety of professional disciplines to “speak the same language” when it comes to discussing test scores. For example, a child may be tested by an occupational therapist for fine motor skills, by a physical therapist for gross motor skills, and by a speech pathologist for language skills. All three tests express scores as T-scores. An average T-score is 50. The child receives a fine motor T-score of 30, a gross motor T-score of 25, and a language T-score of 60. It is apparent that although this child is below average in both gross and fine motor skills, language skills are an area of strength; in fact, they are above average. These scores can be compared and discussed by the assessment team, and they can be used to identify areas requiring intervention and areas in which the child has particular strengths.
Standardized tests can be used to monitor developmental progress. Because they are norm-referenced according to age, the progress of a child with developmental delays can be measured against expected developmental progress compared with the normative sample. In this way, occupational therapists can determine if children receiving therapy are accelerating their rate of development because of intervention. Similarly, children who are monitored after discharge from therapy can be assessed periodically to determine whether they are maintaining the expected rate of developmental progress or are beginning to fall behind their peers without the assistance of intervention.
Standardized tests can be used for program evaluation to determine response to intervention across a large number of clients. Standard test scores can be subjected to statistical analysis to evaluate efficacy of interventions. These data can contribute to evidence-based practice and provide information about areas of strength and weakness in the intervention program that can be addressed through quality improvement processes.
Disadvantages
The importance of assessing standardized testing results within the child’s performance context is discussed in Chapter 7. A standardized test cannot stand alone as a measure of a child’s abilities. Clinical judgment, informal or unstructured observation, caregiver interviews, and data gathering from other informants are all essential parts of the assessment process. These less structured evaluation procedures are needed to provide meaning and interpretation for the numeric scores obtained by standardized testing.
Several other considerations must be taken into account when standardized tests are used. For example, a test session provides only a brief “snapshot” of a child’s behavior and abilities. The performance a therapist sees in a 1-hour assessment in a clinic setting may be different from that seen daily at home or at school. Illness, fatigue, or anxiety, or lack of familiarity with the test materials, the room, or the tester can adversely affect a child’s performance. The tester must be sensitive to the possible impact of these factors on the child’s performance.
A competent tester can do a great deal to alleviate a child’s anxiety about testing and to ensure that the experience is not an unpleasant one. However, any test situation is artificial and usually does not provide an accurate indication of how the child performs on a daily basis. Therefore it is important for the therapist to speak to the child’s parent, caregiver, or teacher at the time of testing to determine whether the observed behavior is truly representative of the child’s typical performance, and the representativeness of the behavior must be taken into account when the child’s test scores are interpreted and reported.
Another concern about standardized tests is the rigidity of the testing procedures themselves. Standardized tests specify both particular ways of administering test items and, in many cases, exactly what instructions the tester must give. In view of these administration requirements, children who have difficulty understanding verbal instruction (e.g. with autism, hearing impairment, or attention deficit) or lack control of movement (e.g., with muscle weakness or lack of coordination) may be disadvantaged on performance-based tests. Although this issue is not addressed by all standardized tests, some provide guidelines for administering the test under nonstandard conditions, and some are specifically designed to evaluate functional performance and participation of children with disabilities using performance-based and observation-based formats. For example, the PDMS-2 provides case illustrations of how the test can be adapted for children with vision impairment and cerebral palsy. The BSID-III and the Sensory Profile provide normative data for several clinical groups. Piper and Darrah, in developing the AIMS, used infants who were preterm or born with congenital anomalies, as well as those who were full term and those who did not have an unusual diagnosis.52 The PEDI, the Gross Motor Function Measure (GMFM),57 and the SFA are examples of tests that evaluate function and participation of children with identified disabilities. The PEDI measures the level of caregiver assistance and environmental modifications required for children to perform specific functional tasks. The PEDI assesses the level of independence and the quality of performance of children whose disabilities may prevent them from executing a particular task in a typical way. The GMFM is a criterion-referenced test that measures the components of a gross motor activity accomplished by children with cerebral palsy. It provides information necessary for designing intervention programs and measuring small increments of change. The SFA evaluates the child’s performance of functional tasks that support participation in the academic and social aspects of an elementary school program.
It is important to reiterate that although it is permissible to alter the administration procedures of most performance-based tests to accommodate children’s individual needs, the child’s performance cannot be expressed as a standard score. Rather, the purpose of the testing is to provide a structured format for describing the child’s performance (Case Study 8-1). The test manual should always be consulted for guidelines on alterations in test procedures.
 CASE STUDY 8-1
Caitlin is a 5.5-year-old kindergarten student referred for occupational therapy assessment by her teacher, Mrs. Clark, who notes that Caitlin is having difficulty learning to write; she holds her pencil awkwardly and exerts too much pressure on the paper. On the playground she has difficulty keeping up with her peers, falls frequently, appears uncoordinated, and has difficulty learning new motor skills. Her energy level is low. She is easily overwhelmed by typical classroom activity and often has emotional outbursts, which affect her ability to complete her work and interact with classmates.
The occupational therapist, Debra, spoke to Caitlin’s parents and discovered that Caitlin received physical therapy as an infant because of low muscle tone and slow achievement of developmental milestones. Her parents were worried about her ability to cope with the increase in writing assignments in first grade and her social acceptance by other children.
Debra considered Caitlin’s age (5.5 years) and the areas of concern (gross and fine motor skills and social adjustment) in choosing which standardized tests to use. She decided to administer the PDMS-2, along with clinical observations of Caitlin’s posture, muscle tone, strength, balance, motor planning, hand use and hand preference, attention, problem-solving skills, and visual skills. She asked Caitlin’s teacher to complete the SFA to provide information on Caitlin’s performance of functional school-related behaviors. In addition, she had the teacher complete the Sensory Profile School Companion (SPSC) (Dunn, 2006) to determine whether sensory processing problems were contributing to Caitlin’s motor delays.
Caitlin’s testing session was scheduled at midmorning to avoid possible effects of fatigue or hunger. She attended well, although she needed encouragement for the more challenging items. By the end of the session she complained of fatigue, but Debra believed she was able to get a representative sample of Caitlin’s motor skills and that the scores obtained were reliable.
On the PDMS-2 Caitlin received a gross motor quotient of 81, placing her at the 10th percentile for her age. Her fine motor quotient was 76, placing her at the 5th percentile. In the gross motor area, ball skills were an area of relative strength, but she had difficulty with balance activities and activities involving hopping, skipping, and jumping. In the fine motor area, Caitlin used a static tripod grasp on the pencil, frequently shifting into a fisted grasp if the writing task was challenging. Based on the small number of visual-motor items on this test, visual-perceptual skills appeared to be an area of strength, whereas tasks involving speed and dexterity were difficult.
Debra found that Caitlin had low muscle tone overall, particularly in the shoulder girdle and hands, and strength was somewhat decreased overall. Caitlin’s endurance was poor. Motor planning difficulties were evident in the way she handled test materials and moved about the environment. She had difficulty devising alternate ways to accomplish tasks that were challenging for her and required manual guidance to complete some tasks.
Debra obtained a functional profile on the SFA based on Mrs. Clark’s responses to the items on the test. On the scales of recreational movement, using materials, clothing management, written work, and task behavior and/or completion, Caitlin received scores below the cutoff for her grade level. Other scales were within grade-level expectations, with strengths in the scales of memory and understanding, following social conventions, and personal care awareness.
On the SPSC, scores indicated that Caitlin had definite differences in Environmental Sensations–Auditory and Body Sensations–Movement. She also received definite difference scores in School Factors 1, indicating a need for external support for sensory input, and School Factor 3, a low tolerance for sensory input. The scale confirmed that she could easily become overloaded by environmental stimuli.
OBSERVATIONS AND RECOMMENDATIONS
According to her scores on the PDMS-2, Caitlin had mild delays in her gross motor skills and mild to moderate delays in her fine motor skills. Although Debra believed that the PDMS-2 gave a good indication of what Caitlin could do under optimal circumstances (i.e., a nondistracting environment, individual attention and encouragement, and structuring of tasks to maximize success and minimize frustration), she also thought it did not represent the level of performance that would be seen over the course of a typical day.
In the classroom Debra observed that Caitlin avoided motor activities and completed writing and drawing activities rapidly, resulting in poor quality of the endproduct. Her materials were disorganized, she required multiple reminders to complete tasks, and she became upset when unable to finish on time. SFA results indicated that her performance of tasks involving fine and gross motor coordination and task organization was below grade-level expectations.
Debra met with the teacher, psychologist, principal, and Caitlin’s parents to determine a plan of action. The SFA was used to facilitate collaborative problem solving by helping to identify which specific areas of school function could be targeted in the classroom and which skills should be identified as functional outcomes.
The team determined that Debra would provide recommendations to Mrs. Clark about classroom modifications and activities that would increase Caitlin’s success and build her motor skills. The team members also collaborated to design strategies and routines that could be used at school and at home to improve Caitlin’s on-task behavior, sensory responsiveness, organization, and ability to manage daily tasks at school.
Debra provided a chair that fit Caitlin better and allowed better positioning for writing. She provided Mrs. Clark with ideas for appropriate activities and ways of teaching Caitlin new motor skills and addressing her sensory needs. Debra provided Caitlin’s parents with suggestions for family activities that would improve general strength and endurance (e.g., bicycle riding and swimming) and provided specific ideas for ways they could build Caitlin’s fine motor skills at home. She also agreed to be available to Mrs. Clark for periodic informal consultation. It was agreed that a reassessment would be scheduled at the end of the school year so that the team could make a decision about further intervention and program planning for the next school year.
Standardized testing, specifically the PDMS-2, SFA, and SPSC, provided a helpful framework for Debra’s assessment of Caitlin and gave specific information about areas of strength and difficulty. Debra made use of her clinical observations and information gathering from a variety of sources to recommend interventions she felt would be beneficial, efficient, and relatively easy to implement. The standardized scores helped her identify Caitlin’s problems in fine and gross motor skills, and the test items provided activities that revealed the challenges Caitlin faced when performing motor tasks. However, if Debra had simply relied on the standardized test scores, she would not have acquired the breadth of knowledge that led to her decision-making process for developing intervention options. This example illustrates the important roles of both standardized testing and other methods of data collection in arriving at meaningful and realistic conclusions about children’s intervention needs and modes of service delivery.
REFERENCES
1. Andrich, D. Rasch models for measurement. Beverly Hills, CA: Sage Publications, 1988.
2. Atchison, B.T., Fisher, A.B., Bryze, K. Rater reliability and internal scale and person response validity of the School Assessment of Motor and Process Skills. American Journal of Occupational Therapy. 1998;52:843–850.
3. Ayres, A.J. Southern California Sensory Integration Tests. Los Angeles: Western Psychological Corporation, 1972.
4. Ayres, A.J. Sensory Integration and Praxis Test manual. Los Angeles: Western Psychological Corporation, 1989.
5. Ayres, A.J., Marr, D. Sensory Integration and Praxis Tests. In: Fisher A., Murray E., Bundy A., eds. Sensory integration: Theory and practice. Philadelphia: F.A. Davis; 1991:201–233.
6. Barbosa, V.M., Campbell, S., Berbaum, M. Discriminating infants from different developmental outcome groups using the Test of Infant Motor Performance (TIMP) Item Responses. Pediatric Physical Therapy. 2007;19:28–39.
7. Bayley, N. Bayley Scales of Infant and Toddler Development, Motor Scale, 3rd ed. San Antonio, TX: PsychCorp, 2006.
8. Beery, K.E., Buktenica, N.A., Beery, N.A. Developmental Test of Visual-Motor Integration, 5th ed. Los Angeles: Western Psychological Services, 2004.
9. Bricker, D. Assessment, evaluation, and programming system for infants and children, 2nd ed. Baltimore: Brookes, 2002.
10. Bruininks, R.H., Bruininks, B.D. Bruininks-Oseretsky Test of Motor Proficiency, 2nd ed. Circle Pines, MN: AGS Publishing, 2005. [Manual].
11. Chow, S.M.K. The suitability of the Sensory Profile for diagnosing sensory modulation dysfunctions in Chinese children. International Journal of Rehabilitation Research. 2005;28:153–158.
12. Chow, S.M.K., Henderson, S.E., Barnett, A.L. The Movement Assessment Battery for Children: A comparison of 4-year-old to 6-year-old children from Hong Kong and the United States. American Journal of Occupational Therapy. 2001;55:55–61.
13. Coster, W. Occupation-centered assessment of children. American Journal of Occupational Therapy. 1998;52:337–344.
14. Coster, W., Deeney, T., Haltiwanger, J., Haley, S. School Function Assessment. San Antonio, TX: Psychological Corporation, 1998.
15. Crowe, T.K., McClain, C., Provost, B. Motor development of Native American children on the Peabody Developmental Motor Scales. American Journal of Occupational Therapy. 1999;53:514–518.
16. Cunningham-Amundson, S.J., Crowe, T.K. Clinical applications of the standard error of measurement for occupational and physical therapists. Physical and Occupational Therapy in Pediatrics. 1993;12(4):57–71.
17. Deitz, J.C. Reliability. Physical and Occupational Therapy in Pediatrics. 1989;9(1):125–147.
18. Dunn, W. Sensory Profile User’s Manual. San Antonio: Psychological Corporation, 1999.
19. Dunn, W. Sensory Profile School Companion. San Antonio, TX: Psychological Corporation, 2006.
20. Dunn, W., Brown, C., McGuigan, A. The ecology of human performance: A framework for considering the effect of context. American Journal of Occupational Therapy. 1994;48:595–607.
21. Dunn, W., Myles, B.S., Orr, S. Sensory processing issues associated with Asperger syndrome: A preliminary investigation. American Journal of Occupational Therapy. 2002;56:97–102.
22. Egilson, S.T., Coster, W.J. School Function Assessment: Performance of Icelandic students with special needs. Scandinavian Journal of Occupational Therapy. 2004;11:163–170.
23. Fisher, A.G. Assessment of Motor and Process Skills. Vol. 1: Development, standardization, and administration manual, 5th ed. Fort Collins, CO: Three Star Press, 2003.
24. Fisher, A.G. Assessment of Motor and Process Skills. Vol. 2: User manual, 5th ed. Fort Collins, CO: Three Star Press, 2003.
25. Fisher, A.G., Bryze, K., Atchison, B.T. Naturalistic assessment of functional performance in school settings: Reliability and validity of the School AMPS scales. Journal of Outcome Measurement. 2000;4:504–522.
26. Fisher, W.P. Measurement-related problems in functional assessment. American Journal of Occupational Therapy. 1993;47:331–338.
27. Folio, M.R., Fewell, R.R. Peabody Developmental Motor Scales, 2nd ed. Austin, TX: Pro-Ed, 2000.
28. Frankenburg, W.K., Dodds, J.B. Denver II Developmental Screening Test. Denver, CO: Denver Developmental Materials, 1990.
29. Franklin, L., Deitz, J., Jirikowic, T., Astley, S. Children with Fetal Alcohol Spectrum Disorders: Problem behaviors and sensory processing. American Journal of Occupational Therapy. 2008;62:265–273.
30. Furuno, S., O’Reilly, K.A., Hosaka, C.M., Inatsuka, T.T., Allman, T.L., Zeisloft, B. HELP activity guide (0–3). Palo Alto, CA: Vort, 2005.
31. Geiger, K.F., Spies, R.A., Carlson, J.F., Plake, B.S. Seventeenth mental measurements yearbook. Lincoln, NE: Buros Institute of Mental Measurements, 2007.
32. Gregory, R.J. Psychological testing: History, principles and applications, 3rd ed. Needham Heights, MA: Allyn & Bacon, 2000.
33. Grimby, G., Andren, E., Holmgren, E., Wright, B., Linacre, J.M., Sundh, V. Structure of a combination of functional independence measure and instrumental activity measure items in community-living persons: A study of individuals with cerebral palsy and spina bifida. Archives of Physical Medicine and Rehabilitation. 1996;77:1109–1114.
34. Haley, S.M., Coster, W.J., Ludlow, L.H., Haltiwanger, J.T., Andrellos, P.J. Pediatric Evaluation of Disability Inventory: Development, standardization and administration manual. San Antonio, TX: Psychological Corporation, 1992.
35. Hammill, D.D., Pearson, N.A., Voress, J.K. Developmental Test of Visual Perception, 2nd ed. Austin, TX: Pro-Ed, 1993.
36. Katz, N., Kizony, R., Parush, S. Visuomotor organization and thinking operations of school-age Ethiopian, Bedouin, and mainstream Israeli children. Occupational Therapy Journal of Research. 2002;22:34–43.
37. Kazdin, A.E. Single-case research designs. New York: Oxford University Press, 1982.
38. Keller, J., Kafkes, A., Kielhofner, G. Psychometric characteristics of the Child Occupational Self Assessment (COSA), Part One: An initial examination of psychometric properties. Scandinavian Journal of Occupational Therapy. 2005;12:118–127.
39. Kerfeld, C.I., Guthrie, M.R., Stewart, K.B. Evaluation of the Denver-II as applied to Alaska Native children. Pediatric Physical Therapy. 1997;9:23–31.
40. Kielhofner, G. Model of human occupation: Theory and application, 4th ed. Philadelphia: Lippincott Williams & Wilkins, 2007.
41. King, G., Law, M., King, S., Hurley, P., Hanna, S., Kertoy, M., et al. Children’s Assessment of Participation and Enjoyment (CAPE) and Preferences for Activities of Children (PAC). San Antonio, TX: Harcourt Assessment, Inc, 2004.
42. Law, M., Baptiste, S., Carswell, A., McColl, M., Polatajko, H., Pollock, N. Canadian Occupational Performance Measure, 3rd ed. Ottawa: CAOT Publications, 1998.
43. Law, M., Cooper, B., Strong, S., Stewart, D., Rigby, P., Letts, L. Person-environment-occupation model: A transactive approach to occupational performance. Canadian Journal of Occupational Therapy. 1996;63:9–23.
44. Leavitt, R.L. Cross-cultural rehabilitation: An international perspective. London: W.B. Saunders, 1999.
45. Lynch E.W., Hanson M.J., eds. Developing cross-cultural competence: A guide for working with young children and their families. Baltimore: Brookes, 1998.
46. Miller, L.J. Miller Assessment for Preschoolers: MAP manual, rev. ed. San Antonio, TX: Psychological Corporation, 1988.
47. Miller, L.J. First STEp screening tool. San Antonio, TX: Psychological Corporation, 1990.
48. Miller, L.J. Miller Function and Participation Scales Examiner’s Manual. San Antonio, TX: The Psychological Corporation, 2006.
49. Murphy L.L., Spies R.A., Plake B.S., eds. Tests in print VII. Lincoln, NE: Buros Institute of Mental Measurements, 2006.
50. Parham, L.D., Ecker, C., Kuhaneck, H.M., Henry, D.A., Glennon, T.J. Sensory Processing Measure Manual. Los Angeles: Western Psychological Services, 2007.
51. Parks, S. Inside HELP: Administration manual (0–3). Palo Alto, CA: Vort, 2006.
52. Piper, M.C., Darrah, J. Motor assessment of the developing infant. London: W.B. Saunders, 1994.
53. Polgar, J.M. Critiquing assessments. In: Crepeau B., Cohn E.S., Boyt Schell B.A., eds. Willard and Spackman’s occupational therapy. 10th ed. Philadelphia: Lippincott Williams & Wilkins; 2003:299–313.
54. Portney, L.G., Watkins, M.P. Foundations of clinical research: Applications to practice. Upper Saddle River, NJ: Prentice Hall Health, 2006.
55. Rogers, S.J., Hepburn, S., Wehner, E. Parent reports of sensory symptoms in toddlers with autism and those with other developmental disorders. Journal of Autism and Developmental Disorders. 2003;25:61–70.
56. Roth, E.J., Heinemann, A.W., Lovell, L.L., Harvey, R.L., McGuire, J.R., Diaz, S. Impairment and disability: Their relation during stroke rehabilitation. Archives of Physical Medicine and Rehabilitation. 1998;79:329–335.
57. Russell, D., Rosenbaum, P., Avery, L.M., Lane, M. Gross Motor Function Measure. Cambridge, UK: Cambridge University Press, 2002. [(GMFM-66 and GMFM-88). User’s manual].
58. Sternberg, R.J. Metaphors of mind: Conceptions of the nature of intelligence. Cambridge, UK: Cambridge University Press, 1990.
59. Stuhec, V., Gisel, E.G. Compliance with administration procedures of tests for children with pervasive developmental disorder: Does it exist. Canadian Journal of Occupational Therapy. 2003;70:33–41.
60. Terman, L.M., Merrill, M.A. Measuring intelligence. Boston: Houghton Mifflin, 1937.
61. Thorndike, R.L., Hagen, E.P., Sattler, J.M. Technical manual, Stanford-Binet Intelligence Scale, 4th ed. Chicago: Riverside, 1986.
62. Tomchek, S.D., Dunn, W. Sensory processing in children with and without autism: A comparative study using the Short Sensory Profile. American Journal of Occupational Therapy. 2007;61:190–200.
63. Urbina, S. Essentials of psychological testing. Hoboken, NJ: Wiley, 2004.
64. Watling, R.L., Deitz, J., White, O. Comparison of Sensory Profile scores of young children with and without autism spectrum disorders. American Journal of Occupational Therapy. 2001;55:416–423.
65. Wechsler, D. Wechsler Intelligence Scale for Children. San Antonio, TX: Harcourt, 1991.
66. World Health Organization. The International Classification of Functioning, Disability, and Health. Geneva, Switzerland: World Health Organization, 2001.