Physiology of the blood and body fluids
 Objectives
In this chapter, you will learn to:
• Explain the different body fluid compartments and outline the methods and underlying principles by which these compartments can be measured
• Define osmolarity and osmolality, the effects of osmotic pressure, osmosis and the pressure of a gas in a solution
• Discuss how ions move between biological membranes and between the body and the external environment
• Describe the functions and components of blood
• Explain the S-shaped oxygen dissociation curve and how it is affected by carbon monoxide
• Discuss the Bohr and Haldane effects and how they affect carbon dioxide transport
• Describe the coagulation pathway, including the role of thrombin and platelets, the events involved in haemostasis, and the resolution of a clot
OVERVIEW OF BODY FLUIDS AND FLUID COMPARTMENTS
The major component of the human body is water, which accounts for 63% of an adult male. An increased body fat content is associated with ageing, obesity and being female. Consequently, the percentage of water in women falls to 52%. Dissolved within this water are carbon dioxide (CO2), nutrients, proteins and charged particles (ions).
Fluid in the body is distributed into different compartments (Fig. 2.1):
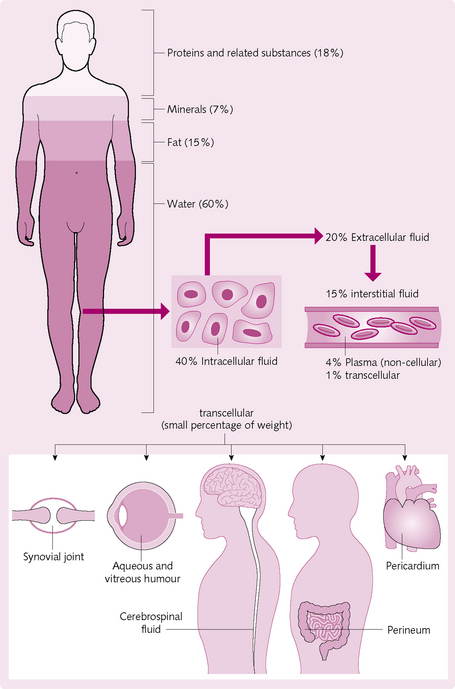
• Intracellular fluid (ICF): the fluid inside the cells.
• Extracellular fluid (ECF): all fluids outside cells, comprising:
ISF and plasma are in a state of continual exchange via pores in the highly permeable capillary membrane. The two fluids therefore have a similar composition, with the exception of large proteins, which are trapped within the capillaries in the vascular system.
Transcellular fluid is another small compartment of body fluid. Although it can be viewed as a specialized type of ECF, their compositions vary greatly.
Osmolarity and osmolality
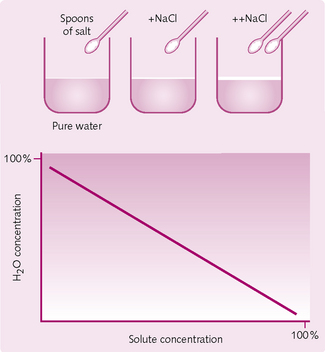
Adding solute dilutes the concentration of pure water, and so increasing solute concentration decreases water concentration (Fig. 2.2).
The tendency of water (solvent) to diffuse from a region of higher concentration to an area of lower water concentration until equilibrium is reached underlies the principle of osmosis. As explained in Chapter 1, osmosis is the diffusion of solvent through a selectively (semi-) permeable membrane from a less concentrated solution to a solution with a higher concentration of solute. Note that the membrane allows the passage of solvent but not solute. In biological systems, this solvent is water (Fig. 2.3).
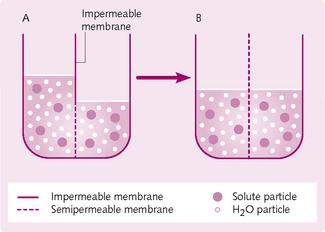
The pressure at which water is drawn from the weak solution (on the left side of Fig. 2.3A) into the more concentrated solution (on the right side of Fig. 2.3A) is known as the osmotic pressure; the higher the solute concentration, the higher the osmotic pressure. Water will be drawn into the right side until there is osmotic equilibrium (Fig. 2.3B). If a pressure is applied on the more concentrated side (Fig. 2.3A), net movement of water can be prevented.
 In Figure 2.3, osmotic pressure exerted by the solution forces water to move from left to right, as hydrostatic pressure forces movement in the opposite direction
In an ideal solution, osmotic pressure is similar to the pressure of a gas, with respect to temperature and volume:

Where P = pressure of a gas, n = number of particles, R = the gas constant, T = absolute temperature and V = the volume of the gas.
Therefore, at a given temperature, osmotic pressure will be proportional to the number of particles per unit volume. Solute particles are seen as the osmotically active particles, the total concentration of which, regardless of exact composition, is referred to as osmolarity, which is expressed in osmoles (Osm):
The nature of the solute will dictate the osmolarity. Dissolving 1 mole of a non-ionizing compound, such as glucose, in water will give a solution of 1 Osm. However, dissolving 1 mole of sodium chloride (NaCl), which dissociates into Na+ and Cl−, will give a solution of 2 Osm.
Although the above is true for an ideal solution, it is not the case for bodily solutions, in which the number of osmotically active particles is less than the dissociated particles as a result of ion combinations. This effect is more pronounced with increasing concentration: the more NaCl dissolved per unit volume, the less it behaves like an ideal solution.
Osmolarity
This can be illustrated by putting x Osm of solute into a beaker then adding water to make up 1 L of solution. Clearly, the water added would be less than 1 L.
THE DIFFUSION OF IONS ACROSS BIOLOGICAL MEMBRANES
The selective permeability properties of the cell membrane play an important role in cell function by controlling the entry into cells of small molecules and ions. Diffusion across biological membranes can be divided broadly into passive and active forms of transport (see also Chapter 1).
Passive transport
The movement of small molecules and ions is dictated by their electrochemical concentration gradient. They move from high to low concentrations, or to neutralize a charge imbalance between two zones.
Size, electrical charge, shape and weight affect the rate of diffusion. If a substance is lipid soluble, diffusion across the cell membrane (which is formed from a lipid bilayer; see Chapter 1) will occur more readily. However, with polar substances, diffusion rates through water-filled ion channels are greater.
If the solutions either side of a membrane comprise only diffusible ions, diffusion occurs until equilibrium is reached and the ion distribution on each side is the same. At this point, this is the value of diffusible anions × diffusible cations.
Non-ionic diffusion
Although weak acids and bases cross cell membranes with difficulty in their ionic and dissociated forms, some have increased solubility in their undissociated form. Diffusion of such undissociated substances is called non-ionic diffusion; it occurs in the kidneys and gastrointestinal tract.
The Gibbs–Donnan effect
Non-diffusible ions trapped on one side of a membrane affect the passage of other ions. Negatively charged proteins (anions) will attract positive ions (cations) but repel other anions. This effect is described by the Gibbs–Donnan equation. The concentration of diffusible ions on side A of the membrane is the same as that on side B:
FLUID MOVEMENT BETWEEN BODY COMPARTMENTS
The body’s fluid compartments are normally in osmotic equilibrium, although they contain different amounts of various ions (Fig. 2.4):
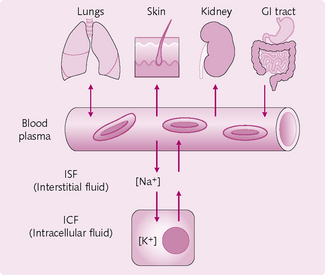
• ICF: K+ contributes ≈ 50% of osmolality.
• ISF and plasma: Na+ and Cl− are responsible for ≈ 80% of osmolality.
Plasma and interstitial fluid exchange
In the capillaries, the osmolality of plasma is approximately 1 mOsm/L greater than the osmolality of ICF and of ISF. Much of this is due to plasma proteins. This osmotic pressure draws fluid into the capillaries and is counterbalanced by the capillary hydrostatic pressure, which is 20 mmHg greater than that of the ISF.
The exchange of water and ions occurs across the thin capillary wall, which is composed of endothelial cells. Substances can pass via:
• Vesicular transport (not discussed further but requires energy expenditure).
As well as this vesicular transport, simple diffusion and filtration are responsible for transport.
Simple diffusion
This is responsible for 90% of exchange – relating mainly to net efflux of O2 and glucose from plasma and influx of CO2 into plasma.
Filtration
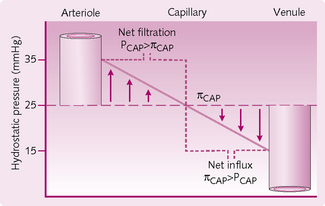
This is responsible for 10% of exchange. The rate of filtration relies on Starling forces, which are derived from two aspects of the ISF and capillary fluid:
Fluid movement = Kf[(PCAP − πCAP) − (PISF − πISF)]
Where PCAP = capillary hydrostatic pressure, PISF = ISF hydrostatic pressure, πCAP = capillary oncotic pressure, π ISF = ISF oncotic pressure and kf = filtration coefficient which takes account of the capillary surface area and permeability per unit surface area.
The oncotic pressure of the capillary is 25 mmHg throughout. Hydrostatic pressure of the capillary, however, decreases progressively from the arteriolar end (32 mmHg) to the venous end (12 mmHg).
Oncotic pressure
Oncotic pressure is the osmotic pressure produced by the proteins that are confined to a compartment/space by their relatively large size. Its value remains constant throughout the capillary. The effect of these proteins is to draw fluid into the compartment/space in which they are confined. In the plasma, oncotic pressure is 17 mmHg but, owing to imbalance of ions as the result of the Donnan effect, there are more Na+ ions within the capillary and therefore a higher osmotic pressure of 25 mmHg.
Hydrostatic pressure
The following determine vessel hydrostatic pressure:
• Arteriolar resistance, on which depends the extent to which blood pressure is transferred along the capillary.
Hydrostatic pressure is maximal at the arteriolar end of the capillary (32 mmHg), where it exceeds oncotic pressure (which is 25 mmHg) and thus favours filtration. At the venous end, fluid re-entry into the capillary is favoured; hydrostatic pressure (12 mmHg) is lower than oncotic pressure (25 mmHg) (Fig. 2.5).
Exchange between interstitial fluid and the lymphatic vessels
The overall efflux of fluid from the capillaries would be expected to cause an increase in ISF hydrostatic pressure. However, this fluid, along with plasma proteins lost from the vascular space, enters a network of lymphatic channels, which is present in all organs and tissues. The fluid is returned to the circulatory system when the lymphatic system empties into the venous system via the thoracic duct in the neck. Normal lymph flow is 2–4 L per day.
FLUID AND ION MOVEMENT BETWEEN THE BODY AND THE EXTERNAL ENVIRONMENT
A careful balancing of fluid intake against output maintains the composition of body fluids (Fig. 2.6). Daily water intake can be from two sources:
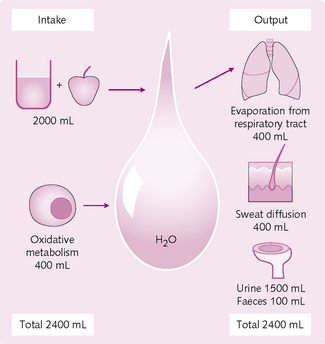
Daily water loss occurs by several different mechanisms:
• Lung: water evaporates continuously from the respiratory tract. The amount varies with climate and humidity.
• Skin: diffusion through the skin occurs independent of sweating and is minimized by the cornified cholesterol-filled skin layer. Sweating can account for variable water loss. Values are normally 100 mL/day, although it can increase to 1–2 L/h, depending on weather or exercise.
• Faeces: water loss can be excessive with diarrhoea compared to the small amount normally lost.
• Urine/kidney: the excretion of electrolytes and water by the kidney is the most important mechanism the body has to regulate fluid balance. The rate of water excretion is adjusted according to the body’s needs and water intake. This occurs by filtration and reabsorption and can maintain body fluid volumes despite change in fluid intake or loss elsewhere, e.g. haemorrhage.
There is a minimal necessary water loss of 1200 mL, which needs to be balanced by intake, and explains how untreated severe diarrhoea can kill in a few days.
MEASURING BODY FLUID COMPARTMENTS
It is not always possible to remove fluid for direct measurement and, instead, in-situ methods are used. A fixed amount of a substance is injected and the concentration then measured, to give its volume of distribution:

This calculation relies on the principle of conservation of mass. However, in real life, excretion and metabolism of the indicator substance takes place. Hence, to measure concentration x hours after administering the injection:

Dye can be injected to assist with measurement. The dye must be confined to the compartment being measured; it also needs to be distributed equally, as well as having no influence on water or other solute distribution. Two methods of measurement are used, depending on the rate of excretion from that compartment:
1. Single injection method: a test substance with a slow rate of excretion is used.
2. Constant infusion method: a test substance with rapid excretion is used.
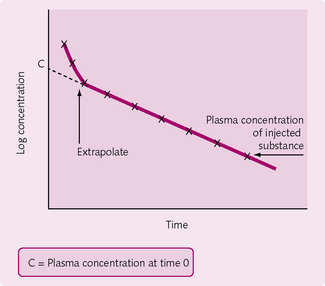
Slow injection method
After introduction of the dye, the concentration is measured at intervals. The logarithm of concentration is plotted against time with the concentration of the substance (denoted by using square brackets: [substance]) determined by extrapolating the straight portion of the graph back to time = 0 (Fig. 2.7):

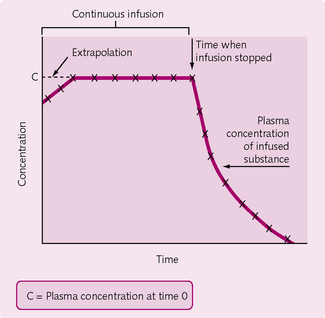
Constant infusion method
After an initial loading dose, the substance is infused at rate equal to the rate at which it is being excreted, so that plasma concentrations remain constant (they are checked at intervals). The infusion is then stopped and urine collected until all the substance is excreted. The amount present in the body when the infusion is stopped = amount excreted (Fig. 2.8):

Plasma volume
This is measured by the dilution principle using a high-molecular-weight substance that persists in the vascular compartment. Examples include radio-iodinated human serum albumin or the diazo compound Evans blue dye (T-1824).
Blood volume
This can be derived from the haematocrit (fraction of total blood volume) and the plasma volume:

So, if plasma volume = 3.5 L and haematocrit = 0.3, then TBV = 5 L.
Red cell volume
Red cell volume (RCV) can be measured in a variety of ways, depending on what information is known:

Extracellular fluid volume
The substances that are used to measure ECF by the dilutional principle also disperse in both plasma and ISF but are cell-membrane impermeable and so do not enter cells. Examples are:
Small amounts of radiochloride or radiosodium diffuse intracellularly. The lymphatic system cannot be separated from the ECF and is therefore measured with it. Normal ECF volume is 15 L (20% body weight).
Interstitial fluid volume
Direct measurements of ISF cannot be made and it is therefore calculated as:
Although absolute ECF volume is less in infants and children, the ECF: ICF ratio is larger. Hence, dehydration is frequently more severe and develops more rapidly in children than in adults.
Total body water
Radioactive water – tritium (3H2O) or deuterium (2H2O) – is used by the dilutional principle. Normal total body water values are:
Transcellular fluid
Transcellular fluid (TCF) is a small compartment usually considered as part of the ECF representing ∼5% of ECF (∼1L) and includes a number of small volumes such as cerebrospinal fluid, intraocular, pleural, peritoneal and synovial fluids. To include digestive secretions (which can be excessive and are, strictly speaking, outside the body) as transcellular may be debated.
BLOOD PHYSIOLOGY
Functions and components of the blood
Blood is the only liquid connective tissue. It comprises 8% of total body weight (5 L in a normal adult). The functions of blood relate to its composition:
• Transport: of gases, nutrients, waste products and hormones.
• Immunological: defence against bacteria, viruses and foreign bodies by leukocytes.
• Homeostatic: temperature, pH, haemostasis and fluid exchange.
There are two main components in blood (Fig. 2.9):
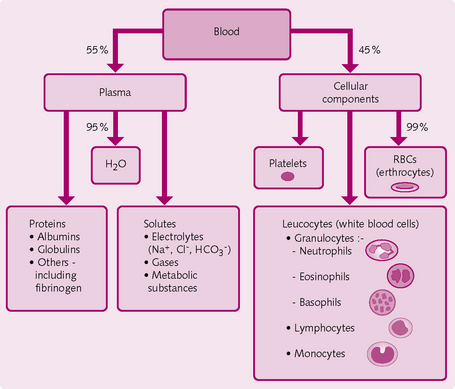
Plasma
• Water: forms a medium for the suspension and transport of proteins, solutes and gases and so influences partial pressures and gas exchange. Water is important in temperature regulation because it releases heat. It also removes waste and breakdown products.
• Solutes: electrolytes in particular create osmotic pressure. Ions, e.g. HCO3−, are important in buffering pH change.
• Proteins: are important buffers and exert oncotic pressure:
• Albumin: particularly important for vascular oncotic pressure and fluid exchange. it also transports fatty acids, lipid-soluble hormones and some drugs
• Globulins: α and β globulins transport hormones and iron, respectively. γ Globulins (antibodies) defend against viruses and bacteria.
• Other components: including fibrinogen, which is important in the process of blood clotting.
Cells
• RBCs: small, flexible, anucleate cells containing haemoglobin (∼ 8 μm diameter). The biconcave shape suits their function in gas exchange and their transport.
• Platelets: small cell fragments derived from megakaryocytes in the bone marrow. Initiate haemostasis and thrombus formation at injury sites.
• WBCs: numbers increase during infection, surgery or strenuous exercise:
• neutrophils (60%): engulf and phagocytose bacteria; also involved in inflammation. Numbers increase with bacterial infection, inflammation, burns and stress
• lymphocytes (20%): there are type B and type T cells, the immunological roles of which include generation of the specific immune response, including antigen–antibody reactions. Numbers increase in viral infections and some leukaemias
• monocytes (5%): phagocytose after transforming into macrophages. Numbers increase in viral or fungal, infections, tuberculosis and some chronic diseases
• eosinophils (3%): destroy worm parasites. In allergic reactions, they combat histamine. Numbers increase in parasitic infections, allergic reactions and autoimmune diseases
• basophils (< 1%): amplify the inflammatory response via the release of heparin and vasoactive substances. Numbers increase in allergic reactions, cancers and leukaemias.
Gas transport in the blood
After gas exchange at the lungs, gas transport completes the O2 and CO2 trade between cells and the external environment.
Oxygen transport
The factors affecting O2 delivery to tissues are:
• The speed of delivery or blood flow: this depends on vascular constriction/dilatation.
• The amount of O2 that can be carried by the blood: this depends on the:
Hence, O2 is transported in the blood in two forms:
O2 dissolves in plasma up to about 3 mL/L and, in accordance with Henry’s law, is proportional to its partial pressure. This small amount reflects the low solubility of O2 in plasma. Clearly, this is not sufficient to meet even the body’s resting metabolic needs of 250 mL O2/min, as a normal cardiac output of 5 L/min would supply only 15 mL/min of O2 in this form. Hence, a carrier molecule is needed to transport the required O2. This molecule is haemoglobin.
Haemoglobin
The molecular structure of this conjugate protein molecule is largely responsible for its O2-carrying properties (Figs 2.10 and 2.11). Each of the four subunits consists of a polypeptide chain attached to a haem group, which can reversibly bind with one O2 molecule. Hence, up to four molecules of O2 can combine with each molecule of haemoglobin (Hb); a combination that exhibits cooperativity among the four binding sites. Haemoglobin has a greater affinity for binding the second and third O2 molecules than the first and fourth, and these differences in affinity give rise to the characteristic ‘S’ shape of the O2 dissociation curve (see later).
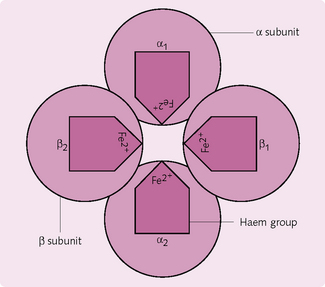
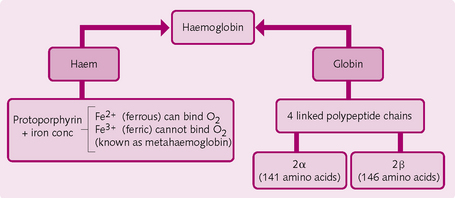
In adults, normal Hb is known as HbA, and consists of two α and two β chains. Any change to the sequence of the polypeptide chains results in structural differences, with consequent alteration to the properties of the Hb (see later).
Haemoglobin binding: The rapid reversible combination of O2 with Hb to form oxyhaemoglobin (HbO2) is written as:
Depending on the number of binding sites occupied by O2, Hb can be considered as either saturated (carrying all four molecules of O2) or partially saturated (carrying less than four molecules of O2).
The O2-carrying capacity of Hb is 1.34 mL O2/g Hb. This figure takes into account the small amounts of methaemoglobin (ferric iron core) in the O2-carrying state compared to the normal ferrous Fe2+ state, and also allows for Hb that has combined with carbon monoxide (CO): in neither state can Hb transport O2. Therefore, in an adult man with 15 g of Hb/dL blood, the O2-carrying capacity will be:
15 × 1.34 = 20.1 mL O2/dL blood
The actual O2-carrying capacity will depend on the amount of Hb in the blood, with the pressure of O2 (PO2) driving the O2 into the blood.
O2 saturation of Hb refers to the proportion of Hb bound to O2. When the amount of reduced (deoxygenated) Hb is > 5 mg, the lips, tongue and oral mucosa in particular take on a bluish pallor, known as central cyanosis. This reflects an O2 loading problem through either reduced gaseous exchange or pulmonary blood flow. Peripheral cyanosis-blueness of the nail beds and other extremities-results from secondary local causes such as sluggish blood flow, vasoconstriction, cold temperatures; that is it can occur independently of, but always in the presence of, central cyanosis.
The oxygen dissociation curve: Blood PO2 not only determines the amount of dissolved O2 in plasma, but also how much O2 binds to Hb, i.e. the O2 saturation. This is represented by the O2 dissociation curve (Fig. 2.12), which relates the PO2 to the O2-carrying capacity of Hb under the following conditions:
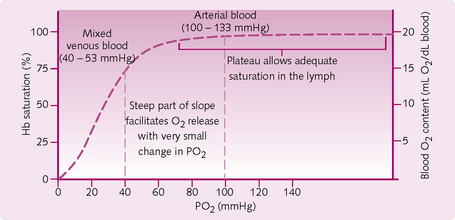
The graph is ‘S’-shaped because Hb undergoes four sequential reactions to enable each subunit to bind with O2. These reactions become progressively easier, except for the binding of the fourth oxygen molecule. The S shape of the curve is explained as follows:
• When PO2 is low: the curve is steep and small changes in PO2 lead to large changes in Hb saturation. This corresponds to gas exchange between the systemic capillaries and tissues. The result is that, for a small drop in PO2, the tissues can take large amounts of O2.
• When PO2 > 70 mmHg: the curve is almost flat. This confers the advantage that when alveolar PO2 drops, Hb can still become fully saturated with O2. Importantly, this means that someone with moderate lung disease or who is hypoventilating can still easily load blood with O2.
Various influences alter the behaviour of O2 dissociation by shifting the position of the O2 dissociation curve to the right or the left (Fig. 2.13).
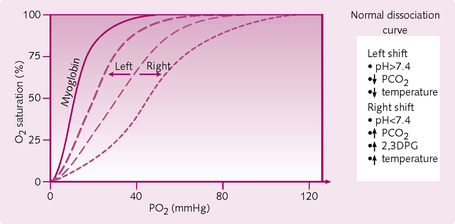
Left shift: This equates to increased affinity of Hb for O2 resulting in:
A shift to the left occurs when conditions causing a right shift are reversed, such as:
Effects of 2,3-diphosphoglycerate: 2,3-DPG is a normal metabolic by-product of RBC metabolism and large increases in levels of 2,3-DPG are seen in chronic hypoxia (chronic lung disease or at high altitudes). Its function is to facilitate the unloading of O2 for use by peripheral tissues by allowing greater O2 release at any PO2. It does this by binding to the β chains of Hb, thereby reducing its affinity for O2.
2,3-DPG is lost from stored blood, so that 1-week-old blood has very low levels. This means that unless 2,3-DPG levels are corrected, the blood will have very little tissue unloading.
Myoglobin: This haem protein is found within muscle. Like the Hb subunit, myoglobin consists of one haem group with a polypeptide chain. It has the following features:
• Higher affinity for O2 than normal adult Hb (HbA): the O2 dissociation curve is relatively to the left. Therefore, myoglobin takes up O2 from Hb in the capillaries.
• Acts to transport and temporarily store O2 in skeletal muscle and has limited availability during anaerobic conditions, lasting only a few seconds.
• Binds O2 at PO2 values greater than those in venous blood PO2. Hence it would be unsuitable as a blood carrier for O2 (because it would not surrender O2 to the tissues).
Fetal haemoglobin: The fetal circulation has a lower PO2 (30 mmHg after deoxygenation) than the maternal uterine arterial blood from which O2 diffuses. Fetal blood contains mainly fetal Hb (HbF), the structure of which differs from HbA in that γ chains replace the β chains of HbA. HbF is crucial in directing O2 transfer from maternal circulation to the fetus:
• HbF has a higher affinity for O2 and its dissociation curve is positioned to the left of that of HbA. Therefore, HbF is 20–50% more saturated with O2 than HbA at low PO2 levels.
• The concentration of Hb in fetal blood (the [HbF]) > the concentration in maternal blood ([HbA]). This results in greater carriage of O2 in fetal circulation.
• CO2 unloading from fetal to maternal circulation: the acidic affects of increased CO2 levels promote HbA dissociation of O2, shifting its curve to the right. As CO2 diffuses from fetal blood into maternal, this Bohr effect works in both fetal and maternal directions: double Bohr shift. O2 release from maternal to fetal circulation and increasing fetal blood O2 capacity are thereby promoted.
Sickle haemoglobin: The Hb variant HbS is found in sickle-cell disease. It consists of a single amino acid substitution at position 6 in the β-globin chain of HbA. This has the following consequences:
• The O2 dissociation curve is shifted to the right.
• HbS is a poorly soluble deoxygenated form that polymerizes, rendering the RBC fragile and crescent- or sickle-shaped: this further predisposes to thrombus formation, and hence vaso-occlusive crises caused by blockage of blood vessels can arise.
Sickle-cell disease is an autosomal recessive disorder with heterozygotes symptomatic only when hypoxic. However, homozygotes experience manifestations of infarction and ischaemia from vaso-occlusive crises (such as leg ulceration and bone pain, among others).
Thalassaemias: This is a group of disorders where there is an imbalance in the 1: 1 ratio of α- and β-globin chains, secondary to defective synthesis in either of these chains. As a consequence, the globin chains precipitate, causing:
Each chain is coded by four genes, with symptoms varying from a mild microcytic anaemia with two gene deletions, to the death of either the fetus or the newborn if all four genes coding a chain are deleted. Disease is described as minor, intermediate or major, depending on the number of normal genes.
Carbon monoxide poisoning and carboxyhaemoglobin: Carboxyhaemoglobin (carboxyHb) is formed when carbon monoxide (CO) binds to Hb. CO interferes with O2 transport in a number of ways:
• CO competes with O2 for Hb-binding sites and renders the iron atom to which it is bound unable to bind any O2 molecules.
• The affinity of CO for Hb is significantly higher (250 times greater) than that of O2. It also takes a long time to clear.
• Exposure to very low levels of CO can seriously compromise the O2-carrying capacity of blood: inspiration of 0.1% CO halves the O2-carrying capacity because 50% of Hb would be in the form of carboxyHb.
• CO shifts the O2 dissociation curve to the left, even further to the left than the curve for myoglobin (Fig. 2.13), decreasing both O2 loading at the lungs and O2 unloading at the tissues.
• CO poisoning is detected by blood carboxyHb levels and cherry-red colouring of the patient (from its pigment colour, not cyanosis). There would also be few if any symptoms.
Carbon dioxide transport
CO2 in the blood is found in the following forms:
• As bicarbonate ions (HCO3−) in plasma.
• As carbamino compounds (chemical combination with proteins) in whole blood.
The relative proportions of the above are subject to arteriovenous differences.
Dissolved CO2: Between 5 and 10% of CO2 is carried dissolved in the plasma. As with dissolved O2, the actual amount dissolved depends on the partial pressure of CO2. Henry’s law applies and CO2 is approximately 20 times more soluble than O2:
CO2 solubility at 37°C is:0.6 × 10⁻³ mL/mmHg CO2/1 mL of plasma
Therefore, in 100 mL mixed venous blood PCO2 = 45 mmHg, the amount of dissolved CO2 is:
0.6 × 10−3 × 100 × 45 = 2.7 mL CO2/dL blood or 27 mL CO2/L blood
Bicarbonate ions: The majority of CO2 is transported as HCO3−: 90% of CO2 in arterial blood and ≈60% of CO2 in venous blood is in this form:
H2CO3 = carbonic acid, which is a weak acid.
The formation of HCO3− ions from CO2 consists of two reactions:
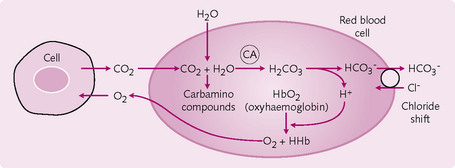
1. CO2 + H2O ↔ H2CO3: the formation of carbonic acid. This reaction requires the enzyme carbonic anhydrase, which is present in RBCs and which speeds up the reaction so that it is thousands of times faster than in the plasma.
2. H2CO3 ↔ H+ + HCO3−: the dissociation of carbonic acid into H+ and HCO3− is normally rapid. However, it is limited by accumulation of the products, which need to be removed if the reaction is to proceed. This can be achieved by:
• Hb buffering of H+: the reduced form of Hb is less acidic than the non-reduced form and so accepts H+ more readily:
• The chloride shift: HCO3− movement from RBC to plasma. A specific anion exchange (AE) is responsible for the movement of HCO3− out of and Cl−into the RBC. This Cl− movement is known as the chloride shift (Hamburger phenomenon) and is important in maintaining electrical neutrality.
Carbamino compounds: In the tissues, CO2 reacts readily with the terminal amine (NH2) group on blood proteins (i.e. Hb) to form carbamino compounds – including carbaminoHb – that contribute up to 30% of CO2 transport in venous blood. This reaction does not require an enzyme and occurs more readily with reduced (less acidic) Hb. At the lungs, CO2 is easily released by carbamino compounds.
The Haldane effect and the Bohr effect: The carriage of CO2 in the blood is increased by deoxygenation. This is a result of reduced Hb being a weaker acid than its oxygenated form. Hence reduced Hb has the following actions:
At the tissues, both Bohr and Haldane effects facilitate peripheral gas exchange (Fig. 2.14):
• ↑ PCO2 and ↓ pH promote O2 unloading from HbO2 (the Bohr effect), shifting the O2 dissociation curve to the right.
• ↓ PO2 encourages CO2 transport by the mechanisms described above (the Haldane effect).
At the lungs, again these effects are important (Fig. 2.15):
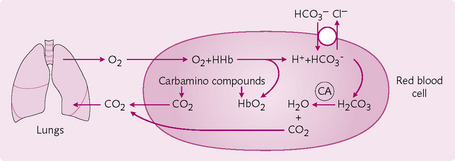
• ↑ PO2 and ↓ PCO2 facilitate CO2 release from carbamino compounds by forming oxyHb.
• Release of H+, which was buffered by Hb in its reduced form, is crucial for the reverse reaction that forms HCO3− and H+ and produces CO2, which is then exchanged at the lungs and exhaled.
Importantly, pH remains stable at both sites of gas exchange:
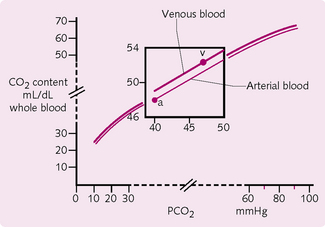
Carbon dioxide dissociation curve: PCO2 dictates the total blood concentration of CO2 in all its different forms of transport (Fig. 2.16). Importantly, the CO2 dissociation curve displays an absence of flat portions and therefore does not demonstrate any saturation. The variability of PCO2 is therefore greater than that of PO2.
Haemostasis
Haemostasis refers to the control of bleeding. Following injury to a blood vessel, responses occur in two phases:
1. Rapid: reactions of blood vessel and platelets:
• formation of a platelet mass at the site of injury
• diffusion of tissue factors from the extravascular compartment, initiating the extrinsic coagulation pathway.
2. Slow: intrinsic coagulation pathway: formation of insoluble fibrin threads that stabilize the platelet mass.
Three mechanisms are involved with haemostasis:
2. Formation of a platelet plug.
3. Coagulation (formation of a blood clot) with eventual clot retraction.
Vasoconstriction
Immediately after an injury to a blood vessel, the smooth muscle in the vascular wall contracts, decreasing diameter and blood loss. This occurs in response to:
Formation of a platelet plug
Platelet adhesion, activation and aggregation occur (Fig. 2.17).
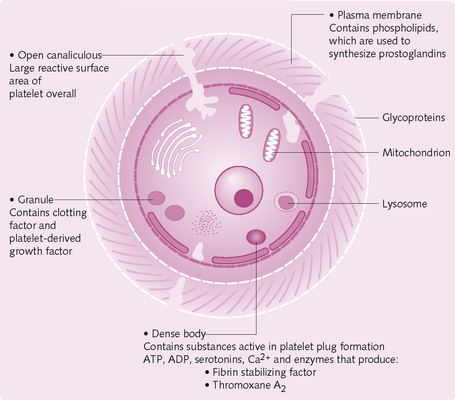
Adhesion: Damage to the vascular endothelium exposes collagen and other connective tissue to which platelets adhere.
Activation: During activation, platelets undergo:
• Shape change: they swell then extend many projections that facilitate greater contact with other platelets.
• Granule release: contractile proteins contract, causing release of the following from granules:
Activated platelets recruit nearby platelets so that the effects are amplified.
Coagulation
Coagulation comprises a sequence of enzyme-catalysed conversions of inactive factors to more active forms, culminating in the conversion of fluid blood into a solid gel or clot.
Blood clot formation begins a matter of seconds after severe trauma to the vascular wall, and in minutes after injury to other areas of the body.
Two pathways are involved (Fig. 2.18):
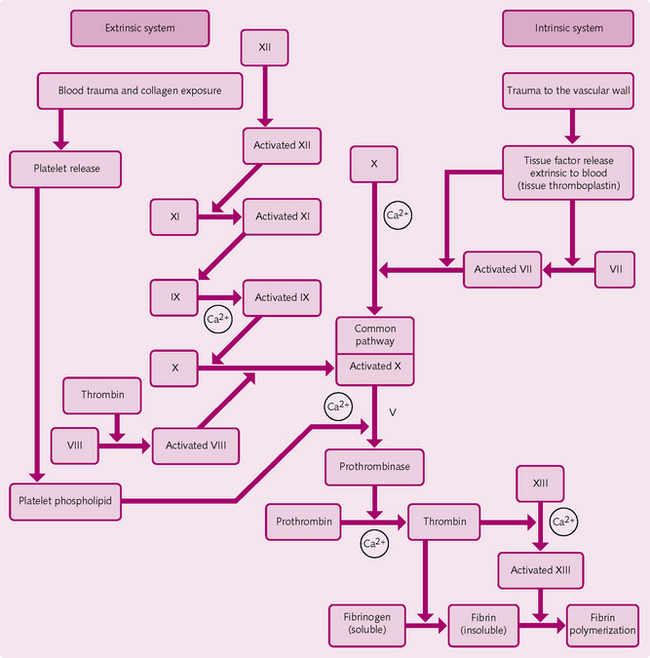
Both pathways produce prothrombinase (prothrombin activator), the formation of which appears to be the rate-limiting step in haemostasis. After this stage, pathways follow a common set of reactions, which is known as the final common pathway (see Fig. 2.18):
1. Prothrombinase and ionized Ca2+ cause prothrombin → thrombin.
2a. Thrombin and ionized Ca2+ cause fibrinogen (soluble) → fibrin fibres (insoluble).
2b. Thrombin activates fibrin-stabilizing factor (XIII), which cross-links the fibrin fibres.
The cross-linked fibrin strands mesh plasma, the platelet plug, plasmin and RBCs to form a blood clot. In clinical practice:
• The intrinsic pathway is monitored by partial or accelerated thromboplastin time (APTT).
• The extrinsic pathway is monitored using the prothrombin time (PT).
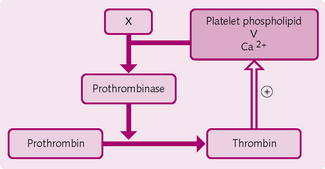
Role of thrombin: Thrombin formed in the first stage on the final common pathway exerts positive feedback effects on the coagulation cascade (Fig. 2.19):
Thrombus formation: A thrombus is a clot that forms within an intact blood vessel. This results from inappropriate activation of haemostasis with one of the following consequences:
• The thrombus dissolves spontaneously.
• The thrombus remains intact, with the risk of embolization.
Blood clots, fat from a fracture and air bubbles transported by the blood can all form emboli. They can lodge in a blood vessel, blocking it and interrupting the blood supply.
Clot retraction: Within a few minutes of its formation, the clot begins to contract due to platelets applying tension to the fibrin fibres that are attached to damaged blood vessels, the ends of which are therefore brought closer together. In addition, fluid is squeezed out of the clot. Platelets are suited to clot retraction because they:
Normal prevention of coagulation
The normal vascular system employs a number of mechanisms to keep haemostasis in check:
Inhibition of the coagulation cascade
• Endothelial-bound thrombomodulin: binds thrombin and activates protein C, which is a plasma protein.
• Protein C: inactivates factors V and VIII.
• Antithrombin III (α-globulin and most important circulating anticoagulant): combines with thrombin, inactivating it for up to 20 minutes and blocking its effects on fibrinogen.
• Heparin molecule: is not active by itself but potentiates antithrombin III 100–1000-fold, with the added effect of removing activated factors XII, XI, X and IX.