Chapter 10 Metabolism and pharmacokinetic optimization strategies in drug discovery
Introduction
Optimization of drug metabolic and pharmacokinetic properties is an integral component of the modern drug discovery process. The objective of the drug metabolism and pharmacokinetics (DMPK) discipline in drug discovery is to aid design and selection of candidate drugs with properties that yield the required efficacy and safety for effective clinical use. The roles of DMPK at the various stages of drug discovery are summarized in Table 10.1. DMPK in vitro and in vivo information are used throughout the drug discovery process to facilitate target validation and safety assessment, and to guide the conversion of early screening hits and leads into drug candidates. Indeed, the frontloading of DMPK in drug discovery has resulted in a reduction of drug attrition rate due to undesirable DMPK properties from approximately 40% in 1990 to 10% in 2000 (Kola and Landis, 2004).
Table 10.1 Roles of drug metabolism and pharmacokinetics (DMPK) in various phases of drug discovery
To help drug hunting teams focus on the key issues and goals, in a multitude of screening options, it is important to prescribe, as early as possible, a candidate drug target profile in terms of efficacy, potency, safety and ease of use. DMPK plays a central role in defining this target profile. For instance to be commercially attractive in terms of ease of use, a compound has to be orally active, has a convenient dosing regimen and be able to be administered without effect from food and other medications. The physicochemical and DMPK attributes that will allow a compound to meet this target profile would be: good solubility and permeability, high oral bioavailability, low clearance and reasonable half-life (if PD half-life is not much longer than PK half life), and absence of ‘drug–drug interaction’ potential. Likewise to be orally active, a compound should have good oral bioavailability and able to reach the target organ at high enough concentration to engage the target.
In this chapter, strategies to optimize key DMPK challenges using appropriate in silico, in vitro and in vivo DMPK tools during drug discovery are presented. The rational use of these strategies will help ‘drug hunting’ projects to advance drug candidates with attractive DMPK target profile and with low potential for failure in development due to DMPK issues. In addition, as prediction of human PK and safe and effective dose is probably the most important activity in drug discovery to ensure that the candidate drug has the attribute to test the biological hypothesis in patients, strategy to integrate information in discovery to holistically predict PK properties in man will be discussed.
Optimization of DMPK properties
Optimization principles are described for six key DMPK areas:
• Absorption and bioavailability
• Avoiding PK-based drug–drug interactions

The following sections summarize current understanding/available tools and suggest best practice for each of the above. Each section introduces the challenges, outlines tactics for dealing with them and identifies areas requiring caution.
Absorption and oral bioavailability
Introduction
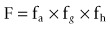
As the preferred route of administration for most indications is oral, it is important to characterize oral bioavailability (F) of a compound during drug discovery. In addition, F must be optimized, as a low F is often associated with poor and variable exposure and lack of efficacy. F is defined as the percentage of dosed drug that reaches the systemic circulation compared to the IV route. As shown below, it can be considered to be dependent on three serial steps: the fraction of dosed drug absorbed (fa), the fraction escaping intestinal metabolism (fg) and the fraction extracted by the liver as it passes from the portal vein to the systemic circulation (fh) (see Rowland and Tozer, 1989):
fa is influenced by a number of factors including the gastrointestinal (GI) solubility (dose, particle size, pH solubility profile and formulation), the effective permeability (both passive permeability and active transport processes) and GI stability. fg and fh are affected by metabolic enzymes in the intestinal wall and liver, respectively. In addition, fh can be influenced by transporters if a drug is excreted unchanged into the bile. Both metabolic and active transport processes are saturable, generally obeying Michaelis–Menten kinetics. Hence, fa, fg and fh can all be non-linear if relevant concentrations are above the Michaelis–Menten constant (Km) for the particular enzyme/transporter–drug interaction.
In humans, the combinations of high to low solubility and permeability have led compounds to be characterized according to the Biopharmaceutical Classification System (Amidon et al., 1995). Class 1 compounds, with high solubility and permeability, generally have very good absorption properties. Those in Class 4, with poor solubility and permeability, are likely to present significant formulation challenges and/or variable and poor exposure. It can be important to characterize the maximum absorbable dose (MAD) of a compound relative to its predicted therapeutic dose, as this will determine the risk of being able to deliver an efficacious dose to humans and guide whether high exposure in safety studies is achievable.
Table 10.2 gives guidance on acceptable pharmaceutical properties for typical oral drug candidates.
Tactics
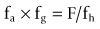
In theory, it is relatively simple to obtain good absorption and to ensure that solubility and permeability fall within the right ranges. However, the reality is more complex. From an in vivo perspective, the product of absorption and intestinal metabolism is often assessed by accounting for first-pass hepatic clearance in bioavailability estimations:
If fa x fg is low, it is important to understand the relative contribution of both fa and fg to F so that this can be designed out of the project. Generally it is simplest to estimate the likely fa and if this does not account for the poor fa x fg value, fg should be investigated. Poor absorption can be a result of slow dissolution rate, low solubility in the GI tract, poor effective permeability (passive or active efflux), or instability in GI fluids or in the wall of the GI tract. If absorption is adequate but bioavailability is poor, hepatic clearance (metabolic or biliary elimination) and/or intestinal metabolism may need to be optimized.
When maximizing the chances of good absorption, the starting point is to ensure that the physicochemical properties of the compound/series are in the optimal space as described by Lipinski and others (Lipinski et al., 1997; Wenlock et al., 2003; Johnson et al., 2009; Waring, 2009). Generally, this requires minimizing the number of H-bond donors and acceptors, restricting lipophilicity in the range LogD7.4 0 to 3, and limiting molecular weight to <500. Both the solubility and passive permeability of a compound should be assessed prior to any in vivo study. Predictive models for these should be assessed for suitability in each project and considered in compound design if either is an issue for a chemical series.
The primary in vitro tool for assessing absorption is the cell based Caco-2 permeability assay, although MDCK-MDR1, PAMPA (parallel artificial membrane permeability assay), or in silico predictions may also provide valuable information about efflux transporter risk and permeability. This permeability assessment, in combination with a solubility measurement (ideally using crystalline material), is used to estimate fa using commercially available modelling tools like GastroPlus (www.simulations-plus.com) or SIMCYP (www.simcyp.com). For actively transported (efflux or uptake) compounds, bi-directional permeability assays can be used as a guide to possible in vivo effects. However, it should be noted that it is often difficult to extrapolate the results from these in vitro transport assays to accurately quantify effects in vivo. Because of its reasonable throughput, the Caco-2 assay can be positioned as an early screen if absorption or permeability/efflux is found to be an issue in the project. If further evaluation of absorption or efflux is warranted, it is possible to use more physiological models such as sections of intestinal tissue in an Ussing Chamber (Ungell et al., 1998), or transfected cell lines over-expressing particular efflux transporters (e.g. P-gp in the MDCK-MDR1 cell line). The Ussing Chamber technique can help in understanding cross-species differences and, because the tissue used is enzymatically competent (metabolic and transporters), the output represents the product of fa and fg.
Compounds with low hepatic clearance in the rat, good solubility and high effective permeability should exhibit good oral absorption and bioavailability in that species. However, if this is not the case, the troubleshooting decision tree in Figure 10.1 can be used to help determine the cause(s) of poor absorption, identify assays to aid in optimizing compound design and understand if the compound is of sufficient quality to progress in the value chain, despite its non-optimal absorption properties.
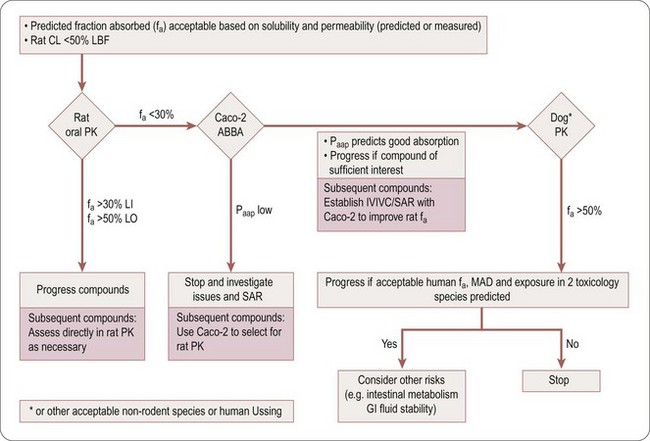
Fig. 10.1 Absorption troubleshooting decision tree. Caco-2 ABBA, transport assays; CL, clearance; fa, fraction of dose absorbed; GI, gastro-intestinal; IVIVC, in vitro to in vivo correlation; LBF, liver blood flow; LI, lead identification; LO, optimization; MAD, maximum absorbable dose; Papp, apparent permeability; SAR, structure–activity relationship.
Table 10.3 is an aid to selecting the assays and techniques to use in the decision tree (Figure 10.1), to explain potential issues and risks, and the parameter (fa, fg and/or fh) the assays impact on.
Table 10.3 Assays and techniques used when troubleshooting absorption
| Assay/technique | Potential issue/risk addressed | Impacted |
|---|---|---|
| Intestinal microsomes or S9 fraction | Assess cross species differences in intestinal metabolism. Nature and source of metabolites can give key information about potential for gut metabolism, as CYP3A and UGTs account for most gut metabolites | fg |
| Absorption profiling on Caco-2 cells | Varying apical to basolateral pH gradient Concentration dependency Use of proteins (e.g. BSA) at various percentages in apical chamber Use of efflux transporter inhibitors |
fa |
| PAMPA | Passive permeability | fa |
| High dose PK studies | Saturation of efflux or metabolism | fa, fg, fh |
| Ussing chamber technique | Effective permeability (including transporters) Intestinal tissue metabolism |
fa, fg |
| GI stability test | Degradation of drug in stomach or intestinal lumen is possible explanation (usually the case if predicted F much greater than measured F) | fa |
| Human metabolic phenotyping | Gut metabolism | fg, fh |
| In situ/in vivo portal vein cannulation preparation | Determine amount of drug and metabolites passing through intestine | fa, fg |
| SIMCYP; GastroPlus | Predict absorption rate and extent (software methods) | fa |
| Transfected cell lines; vesicles expressing specific transporters; Caco-2 efflux assay with and without specific transporter inhibitors | Determine involvement of specific efflux transporters | fa, fh |
| Knock-out (KO) animals; chemical KO with inhibitors | Determine involvement of specific efflux transporters | fa, fg, fh |
Cautions
• As scaling factors for intestinal microsomes or other subcellular intestinal fractions are currently not available, it is difficult to make an accurate quantitative assessment of the contribution of intestinal metabolism to in vivo fa. However, attempts have been made to use CLint from human liver microsomes or S9 fraction to estimate the relative contributions of fa and fg to F (Gertz et al., 2010).
• It is often very difficult to pinpoint why compounds have poor absorption characteristics and, therefore, to resolve this design issue. Thus, it is often reasonable to prioritize series with good fa x fg, in early discovery even if other properties (e.g. potency, clearance) are less attractive.
• Typically, oral doses are formulated as suspensions which, on many occasions, may be derived from amorphous material. However, it is important to assess absorption periodically using crystalline material, as physical form may have substantial effects on absorption profiles.
• Particularly for compounds likely to proceed into development, it is important to determine the effect of the polymorphic solid states on absorption. It is also important to ensure that the formulations used are discussed with Pharmaceutical Development (see Chapter 16), and are appropriate for safety and early clinical development studies.
• If in vitro and in vivo (rat and dog) assessments of fa do not agree, the risk of an inaccurate estimate of absorption in man will increase. Sometimes other species have been investigated to mitigate this risk, but we caution that there can, for example, be marked discrepancies in fa x fg between cynomolgus monkeys and humans (Takahashi et al., 2009).
Avoidance of PK based drug–drug interactions
Introduction
Aid in the design and selection of candidate drugs with a low potential for PK-based drug–drug interactions (DDI) is a key role of discovery DMPK. There are four main forms of PK-based DDI, in which the compound may be a perpetrator or be a victim of DDI:
• Competitive (reversible) cytochrome P450 (CYP) inhibition
• Mechanism based/time dependent CYP inhibition
CYP, notably CYP3A4 and CYP2D6, based DDI is the most important and most common, and may occur in the liver or intestine. Transporter based DDI is mainly related to renal clearance, although specific issues can arise with CNS compounds and hepatic uptake of statins. The science and regulatory guidance to support risk assessment of CYP-based DDI are well established, but is less advanced for transporter-related issues (Bjornsson et al., 2003; US Food and Drug Administration, 1997, 2006; Huang et al., 2008; International Transporter Consortium, 2010).
Tactics
Competitive (reversible) CYP inhibition
Two main types of CYP inhibition assays with different capabilities are in general use. Fluorescence based assays are relatively cheap and have enhanced throughput, but in a small but significant number of cases can lead to misrepresenting DDI risk (Bell et al., 2008). They are best used for initial profiling of large numbers of compounds, with the data being acceptable in the early phase such as lead generation. LCMS based assays are more expensive, have lower throughput, but are more predictive. They should be used in optimization cycles once CYP inhibition issues have been identified, and for generating compound profiles during more advanced project phases.
Inhibition of the five major CYP isoforms 1A2, 2C9, 2C19, 2D6 and 3A4, should be evaluated in the earliest phases, while later it would be prudent to assess potential interactions with isoforms 2B6, 2C8 and 3A5.
Reduction of CYP inhibition potential is facilitated by the fact that strong QSAR relationships are often obtained. Various computational models that allow prediction of CYP DDI risk are available within most drug development companies. It is well established that lipophilicity, aromaticity and charge type are major drivers for inhibiting various CYP enzymes (Gleeson et al., 2007).
The risk of DDIs based on Phase 2 metabolism (e.g. glucuronidation and sulphation) is usually small, resulting in less than a two-fold increase in area under the concentration versus time curve (AUC), and they are rarely observed, possibly due in part to the nature of the enzymatic reaction (high Vmax and moderate to high Km values). Such DDIs are not generally evaluated in lead optimization (Williams et al., 2004). Evidence suggesting the need to do so at this stage should prompt re-evaluation of the risk.
The decision tree in Figure 10.2 can be used to assess the potential DDI risk of a competitive CYP inhibitor. Hits identified in a fluorescence-based assay should be confirmed with an LCMS-based assay using druglike substrates as probes for the different CYP isoforms. Although the ratio Cmax/Ki,u can be used to obtain a preliminary estimate of the DDI risk, more accurate evaluation should be conducted using PBPK modelling (e.g. SIMCYP platform) to predict the potential clinical risk (expanded below in ‘Prediction of DDI risk’ ”).
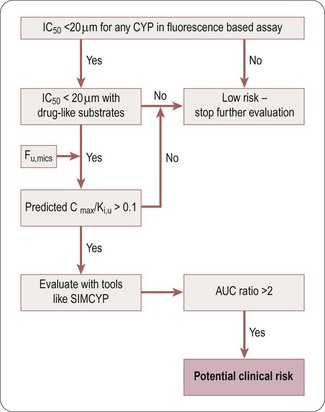
Fig. 10.2 Decision tree for reversible DDI CYP inhibition. AUC, area under the concentration-time curve; Cmax, maximum concentration; CYP, cytochrome P450; DDI, drug-drug interaction; fu,mics, fraction unbound in microsomes); IC50, concentration producing 50% inhibition; Ki,u, unbound dissociation rate constant; SIMCYP, software platform.
Mechanism-based/time-dependent CYP inhibition
The inhibition of CYP enzymes may be irreversible (due to irreversible or covalent binding to the prosthetic haem or the enzyme) or quasi-irreversible (due to the formation of transient complexes with the iron of the haem prosthetic group). Time-dependent inhibition (TDI) methods can be used to determine this (Riley et al., 2007; Fowler and Zhang, 2008). During early phases of drug discovery, a medium throughput screening assay can be used to screen for TDI. However, for selecting candidates at later phases, the method employed should provide accurate determination of Kinact and Ki to properly evaluate the DDI risks of compounds in which preliminary screening indicated the potential for TDI. A positive TDI finding also suggests that the compound or its metabolites may be reactive, and further evaluation should be conducted as specified by reactive metabolite strategies.
A decision tree to help evaluate the potential DDI risk of a TDI CYP inhibitor is shown in Figure 10.3. If a compound is found to be at risk for CYP inhibition (IC50 <20 µM) or is flagged to have a potential liability for reactive metabolites, it should be screened for TDI. If it is found to have potential TDI risk based on screening data, Ki and Kinact values should be generated to help accurately predict the risk using prediction tools like SIMCYP.
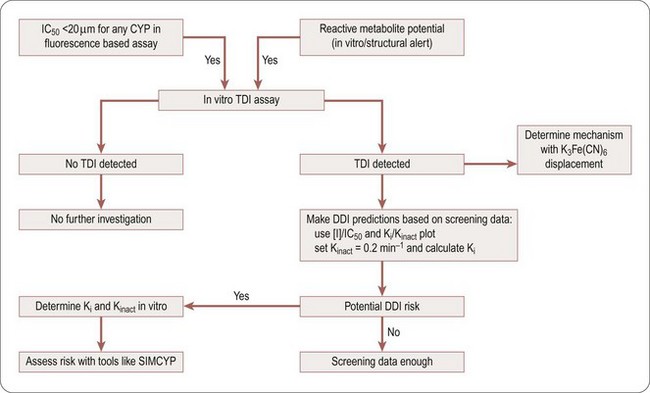
Fig. 10.3 Decision tree to assess time dependent inhibition (TDI) risk. CYP, cytochrome P450; DDI, drug–drug interaction; Ki, dissociation rate constant; Kinact, inactivation rate constant; [I], inhibitor concentration; IC50, concentration producing 50% inhibition; SIMCYP, assay method; TDI, time dependent inhibition.
Uptake and efflux transporter inhibition
Uptake transporter inhibition assays are emerging as being of real value (Ward, 2008), but they are highly dependent on chemotype (e.g. acids being primarily transported by organic anion transporters (OATs)) and likely co-medications (e.g. OCT2 and metformin). Acids and zwitterions should be assessed for inhibition of OATP1B1 during drug discovery. Other inhibition assays (OAT1, OAT3, OATP1B1, OCT1 and OCT2) should be used on a case-by-case basis.
Efflux transporters are believed to serve a protective function, and prevent molecules perceived as foreign from gaining entry in cells or tissues. Of the various efflux transporters, P-glycoprotein (P-gp) is the most prevalent and well understood. As specific locations of the P-gp transporter include small intestine enterocytes, hepatocytes, the kidney and the blood–brain barrier, P-gp can affect oral bioavailability, biliary and renal clearance, and brain uptake of compounds that are substrates of P-gp. In addition, compounds that modulate P-gp can influence the clearance and distribution of drugs that are substrates of P-gp. The bi-directional transport assay using either Caco-2 (P-gp, BCRP, and MRP2) or MDCK-MDRI (specifically for P-gp) cells is widely available. Evaluation of the potential to inhibit P-gp should be evaluated in early discovery using a bi-directional transport assay with a probe P-gp substrate (e.g. digoxin). If a compound is found to be a P-gp inhibitor, its potential impact for P-gp inhibition in the liver or in the gut can be estimated based on its estimated local exposure and the IC50.
Determination of clearance mechanism and CYP phenotyping
The potential for a compound to be a victim of a DDI with a co-medication is greatly reduced if there are multiple clearance mechanisms, particularly involving metabolism by multiple CYP enzymes. This should be a consideration if the therapeutic window is low or if the clinical/marketing disadvantage of the interaction would be significant. Quantitative assessment of multiple clearance mechanisms and phenotyping of CYP metabolism should be established for any candidate drug. Methods for phenotyping the individual CYP enzymes responsible for a drug’s metabolism include the use of (1) specific chemicals or antibodies as specific enzyme inhibitors, (2) individual human recombinant CYPs, and (3) a bank of human liver microsomes characterized for CYP activity prepared from individual donor livers. At nomination of a candidate drug, human phenotyping work should include all eight major CYPs (1A2, 2B6, 2C8, 2C9, 2C19, 2D6, 3A4/3A5), and be followed by other enzymes if necessary. Another way to investigate clearance mechanisms in vitro is a so-called ‘fractional Clint’ assay. In such an assay the rate of parent disappearance is measured in human hepatocytes with and without the presence of an enzyme inhibitor. Most common is the addition of ketoconazole to block out the CYP3A4 contribution to metabolism. The remaining rate of metabolism in such an assay can be attributed non-CYP3A4 pathways like phase 2 enzymes, other CYPs or any other possible mechanism.
CYP induction mediated risk for DDI
Induction of specific CYP enzymes may not only change a drug’s metabolic profile but also have toxicological consequences as CYP enzymes are also involved in the metabolism and synthesis of important endogenous compounds. Although close collaboration with Safety Assessment (see Chapter 15) is needed to evaluate the full impact of CYP induction, it is DMPK’s primary responsibility to predict the DDI potential caused by CYP induction in man. This should be done during optimization with the use of HepaRG cells which are a good surrogate of primary human hepatocytes for AhR-mediated CYP1A induction and PXR- and CAR-mediated CYP3A4 and CYP2B6 induction. If higher throughput is needed during the optimization phase, the PXR reporter gene assay may be used to minimize PXR-dependent CYP3A4 induction liability.
Prediction of DDI risk
Once inhibition (of CYP enzymes and/or transporters) potential has been assessed in vitro, a risk assessment is made by examining the data in relation to the likely clinical exposures. At candidate drug nomination, a thorough evaluation of CYP-based DDI risk (both reversible and irreversible) should be made using PBPK modelling (e.g. SIMCYP platform). PBPK modelling can be used to estimate relevant concentration of inhibitors at the inlet to the liver or in the gut and to assess DDI risks in various patient populations.
During early drug discovery, a simple criterion can be used to determine if CYP inhibition presents little or no risk. For this purpose, an IC50 of >20 µM provides a reasonable cut-off. Should the predicted therapeutic exposures be very low, then a lower cut-off might be rationally adopted.
To assess CYP induction potential, the Emax and EC50 obtained from human hepatocytes (e.g. HepaRG cells) induction assays, can be used in conjunction with predicted human exposure (free Cmax or free liver inlet concentration) to calculate a relative induction score. This is then compared against the relative induction scores of known inducers to estimate the percent human AUC change.
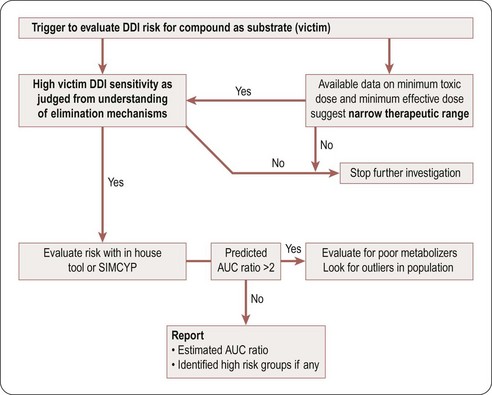
A compound is likely to be a victim of clinically relevant DDI with a co-medication if it has a narrow therapeutic window and is a sensitive substrate to an inhibited enzyme/transporter, as indicated by high values of fraction metabolized (fm), fraction of CYP metabolized (fm,CYP), and fraction unbound (fu), and by plasma and hepatic extraction. This risk can be reduced by ensuring that the clearance mechanism in question represents <50% of total clearance (resulting in less than a two-fold change in the AUC of the victim compound). At candidate drug nomination, software tools such as SIMCYP could be used to evaluate the impact of known inhibitors or inducers on the relevant candidate compounds if their clearance is driven mainly by a single enzyme or transporter. Figure 10.4 is a decision tree to help in assessing the potential risk that a compound will be a DDI victim. A compound is deemed to have this potential risk if it has a narrow therapeutic window or is cleared predominantly by a single CYP enzyme. A simple Excel based DDI template or SIMCYP should be used to estimate the risk. If the CYP enzyme involved is polymorphic, evaluate the impact of polymorphism to identify high-risk populations.
Cautions
• Software tools such as SIMCYP can be used to estimate the potential and magnitude of DDI, particularly in populations at most risk. DDI risk is currently best assessed by relating IC50 to free drug concentrations at the sites of action (liver or gut). However, because of the current regulatory position, it may be necessary to conduct clinical studies where the perceived risk is based on total drug concentrations.
• CYP based DDI due to CYP3A4 inhibition may have an impact on the bioavailability of co-medications through inhibition of intestinal CYP3A4. Although the area is complex, SIMCYP has the capability of assessing likely clinical impact.
• Animal studies are of little value for assessing CYP DDI risk. However, they may be of use in developing an understanding of potential transporter mediated DDI.
Central nervous system uptake
Introduction
The brain is a protected organ, being separated from the systemic circulation by three barriers: the blood–brain barrier formed primarily by cerebrovascular endothelial cells between the blood and brain tissue, the choroid plexus epithelium between the blood and ventricular cerebrospinal fluid (CSF), and the arachnoid epithelium between the blood and subarachnoid CSF. These barriers, which exhibit low paracellular permeability and express multiple drug transporters, restrict the entry of compounds with either very low transcellular (passive) permeability and/or, more importantly, compounds with high affinity for efflux transporters.
The quantitation of CNS exposure is necessary for both CNS and peripherally targeted (i.e. that require restriction from the CNS) therapies as a means to estimate the unbound brain concentration required for efficacy and CNS-mediated side effects. Unless other information is available, the unbound concentration is assumed to be the relevant exposure measure for both desired and undesired pharmacological effects. The reason for this is that measurement of total concentration can be very misleading, being to a large extent driven by non-specific binding to brain tissue and thus strongly correlated with physicochemical properties (e.g. lipophilicity and charge). The tactics below therefore focus on assessing unbound concentration in the brain relative to the free concentration in blood or plasma.
Tactics
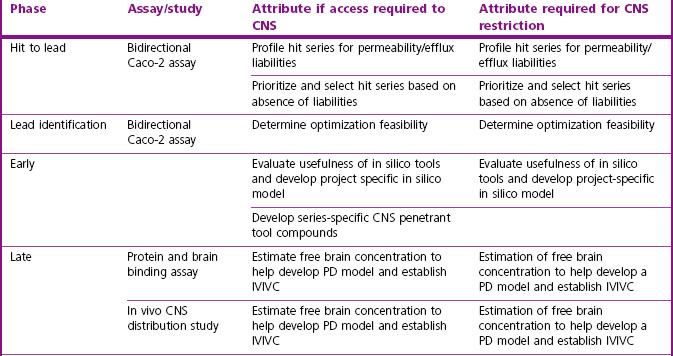
Screening cascades for both CNS targeted and CNS-restricted compounds should contain an efflux/permeability assay (Di et al., 2008). MDCK-MDR1 or Caco-2 cells may be used (Table 10.2) and MDCK-MDR1 may offer better sensitivity for P-gp substrates, while Caco-2 cells, which are a constitutive system, have the advantage of identifying substrates of several efflux mechanisms not necessarily limited to P-gp.
Peripheral restriction can be obtained either by efflux or very low passive permeability. The latter is often difficult to combine with oral pharmacological activity, as it requires extreme physical properties (e.g. very low/negative LogP).
Efflux ratios obtained in vitro should be used for risk assessment in the early phases and once validated in vivo, can be used for progression of compounds through the screening cascade. The ratio may be optimized using in silico models (Fridén et al., 2009b) or simple rule sets. Roughly, P-gp substrates can be estimated by the ‘rule of fours’ (Didziapetris et al., 2003), where compounds with a sum of nitrogen and oxygen atoms ≥8, molecular weight >400 and acid pKa >4 are likely to be P-gp substrates, whereas compounds with a sum of nitrogen and oxygen atoms ≤4, molecular weight <400 and base pKa <8 are likely to be non-substrates. Additionally, it has been suggested that LogP should be >2 to allow for sufficient passive permeability, i.e. lower sensitivity to efflux (Hitchcock and Pennington, 2006).
Commencing during lead generation, it is important to establish an in vitro/in vivo correlation using in vivo experiments to determine the ratio Cu,br/Cu,pl (Table 10.4). The fraction unbound in brain may be determined ex vivo using brain binding assays such as the brain homogenate or brain slice (Fridén et al., 2009a; Wan et al., 2007) methods and, together with determined total brain concentration in vivo, enables the calculation of Cu,br.
Table 10.4 Assay and CNS measurement attributes at various milestones for compounds requiring CNS access or restriction

Initial brain distribution studies may be performed with single compounds or cassettes using subcutaneous or oral administration, preferably at steady state or with more than one time point. Samples generated in pharmacodynamic models may also be used. In late stages, longer intravenous infusion studies may be used to generate a ratio closer to steady state.
Failure to establish in vitro/in vivo correlations may provide a trigger for investigations using:
• In vitro/in vivo interaction studies with inhibitors
• CNS distribution studies in alternative species to gain an understanding of differences in transporter expression/specificity
• In vitro studies (e.g. alternate cell lines) with over-expression of animal transporters or additional human transporters
In vivo intracerebral microdialysis may be useful for indications where the rate of CNS distribution is critical, and for simultaneous studies of biomarkers/effect and CNS compound levels. Because this method enables direct and repeated measurement of extracellular fluid, it is possible to determine both the rate and extent of CNS penetration. The utility of the technique is limited by the physicochemical properties of the compounds studied.
Although the concentration in CSF may differ from that in extracellular fluid, sampling of CSF in animals could be used since it may offer translatability of CNS distribution in man. In addition, associations between in vitro potency and unbound plasma EC50s of robust PD endpoints such as receptor occupancy should be made, to confirm CNS distribution.
Cautions
• It is important to note that a relevant brain to plasma ratio will only be generated at steady state like conditions, so the Cu,br/Cu,pl may be very different in steady state and non-steady state conditions. For CNS acting compounds, it is therefore critical not only to appreciate any acute/steady state differences in CNS distribution, but also to consider the steady state CNS distribution kinetics at pharmacodynamic endpoints using human dose estimates. For peripheral targets where CNS restriction is important, high Cu,br/Cu,pl ratios may be unacceptable.
• There are indications that levels in CSF overestimate free levels in brain, especially for efflux substrates (Fridén et al., 2009b), although the latter has been challenged (Doran et al., 2005). The translatability of CSF concentrations from animal to human is also somewhat limited because CSF samples in animals are usually collected from the cisterna magna (proximal part of CSF) while those in man are collected from the more distal lumbar region. Very few data are available regarding the distribution of compounds within CSF.
• It may be difficult to assess free levels of acidic compounds in CNS with standard methodologies (Fridén et al., 2010), because the high plasma protein binding and low tissue binding of such compounds result in inaccurate data due to blood contamination of the brain tissue. The brain homogenate binding method has limited use for drugs that reside predominantly in the interstitial space or compounds that are accumulated intracellularly. In such cases, the brain slice method may provide a better alternative.
Clearance optimization
Introduction
Optimization of clearance is one of the major challenges in drug discovery because clearance must be suitably low in order to achieve an appropriate half-life and bioavailability, and therefore dose, in man. However, human clearance cannot be optimized directly because it is never measured preclinically, which presents two key challenges. Firstly, there is the need to identify the key elimination processes that determine clearance, and secondly, those processes must be optimized through appropriate use of human in vitro systems and/or animal data.
Identification of the likely key clearance mechanism(s) in man is supported by a detailed understanding of elimination kinetics in animals and demonstration of the ability of human in vitro tools to predict hepatic clearance in man. This puts emphasis on animal kinetics in all phases of drug discovery to select the appropriate tools and models for both compound optimization and human PK prediction.
There are advantages in having elimination via multiple clearance mechanisms, notably for mitigation of DDI risks. This extends to metabolism by multiple enzymes, which helps mitigate against significant metabolism (>70%) by highly variable enzyme activities in a population (i.e. CYP3A4 – see Rawden et al., 2005) and against polymorphic enzyme metabolism (e.g. CYP2D6 – see Zhou, 2009a, 2009b, and CYP2C19 – see Damle et al., 2009). The severity of variability of human PK depends on therapeutic area and on margins to side effects.
Tactics for optimizing clearance are highly dependent on the nature of the clearance mechanism, as outlined below in sections dealing with metabolic, renal and biliary clearance, respectively.
Optimization of metabolic clearance
Introduction
Optimizing metabolic clearance is one of the most common and challenging activities in drug discovery projects, because high metabolic clearance can be associated with various metabolic pathways. These include CYP mediated (NADPH dependent) oxidation or reduction in the liver and, to a lesser extent, in other organs such as the small intestine (Galetin et al., 2008). In addition, FMOs (Cashman, 2008) and MAO can be involved in oxidative metabolism (Bortolato et al., 2008). High metabolic clearance can also be associated with direct or phase 2 conjugation via UGTs, sulphotransferases, or glutathione-S-transferases (Jana and Mandlekar, 2009). Although less common, whole blood and tissue amidases, esterases, various amine oxidases (diamine oxidase, semi-carbazine sensitive amine oxidase), adenosine deaminase, and alcohol and aldehyde dehydrogenase may come into play, depending on the chemotype in question (Cossum, 1988). During project work, metabolic clearance can be efficiently screened with available front-line metabolic tools (i.e. microsomes and hepatocytes). Differential results between microsomes and hepatocytes can highlight the involvement of phase 2 processes or the involvement of uptake transporters (Soars et al., 2009). Whole blood and/or plasma stability can easily be screened where appropriate when the chemotype dictates.
High metabolic clearance is known to be associated with physicochemical properties of molecules such as a high LogD7.4 (i.e. LogD7.4 values >2.5), where lipophilicity can correlate with metabolic liability (Van de Waterbeemd et al., 2001).
Failure to clarify and control metabolic clearance is a major issue in discovery because it can:
Tactics
In order to optimize metabolic clearance it is essential to understand the enzymatic source of the instability and to exclude other clearance mechanisms. It is also necessary to have an in vivo assessment of clearance in selected compounds to establish that the in vitro system is predictive of the in vivo metabolic clearance.
Addressing high rates of metabolism requires an understanding of metabolic soft spots and their impact on clearance. For instance, reductions of electron density or removal of metabolically labile functional groups are successful strategies to reduce CYP-related clearance. Knowing where in the structure catalysis takes place also gives information about how the compound is oriented in the active site of a CYP. As a result, the site of metabolism could be blocked for catalysis, or other parts of the molecule could be modified to reduce the affinity between the substrate and CYPs. Such knowledge should, therefore, be used to assist in the rational design of novel compounds.
For more lipophilic compound series, CYP3A4 is usually the CYP responsible for most of the metabolism. The rate of such metabolism is sometimes difficult to reduce with specific modifications of soft spots. Commonly, the overall lipophilicity of the molecules needs to be modified. Once a project has established a means to predict lipophilicity and pKa, correlations with clearance measurements in microsomes or hepatocytes can be established, and in turn, used in early screening phases to improve metabolic stability and to influence chemical design.
Screening of compounds in rat or human microsomes or hepatocytes is an effective way to determine improvements in metabolic clearance. Once alternative clearance mechanisms have been ruled out, total body clearance greater than hepatic blood flow may indicate an extrahepatic metabolic clearance mechanism. While not always warranted, this can be investigated with a simple plasma or blood stability assay if the offending chemotype contains esters, amide linkages, aldehydes or ketones.
Softwares that predict sites of metabolism can be used to guide experiments to identify potential labile sites on molecules. In addition, structure-based design has taken a major step forward in recent years with the crystallization and subsequent elucidation of major CYP isoform structures. In silico methods based on molecular docking can facilitate an understanding of metabolic interactions with CYP’s 3A4, 2D6 and 2C9. Although most of the tools, software and modelling expertise to perform structure-based design reside within computational chemistry, there is an increasing role for DMPK personnel in this process. Sun and Scott (2010) provide a review of the ‘state of the art’ in structure-based design to modify clearance.
Cautions
In theory, scaling to in vivo from metabolic stability in vitro, should in most cases underpredict clearance since almost always other mechanisms, more or less, contribute to overall clearance in vivo. Where common in vitro models (e.g. hepatocytes) significantly underestimate in vivo hepatic clearance and where the chemotype is either a carboxylic acid or a low LogD7.4 base, poor scaling may be due to the compound being a substrate for hepatic uptake transporters (e.g. OATPs) which can significantly influence clearance. In such instances, a hepatic uptake experiment may prove useful to predict in vivo clearance (see Soars et al., 2007 for methodologies). In other instances, carbonyl-containing compounds metabolized by carbonyl reductases in microsomes have been shown to significantly underestimate clearance when in vitro reactions are driven by direct addition of NADPH, versus the addition of an NADPH regenerating system (Mazur et al., 2009).
Reductions in in vivo clearance may not be due to increased metabolic stability, but driven by increased plasma protein binding. Either may be used to reduce plasma clearance, but the implications of both need to be appreciated.
Optimization of renal clearance
Introduction
Renal clearance is most commonly a feature of polar, low LogD7.4 (<~1) compounds due to their low plasma protein binding, lack of passive permeability (and inability to facilitate re-absorption in the distal tubule), and the high expression in the kidney of a number of transporter proteins (e.g. OATs and OCTs). Passively cleared compounds are generally well predicted from animal data because CLr = GFR × fu (where CLr is renal clearance, GFR glomerular filtration rate, fu the fraction unbound). Hence, simple, related, allometric relationships can be readily established.
By introducing the potential for large interspecies differences, transporters significantly complicate the issue, making prediction of renal clearance in man more difficult. While there are in vitro assays for animal and human transporters (e.g. OATs) that can generate useful QSAR information; their utility for human PK prediction is yet to be fully established.
Tactics
Reducing renal clearance in order to reduce total body clearance is generally achieved by increasing lipophilicity through modulation of LogP or pKa. All data are amenable to QSAR analysis, and particularly those from cell lines expressing individual transporter proteins.
Based on a few descriptors, a relatively simple diagram (Figure 10.5) can be used to classify drugs as having high (>1 mL/min/kg), medium (>0.1 to <1 mL/min/kg) or low (≤0.1 mL/min/kg) renal clearance (Paine et al., 2010).
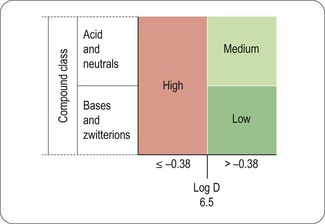
Fig. 10.5 Simple diagram to classify compounds for risk of renal clearance. Low renal clearance is defined as ≤ 0.1 mL/min/kg, moderate as >0.1 to <1 mL/min/kg, and high as 1> mL/min/kg
For acids and zwitterions, early determination of renal clearance in rat and dog is recommended as part of establishing the primary clearance mechanism of a compound. Once these data are available two possible scenarios exist: firstly, a simple allometric relationship can be used to predict human renal clearance or secondly, if such a relationship is not apparent, this prediction should be based on fu and renal blood flow corrected dog data. On balance, there are enough examples to suggest that for acids and zwitterions, human renal clearance is best predicted from the dog (McGinnity et al., 2007).
Optimization of biliary clearance
Introduction
The biliary clearance of compounds involves active secretion from hepatocytes by ATP-dependent transporter proteins (primarily P-gp, MRP2 and BCRP) into the biliary canaliculus, and drainage into the small intestine. It is commonly a feature of acidic and zwitterionic compounds and can be very efficient, resulting in hepatic blood flow limited clearances. This efficiency is partly a consequence of many biliary transporter substrates also being substrates of sinusoidal uptake transporters (e.g. OATPs).
Tactics
Regardless of the compound, no specific investigation of biliary clearance is recommended if total clearance is well predicted from in vitro metabolic systems, although bile collected for other reasons can be used to confirm that biliary clearance is low.
In an extensive evaluation of biliary clearance, Yang et al. (2009) showed molecular weight to be a good predictor of biliary clearance in anionic (but not cationic or neutral) compounds, with a threshold of 400 Da in rat and 475 Da in man.
If total clearance is not well predicted from in vitro metabolic systems, a biliary elimination study in the rat should be considered. High biliary clearance in the rat presents a significant hurdle to a discovery project, as much of time and resource can be spent establishing SARs in the rat, and in considering likely extrapolations to the dog and man. High biliary clearance is considered a major defect in high clearance chemotypes at candidate drug nomination. Tactics for resolving biliary clearance include the following:
• Consider molecular weight and ionic charge as determinants of biliary CL
• Track progress in rat and dog using intravenous PK studies without bile collection
• Make use of in vitro hepatic uptake or uptake transporter models
• If rat and dog provide ambiguous data, an intravenous PK study in another non-rodent species (possibly a non-human primate) may help establish a higher species trend
• Consider assessing efflux in sandwiched cultured rat and human hepatocytes. An emerging body of literature supports this approach, although quantification is challenging (Li et al., 2009).
Cautions
Vesicle-based efflux transporter systems are available, but they are not usually of use in detecting/monitoring substrates. Vesicle-based transporter assays have greater utility in screening of inhibition potential (Yamazaki et al., 1996).
Biliary secretion does not necessarily result in the elimination of compounds from the body, as there is the potential for re-absorption from the GI tract, which can lead to overestimation of Vss.
Role of metabolite identification studies in optimization
Introduction
Knowledge of the metabolites formed from a compound/compound series is often highly beneficial or even essential during drug discovery, because knowing the sites of metabolism facilitates rational optimization of clearance and aids in understanding DDI, particularly time-dependent DDI. As these issues are considered elsewhere (sections on clearance optimization and avoidance of PK-based drug–drug interactions), they are not discussed further here. However, two other major areas of drug discovery which are dependent on metabolite identification and on understanding metabolite properties are considered below:
Active metabolites
Introduction
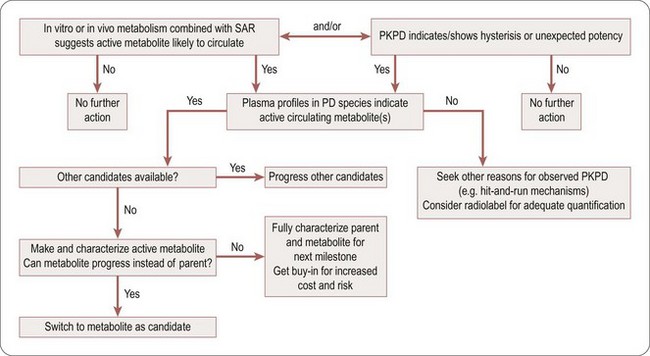
Active metabolites can influence PD and influence PKPD relationships (Gabrielsson and Green, 2009), one example being their major effect on the action of many statins (Garcia et al., 2003). Knowledge about the SAR for potency should be kept in mind during drug optimization when evaluating pathways of biotransformation. Active metabolites with equal or better potency, more favourable distribution and/or longer half-lives than the parent can have profound effects on PKPD relationships. Time–response studies will indicate the presence of such metabolites provided an appropriate PD model is available. Failure to discover the influence of such metabolites may lead to erroneous dose predictions. Assuming similar potency, metabolites with shorter half-lives than the parent will have more limited effects on dose predictions and are difficult to reveal by PKPD modelling. The presence of circulating active metabolites of candidate drugs can be beneficial for the properties of a candidate, but also adds significant risk, complexity and cost in development.
Prodrugs are special cases where an inactive compound is designed in such a way as to give rise to pharmacologically active metabolite(s) with suitable properties (Smith, 2007). The rationale for attempting to design oral prodrugs is usually that the active molecule is not sufficiently soluble and/or permeable. Remarkably successful prodrugs include omeprazole, which requires only a chemical conversion to activate the molecule (Lindberg et al., 1986), and clopidogrel (Testa, 2009) which is activated through CYP3A4. Both omeprazole and clopidogrel became the world’s highest selling drugs.
Tactics
In vitro metabolite identification studies, combined with the SAR, may suggest the presence of an active metabolite. Studies of plasma metabolite profiles from PKPD animals may support their hypothesized presence and relevance. Disconnect between the parent compound’s plasma profile and its PD in PKPD studies may be a trigger for in vitro metabolite identification studies.
If active metabolites cannot be avoided during compound optimization, or are considered beneficial for efficacy, their ADME properties should be determined. Advancing the metabolite rather than the parent compound is an option to be considered.
The decision tree in Figure 10.6 highlights ways to become alerted to the potential presence of active metabolites, and suitable actions to take.
Cautions
Using preclinical data to predict exposure to an active metabolite in man is usually accompanied by considerable uncertainty (Anderson et al., 2009). Plasma and tissue concentrations of metabolites in man are dependent on a number of factors. Species differences in formation, distribution and elimination need to be included in any assessment.
Minimizing risk for reactive metabolites during drug discovery
Introduction
Many xenobiotics are converted by drug metabolizing enzymes to chemically reactive metabolites which may react with cellular macromolecules. The interactions may be non-covalent (e.g. redox processes) or covalent, and can result in organ toxicity (liver being the most common organ affected), various immune mediated hypersensitivity reactions, mutagenesis and tumour formation. Mutagenesis and carcinogenesis arise as a consequence of DNA damage, while other adverse events are linked to chemical modification of proteins and in some instances lipids. Avoiding, as far as possible, chemistry giving rise to such reactive metabolites is, therefore, a key part of optimization in drug discovery.
Tactics
Minimizing the reactive metabolite liability in drug discovery is based on integrating DMPK and safety screening into the design-make-test-analyse process. A number of tools are available to assist projects in this work (Thompson, et al., 2011 submitted to Chem-Biol Interact, and references therein):
• Search tools/databases: this includes in silico tools to (1) identify substructures associated with potential reactive metabolite formation, (2) identify potential bacterial mutagenicity, and (3) learn how to avoid/design away from reactive metabolite formation.
• Trapping studies in human liver microsomes to enable the detection of reactive metabolites. Agents used to trap unstable reactive intermediates are glutathione (for soft electrophiles) and radiolabelled potassium cyanide (K14CN) (for iminium ions) as first-line assays. Structural information can be obtained from further analysis of GSH and CN adduct mass spectrometry data. For very reactive aldehydes, i.e. α,β-unsaturated aldehyde, methoxylamine can be used as trapping reagent.
• Metabolite identification in human liver microsomes or hepatocytes. Interpretation of the metabolite patterns may give information about existence of putative short-lived intermediates preceding the observed stable metabolites (e.g. dihydrodiols are likely to be result of hydration of epoxides).
• Time-dependent inhibition (TDI) studies in human liver microsomes to flag the likelihood of a mechanism based inhibitor (mainly inhibition of CYPs).
• Formation and degradation of acyl glucuronides from carboxylic acids in activated human liver microsomes. This gives an overall estimate of the acylating capability of acyl glucuronides.
If it proves difficult or not possible to optimize away from reactive metabolite signals using the screen assays listed above, yet compounds in the series for other reasons are regarded as sufficiently promising, then a reactive metabolite risk assessment will have to be undertaken. Such assessment includes covalent binding to human hepatocytes in vitro and/or to rat in vivo. Predicted dose to man and fraction of the dose being predicted to be metabolized over the reactive metabolite pathway will have to be taken into account. Other experimental systems which might be used for assaying metabolite-mediated cytotoxicity are cell systems devoid of, or overexpressing, various CYPs. Details of such an assessment are beyond the scope of this review but are discussed by Thompson et al., 2011 (Chem-Biol Interact, submitted).
Caution
Although reactive metabolites, beyond reasonable doubt, constitute a risk worthwhile to screen away from, the underlying science of potential toxicity is complex; e.g. overall covalent binding to proteins is a crude measure indeed. It is likely covalent binding to some proteins might give rise to antigenic conjugates, while binding to other proteins will be quite harmless. Formation of glutathione adducts as such is not alarming, particularly when catalysed by glutathione transferases. The relevance of trapping with an unphysiological agent like cyanide could be even more challenged. Simply quantifying covalent binding in vivo or in vitro may be misleading, but since the science of estimating risks associated with different patterns of binding is still in its infancy, there is little choice.
Despite these and other fundamental shortcomings in the reactive metabolite science, most pharmaceutical companies invest significant resources into screening away from chemistry giving rise to such molecular species. Taking a compound with such liabilities into man will require complex, and probably even more costly and time-consuming risk assessment efforts.
Human PK and dose prediction
The overriding goal of in silico, in vitro, and in vivo DMPK methods conducted at all stages of drug discovery is to help design and select compounds with acceptable human pharmacokinetics. Hence the prediction of human PK is an important component of modern drug discovery and is employed throughout the drug discovery process. In the early stages, it is used to estimate how far project chemistry is from its target profile and to identify the most critical parameters for optimization. At candidate selection, accurate PK and dose prediction is required to determine not only whether the drug candidate meets the target profile but also to estimate safety margins, compound requirements for early development phases and potential DDI risk.
The prediction of human PK involves two distinct stages – firstly, the estimation of individual kinetic parameters, and secondly, the integration of these processes into a model to simulate a concentration-time profile (see Figure 10.7).

To predict the human PK profile following oral administration, the following fundamental PK parameters must be determined: (a) absorption rate (ka) and bioavailability (F), (b) volume of distribution (Vss), and (c) clearance (CL, total, hepatic, renal and other routes). Methods used to predict individual PK parameters can be classified into two approaches: empirical or mechanistic. Mechanistic methods are based on knowledge of the underlying mechanisms or processes that define the PK parameters while empirical methods rely on little or no a priori knowledge. Data required for these methods can be in silico, in vitro, or in vivo data and in general, methods that integrate and use both in vitro and in vivo data. PBPK (physiologically based pharmacokinetic) models utilising measured parameters (in vivo or in vitro) tend to be more accurate than methods that rely on in silico predictions.
Prediction of absorption rate and oral bioavailability
Although frequently ignored in scaling, accurate prediction of oral absorption rates (ka) is required to predict Cmax and to project the potential for drug–drug interactions. Oral absorption rate is heavily dependent on the final physical form of the compound and the prediction of this parameter in the early phase of discovery may be of limited value. ka can be scaled empirically using ka values determined from preclinical species. ka values are usually obtained from rat or dog, i.v. and p.o. PK studies via de-convolution analysis. Oral absorption determined in the rat was usually found to be in good agreement to that in human. However, in the dog, oral absorption rates for hydrophilic compounds were usually much faster than in human (Chiou et al., 2000a). Hence, if there is discrepancy in the absorption rate between the two species, the value from the rat should be used for the prediction.
ka can also be predicted mechanistically using various variations of a physiologically based transit model originally developed by Amidon et al. (Yu and Amidon, 1999). The model is termed compartment absorption and transit (CAT) model and characterizes the fraction of compound absorbed per unit time (based on its dissolution rate, pH solubility profile, effective permeability, intestinal metabolism and efflux, etc.) as the compound moves through the different compartments of the GI tract. This approach is used in a number of commercially available tools such as GastroPlus and SIMCYP and can be used to estimate fraction of the dose absorbed and (fa), and the fraction escaping intestinal metabolism (fg), in addition to ka.
As mentioned earlier in the optimizing oral bioavailability section, oral bioavailability is a composite product of (fa), (fg) and hepatic ‘first-pass’ extraction (fh). Hepatic extraction is a function of hepatic clearance and hepatic blood flow and can be estimated using the following equation:
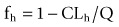
where CLh is the hepatic clearance and Q is the hepatic blood flow.
Prediction of clearance
Clearance is a primary pharmacokinetic parameter that is used to characterize drug disposition. Total or systemic clearance, the sum of all individual organ clearance responsible for overall elimination of a drug, can be predicted empirically using allometry. Allometric scaling is based on the empirical observations that organ sizes and physiological processes in the mammalian body are proportional to body weight by the following equation:

where Y is the parameter of interest, W the body weight, and a and b are the coefficient and exponent of the allometric equation, respectively. For rates, flows and clearance processes, the exponent should be 0.75. If the calculated exponent deviates significantly from the above, the prediction may not be accurate (Mahmood, 2007).
For individual organ clearance, allometry is useful for flow-dependent clearance processes, e.g. renal and high hepatic CL. However, for low CL compounds that exhibit large species differences in metabolism, hepatic clearance and hence total clearance cannot be reliably predicted by allometry. Hepatic clearance can be mechanistically scaled using an in vitro and in vivo correlation (IVIVC) approach. With this approach, intrinsic in vitro clearance is measured using in vitro metabolic stability assays (microsomes or hepatocytes). The measured in vitro clearance values are scaled to clearance by the whole liver and then converted to an hepatic clearance using a liver model that incorporates blood flow (a well-stirred model most often used). If IVIVC predicts clearance in animal species, it is likely that the method is applicable for human predictions. Historically, the method for predicting intrinsic hepatic metabolic clearance does so to within a factor of 3, unless confounded by transporter or other mechanistic effects that are not incorporated in the modelling. For any chemical series, a key component of gaining confidence in the use of IVIVC to predict human clearance comes from establishing the ability of analogous tools to predict metabolic clearance in the rat and dog. It is important to establish such relationships and this requires an accurate estimation of the metabolic, and other clearance mechanisms in each species, as well as prediction of all significant clearance mechanisms in man.
Prediction of volume of distribution
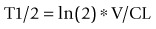
Volume of distribution (V) is a primary PK parameter that relates drug concentration measured in plasma or blood to the amount of drug in the body and is used to characterize drug distribution. It is a key parameter as it is a primary determinant (together with clearance) of drug half-life. Higher volume compounds will have longer half-lives. In a simple system:
Volume of distribution is a measure of the relative affinity of the compound for plasma/blood constituents and tissue constituents. In general, for moderately lipophilic compounds, acids have a high affinity for albumin and, therefore, have a low volume of distribution (0.1–0.5 L/kg), based have a high affinity for tissues and, therefore, have high volumes (>3 L/kg), while neutral compounds have volumes around 1 L/kg. Correcting V for plasma protein binding yields a very useful parameter ‘unbound volume’:

Unbound volume is a measure of the average tissue affinity of a compound, but more importantly should be relatively constant across species. If this consistency is observed in preclinical species, human predictions are relatively straightforward, and a sound basis for the use of more sophisticated tools (e.g. physiologically based (PBPK) models, see below) to predict complex distribution profiles is established.
In PBPK modelling, the body is portrayed as a series of compartments that represent tissues and organs. The compartments are arranged to reflect anatomical layout and are connected by arterial and venous pathways. Each tissue (i) has an associated blood flow rate (Q), volume (Vt) and a tissue partition coefficient (Kp) and the rate of change of the drug in each tissue is mathematically described by a differential equation.
The total volume of distribution is the sum of the volume of distribution of all the organs. The volume of distribution in each organ is simply the actual volume of the organ multiplied by its corresponding tissue distribution coefficient (Kp). Kp can be determined experimentally in animals for each organ; however, this is very resource intensive and impractical. There are two approaches for estimating Kp in various organs. In silico estimation of Kp can be done using various tissue composition methods. This is the approach used in commercial software packages such as GastroPlus and SIMCYP. The other approach was developed by Arundel (1997) using rat Vss data and is based on the observation that Kps are constant for a given Vss and that they can be predicted from Vss (Arundel, 1997). With the tissue composition methods, partitions to various components in the tissue (neutral lipid, acidic phospholipids, lipoproteins, tissue albumin) are estimated by logD and pKa of the compound (Poulin and Theil, 2000; Rodgers et al., 2005; Rodgers and Rowland, 2006). A key assumption is that unbound tissue Kps are constant across species. This underpins the assumption described above, that the unbound volume of distribution is constant across species.
Prediction of plasma concentration time profile
To accurately estimate Cmax and Cmin, which are important exposure parameters for assessing safety and efficacy, the plasma concentration-time profile has to be accurately predicted.
For compounds displaying mono-exponential decreases in plasma concentrations over time, the concentration-time profile in man can be predicted using the following equation:

where C is the concentration at time t, F is bioavailability, D is the dose, ka is the absorption rate, CL is the clearance, and V is the volume of distribution.
For compound showing biphasic or multi-exponential concentration time profile in animals, PBPK modelling is the recommended approach to simulate the profile in man.
Prediction of human efficacious dose
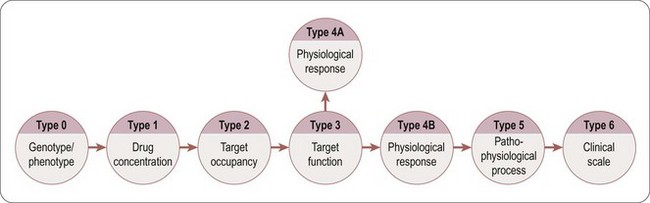
Estimation of the likely therapeutic dose and dosing frequency in patients, requires not only the prediction of the human pharmacokinetics, but also a robust understanding of the concentration-time-response relationship. The quality of the prediction depends on how well the PD effect scales from animals to man and the linkage between the effect and the clinical outcome. The linkage between the effect and the clinical outcome is based on a series of translational biomarkers. The different types of biomarkers are classified (Figure 10.8, adapted from Danhof et al., 2005). The classification is based on the mechanism of drug action and the relationship to the disease process. In general, the closer the relationship of the biomarker is to the disease process, the more relevant and predictive is the biomarker.
Summary
To be a successful drug candidate, a compound, in addition to having good efficacy and safety profile, has to have acceptable DMPK properties. This chapter highlights the roles of DMPK in drug discovery and provides strategies to resolve key DMPK challenges such as improving oral bioavailability, optimizing clearance, avoiding drug–drug interaction, achieving or avoiding CNS exposure, and avoiding risks from metabolites. In addition, approaches used to scale individual PK parameters and strategy to integrate these parameters to predict human pharmacokinetics and dose are discussed in the chapter. The proposed strategy is based on best practices within AstraZeneca as well as current science, technology and understanding of DMPK. It is our hope that the proposed integrated strategy, which focus DMPK efforts toward the optimization and prediction of DMPK properties in human will provide a sound basis to efficiently progress drug discovery projects.
Acknowledgments
The authors wish to thank Lovisa Afzelius, Tommy B. Andersson, Madeleine Antonsson, Ulf Bredberg, Anne Cooper, Doug Ferguson, C. Edwin Garner, Ken Grime, Anshul Gupta, Lena Gustavsson, Ramon Hendrickx, Suzanne Iversson, Owen Jones, Etienne Lessard, Stefan Lundquist, Yan Li, Nektaria Markoglou, Jan Neelisen, Ken Page, Stuart Paine, Jan Paulson, Denis Projean, Maria Ribadeneira, Caroline Rivard, Ralf Schmidt, Patricia Schroeder, Anna-Karin Sternbeck, Per Strandberg, Richard Thompson, Anna-Lena Ungell, and Lucas Utley for their inputs to the strategy.
Arundel P. A multi-compartment model generally applicable to physiologically based pharmacokinetics. 3rd IFAC Symposium: modelling and control in biological systems. Warwick, UK, March 23rd–26th. 1997.
Amidon GL, Lennernas H, Shah VP, et al. A theoretical basis for a biopharmaceutic drug classification: the correlation of in vitro drug product dissolution and in vivo bioavailability. Pharmacology Research. 1995;12:413–420.
Anderson S, Luffer-Atlas D, Knadle MP. Predicting circulating human metabolites: how good are we? Chemical Research Toxicology. 2009;22:243–256.
Bell L, Bickford S, Nguyen PH, et al. Evaluation of fluorescence- and mass spectrometry-based CYP inhibition assays for use in drug discovery. Journal of Biomolecular Screening. 2008;13(5):343–353.
Bjornsson T, Callaghan J, Einolf JH, et al. The conduct of in vitro and in vivo drug-drug interaction studies: a PhRMA perspective. Journal of Clinical Pharmacology. 2003;43:443–469.
Bortolato M, Chen K, Shih JC. Monoamine oxidase inactivation: from pathophysiology to therapeutics. Adverse Drug Delivery Review. 2008;60:1527–1533.
Cashman JR. Role of flavin-containing monooxygenase in drug development. Expert Opinion on Drug Metabolism and Toxicology. 2008;4:1507–1521.
Chiou WL, Ma C, Chung SM, et al. Similarity in the linear and non-linear oral absorption of drugs between human and rat. International Journal of Clinical Pharmacolology Therapy. 2000;38:532–539.
Chiou W, Jeong Y, Chung S, et al. Evaluation of dog as an animal model to study the fraction of oral dose absorbed for 43 drugs in humans. Pharmacology Research. 2000;17:135–140.
Cossum PA. Role of the red blood cell in drug metabolism. Biopharmaceutics and Drug Disposition. 1988;9:321–336.
Damle BD, Uderman H, Biswas P, et al. Influence of CYP2C19 polymorphism on the pharmacokinetics of nelfinavir and its active metabolite. British Journal of Clinical Pharmacology. 2009;68:682–689.
Danhof M, Alvan G, Dahl SG, et al. Mechanism-based pharmacokinetic-pharmacodynamic modeling – a new classification of biomarkers. Pharmaceutical Research. 2005;22:1432–1437.
Di L, Kerns H, Carte G. Strategies to assess blood–brain barrier penetration. Expert Opinion on Drug Discovery. 2008;3:677–687.
Didziapetris R, Japertas P, Avdeef A, et al. Classification analysis of P-glycoprotein substrate specificity. Journal of Drug Targeting. 2003;11:391–406.
Doran A, Obach RS, Smith BJ, et al. The impact of P-glycoprotein on the disposition of drugs targeted for indications of the central nervous system: evaluation using the MDR1A/1B knockout mouse model. Drug Metabolism and Disposition. 2005;33:165–174.
Fowler S, Zhang H. In vitro evaluation of reversible and irreversible cytochrome P450 inhibition: current status on methodologies and their utility for predicting drug-drug interactions. AAPS Journal. 2008;10:410–424.
Fridén M, Ducrozet F, Middleton B, et al. Development of a high-throughput brain slice method for studying drug distribution in the central nervous system. Drug Metabolism and Disposition. 2009;37:1226–1233.
Fridén M, Ljungqvist H, Middleton B, et al. Improved measurement of drug exposure in brain using drug-specific correction for residual blood. Journal of Cerebral Blood Flow and Metabolism. 2010;30:150–161.
Fridén M, Winiwarter S, Jerndal G, et al. Structure-brain exposure relationships in rat and human using a novel data set of unbound drug concentrations in brain interstitial and cerebrospinal fluids. Journal of Medicinal Chemistry. 2009;52:6233–6243.
Gabrielsson J, Green AR. Quantitative pharmacology or pharmacokinetic pharmacodynamic integration should be a vital component in integrative pharmacology. Journal of Pharmacology and Experimental Therapeutics. 2009;331:767–774.
Galetin A, Gertz M, Houston JB. Potential role of intestinal first-pass metabolism in the prediction of drug-drug interactions. Expert Opinion on Drug Metabolism and Toxicology. 2008;4:909–922.
Garcia MJ, Reinoso RF, Sanchez Navarro A, et al. Clinical pharmacokinetics of statins. Methods and Findings in Experimental and Clinical Pharmacology. 2003;25:457–481.
Gertz M, Harrison A, Houston JB, et al. Prediction of human intestinal first-pass metabolism of 25 CYP3A substrates from in vitro clearance and permeability data. Drug Metabolism and Disposition. 2010;38:1147–1158.
Gleeson P, Davis A, Chohan K, et al. Generation of in silico cytochrome P450 1A2, 2C9, 2C19, 2D6, 3A4 inhibition QSAR models. Journal of Computer Aided Molecular Design. 2007;21:559–573.
Hitchcock S, Pennington L. Structure-brain exposure relationships. Journal of Medicinal Chemistry. 2006;49:7559–7583.
Huang S, Strong J, Zhang L, et al. New era in drug interaction evaluation: US Food and Drug Administration update on CYP enzymes, transporters, and the guidance process. Journal of Clinical Pharmacology. 2008;48:662–670.
International Transporter Consortium. Membrane transporters in drug development. Nature Reviews. Drug Discovery. 2010;9:215–236.
Jana S, Mandlekar S. Role of phase II drug metabolizing enzymes in cancer chemoprevention. Current Drug Metabolism. 2009;10:595–616.
Johnson TW, Dress KR, Edwards M. Using the golden triangle to optimise clearance and oral absorption. Bioorganic and Medicinal Chemistry Letters. 19, 2009. 5560-1554
Kola I, Landis J. Can the pharmaceutical industry reduce attrition rates? Nature Reviews. Drug Discovery. 2004;3:711–715.
Li N, Bi YA, Duignan DB, et al. Quantitative expression profile of hepatobiliary transporters in sandwich cultured rat and human hepatocytes. Molecular Pharmacology. 2009;6:1180–1189.
Lindberg P, Nordberg P, Alminger T, et al. The mechanism of action of the gastric acid secretion inhibitor omeprazole. Journal of Medicinal Chemistry. 1986;29:1327–1329.
Lipinski CA, Lombardo F, Dominy BW, et al. Experimental and computational approaches to estimate solubility and permeability in drug discovery and development settings. Advanced Drug Delivery Reviews. 1997;23:3–25.
Mahmood I. Application of allometric principles for the prediction of pharmacokinetics in human and veterinary drug development. Advanced Drug Delivery Reviews. 2007;59:1177–1192.
Mazur CS, Kenneke JF, Goldsmith MR, et al. Contrasting influence of NADPH and a NADPH-regenerating system on the metabolism of carbonyl-containing compounds in hepatic microsomes. Drug Metabolism and Disposition. 2009;37:1801–1805.
McGinnity DF, Collington J, Austin RP, et al. Evaluation of human pharmacokinetics, therapeutic dose and exposure predictions using marketed oral drugs. Current Drug Metabolism. 2007;8:463–479.
Paine SW, Barton P, Bird J, et al. A rapid computational filter for predicting the rate of human renal clearance. Journal of Molecular Graphics and Modelling. 2010;29:529–537. Epub 2010 Oct 20
Poulin P, Theil FP. A priori prediction of tissue:plasma partition coefficients of drugs to facilitate the use of physiologically-based pharmacokinetic models in drug discovery. Journal of Pharmaceutical Sciences. 2000;89:16–35.
Rawden HC, Carlile DJ, Tindall A, et al. Microsomal prediction of in vivo clearance and associated interindividual variability of six benzodiazepines in humans. Xenobiotica. 2005;35:603–625.
Riley R, Grime K, Weaver R. Time-dependent CYP inhibition. Expert Opinion on Drug Metabolism and Toxicology. 2007;3:51–66.
Rodgers T, Leahy D, Rowland M. Physiologically based pharmacokinetic modeling 1: predicting the tissue distribution of moderate-to-strong bases. Journal of Pharmaceutical Sciences. 2005;94:1259–1276.
Rodgers T, Rowland M. Physiologically based pharmacokinetic modelling 2: predicting the tissue distribution of acids, very weak bases, neutrals and zwitterions. Journal of Pharmaceutical Sciences. 2006;95:1238–1257.
Rowland M, Tozer TN. Clinical pharmacokinetics – concepts and applications, 2nd ed. London: Lea and Febiger; 1989.
Smith DA. Do prodrugs deliver? Current Opinion on Drug Discovery and Development. 2007;10:550–559.
Soars MG, Grime K, Sproston JL, et al. Use of hepatocytes to assess the contribution of hepatic uptake to clearance in vivo. Drug Metabolism and Disposition. 2007;35:859–865.
Soars MG, Webborn PJ, Riley RJ. Impact of hepatic uptake transporters on pharmacokinetics and drug-drug interactions: use of assays and models for decision making in the pharmaceutical industry. Molecular Pharmacology. 2009;6:1662–1677.
Sun H, Scott DO. Structure-based drug metabolism predictions for drug design. Chemical Biology and Drug Design. 2010;75:3–17.
Takahashi M, Washio T, Suzuki N, et al. The species differences of intestinal drug absorption and first-pass metabolism between cynomolgus monkeys and humans. Journal of Pharmaceutical Sciences. 2009;98:4343–4353.
Testa B. Drug metabolism for the perplexed medicinal chemist. Chemistry and Biodiversity. 2009;6:2055–2070.
Thompson RA, Isin EM, Yan L, et al. Risk assessment and mitigation strategies for reactive metabolites in drug discovery and development. Chemico-Biological Interactions. 2011;192:65–71.
Ungell AL, Nylander S, Bergstrand S, et al. Membrane transport of drugs in different regions of the intestinal tract of the rat. Journal of Pharmaceutical Sciences. 1998;87:360–366.
US Food and Drug Administration. Draft Guidance for Industry: Drug Interaction Studies – Study Design, Data Analysis and Implications for Dosing and Labeling. http://www.fda.gov/downloads/Drugs/GuidanceComplianceRegulatoryInformation/Guidances/ucm072101.pdf, 2006. Available from: URL
US Food and Drug Administration. Guidance for Industry: Drug Metabolism/Drug Interactions in the Drug Development Process: Studies in vitro. http://www.fda.gov/downloads/Drugs/GuidanceComplianceRegulatoryInformation/Guidances/ucm072104.pdf, 1997. Available from: URL
Van de Waterbeemd H, Smith DA, Jones BC. Lipophilicity in PK design: methyl, ethyl, futile. Journal of Computer Aided Molecular Design. 2001;15(3):273–286.
Wan H, Rehngren M, Giordanetto F, et al. High-throughput screening of drug-brain tissue binding and in silico prediction for assessment of central nervous system drug delivery. Journal of Medicinal Chemistry. 2007;50:4606–4615.
Ward P. Importance of drug transporters in pharmacokinetics and drug safety. Toxicology Mechanisms and Methods. 2008;18:1–10.
Waring MJ. Defining optimum lipophilicity and molecular weight ranges for drug candidates – molecular weight dependent lower logD limits based on permeability. Bioorganics and Medicinal Chemistry Letters. 2009;19:2844–2851.
Wenlock MC, Austin RP, Barton P, et al. A comparison of physiochemical property profiles of development and marketed oral drugs. Journal of Medicinal Chemistry. 2003;46:1250–1256.
Williams J, Hyland R, Jones B, et al. Drug-drug interactions for UDP-glucuronosyltransferase substrates; a pharmacokinetic explanation for typically observed low exposure (AUCi/AUC) ratios. Drug Metabolism and Disposition. 2004;32:1201–1208.
Yamazaki M, Kobayashi K, Sugiyama Y. Primary active transport of pravastatin across the liver canalicular membrane in normal and mutant Eisai hyperbilirubinemic rats. Biopharmaceutics and Drug Disposition. 1996;17:607–621.
Yang X, Gandhi YA, Duignan DB, et al. Prediction of biliary excretion in rats and humans using molecular weight and quantitative structure-pharmacokinetic relationships. AAPS Journal. 2009;11:511–525.
Yu LX, Amidon GL. A compartmental absorption and transit model for estimating oral absorption. International Journal of Pharmaceutics. 1999;186:119–125.
Zhou SF. Polymorphism of human cytochrome P450 2D6 and its clinical significance: part I. Clinical Pharmacokinetics. 2009;48:689–723.
Zhou SF. Polymorphism of human cytochrome P450 2D6 and its clinical significance: part II. Clinical Pharmacokinetics. 2009;48:761–804.