Chapter 16 Ultrasonographic Evaluation of the Equine Limb
Technique
Diagnostic ultrasonography was introduced in the early 1980s as a practical imaging modality to evaluate soft tissue injuries of the equine limb.1 It continues to be used extensively for evaluation of tendonous and ligamentous structures to identify, confirm, and monitor soft tissue injury (Box 16-1).2-8 Ultrasonography is now the imaging modality of choice for most soft tissue evaluation, but in the digit magnetic resonance imaging (MRI), if available, is most useful to evaluate soft tissues. However, it is user specific, and diagnostic information relies heavily on adequate equipment, limb preparation, and the scanning skills of the ultrasonographer. This chapter describes terminology and techniques and provides advice about interpretation based on our collective experiences. We describe our systematic approach, which includes both qualitative and quantitative ultrasonographic analysis of distal limb injuries. The resulting data can be used to categorize the severity of the injury and compare with subsequent examinations. The technology is still developing, and changes will evolve to improve the clinician’s ability to identify and substantiate clinical findings, leading to improved management of soft tissue injury in the horse.
BOX 16-1 Indications for Ultrasonographic Evaluation of Limbs
Equipment
Ultrasound machines used for musculoskeletal imaging require a range of transducer frequencies to examine superficial and deep structures. Soft tissues within 5 to 7 cm of the skin surface should be examined using a transducer with a frequency of at least 7.5 MHz or higher. Tissues within 7 to 15 cm of the skin surface are best evaluated with a 5.0-MHz transducer, whereas deeper tissues require a transducer in the 2.5- to 3.5-MHz range.
Sound is attenuated at 1 dB/cm depth per megahertz. Higher frequencies are attenuated at higher rates, thus limiting penetration. Conversely, lower frequencies, attenuated at lower rates, have greater penetration. The highest frequency possible should be used to obtain maximum resolution.
Claiming that one instrument is the only one to perform musculoskeletal examination is naive at best and totally inaccurate. All state-of-the-art machines have similar focusing capabilities and resolving power. Image appearances made by different machines at the same frequencies have subtle differences; however, resolution is about the same. Images may appear more crisp from transducers with a greater number of elements. Operator proficiency (or lack of it) largely determines image quality.
Large muscle masses or bone surfaces, such as the pelvis, are more effectively scanned with phased array, convex array, annular array, or sector transducers. The small skin surface imprints and divergent beam are advantageous when tissues are imaged at greater depths. However, annular array and sector transducers have focal zones that usually favor the central portion of the beam and have beam divergence, which causes far-field, lateral beam width artifact. Convex and phased array transducers have electronic focusing, and the examiner can control focal zone number and placement. It is common for these transducers to penetrate up to 30 cm.
Linear array transducers are the most popular for tendon and ligament scanning because they facilitate anatomical recognition of structures and evaluation of longitudinal tendon and ligament fiber alignment parallel to the skin surface. Convex array and sector transducers, if used properly, work equally well. However, they are more difficult to use because it is easier to change the beam direction because of the smaller contact area. It is necessary to keep the beam at 90 degrees to the tendon or ligament fibers. Anatomical features may be more difficult to recognize. Standoff pads are essential with any transducer to image the most superficial structures.
Sector and microconvex array transducers are preferable for use on contoured skin surfaces. For instance, scanning between the heel bulbs is difficult with a flat-face, linear array transducer but simple with convex or sector transducers. It is easier to steer a divergent beam and look around from a smaller contact area compared with the flat-face, linear array transducer’s broad contact area and rectangular sound beam.
Multiple frequency scanheads are available from most manufacturers; these scanheads allow operators to change frequencies relative to tissue depths without changing transducers. Newer broadband scanhead technology ensures quality, and there are no disadvantages in using these scanheads for musculoskeletal scanning, provided that basic ultrasound principles are practiced.
Horse Preparation
The horse should be adequately restrained, because an anxious, fidgety horse may cause a hurried or inadequate examination, resulting in poor-quality images and interpretive errors. One author (RLG) prefers to sedate most horses that are not entered in drug-tested competition to ensure that the horse stands quietly during the examination. The horse should be held by a person who has responsibility for the safety of the ultrasonographer and the equipment. A calm, well-positioned horse allows a thorough, tension-free evaluation.
Hair, air, scurf, scabs, and dirt induce artifacts and reduce image quality. The hair should be clipped with a No. 40 or No. 50 blade then cleaned with an antiseptic scrub, followed by a generous rinse with water, taking care to follow the growth pattern of the hair. In some horses an additional close shave with a disposable razor may improve image quality. Acoustic coupling gel is applied to improve transducer contact. Excessive application of gel causes a lateral image artifact that may impair assessment of the structures being examined, especially if peritendonous or periligamentous neural, vascular, and connective tissue structures are being evaluated. Removal of the excess gel from the transducer head or the limb corrects the artifact.
If the hair coat is fine and clipping or shaving is not possible or desired, then the limb can be washed. The examiner should spend some time wetting and soaking the hair to improve transducer contact. Topical application of alcohol while stroking the hair along its growth path may improve transducer contact,5 but alcohol can be harmful to some transducers. The operator should contact the manufacturer of the equipment to ensure that it is safe to use the transducer with alcohol.
Medical Records
Ultrasonographic images should be recorded using thermal prints, video recording, or digital recording. Thermal images were used most commonly in the past, but digital recording is rapidly superseding them.
Thermal Print Storage Envelope
Practical hints and suggestions for medical record documentation that can simplify case records, enhance clinical information for serial studies, and improve documentation are provided in the following text. We recommend a simple form stamped on the outside of a storage envelope. The information on the envelopes can be quickly filled in using symbols or checkmarks and should include the following data: horse identification, date, owner, trainer, limb or limbs examined, and structure or structures evaluated (superficial digital flexor tendon [SDFT], deep digital flexor tendon [DDFT], accessory ligament of the DDFT [ALDDFT], main body of the suspensory ligament [SL], SL branch, pastern, hock, antebrachium, crus, and other). It is also useful to record exercise level, the reason the examination was performed, and a brief summary of clinical findings. This checklist indicates which structures have been targeted and assists in interpretation of an actual lesion versus an off-incidence angle artifact. This is especially helpful if the images are reassessed at a later time.
We have developed an alphanumerical system for ranking exercise levels (Box 16-2). The current exercise level may have an important impact on diagnosis, treatment, future exercise control, and prognosis. For instance, if a horse at pasture injured a SDFT, advising pasture rest would be contraindicated. A chart for ranking exercise levels can be duplicated easily, laminated, and taped to equipment for easy reference.
BOX 16-2 Exercise Level Grading Scale
| Exercise Level | Type of Exercise Allowed |
|---|---|
| 0 | Complete stall rest. |
| 1A | Handwalk for 15 to 30 minutes once a day. |
| 1B | Handwalk ≥30 minutes a day or walk on a mechanical walker. We believe horses usually are more active walking on a mechanical walker than in hand. |
| 2A | Thoroughbred (TB) and Standardbred (STB) racehorse, event horse (EV), and sports horse (SH): exercise level 1A/B plus trotting in hand for 5 to 10 minutes a day. |
| 2B | TB racehorse, SH, and EV: trot under saddle 10 to 15 minutes once a day or swim. |
| STB racehorses: walk only in the bike or swim. | |
| This level also includes 10 to 15 minutes of trotting on a treadmill. | |
| 3A | Small paddock turnout for all horses. Small paddock implies small enough not to be able to work up to a sustained canter or gallop. |
| 3B | Large paddock turnout for all horses. |
| 4A | TB and SH: 15 to 20 minutes a day of walk, trot, and canter under saddle, 3 days per week, plus any of the above levels. This level does not apply to most STBs. |
| 4B | TB: 20 to 30 minutes a day of walk, trot, and canter under saddle, 3 to 4 days a week. |
| TB racehorse: “ponying” (being led from another horse) on the racetrack. This level does not apply to most STBs. | |
| 5 | TB racehorse and EV: all of the above plus normal galloping. |
| STB racehorse: all of the above plus jogging. | |
| SH: all of the above plus normal arena flat work with limited low fence jumping where applicable. | |
| Dressage horses: normal work minus lateral movements and special gaits. | |
| 6 | TB racehorse: all of the above plus faster gallops. |
| EV: all of the above plus jumping. | |
| STB racehorse: all of the above plus training miles ≥2 : 10. | |
| SH: all of the above plus unlimited low fence jumping where applicable. | |
| Dressage: all of the above plus lateral movements and special gaits. | |
| Contest horses (reiners, cutters, and so on): all of the above plus practicing specific turns and movements. | |
| 7 | In essence, this is the maximal work level for any type of athletic horse. |
| TB and EV: racing, fast works, and competing. | |
| STB racehorse: training miles <2 : 10 and racing. | |
| SH: showing, jumping, hunting, and so on. | |
| Dressage and contest horses: competing. |
Clinical findings may be recorded concisely as follows:
| Leg | Which Limb |
| S | Subcutaneous swelling on a scale of 0 to 5. This does not refer to tendonous or ligamentous enlargement. |
| L | Lameness on a scale of 0 to 5. |
| T | Thickening of a tendon or ligament on a scale of 0 to 5. This is independent of subcutaneous swelling. |
| Sen | Response to digital palpation of a tendon or ligament on a scale of 0 to 5. |
| H | Heat or skin temperature on a scale of 0 to 5. |
| TS | Distention of the digital flexor tendon sheath (DFTS) (tenosynovitis) on a scale of 0 to 5. |
| AS | Fetlock sinking (hyperextension of the metacarpophalangeal joint), either at rest or during movement, on a scale of 0 to 5. |
| Qualitative diagnosis | Comments on preliminary qualitative ultrasonographic interpretation. |
| New | Whether this is the first time this horse has been examined ultrasonographically for this complaint. |
| Re-Ck | A recheck of a previous injury. |
| Normal leg | This indicates which is the clinically normal limb, which may not be normal ultrasonographically. It is strongly recommended that both limbs be examined routinely. |
| Both abn | Both limbs are clinically abnormal. |
Image Labeling
All ultrasonographic images should be labeled with the date of examination, the horse’s name, the owner’s or trainer’s name, the limb being examined, and the location of the image. In addition, it is helpful to include the age, breed, and use of the horse and the current exercise level. Most machines automatically record the frequency of the transducer and the focal zone. If digital recording is used, a system of image backup is essential.
Exercise Levels
One of the basic concepts in the management of horses with tendon and ligament injuries is to relate increasing levels of exercise to increases in tendon and ligament loading. For instance, walking a Thoroughbred (TB) racehorse in hand results in far less SDFT loading (stretching) than racing at 35 mph. Understanding the current exercise level is important in interpretation of ultrasonographic information and advising management programs for controlled exercise during rehabilitation from an injury (see Box 16-2).
For example, if a TB racehorse with a SDFT injury of 4 months’ duration were reexamined and the SDFT showed little improvement, despite box or stall rest, the veterinarian would conclude that the repair was of poor quality with a poor prognosis for a return to racing. However, if the horse had been turned out for 6 hours a day with other horses that ran around, the delayed healing would be interpreted as being caused by too much tendon loading and the lack of improvement would be attributed to low-level ongoing injury. The client would be advised to reduce the exercise level and would be given a somewhat more positive outlook for future racing soundness.
In the rehabilitation of a tendon or ligament injury, the odd exercise level numbers result in the most salient changes in tendon or ligament loading. Exercise level 1 is limited to walking, resulting in little structure loading, whereas exercise level 3 is a major step up in exercise and structure loading because it allows free movement of the horse. Exercise level 5 signals the return to active training. Finally, exercise level 7 is the ultimate goal of rehabilitation and is the return to maximal athletic use. During rehabilitation the ultrasonographer assesses the current morphological status of a structure and advises changes in exercise levels consistent with those findings. Readily available and definable exercise levels make exercise decisions more efficient and consistent.
Scanning Technique
The basic objective of an ultrasonographic evaluation is to characterize the morphological characteristics of the soft tissue structures and bony surfaces of each designated anatomical area. Although physical examination findings may direct the clinician’s attention to a specific structure, a thorough examination of all soft tissue and bone surface structures is imperative. In many instances, lesions in more than one anatomical region may be identified and often result in a completely different recuperation regimen. To avoid off-incidence artifacts, the ultrasound beam must be perpendicular to the target structure. Although more than one structure may be perpendicular to the ultrasound beam simultaneously in either transverse or longitudinal images, often it is necessary to redirect the ultrasound beam to adequately examine all structures at each level. Initially the limb should be systematically examined from proximal to distal to assess the morphological features of the vasculature, periligamentous and peritendonous tissue, tendons, and ligaments. Once specific abnormal or normal structures are identified, each tendon or ligament is analyzed systematically by ultrasonographically targeting the transducer to the structure at each zone and simultaneously documenting the scan on tape, on print record, or by electronic storage.
Artifacts
Artifacts can cause major problems with any imaging modality but are especially prevalent with ultrasonography because the operator steers the ultrasound beam and sets the instrument parameters. Three primary artifact sources are common with diagnostic ultrasonography: operator error, ultrasound–tissue interaction, and inherent instrument design artifacts. Nothing can be done about the limitations of the imaging system except to recognize the artifacts in special scanning situations. Sound–tissue interaction creates myriad artifacts, some of which are useful and help with diagnosis. Others are annoying and can be difficult to overcome. Readers are referred to several publications that address the majority of artifacts peculiar to ultrasonography.9-14 Operator error and ultrasound–tissue interactions are discussed further.
Operator Errors
Inadequate Skin Preparation
Excessively long or dirty hair and unclean skin attenuate the ultrasound beam and produce image artifacts. Improper scanhead coupling to the skin caused by a lack of gel or the presence of scabs or scurf is common (Figure 16-1). Artifacts created by improper skin preparation result from poor contact. Images may be dark even though gain settings may be set at the highest limits. The tendons do not have a fine texture and are more grainy or mottled than normal. Tendon margins may not be seen, and reverberation artifacts caused by trapped air within the hair may appear within images, especially if standoff pads are used. Hypoechogenic streaks may be present in the images.
Ultrasound Beam Angle
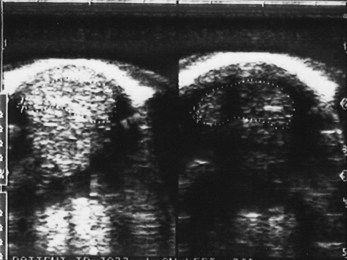
Reflection of the ultrasound beam is dependent on the sound-interface and tissue-interface geometry. Ideally the ultrasound beam should strike tissue interfaces at 90 degrees to produce the best echo reflection back to the transducer crystals, which also act as receivers. If the beam strikes a tissue interface at a smaller angle, a portion of the ultrasound is reflected away from the primary beam direction, and the interface is not seen as well or at all. This is especially important in the evaluation of tendons and ligaments in the metacarpal and metatarsal regions because the fibers usually are parallel to the skin. If the ultrasound sound beam is not perpendicular to a tendon in a transverse image, information is lost, and hypoechogenic areas, which mimic lesions, are created (Figure 16-2). The problem is not seen in longitudinal images of the metacarpal or metatarsal region obtained using a linear array transducer because its surface is parallel to the fibers. However, with convex array and sector transducers that have divergent ultrasound beams, there are only small areas within longitudinal tendon fiber images in which valid information is found (Figure 16-3). In the divergent area of the beam, sound is reflected away from the beam path and is lost to the image. It is important not to confuse these areas with pathological conditions of the tendon or ligament. The ultrasound beam must be positioned parallel to the tendon fibers. Normal tendon or ligament fibers should be seen as continuous linear echogenic structures across the image (Figure 16-4). If the transducer is turned slightly, the fibers appear as short linear segments as the beam cuts obliquely across the longitudinal axis. Because fiber alignment is an important criterion to assess in diagnosis and rehabilitation of tendon and ligament injuries, care must be taken to not create this artifact.
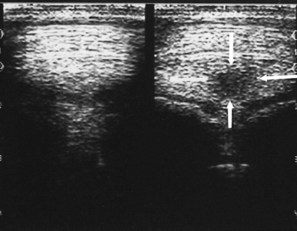
Fig. 16-2 Transverse ultrasonographic images of the distal palmar aspects of the metacarpal region. The left deep digital flexor tendon image has a normal tendon fiber pattern. The right image has an apparent central core artifact (arrows) that was produced by slightly changing the angle of the ultrasound beam.
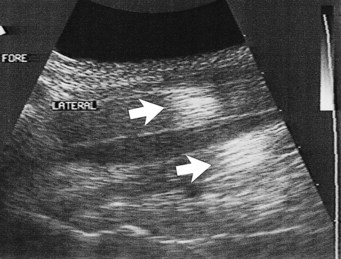
Fig. 16-3 Longitudinal ultrasonographic image of the proximal metacarpal region. The arrows point to tendon and ligament sections where the ultrasound beam is at 90 degrees, which allows the fibers to be seen. The remaining parts of the image provide no diagnostic information.

Fig. 16-4 Longitudinal ultrasonographic images of the palmar metacarpal region. The left image was obtained with a linear array transducer parallel to the tendon fibers. The right image was obtained with the transducer slightly oblique to the tendon fibers, causing them to appear as short segments instead of continuous fiber strands (arrows).
Improper Gain Settings
Ultrasound machines have gain settings referred to as overall, near, and far gain. As ultrasound penetrates normal soft tissues, it is attenuated at the rate of 1 dB/cm of tissue thickness per megahertz. Obesity and dehydration cause greater attenuation and can limit penetration. Because energy is lost from the ultrasound beam as it passes into the tissues, the instrument gain must be increased to allow echo detection from the deeper tissue depths. Overall gain changes the brightness and darkness over the entire image. The near-gain adjustment affects the echoes closest to the transducer. Increasing the near gain brightens the echoes, and decreasing it darkens them. The far gain affects the deeper aspect of the image. Some machines display a time-gain compensation curve at the side of the screen. Adjustment of the gain settings should produce an image in which the gray scale is similar over the entire image. Bright whites in the near field should prompt decreasing the near gain; conversely, if echoes are difficult to see, increase in the gain is necessary (Figure 16-5). Improper near-gain settings are the most common error in settings. Visibility of far-field echoes is enhanced by far-gain increases.
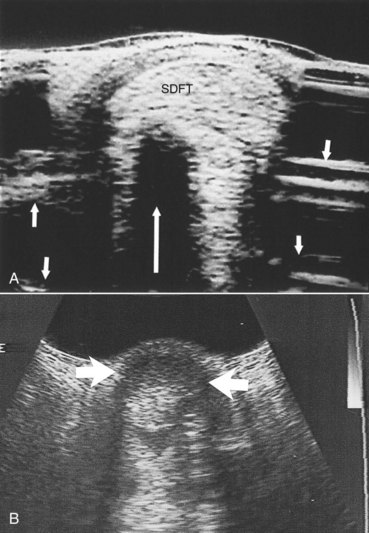
Fig. 16-5 A, Transverse sector scan ultrasonographic image of the palmar metacarpal region with the near gain set too high. The superficial digital flexor tendon (SDFT) echoes are too bright and cannot be differentiated. Acoustic shadowing (large arrow) is caused by flexor tendon and reverberation artifacts caused by the standoff pad (small arrows). B, The near gain was set too low, so the SDFT cannot be seen (arrows).
Improper Focal Zone Use
Before the advent of moveable and multiple focal zones, transducers had fixed focal points and well-defined focal zones. The ultrasound beam was narrowest in the focal zone in which the lateral resolution produced the best image quality. If the tissues of interest were outside the focal zone, image quality was not ideal. Use of transducers with appropriate focal zones became necessary. If a sector transducer is used to image the SDFT, a standoff pad is necessary to place the tendon in the focal zone. Variable focal zones have eliminated this problem and allow focal zone placement throughout the image depth. Modern linear array and convex array transducers have multiple and moveable focal zones. However, they need to be set in the proper locations to investigate the areas of suspected abnormality. If the focal zones are not placed properly, clinically significant tendon and ligament fiber damage can be overlooked (Figure 16-6).
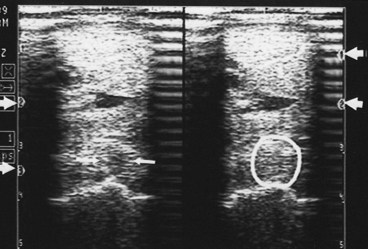
Fig. 16-6 Transverse ultrasonographic images of the proximal metacarpal region. A focal lesion in the suspensory ligament (arrows) is visible on the left image. The lesion disappears (circle) in the right image because the focal zones are improperly placed. Arrows in the left and right margins point out the focal zone levels.
Incorrect Frequency Transducer
Tissue depth dictates the optimal transducer frequency. Tissues within 5 to 7 cm of the skin surface should be examined with a 7.5-MHz or higher-frequency transducer. A 5.0-MHz transducer is required to examine tissues from 7 to 12 and up to 15 cm (depending on the instrument), and a 3.0-MHz or lower-frequency transducer is necessary for tissues 15 to 30 cm deep.
Imaging the digital flexor tendons or SL with a transducer of 5.0 MHz or less results in major compromise of image quality because of lateral beam width artifact. Two types of resolution are peculiar to ultrasound. Resolution along the beam axis, or axial resolution, is frequency dependent; the higher the frequency, the better the axial resolution. Resolution in the transverse plane, or lateral resolution, is dependent on the width of the ultrasound beam; the better the focusing or sound beam narrowing, the better the lateral resolution. Smaller crystals produce narrower sound beams, hence increased lateral resolution. A transducer with a minimum frequency of 7.5 MHz should be used for superficial tendons and ligaments for best axial and lateral resolution.
Recording Images
Thermal printers were the most popular method for recording ultrasonographic images, and some are still in use. Brightness may be set too high, causing echoes to have no differentiating characteristics (Figure 16-7), or set too low, causing the image to be too dark (Figure 16-8). The same problem occurs with contrast settings; too high a setting causes excessive contrast, and too low a setting causes the image to be washed out and too dark.
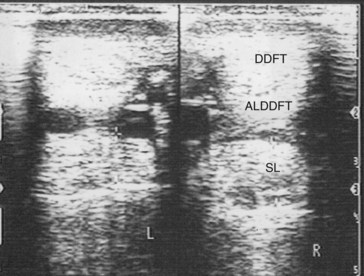
Fig. 16-7 Transverse ultrasonographic images of the metacarpal region obtained without a standoff pad showing the deep digital flexor tendon (DDFT), accessory ligament of the DDFT (ALDDFT), and the suspensory ligament (SL). The brightness is set too high, causing tendon fiber detail loss.
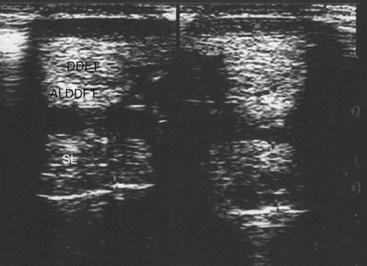
Fig. 16-8 Transverse ultrasonographic images of the metacarpal region obtained without a standoff pad showing the deep digital flexor tendon (DDFT), accessory ligament of the DDFT (ALDDFT), and the suspensory ligament (SL). The brightness is set too low, causing the image to be too dark.
It is important to consult the instruction manual to ensure that the image parameters are set properly. Proper settings also are necessary for the paper type. Interpreting improperly recorded (suboptimal) images causes substantial diagnostic error. Images must be assessed for photographic quality to preclude overlooking of lesions or overinterpretation. Suboptimal images should be repeated to preclude inaccurate interpretation and misdiagnosis. Images should always be frozen before capture.
Recording digital images on floppy disks was an effective way to capture all of the information. Depending on the system, images were recorded in bitmap (BMP) or Joint Photographic Experts Group (JPEG) formats. These were archived on hard drives and could be sent by e-mail if desired. External image capture devices functioned well, and some instruments with internal floppy drives are still in use. Digital archiving is now becoming routine. Various video formats, including video home system (VHS), 8-mm, S-Video, cineloop, and videodisk formats, are used to record motion. Recording static tissue (e.g., tendon) studies while moving the scanhead during recording can produce errors if the transducer is moved too rapidly for the frame rate to keep pace. Tendon examinations should be performed at relatively slow frame rates, as low as 7 per second, if multiple focal zones are activated. Moving the scanhead too fast causes ghosting of the image that blurs the anatomy. Activating multiple focal zones and the resultant slow frame rate can cause a similar problem with minimal scanhead movement.
Standoff Pads
Standoff pads are necessary when scanning structures near the skin, such as the SDFT and SL branches. Artifacts are produced each time they are used and can compromise image quality. It is important to recognize them. Transducers with built-in fluid standoff devices are no different. The artifacts are caused by reverberation within the standoff material and occur at a depth equaling the pad thickness (see Figure 16-5), which may obscure detail. For instance, examination of SL branches with a standoff pad can place artifacts in or near the axial border of the SL. This technique can obscure small axial border tears that are fairly common in horses. If the standoff pad thickness produces interfering artifacts, the SL branch should be examined with and without a standoff pad.
Ultrasound Tissue Interaction Artifacts (Horse-Produced Artifacts)
Ultrasonographic images are composed of returning echoes from many tissue interfaces, regardless of whether they are real or artifact. Some artifacts are useful in diagnosis and provide clues to tissue composition. Others are annoying and do not contribute to the diagnosis. Echoes are generated at tissue interfaces because of differences in acoustic impedance. Acoustic impedance is the product of tissue density (grams per cubic centimeter) and sound propagation velocity (meters per second). Substantial changes in either parameter produce acoustic barriers proportional to the magnitude difference, which causes sound reflection at the interface. Higher (brighter) amplitude echoes are created by greater acoustic impedance differences at tissue interfaces.
Skin Surface Contact
Debris and air trapped in the hair create large acoustic impedance differences and do not allow adequate sound penetration (see Figure 16-1).
Acoustic Enhancement
Whenever ultrasound passes through nonattenuating tissues, such as fluid with few or no interfaces, a slight increase in ultrasound intensity occurs in addition to less attenuation. The adjacent tissues attenuate the ultrasound normally. This causes brighter (enhanced) echoes deep to the less attenuating tissues. A good example is the enhancement seen deep to the metacarpal and metatarsal blood vessels. The SL has brighter echoes deep to the blood vessels, whereas between the blood vessels it is less echogenic (darker); it is tempting to interpret such results as abnormal (Figure 16-9). This is an inherent, tissue-produced artifact that can lead to interpretation errors but may help identify less attenuating areas within tissues such as muscle.
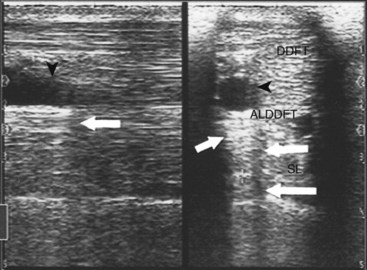
Fig. 16-9 Longitudinal ultrasonographic image (left) and transverse ultrasonographic image (right) of the metacarpal region obtained without a standoff pad showing the deep digital flexor tendon (DDFT), accessory ligament of the DDFT (ALDDFT), and the suspensory ligament (SL). The tissue brightness (short arrows) increases deep to the blood vessels. An anechoic line (arrows) extends deep to the blood vessels (arrowheads).
Refractive Scattering
If the ultrasound beam is not perpendicular to a tissue interface, hypoechogenic artifacts are caused by refraction. These artifacts can be a major problem in assessing the origin of the SL because of the anastomotic veins between it and the ALDDFT (Figure 16-10). The curved blood vessel walls create hypoechogenic lines that extend deep to the vessel walls in transverse images (see Figure 16-9). This is called refractive scattering and should not be misinterpreted as a lesion.
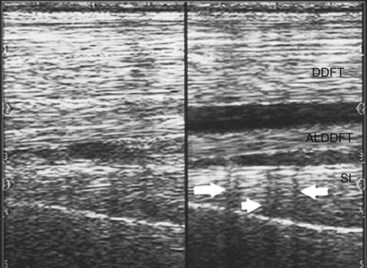
Fig. 16-10 Longitudinal ultrasonographic images of the proximal palmar metacarpal region. Proximal is to the left. Refractive scattering (arrows) caused by the veins between the origin of the suspensory ligament (SL) and the accessory ligament of the deep digital flexor tendon (ALDDFT). DDFT, Deep digital flexor tendon.
Acoustic Shadowing
A high acoustic impedance difference blocks the ultrasound beam and causes an anechogenic shadow deep to the reflecting interface. Bone and other mineralized tissue are much denser than soft tissues, and the sound propagation velocity is much faster. This creates an impenetrable acoustic barrier, and characteristically the reflector surface has bright echoes and the deeper tissues cannot be seen. These artifacts are useful because they identify soft tissue mineralization (see Figure 16-5). Bone surfaces are easily recognized because of shadowing. Dense scar tissue may create incomplete shadowing.
Reverberation
Reflection of ultrasound back and forth to the transducer from high acoustic impedance interfaces produces reverberation artifacts. The classic example is an air-filled lung surface that produces characteristic concentric reverberation echoes. Reverberation artifacts are not a major problem in tendon and ligament scanning; however, they can be important in certain circumstances. Gas production by anaerobic bacteria and air accidentally injected during diagnostic analgesia are two examples in which reverberation can be found in soft tissues. Standoff pads also create reverberation artifacts (see Figure 16-5).
Mirror Image Artifacts
Mirror image artifacts are not common problems in musculoskeletal ultrasonography and are more common in thoracic and abdominal scanning. They usually are found deep to interfaces that are highly reflective, such as air-filled lung.
Future Technology
Speckle reduction software, cross-beam scanning techniques, and the use of tissue harmonics are changing the appearance of ultrasound images. The images are smoother and lack the historically present “grainy” appearance that is common to ultrasound images. These innovations are gradually being accepted in medical imaging but are still relatively new. Some machines allow viewing the cross-beam imaging in a split-screen format with the original “grainy” images. This allows users to compare the two and to become familiar with the newer innovations. Off-axis or off-incidence scanning techniques that help to differentiate fluid from scar tissue within connective tissue structures have recently been introduced into veterinary imaging as well. With these newer technologies, artifacts peculiar to them will be defined as they find their place in medical and veterinary imaging.
Terminology and Quantitative Measurements
The basis of diagnosis is to determine the morphological variation from normal, which is not always easy. The goal is to determine the size, shape, echogenicity, fiber pattern, and surrounding inflammatory reaction of any structure. These findings should be considered carefully in conjunction with clinical impressions and the current athletic use of the horse. Box 16-3 lists parameters used for characterizing tendon and ligament lesions.15
Echogenicity
Echogenicity refers to the whiteness or brightness of a structure. Each tendon and ligament has a characteristic echogenic pattern at specific anatomical sites. Lesions vary in echogenicity depending on morphological consistency at the time of the examination. A scoring system can be used to improve objectivity when assessing the severity of an injury or the response to therapy (Box 16-4). Such a system may improve case management and illustrate to the client the changes in echogenicity that correlate with repair of an injury.
BOX 16-4 Type Scores
| Score | Description |
|---|---|
| 0 | Isoechogenic |
| 1 | Slightly hypoechogenic; mostly echogenic |
| 2 | Mixed echogenicity (50% echogenic and 50% anechogenic) |
| 3 | Mostly anechogenic or anechogenic |
The following terms are used to describe ultrasound images (bear in mind that a tissue creates/generates echos and is echogenic; a normal tendon is isoechogenic; a lesion on an ultrasonographic image may appear anechoic because the damaged tendon tissue is anechogenic):
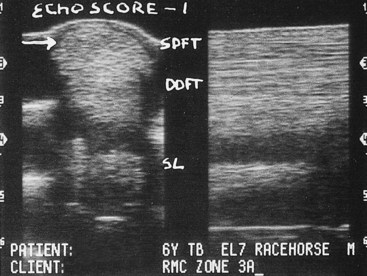
Fig. 16-11 Transverse (left) and longitudinal (right) ultrasonographic images of zone 3A of the metacarpal region obtained using a standoff pad. A type 1 hypoechoic lesion is present in the superficial digital flexor tendon (SDFT) (arrow). (See text for zone descriptions.) DDFT, Deep digital flexor tendon; SL, suspensory ligament.
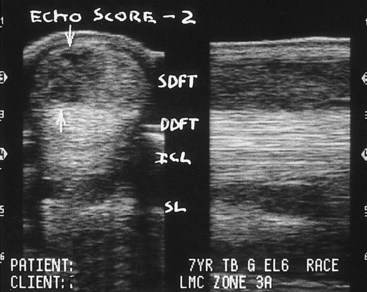
Fig. 16-12 Transverse (left) and longitudinal (right) ultrasonographic images of zone 3A of the metacarpal region. A type 2 hypoechoic lesion is present in the superficial digital flexor tendon (SDFT; arrows). DDFT, Deep digital flexor tendon; ICL, inferior check ligament (accessory ligament of the deep digital flexor tendon); SL, suspensory ligament.
| Isoechoic | The echogenicity of the structure is normal and is scored as 0. |
| Hypoechoic | The lesion is less than isoechoic. There are two categories of reduced echogenicity defined under the term hypoechoic. The first is gray or slightly off-white. This is a type 1 lesion (Figure 16-11). If the lesion is of mixed black and white tones, it is scored as a type 2 hypoechoic lesion (Figure 16-12). |
| Anechoic | The lesion is mostly black, a type 3 lesion. |
| Hyperechoic | Denoix8 grades hyperechoic lesions as hyperechoic 1, which indicates that the lesion is brighter than isoechoic and represents dense scar tissue without an acoustic shadow. Hyperechoic 2 lesions (see Figure 16-5) represent soft tissue mineral deposition, which is characterized by casting an acoustic shadow. These echo patterns are uncommon and are generally seen in long-standing and repetitively injured tendons and ligaments. |
Fiber Alignment Pattern Assessment
Assessment of fiber bundle alignment in longitudinal images determines the nature of a tendon’s or ligament’s fiber arrangement. Normally the fibers are aligned in parallel except in some anatomical areas, such as the origin of the hindlimb SL. When injury occurs, the expected parallel fiber pattern is disrupted. During healing of an injury, random orientation and cross-linking of new collagen fibers may create scar tissue that results in a substantial improvement in echogenicity but constitutes a poor scaffold for parallel alignment of fibers. Parallel alignment is more physiologically advantageous than random orientation of a scar, because randomly oriented scar tissue is susceptible to reinjury, especially during increased exercise. In a new injury or reinjury, longitudinal images are used to confirm the presence of a lesion identified in transverse images. When monitoring repair, fiber alignment can be assessed.
The longitudinal image must be obtained through the area of fiber bundle compromise to accurately assess the lesion. This is easy if a large proportion of the cross-sectional area (CSA) is involved. If a lesion is small or located on the margins of a tendon or ligament, it is more difficult. It is important to remember that fiber alignment, not echogenicity, is being assessed. In some instances, such as new injuries or reinjuries in the SDFT, the echogenic and fiber alignment scores (FASs) may be the same. This is rarely true for SL injuries.
An arbitrary scoring system for fiber alignment has been reported (Box 16-5).6,8 In this system, a score is assigned to semiquantitate fiber alignment of the target path. The veterinarian should bear in mind that the target path is wide with large lesions, but in small lesions it is quite narrow.
BOX 16-5 Fiber Alignment Scoring
| Score | Definition |
|---|---|
| 0 | Target path ≥75% parallel |
| 1 | Target path 50% to 75% parallel |
| 2 | Target path 25% to 50% parallel |
| 3 | Target path ≤25% parallel |
During repair the echogenicity score usually improves at a more rapid rate than the scar remodeling and FAS. The difference in these scores may be important for tailoring an appropriate controlled exercise program. A delay in fiber alignment improvement suggests that scar remodeling must continue and prompts conservative progression in exercise management.
It is more difficult to identify the target path of fiber bundles during healing once echogenicity has improved. Printed or electronically stored images of the initial examination can be reviewed to identify the exact location of the lesion. If the original scans are not available, one author (RLG) prefers to scan each zone from medial to lateral (or vice versa) and document the longitudinal image with the most abnormal fiber alignment. FAS (see Box 16-5) has been useful in predicting the prognosis for return to racing.16 A horse with mean FAS of less than or equal to 0.5 at 4 months after treatment of SDFT was more likely to return to racing than a horse with a mean FAS greater than 0.5. An improvement in total FAS of greater than 75% was associated with a greater chance of returning to racing.17
Cross-Sectional Area
CSA measurements of transverse images of a ligament or tendon are useful, especially in assessing a subtle injury or determining the clinical significance of a localized, focal hypoechogenic fiber bundle path. When assessing the proximal aspect of the SL, it is useful to determine whether a focal hypoechogenic fiber bundle is likely to be a lesion or the remains of muscle fibers. An injured tendon or ligament usually is enlarged, and although this finding may not be obvious subjectively, measurements of CSA confirm structural thickening.
CSA is also a useful parameter to evaluate the quality of repair, because decreasing size during rehabilitation indicates resolution of the inflammatory component of healing or may indicate favorable scar remodeling. Randomly oriented scars usually form in a rounded fashion and occupy more space. As the scar remodels into a more parallel alignment, less space is necessary, resulting in a reduction in CSA.
The transducer must be perpendicular to the structure to obtain accurate CSA data; otherwise the CSA may be falsely enlarged. The most common technique is to trace the structure on the monitor and the computer software automatically calculates the size. This technique also can be used to calculate lesion size and the proportion of the CSA involved (Figure 16-13). Initially this method of quantifying CSA may be time-consuming, especially when several structures are being assessed. Eventually the veterinarian can become extremely proficient at producing accurate measurements.

Fig. 16-13 Transverse (left) and longitudinal (right) ultrasonographic images of zone 3A of the metacarpal region. The cross-sectional area (CSA) of the superficial digital flexor tendon (SDFT) is 3.05 cm2. A dorsolateral type 1 hypoechoic lesion is present; the lesion is 43 mm2 and represents 14.1% of the CSA of the tendon. The fiber alignment score of the targeted fiber path is 3 (between arrows). DDFT, Deep digital flexor tendon; SL, suspensory ligament.
One author (RLG) uses a computer-assisted method that is not commercially available. Transverse images are traced with a microfine-point felt pen after the ultrasonographic study. With a digitizing pad and software program, surface area data are produced from the tracings of structures and lesions. This method is equally accurate but saves time because scans can be traced more quickly and at a more convenient time. The disadvantage is that the final quantitative information is not immediately available, but it does allow the clinician time to review the images before giving a conclusion to the owner. An alternative method is to save images on a computer disk using commercially available software (Metron-V, EponaTech, Creston, California).
Another simple and inexpensive method to determine structure and lesion CSA is creation of thermal images at all zones, and then at a convenient time, use of handheld calipers to make structures and lesions into two-dimensional squares or rectangles. This is done by measuring the palmar- or plantar-to-dorsal length and the medial-to-lateral length. These measurements are multiplied to determine the CSA. CSA obtained with handheld calipers is likely larger than the actual size. However, absolute values are less important than the relative difference between normal and suspected abnormal values. Thus if measurements are performed in a consistent manner, handheld calipers provide valid relative CSA data.
Relative sizes are best obtained by comparing the injured limb with the normal contralateral limb, but this is not possible if the injury is bilateral. The veterinarian must rely on the expected values for the age, size, and breed of the horse and level or zone of the image based on personal experience and previous images if available. Normal values for various structures are difficult to determine, and few studies have been published. Normal values for tendon and ligament sizes for TB and STB horses have been reported.18 It is essential to measure both limbs at the same depth setting on the ultrasound machine.
In summary, quantifying the ultrasonographic image using echogenicity and FASs, along with CSA of the lesion, provides a powerful resource to aid in interpreting lesions (Figure 16-14). When an injury is assessed from proximal to distal, these scores can be summed to estimate the volume of the injury. These values can be used to categorize the injury and to monitor repair objectively.
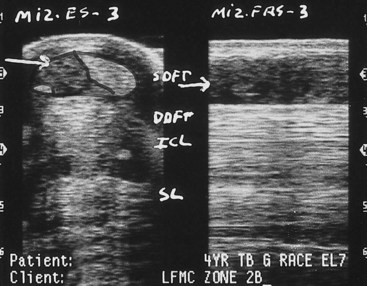
Fig. 16-14 Transverse (left) and longitudinal (right) ultrasonographic images of zone 2B, obtained using a standoff pad. There is a large lateral border type 3 lesion of the superficial digital flexor tendon (SDFT; horizontal arrow) confirmed on longitudinal scan (horizontal arrow). DDFT, Deep digital flexor tendon; MIZ-ES, maximal injury zone echo score; MIZ-FAS, maximal injury zone fiber alignment score; SL suspensory ligament.
Zone Designations
The anatomical location of an ultrasonographic image can be designated by measuring the distance from a fixed landmark, such as the accessory carpal bone, or dividing the limb into zones.
Distal Aspect of Forelimbs
The palmar metacarpal and metacarpophalangeal regions may be separated into seven zones, or eight zones if the medial aspect of the carpus is included (Figure 16-15). The pastern also may be divided into zones (see page 198). Many of these zones have unique anatomical features. The measurements outlined in the following text refer to a 16.1-hand TB horse.
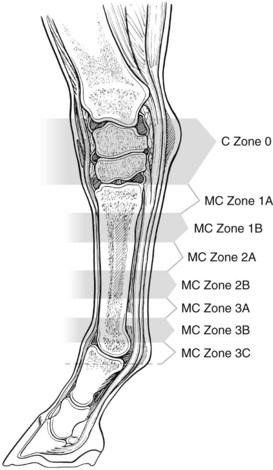
Zone Definitions
Zone 0
Zone 0 (approximately 5 cm in length) is located along the medial aspect of the carpus adjacent to the accessory carpal bone (Figure 16-16). Off-incidence angle artifacts may be present on the dorsal border of the DDFT, and rarely, hypoechogenic muscle bundles are seen (Figure 16-17). At this level the SDFT is uniform in echogenicity, but further proximally are hypoechogenic muscle bundles that should not be mistaken for lesions. The carpal sheath, common digital artery, and palmar carpal fascia are visible.
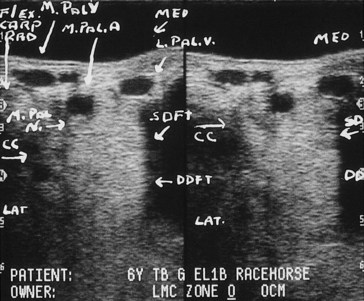
Fig. 16-16 Transverse ultrasonographic images of a forelimb zone 0 obtained along the medial aspect of the accessory carpal bone with a standoff pad. The left image is focused on the superficial digital flexor tendon (SDFT), and the right image is focused on the deep digital flexor tendon (DDFT). CC, Carpal canal; Flex Carp Rad, flexor carpi radialis; Lat, lateral; L Pal V, lateral palmar vein; M Pal A, medial palmar artery; M Pal N, medial palmar nerve; M Pal V, medial palmar vein; Med, medial.
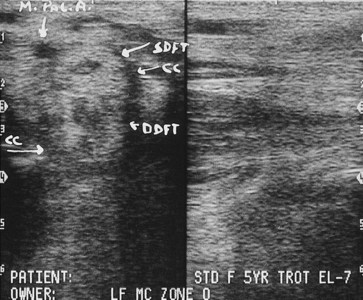
Fig. 16-17 Transverse (left) and longitudinal (right) ultrasonographic images of the forelimb zone 0 obtained from the medial aspect of the carpus, immediately proximal to the accessory carpal bone, without a standoff pad. Note the centrally located muscle bundles of the superficial digital flexor tendon (SDFT) and the deep digital flexor tendon (DDFT). This is normal and should not be confused with a lesion. CC, Carpal canal; M Pal A, medial palmar artery.
Zone 1A
Zone 1A extends from approximately 0.5 to 4 cm distal to the base of the accessory carpal bone. The SDFT is slightly medially placed, oval, and readily visible on the midline. The carpal retinaculum covers its palmar border proximally. The common digital artery lies close to the medial border of the SDFT. The DDFT is triangular, and the lateral border is more rounded (Figure 16-18). The ALDDFT and SL are rectangular. The medial and lateral borders of the ALDDFT and SL may not be visible from the palmar midline; therefore the transducer should be moved medially and laterally. However, to measure CSA of these structures, the veterinarian should use what can be seen from the palmar aspect. In most horses, anechogenic fluid in the carpal sheath is seen between the dorsal border of the DDFT and the palmar border of its accessory ligament. The medial aspect of the rectangular carpal sheath is wider than the lateral border.
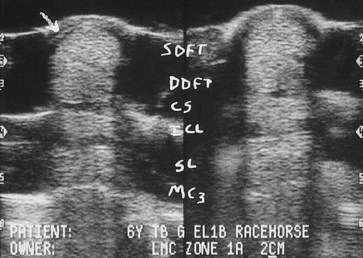
Fig. 16-18 Transverse ultrasonographic images of the forelimb zone 1A. Carpal retinaculum (arrow). CS, Carpal sheath; DDFT, deep digital flexor tendon; ICL, accessory ligament of the DDFT; MC3, palmar border of the third metacarpal bone; SDFT, superficial digital flexor tendon; SL, suspensory ligament.
The origin or enthesis of the SL is approximately 3 to 4 cm long. The SL rapidly increases in thickness from palmar to dorsal as it descends distally. In contrast, the ALDDFT rapidly decreases in thickness from palmar to dorsal. Comparative CSA measurements in each forelimb should be done at precisely the same distance distal to the accessory carpal bone in zone 1A.
In the proximal metacarpal region a ligamentous band often extends proximally from the origin of the SL to insert on the palmar carpal fascia of the distal row of carpal bones (Figure 16-19). It is located between the dorsal border of the ALDDFT and the palmar recess of the carpometacarpal joint, which lies between the fibrous band and the third metacarpal bone (McIII). Anechogenic fluid in the carpometacarpal joint should not be confused with a lesion of the SL. The proximal aspect of zone 1A is proximal to the enthesis of the SL on the McIII.
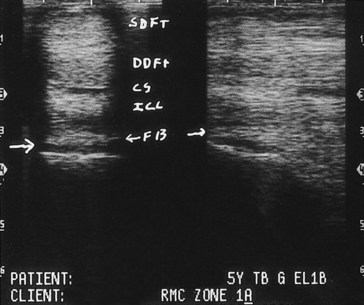
Fig. 16-19 Transverse (left) and longitudinal (right) (proximal is to the left) ultrasonographic images from zone 1A of a forelimb obtained without a standoff pad. There is a ligamentous band (ligamentous segment of origin of suspensory ligament that originates from the palmar carpal fascia [FB; small arrows]) extending from the palmar aspect of the suspensory ligament, passing palmarly over the anechogenic joint recess of the carpometacarpal joint (large horizontal arrow) and inserting proximally on the dorsal surface of the accessory ligament of the superficial digital flexor tendon. CS, Carpal sheath; DDFT, deep digital flexor tendon; ICL, accessory ligament of the DDFT; SDFT, superficial digital flexor tendon.
At 2.5 cm distal to the accessory carpal bone the origin of the SL is firmly attached to the McIII (Figure 16-20). Entheseal fiber tearing usually occurs 1 to 3 cm distal to the accessory carpal bone. The oblique orientation of the McIII at the origin of the SL attachment can be seen on a longitudinal view (see Figure 16-20). Figure 16-21 is at the distal extent of zone 1A and the distal extent of the enthesis of the SL. Note the palmar to the dorsal width at this point in zone 1A and the firm bony attachment of the entire dorsal surface of the SL. In this example, there is complete dorsal attachment of the SL. However, in many normal horses the origin of the SL has a bilobed appearance (medial and lateral attachments), with a rounded or triangular hypoechogenic area dorsally in the midline. Clinicians must be cautious not to interpret this as a focal tear. Rarely the origin of the SL can be injured in this central location, but generally the size and shape of the hypoechogenic region are changed.
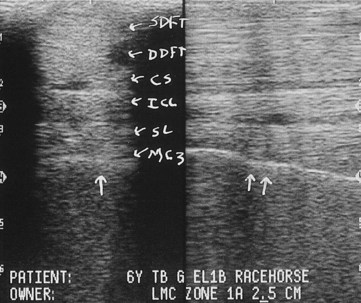
Fig. 16-20 Transverse (left) and longitudinal (right) (proximal is to the left) ultrasonographic images from zone 1A, 2.5 cm distal to the base of the accessory carpal bone, without a standoff pad. There is a firm attachment of the suspensory ligament (SL) to the third metacarpal bone (MC3) on the transverse (single vertical arrow) and the longitudinal (double vertical arrows) views. CS, Carpal sheath; DDFT, deep digital flexor tendon; ICL, accessory ligament of the DDFT; SDFT, superficial digital flexor tendon.
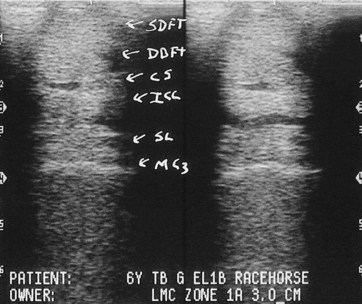
Fig. 16-21 Transverse ultrasonographic images at the distal extent of zone 1A (3.0 cm distal to the base of the accessory carpal bone), without a standoff pad. The palmar-to-dorsal dimension of the suspensory ligament (SL) is the greatest for this zone in a normal horse. CS, Carpal sheath; DDFT, deep digital flexor tendon; ICL, accessory ligament of the DDFT, MC3, third metacarpal bone; SDFT, superficial digital flexor tendon.
Zone 1B
Zone 1B extends from approximately 4 to 7 cm distal to the accessory carpal bone. At this level the slightly crescent-shaped SDFT is on the midline over the oval DDFT. There are no unique anatomical features of this zone that identify it, and its location is determined by measurement. In all midmetacarpal zones, as in zone 1A, the medial and lateral borders of the SL and ALDDFT may not be visible from the palmar midline. The transducer must be moved medially or laterally to identify a focal peripheral lesion of one of these structures. At times, the dorsal border of the SL can be difficult to identify because of the density of the periligamentous, fibrous connective tissue. To assist in defining that border, it can be helpful to split the screen and place the longitudinal image adjacent to the transverse image. This technique clearly demarcates the dorsal and palmar borders (Figure 16-22).
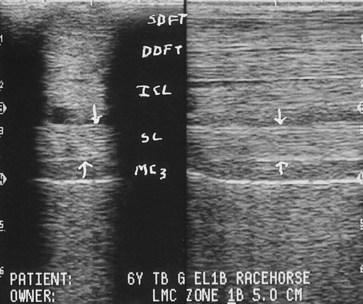
Fig. 16-22 Transverse (left) and longitudinal (right) (proximal is to the left) ultrasonographic images of zone 1B (5 cm distal to the base of the accessory carpal bone) obtained without a standoff pad. The down arrows mark the palmar border of the suspensory ligament (SL), and the up arrows mark the dorsal border. DDFT, Deep digital flexor tendon; ICL, accessory ligament of the DDFT, MC3, third metacarpal bone; SDFT, superficial digital flexor tendon.
Zone 2A
Zone 2A extends from approximately 7 to 10 cm distal to the accessory carpal bone. The same comments apply for this zone as for zone 1B.
Zone 2B
Zone 2B extends from approximately 10 to 14 cm distal to the accessory carpal bone. One unique feature of this zone is an obliquely coursing nerve located subcutaneously on the palmar surface of the SDFT. This nerve (the communicating branch of the medial palmar nerve) and associated small vessels are a common site for a bandage pinch or “cording” swelling that suggests a primary tendon injury. Overall the anatomical relationships of tendons and ligaments are similar to zones 1B and 2A. The SDFT and ALDDFT are more crescent shaped and smaller from palmar to dorsal. At this level the carpal sheath still can be identified ultrasonographically.
Zone 3A
Zone 3A extends from approximately 14 to 18 cm distal to the accessory carpal bone. Several anatomical features characterize this zone. The first is that in many horses with tenosynovitis, this is the initial zone that incorporates the origin of the DFTS.
The SDFT is crescent shaped and smaller from palmar to dorsal but wider from medial to lateral. The ALDDFT inserts into the DDFT. In transverse images normal crescent-shaped hypoechogenic fiber bundles are seen between the dorsal surface of the DDFT and the palmar surface of its accessory ligament. The carpal sheath generally is not appreciated in this zone.
At the region of the ALDDFT insertion onto the DDFT, the two structures can clearly be separated ultrasonographically, although grossly they are conjoined. When measuring the CSA of the DDFT, the ALDDFT can be separated from the DDFT, which results in a reduced DDFT CSA, or included with it, which yields a more correct CSA determination of the DDFT. The method used is personal preference and results in valid information, provided it is consistent.
Zone 3A is just proximal to the bifurcation of the SL. In zone 3A the SL is still a single structure, but the medial and lateral borders become more rounded and the central region may be less echogenic. This is a common site of injury, especially in STB racehorses. At times it can be quite difficult to establish structural borders in acute injury. A longitudinal image viewed adjacent to a transverse may be helpful (Figure 16-23).

Fig. 16-23 Transverse (left) and longitudinal (right) (proximal is to the left) ultrasonographic images from zone 3A (15 cm distal to the base of the accessory carpal bone), in which the suspensory ligament (SL) bifurcates. DDFT, Deep digital flexor tendon; ICL, accessory ligament of the DDFT, MC3, third metacarpal bone; SDFT, superficial digital flexor tendon.
Zone 3B
Zone 3B is larger (approximately 5 cm in the average adult horse) than more proximal zones and is the region in which the SL bifurcates into medial and lateral branches. The zone extends from 18 to 23 cm distal to the accessory carpal bone. Anatomical structures include the DFTS; the manica flexoria, a fibrous band extending from the medial and lateral borders of the SDFT and encompassing the DDFT that is associated with a thecal space; and the intersesamoidean space and ligament with associated connective tissue and vasculature. The SDFT decreases in size from palmar to dorsal and widens from medial to lateral. The DDFT becomes ovoid. CSA measurements should be made at identical sites distal to the accessory carpal bone for accurate comparisons between limbs.
The SL branches must be examined individually from palmaromedial and palmarolateral aspects of the limb with a standoff pad. If the ligament is enlarged, no standoff pad is required. The length of a metacarpal SL branch is about 6 cm. To increase data points for CSA comparison, each branch is divided into three 2-cm subzones within zone 3B. For the medial branch, the zone designations are 3B-MP (medial proximal), 3B-MM (medial middle), and 3B-MD (medial distal) (Figure 16-24). For the lateral branch the zone designations are 3B-LP (lateral proximal), 3B-LM (lateral middle), and 3B-LD (lateral distal). The proximal and middle segments of each branch are oval, and the distal segment is more triangular.
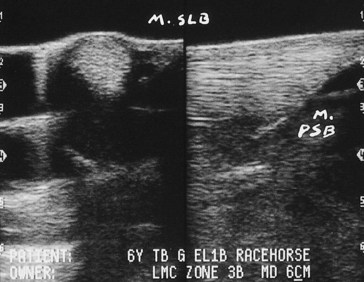
Fig. 16-24 Transverse (left) and longitudinal (right) (proximal is to the left) ultrasonographic images of zone 3B-MD (medial placement of the transducer at the distal extent of the insertion of the medial branch of the suspensory ligament onto the medial proximal sesamoid bone). M PSB, Bone border of the abaxial medial proximal sesamoid bone; M SLB, medial suspensory ligament branch.
Zone 3C
Zone 3C extends from 23 to 28 cm distal to the accessory carpal bone and basically includes tissues on the palmar aspect of the metacarpophalangeal joint. The characteristic features of this zone are the presence of the bony shadows of apices of the proximal sesamoid bones (PSBs), the presence of the palmar annular ligament (PAL), and the intersesamoidean ligament (Figure 16-25).
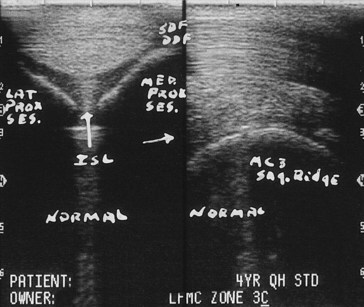
Fig. 16-25 Transverse (left) and longitudinal (right) ultrasonographic images of zone 3C obtained without a standoff pad. Vertical and horizontal arrows indicate a normal intersesamoidean ligament. DDF, Deep digital flexor tendon; ISL, intersesamoidean ligament; Lat Prox Ses, lateral proximal sesamoid bone osseous shadow; MC3 Sag Ridge, sagittal ridge of third metacarpal bone; Med Prox Ses, medial proximal sesamoid bone shadow.
Distal Aspect of Hindlimbs
The anatomical location of an ultrasonographic image can be designated by measuring the distance from a fixed landmark, such as the tuber calcanei or tarsometatarsal joint, or reference to a numbered zone. Most distal limb anatomical features are the same as in the forelimb. However, because of the added length of the SDFT or DDFT and the existence of the plantar ligament (long plantar tarsal ligament), the metatarsal zones move up one number.
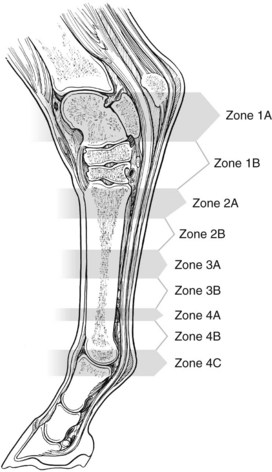
In the hindlimb, zone 1 includes the plantar aspect of the tarsus (see Figure 78-3). In an adult horse, this is approximately 16 cm in length. Zone 1 is subdivided into two 8-cm zones, 1A and 1B. The most proximal zone of the metatarsal region is zone 2, which is subdivided into 2A and 2B; the middle third is zone 3, which is subdivided into zones 3A and 3B; and the distal aspect is zone 4, which is subdivided into zones 4A, 4B, and 4C (Figure 16-26).
Hindlimb Zones
Zone 1A
Zone 1A extends to 8 cm distal to the tuber calcanei (Figure 16-27; see Chapter 78). The SDFT is slightly crescent shaped and located subcutaneously. Deep to the SDFT is the origin of the plantar ligament. Occasionally the subcutaneous bursa or the subtendonous calcanean bursa or both bursae may be seen. The entire width of the SDFT may not be observed on a single midline view, but useful CSA data can be obtained. The extreme medial and lateral borders of the SDFT and the retinacular attachment to the calcaneus may be more visible with slight medial and lateral placement of the transducer. The plantar ligament is located on the midline, firmly attached to the calcaneus, with its origin approximately 3 cm distal to the tuber calcanei. The DDFT and tarsal sheath must be viewed individually by medial positioning of the transducer. The origin of the plantar ligament widens in a plantar-to-dorsal plane rapidly in this zone. Accurate comparative CSA data require precise anatomical positioning on both hindlimbs. Usually at this level, no visible muscle bundles of the DDFT are seen, but clinicians must be aware of this possibility and not interpret them as a core lesion. At 5 cm distal (zone 1B) to the tuber calcanei, the plantar ligament is roughly triangular and has multiple septated bundles that are all included in measurement of the CSA (Figure 16-28).
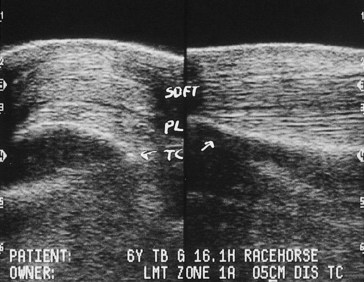
Fig. 16-27 Transverse (left) and longitudinal (right) (proximal is to the left) ultrasonographic images of the plantar tarsus (zone 1A, 5 cm distal to the tuber calcanei) obtained using a standoff pad. PL, Plantar ligament or long plantar tarsal ligament; SDFT, superficial digital flexor tendon; TC, plantar border of the calcaneus.
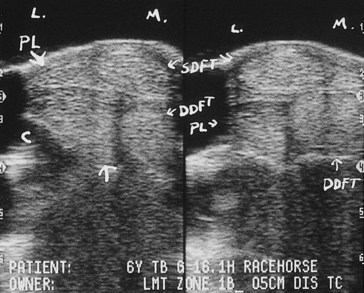
Fig. 16-28 Transverse ultrasonographic images from zone 1B, 5 cm distal to the tuber calcanei, obtained using a standoff pad. Medial is to the right. The left image is slightly lateral of midline to highlight the plantar ligament (PL; between arrows), and the right image is slightly medial of midline to highlight the superficial digital flexor tendon (SDFT) and the deep digital flexor tendon (DDFT). C, Osseous border of the calcaneus; L, lateral; M, medial; PL, plantar ligament or long plantar tarsal ligament.
Zone 1B
Hindlimb zone 1B includes the distal half of the tarsus, extending from 8 to 16 cm distal to the tuber calcanei. Numerous images must be obtained from the plantar midline to assess the SDFT, from plantaromedial to assess the DDFT, and from slightly lateral to the midline to assess the plantar ligament. A wedge-shaped fibrous band emanates from the medial border of the SDFT and the fascia of the fibrous tarsal sheath and surrounds the DDFT (see Figure 16-28). There is a narrow anechoic space representing fluid in the tarsal sheath separating the DDFT and the plantar ligament. The plantar ligament decreases in plantar to dorsal size as it courses distally; it has a firm enthesis to the plantar aspect of the fourth tarsal bone and inserts onto the head of the fourth metatarsal bone (MtIV).
Zone 2A
Zone 2A is the first metatarsal zone and includes the origin of the SL (approximately 16 to 21 cm distal to the tuber calcanei) and the ALDDFT, which is a rudimentary structure in many horses. The transducer must be slightly medial to midline for complete examination of the DDFT. The SDFT can be assessed from the plantar midline. The origin of the SL can be somewhat confusing on ultrasound images, and this may create a dilemma in detecting subtle injury. The SL is firmly attached to the third metatarsal bone (MtIII) (approximately 4- to 5-cm enthesis) and rapidly increases in size from plantar to dorsal within zone 2A. Therefore care must be taken when measuring comparative CSAs to do so at exactly the same level within zone 2A. In longitudinal images the origin of the SL often does not have a tight parallel fiber pattern, which results in an FAS of 1. The large bony surfaces of the second metatarsal bone (MtII) and the MtIV obstruct a clear view, and often a linear anechoic artifact is created by more superficial blood vessels. The origin of the SL begins slightly lateral to midline and thus is not parallel to the plantar surface of the MtIII. The SL appears rhomboid from the plantar midline, but if viewed from slightly medial of midline, it appears more rectangular. CSA measurements should be obtained from one view or the other, but not mixed. Comparison of the longitudinal and transverse views of the SL may help in identifying the plantar and dorsal borders.
Zone 2B
Hindlimb zone 2B extends approximately 21 to 24 cm distal to the tuber calcanei. The SDFT, DDFT, ALDDFT, and SL can be viewed adequately from a midline and slightly medial positioning of the transducer (Figure 16-29). At this level the SDFT is slightly crescent shaped, and the DDFT is ovoid and slightly medially placed. The ALDDFT is visible on the dorsal border of the DDFT. The SL is roughly rectangular with an apex toward the plantar lateral aspect (Figure 16-30). No unique anatomical features identify this zone; it is identified only by measurement.
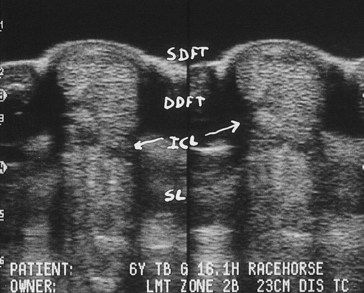
Fig. 16-29 Transverse ultrasonographic images of zone 2B, 23 cm distal to the tuber calcanei, obtained using a standoff pad. DDFT, Deep digital flexor tendon; ICL, accessory ligament of the DDFT; SDFT, superficial digital flexor tendon; SL, suspensory ligament.
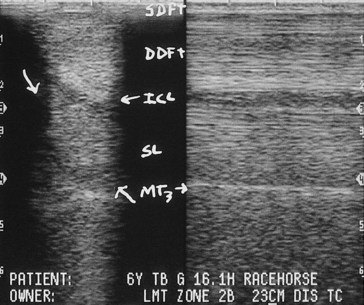
Fig. 16-30 Transverse (left) and longitudinal (right) ultrasonographic images of zone 2B obtained without a standoff pad. The suspensory ligament (SL) is located between the large oblique arrows. DDFT, Deep digital flexor tendon; MT3, plantar border of third metatarsal bone; SDFT, superficial digital flexor tendon.
Zone 3A
Zone 3A ranges from 24 to 32 cm distal to the tuber calcanei. The SDFT is slightly crescent-shaped and is positioned directly over the DDFT. The SL at this level is roughly rectangular with an apex on the plantar lateral border. Zone 3A has no unique anatomical features.
Zone 3B
Hindlimb zone 3B extends from 28 to 32 cm distal to the tuber calcanei. The SDFT is crescent shaped and narrower in the plantar-to-dorsal plane and wider in a medial-to-lateral plane, whereas the DDFT is ovoid. This zone has no unique anatomical features.
Zone 4A
Hindlimb zone 4A extends from 32 to 36 cm distal to the tuber calcanei. In this zone the ALDDFT inserts into the DDFT, and a normal hypoechoic artifact may be seen on the dorsal border of the DDFT (Figure 16-31). This is the most distal zone in which the SL is a single unit. The proximal aspect of the DFTS may be seen.
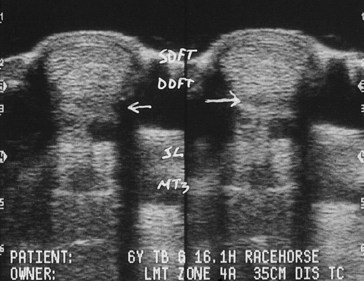
Fig. 16-31 Transverse ultrasonographic images from zone 4A, 35 cm distal to the tuber calcanei. There is an artifactual hypoechogenic zone between the dorsal aspect of the deep digital flexor tendon (DDFT) and the plantar border of the accessory ligament of the DDFT insertion (horizontal arrows). MT3, Plantar border of third metatarsal bone; SDFT; superficial digital flexor tendon; SL, suspensory ligament.
Palmar and Plantar Pastern Zones and Descriptions
Qualitative assessments are more critical in pastern ultrasonography because some lesions are not accompanied by clinically significant changes in CSA. If DFTS tenosynovitis is coupled with a subtle primary tendon injury, the tendon may be mildly enlarged. Marginal longitudinal tears of the DDFT require precise qualitative inspection of the lateral and medial borders of the DDFT and the vincula. Fibrous adhesions of the sheath may be identified but may not be accompanied by an increase in DDFT CSA.19 It also is more difficult to obtain accurate FAS for the branches of the SDFT and oblique sesamoidean ligament (or middle distal sesamoidean ligament). The distal metacarpal or metatarsal regions should also be examined when assessing the DFTS in the pastern.
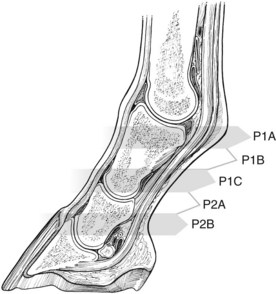
The pastern is a complex anatomical structure including many ligaments, joint recesses, vasculature, fibrocartilaginous insertional attachments, entheses, joint surfaces, and two major tendons.20 The major structures of practical and common clinical concern are the DFTS, SDFT and branches, DDFT, oblique sesamoidean ligament (middle distal sesamoidean ligament), and straight sesamoidean ligament (or superficial distal sesamoidean ligament). The pastern can be arbitrarily divided into four zones, each with unique anatomical features. The pastern is divided into three palmar or plantar zones along the proximal phalanx (P1) and one zone at the proximal interphalangeal joint (Figure 16-32).
Pastern Zone Designations and Descriptions
Zone P1A
Zone P1A extends approximately 1 to 3 cm from the base of the ergot. Anatomical landmarks, such as the ergot, can be used to identify this zone. The SDFT is viewed from the midline and is a crescent-shaped, single-unit structure with very slight enlargement and rounding of the medial and lateral borders. The entire SDFT is included for CSA data. The palmar or plantar surface of the SDFT is covered by the thin proximal digital annular ligament. Dorsal to the SDFT on the midline view lies the ovoid DDFT. Anechogenic fluid in the DFTS is interposed between the DDFT and the triangular straight sesamoidean ligament. Occasionally a fibrous bridge of the oblique sesamoidean ligament or a small portion of the cruciate sesamoidean ligament (or deep distal sesamoidean ligament) may be identified dorsal to the straight sesamoidean ligament. Dorsal to the SDFT on the midline view is a hypoechogenic or anechogenic rounded joint recess of the metacarpophalangeal or metatarsophalangeal joint. The medial and lateral origins of the oblique sesamoidean ligament are seen as two distinctly separate structures and are more adequately viewed by medial and lateral parasagittal placement of the transducer.
Zone P1B
Zone P1B extends from 3 to 5 cm distal to the base of the ergot (Figure 16-33). The SDFT is still a single unit starting to form rounded medial and lateral branches, which are evaluated by moving the transducer medially and laterally. The DDFT has a bilobed appearance, and unless the transducer is perpendicular to the DDFT, central hypoechoic areas are seen in each lobe. The DFTS is seen on the dorsal surface of the DDFT, dorsal to which is the square or rectangular straight sesamoidean ligament. The oblique sesamoidean ligament is seen as a single structure in close proximity to the palmar or plantar surface of P1, dorsal to the straight sesamoidean ligament.
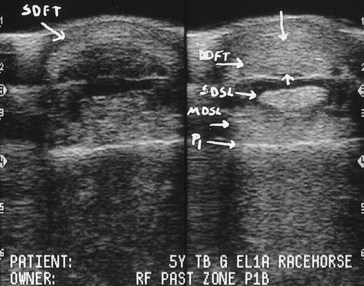
Fig. 16-33 Transverse ultrasonographic images of zone P1B obtained using a standoff pad. The left image targets the superficial digital flexor tendon (SDFT). The right image targets the deep digital flexor tendon (DDFT), straight sesamoidean ligament (SDSL), and middle distal sesamoidean ligament or oblique sesamoidean ligament (MDSL). P1, Palmar border of the proximal phalanx.
Zone P1C
Zone P1C extends approximately 5 to 7 cm distal to the base of the ergot (Figure 16-34). The bilobed DDFT lies subcutaneously. The square or slightly rectangular straight sesamoidean ligament is on the dorsal surface of the DDFT. The oblique sesamoidean ligament is not visible because zone P1C is distal to its insertion. The teardrop-shaped medial and lateral branches of the SDFT are viewed by moving the transducer medially and laterally.
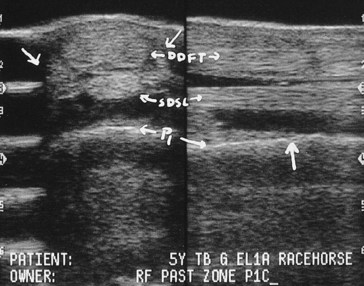
Fig. 16-34 Transverse (left) and longitudinal (right) ultrasonographic images of zone P1C obtained using a standoff pad. The oblique arrows indicate the untargeted medial and lateral branches of the superficial digital flexor tendon. The vertical arrow indicates the insertion of the middle distal sesamoidean ligament (MDSL). DDFT, Deep digital flexor tendon; P1, palmar border of the proximal phalanx.
Zone P2A
Zone P2A extends approximately 6 to 9 cm distal to the base of the ergot. A thin distal digital annular ligament is closely associated with the palmar or plantar border of the DDFT. The DDFT has a bilobed appearance but is narrower from palmar or plantar to dorsal and wider from medial to lateral. Deep to the DDFT is the middle scutum, the fibrocartilaginous insertion of the straight sesamoidean ligament, which may have a heterogeneous echogenicity (Figure 16-35). Deep to the middle scutum is the proximal interphalangeal joint recess. The medial and lateral branches of the SDFT insert onto the distal aspect of the proximal phalanx and the proximal eminence of the middle phalanx.
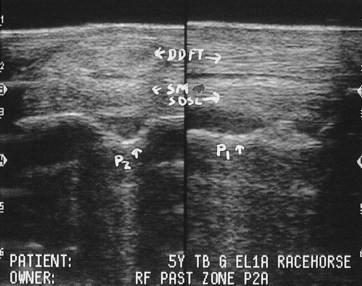
Fig. 16-35 Transverse (left) and longitudinal (right) ultrasonographic images of zone P2A obtained using a standoff pad. DDFT, Deep digital flexor tendon; P1, palmar border of the proximal phalanx; P2, the palmar border of the middle phalanx; SDSL, superficial distal sesamoidean ligament or straight sesamoidean ligament; SM, scutum medium.
Ultrasonography of Proximal Parts of the Limbs
Quantitative ultrasonographic evaluation can be applied to other anatomical areas and the lower limb areas described. These areas do not have zonal designations, and all are identified by measurement from a bony eminence. Many structures contain some muscle fiber bundles that are hypoechogenic, which makes detection of lesions more difficult. Whenever possible, we compare echogenicity, fiber alignment, and CSA between the limbs to determine some quantitative data to support a qualitative diagnosis.
Clinical Ultrasonography
With these suggested fundamental principles in terminology and a systematic concept of data collection, the clinician is prepared to examine the horse. A 7-year-old TB gelding racehorse that had raced for 5 years, with 80 lifetime starts, 14 wins, and $74,568 in earnings, raced poorly 4 days previously. The next day, the trainer noted peritendonous swelling but no lameness. The horse had never had swelling in this area previously. The horse had received 2 g of phenylbutazone intravenously 24 hours before the race and 2 g immediately after the race. There was heat, slight subcutaneous swelling, and sensitivity and slight enlargement of the SDFT. A core lesion of the SDFT was detected ultrasonographically (Figure 16-36). This scenario raises several questions. How serious is the injury? Can the horse be treated symptomatically and continue to race? If the horse is rested, will it be able to race again? If the horse is rested, which therapy should be used? How will the degree of healing be determined? Each horse is assessed by subjective evaluation of the ultrasonographic images and quantitative analysis.
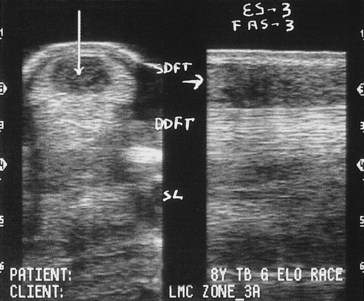
Fig. 16-36 Transverse (left) and longitudinal (right) ultrasonographic images from zone 3A obtained using a standoff pad. The vertical arrow indicates a type 3 core lesion of the superficial digital flexor tendon (SDFT). The horizontal arrow indicates the target path on the longitudinal image, with a fiber alignment score of 3 (FAS-3). DDFT, Deep digital flexor tendon; ES-3, echo score 3; SL, suspensory ligament.
Quantitative Analysis
The weakest link, or maximal injured zone, is the level at which the biggest proportion of tendon CSA is reduced in echogenicity, or the zone with the largest increase in CSA when compared with a normal contralateral limb. Total structural size is obtained by summing the CSA from each zone. To obtain the percentage of total extent of injury, add the lesion CSA from all levels with a lesion. The total lesion CSA is divided by the total structure CSA and multiplied by 100. The resulting number provides an estimate of structural compromise. It is this percent of total lesion (% T-lesion) that is used to categorize injury and relates the severity of structural injury to the client.
Quantitative Terms
The following terms are used in reference to injuries:
In a normal horse, typical measurements of T-CSA in the forelimb include the following:
We find that this quantitative assessment provides practical, useful information that can be used routinely and that lesions can be placed in one of six categories.
Lesion Categories
Category I
Category I implies no substantial qualitative or quantitative abnormality. No tendon or ligament fiber bundle lesions are detected, and all zones have lesion and FASs of zero. No single zone has a CSA measurement greater than 39% compared with the contralateral limb. This percentage of tolerance more than adequately allows for method error, especially in zones 1A and 3A. However, with precise technique, a variation greater than 25% indicates substantial structural enlargement. Assessment of T-CSA depends on the number of zones included. The larger the number of zones included, the less difference there should be between limbs:
A 9-year-old TB mare competing as a hunter developed new swelling in the right proximal metacarpal region and slight, intermittent lameness. The client was concerned that the tendon was injured, and if so, did not want to continue athletic use of the horse, which would risk further injury. Palpation revealed swelling (2/5), increased skin temperature (2/5), and a painful response to direct digital pressure of the proximal aspect of the right fore SDFT. Both forelimbs were examined ultrasonographically. No qualitative abnormalities were detected in the normal limb. Subcutaneous fluid was accumulated in the affected limb, indicating edema with or without hemorrhage, but echogenicity of the SDFT was normal. CSA was measured for seven zones of each limb. Zone 1B was determined the maximal injured zone, and the CSA of the SDFT was 25% larger than the normal limb (i.e., category I) but suggestive of tendon enlargement. The T-CSA difference was only 3%. The SDFT was considered normal, although two zones had slightly enlarged CSA (1B was +25% and 2A was +23%). It was recommended that exercise be restricted to walk and trot for 7 days with daily icing, daily bandaging with alcohol and thick standing bandages be used, and phenylbutazone (2 g once daily for 5 days) be administered. If the swelling was 100% reduced after this time, then the horse could return to normal athletic use. If no improvement occurred within 7 days or return to work caused a relapse, repeat ultrasonographic evaluation would be indicated. This horse returned to normal use.
Category II
No hypoechoic or anechoic lesions are detectable, but the affected limb has MIZ-CSA measurements greater than 39%, with or without T-CSA for six or seven zones greater than 14% of the normal limb (i.e., measurable focal or diffuse thickening of the tendon or ligament). Causes of category II injuries may include an unusual developmental difference, a new low-grade tendonitis or desmitis, or an older, currently stable healed tendon or ligament injury. Although generalized thickening may not cause great concern initially, there is evidence that continued use will eventually lead to greater injury. For example, 29% of TB racehorses (n = 13) that continued to train and race with a new category II SDFT injury eventually developed a clinically bowed tendon.21
A 12-year-old TB gelding competing cross-country had recurrent swelling of the SDFT in the midmetacarpal region that reduced with rest and antiinflammatory treatment but returned if work was resumed. The horse had a long toe and was shod in smooth-toed, heavy steel shoes. There was slight, diffuse thickening (2/5) of the SDFT with increased skin temperature and marked sensitivity to direct digital pressure in zone 2B (4/5). Ultrasonographic examination revealed subcutaneous fluid and possible SDFT enlargement (Figure 16-37) in zone 2B. Inflammation of the communicating branch of the palmar nerves was noted, indicating a malpositioned bandage. However, quantitative evaluation indicated a substantial generalized tendon thickening, which is unusual for a focal bandage pinch. The T-CSA was 15% larger than the normal limb (i.e., category II). It was recommended that exercise be restricted to walking with little trotting under saddle for 3 to 4 days a week for 1 month with daily icing and use of a thick stall bandage with alcohol. Foot length was to be shortened and the horse shod with a fully grooved or creased, lighter steel shoe to decrease the strain on the tendon. Five weeks later marked clinical improvement was noted. Ultrasonographic examination revealed that the subcutaneous fluid accumulation had resolved with no qualitative abnormalities of the SDFT. Substantial reduction in the T-CSA measurements indicated a resolution of intratendonous inflammation. These findings add credence to the initial diagnosis of low-grade tendonitis. It is difficult to make this diagnosis qualitatively with any confidence. Only use of quantitative analytical techniques allows the clinician to truly appreciate these changes and be confident in a category II diagnosis.
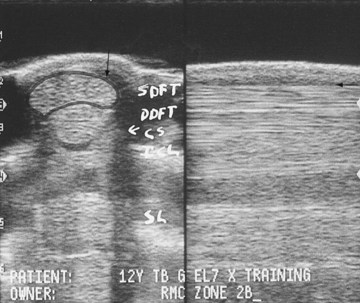
Category III
In category III lesions, type 1 or 2 focal hypoechogenic fibers bundles are present, with or without clinically significant MIZ-CSA or T-CSA enlargement. To qualify as a category III lesion, the T-TS (T-ES) cannot exceed 3 (i.e., < 2). This abnormality may be an incidental finding, represent minimal tendon or ligament injury, or be the end result of a healed and clinically stable tendon or ligament injury. In these horses, clinical history, physical examination, and serial monitoring help to determine the clinical significance of the ultrasonographic abnormalities.
A 16-year-old Trakehner gelding, used for upper-level dressage, was examined to assess healing of desmitis of the ALDDFT. The horse had been in controlled exercise for many months, and the client was anticipating a progressive return to normal athletic use, assuming the ultrasonographic findings were favorable. Moderate thickening of the ALDDFT (3/5) was confirmed ultrasonographically, including a focal area of compromised fiber bundles along the dorsal lateral border of zone 2A (TS = 1), and a generalized alteration in fiber bundle alignment (T-FAS = 4). Given the knowledge that this horse had been rested for many months, a slow return to training was recommended. The ultrasonographic images can be used as a benchmark for evaluation of the stability of the repair as gradual increases in ligament loading commence. The horse eventually returned to upper-level dressage and has been asymptomatic for 2 years.
Even though category II and III injuries do not seem to represent a very serious compromise to a tendon or ligament, they do alert the clinician, trainer, and owner to a subtle problem that requires medical management and that with early diagnosis is more easily managed. If the decision were made to continue athletic use while performing symptomatic therapy, serial ultrasonographic monitoring would be indicated to monitor stability. In this manner, early clinically significant regressions may be detected before overt clinical signs of reinjury occur. These two injury categories are not easily diagnosed with qualitative assessment alone. Quantitative analysis identifies these low-grade abnormalities. However, these two categories often represent a dilemma for a practitioner. The clinical signs are slight, seldom associated with lameness, and often respond quickly to symptomatic therapy. Therefore it is difficult to persuade trainers to rest horses. However, category II and III tendons and ligaments often represent the earliest of ultrasonographically identifiable injury and have the best chance of full recovery with extended rest. Quantitative evidence may help a client appreciate the significance of the injury. Ultimately, regardless of whether the horse is rested or treated symptomatically for a category II or III injury, periodic comparative data will greatly assist a practitioner in advising clients and help the clients to understand the injury.
Category IV
A category IV lesion is characterized by focal hypoechoic or anechoic lesions with the T-S ≥3, with a specific % T-lesion (Table 16-1). The range of % T-lesion to qualify for category IV varies depending on the number of zones included for determining the “total.” The MIZ-CSA or T-CSA may or may not be substantially enlarged. Although this category includes a wide range of injuries, it can be used to document slight injury or an important compromise of tendon or ligament fiber bundles.
TABLE 16-1 Category IV T-Lesions
| ZONES USED FOR TOTAL (NO.) | T-LESION (%)* |
|---|---|
| 11 | 1%-10% |
| 6 or 7 | 1%-15% |
| 5 | 1%-20% |
| 3 | 1%-25% |
* All have a total type or echo score ≥3.
A 5-year-old TB racehorse gelding had a right fore SDFT injury of 6 months’ duration. The horse had been galloping daily (exercise level 5) for 2 weeks, but the last time the horse galloped, right forelimb lameness and tendon swelling developed. Physical examination revealed slight swelling (1/5), low-grade lameness (2/5), moderate SDFT thickening (3/5), slight sensitivity to direct digital pressure, and localized heat (2/5) of the right forelimb. Ultrasonographic analysis of the right SDFT in zone 3B displayed a large type 3 anechoic core lesion (Figure 16-38). Quantitative data documented a T-CSA of 1243 mm2. CSA was 67% larger than the left fore SDFT in zone 3B. In addition, bundles of compromised tendon were noted in six of the seven zones. These localized lesions of mixed echogenicity, mostly type 1, probably were the result of the previous injury. The new injury was localized to zones 3B and 3C, with echo scores of 2 and 3. In this analysis of reinjury, all areas of reduced echogenicity were included in the total lesion summation. Additional measurements include % T-lesion of 12%, T-TS of 11, T-FAS of 8, and A-FAS of 1.1.
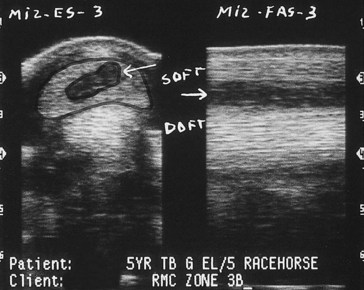
Fig. 16-38 Transverse (left) and longitudinal (right) ultrasonographic images of zone 3B, obtained using a standoff pad. The arrows indicate a type 3 core lesion (traced on the transverse image) of the superficial digital flexor tendon (SDFT) on both views. The fiber alignment score of the target path of injury is 3. DDFT, Deep digital flexor tendon; MIZ-ES-3; maximal injury zone type or echo score of 3; MIZ-FAS, maximal injury zone fiber alignment score of 3.
Category V
Category V injuries typically have substantial MIZ-CSA or T-CSA enlargement with focal hypoechoic, anechoic, or both types of lesions. T-TS is greater than 3. This category has been arbitrarily associated with moderate tendon or ligament injury. The range of % T-lesion to qualify for category V varies depending on the number of zones included in arriving at the “total” (Table 16-2).
TABLE 16-2 Category V T-Lesion
| ZONES USED FOR TOTAL (NO.) | T-LESION (%)* |
|---|---|
| 11 | 11%-20% |
| 6 or 7 | 16%-25% |
| 5 | 21%-30% |
| 3 | 26%-35% |
* All have a total type or echo score ≥3.
Many horses with category V or VI injuries or reinjuries exhibit lameness in the early stages, but many category III and IV injuries are not associated with lameness.
A 3-year-old STB pacer, colt, developed swelling of the left fore SDFT after racing 1 week earlier and had previously sustained injury as a 2-year-old. The midmetacarpal region was slightly swollen (1/5) with moderate SDFT thickening (3/5), sensitivity to direct digital palpation (2/5), slight heat (1/5), and slight lameness (2/5). Ultrasonographic examination revealed a type 2, focal, hypoechoic lesion in the lateral border of the SDFT in zone 2A (Figure 16-39). Computer analysis of the left fore SDFT documented hypoechoic or anechogenic lesions along the lateral border in six of the seven zones (Figure 16-40). Zone 2A was designated the maximal injured zone because it had the lesion with the largest CSA (37%). The MIZ-CSA of 166 mm2 was 47% larger than the same zone of the contralateral normal SDFT. T-CSA of the seven zones was 1179 mm2, 31% greater than the contralateral SDFT. Additional measurements included T-TS of 11, T-FAS score of 8, and % T-lesion of 22% (i.e., category V). Unlike many newly injured tendons or ligaments with similar T-TS and T-FAS scores, this reinjured SDFT had a difference in these scores. This may serve as a means to identify newly injured versus reinjured structures ultrasonographically.
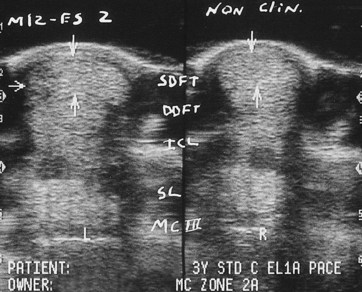
Fig. 16-39 Transverse ultrasonographic images of zone 2A obtained using a standoff pad; the clinically abnormal limb is on the left and the clinically normal limb (non-clin) is on the right. The left (L) image (lateral to the left) demonstrates a type 2 lateral border lesion of the superficial digital flexor tendon (SDFT; horizontal arrow). Vertical arrows mark the palmar and dorsal borders of the SDFTs. The lateral border of the right (R) forelimb is to the right. DDFT, Deep digital flexor tendon; ICL, accessory ligament of the DDFT; MIZ-ES 2, maximal injury zone type or echo score of 2.
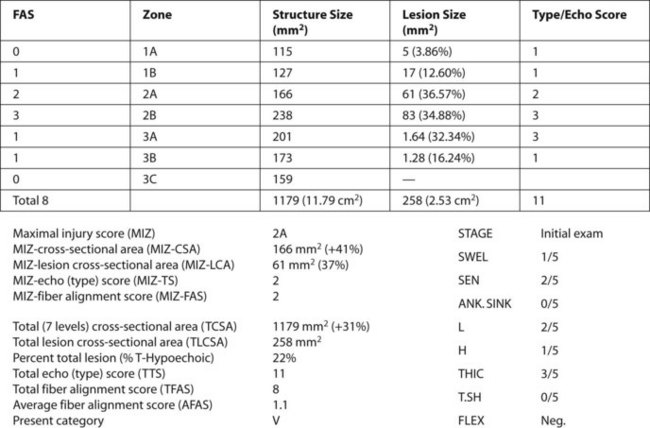
Fig. 16-40 A computer graphic of the left metacarpal region of the same horse as Figure 16-39 shows seven data points for quantitative evaluation. The superficial digital flexor tendon is 31% larger than the normal limb, has a 22% T-lesion, a T-echo or type score of 11, a T-fiber alignment score of 8, and an average fiber alignment score of 1.1. The maximal injury zone is 2A. The overall category of fascicle compromise is V. ANK. SINK; Ankle sinking; FLEX, flexion; H, heat; L, lameness; SWEL, swelling; THIC, Thickening; T.SH, tendon sheath.
Category VI
Category VI injuries have substantial MIZ-CSA or T-CSA enlargement with more extensive hypoechoic or anechoic lesions than category V. The range of % T-lesion to qualify for category VI varies depending on the number of zone used to determine the “total” (Table 16-3).
TABLE 16-3 Category VI T-Lesions
| ZONES USED FOR TOTAL (NO.) | T-LESION (%)* |
|---|---|
| 11 zones | >20% |
| 6 or 7 zones | >25% |
| 5 zones | >30% |
| 3 zones | >35% |
* All have a total type or echo score ≥3.
A 4-year-old TB racehorse gelding developed swelling of the left fore SDFT after a race 6 days earlier. Physical examination revealed slight swelling (2/5), moderate SDFT thickening (3/5), slight sensitivity to direct digital palpation (2/5), slight heat (2/5), and low-grade lameness (2/5). A large type 3 anechoic lesion of the lateral half of the SDFT was seen in zone 2B, the maximal injured zone (MIZ-LCA 92 mm2 representing 54% of the tendon CSA). The MIZ-CSA was 114% larger than the contralateral normal zone 2B SDFT (see Figure 16-15). Six of the seven zones had hypoechogenic or anechogenic contiguous fiber bundles, with a 65% increase compared with the contralateral SDFT. T-LCSA was 300 mm2, resulting in a 28% T-lesion. T-TS (14) and T-FAS (14) were the same, a common finding in newly injured tendons, although not acute SL injuries.
Summary
Tendon and ligament injuries can be graded from 1 to 6 to reflect the severity of injury. Advantages of using quantitative assessment in conjunction with clinical findings and qualitative evaluation include the following:
Exceptions
As with most attempts to categorize medical injuries, exceptions almost always are possible. The following are three common exceptions to quantitative categorization of tendon and ligament injuries:
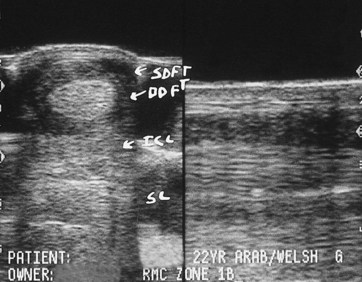
Fig. 16-41 Transverse (left) and longitudinal (right) ultrasonographic images of zone 1B obtained with a standoff pad. The borders of the superficial digital flexor tendon (SDFT) are not defined, and most of the echoes present represent hematoma. The SDFT was completely ruptured. DDFT, Deep digital flexor tendon; ICL, accessory ligament of the DDFT; SL, suspensory ligament.
Clinical Applications
If clinical evidence of swelling or thickening, with or without lameness, is present, the basic objective of an ultrasonographic evaluation is to determine the cause. Every effort must be made to determine whether tendons and ligaments are normal or abnormal and whether the lameness can be directly attributed to a soft tissue abnormality. Lameness may be visible only at high speeds in a racehorse or during special gait movements in a high-level dressage horse. In some instances the ultrasonographic data are insufficient to confirm the suspected cause, especially in subtle injury, although thorough evaluation and serial ultrasonographic examinations may provide clues.
Incidental abnormalities may be identified that have no bearing on the lameness or represent old, stable injuries of no clinical significance. Careful identification of these abnormalities and serial ultrasonographic monitoring may determine their clinical significance. Sometimes other imaging techniques, such as radiography, nuclear scintigraphy, or MRI, also are required to completely characterize an injury process. For example, evaluation of SL insertion injuries should also include radiological assessment.
Timing of Ultrasonographic Examinations: When to Scan
Timing of the initial ultrasonographic examination is critical. A clinician may be requested to examine a limb within hours of an injury. Peritendonous edema may obscure fiber damage because of acoustic enhancement, and the continued release of destructive enzymes may result in further ongoing fiber injury. Thus an examination shortly after an injury may not reveal the true extent of fiber damage. Ideally, an ultrasonographic evaluation should be delayed until at least 48 to 72 hours after the injury. If an ultrasonographic examination is performed before this time, the time after injury should be recorded, exercise restricted to walking, and symptomatic therapy instituted. Physical and ultrasonographic evaluations should be repeated after an additional 72 hours.
Clinically significant hypoechoic, anechoic, or both types of lesions may be seen in an injury less than 72 hours old. The areas of reduced echogenicity may represent a combination of hemorrhage (seroma), edema, and fiber bundle injury. The diagnostic dilemma at this stage is that the clinician cannot accurately determine the relative contribution of each. It should not necessarily be assumed that the hypoechogenic areas only represent fiber bundle injury. In most horses this assumption is true, but not always. We administer symptomatic antiinflammatory treatment and advise complete stall rest (exercise level 0) or limited hand walking (exercise level 1A) for 14 to 30 days, followed by an ultrasonographic reevaluation. (The exception to this advice would be if tendon splitting surgery were the treatment of choice to attempt to decompress a core lesion.) When the horse is reexamined, persistent hypoechogenic areas represent fiber bundle compromise, because most inflammatory edema and hemorrhage will have resolved. The severity of the injury can now be determined, and we refer to this as the baseline evaluation. The baseline evaluation often reveals the same or increased severity of injury compared with the initial scan (especially in core lesions caused by enzymatic degradation of damaged fiber bundles or pressure necrosis).
As an example, we can compare ultrasonographic images of a SDFT injury after 24 hours and after 22 days. The initial examination determined that the SDFT was 32% larger than the normal contralateral limb and had a 17% T-lesion (category V), a T-TS of 17, and a T-FAS of 16. After symptomatic therapy and a reduction of exercise to exercise level 1A, the baseline scans (22 days later) revealed a 12% increase in size of the SDFT compared with the normal limb, a 13% T-lesion (now category IV), a T-TS of 10, and a T-FAS of 12. The apparent decrease in severity was from resolution of the inflammatory response and absorption of the seroma. The baseline data represent the actual severity of fiber bundle compromise and serve as the starting point for rendering prognosis for intended use, treatment programs, and long-term rehabilitation exercise regimens.
Serial Ultrasonographic Examinations as Part of Case Management
Serial ultrasonographic examinations are best performed when it is anticipated that the exercise level may be increased. This justifies the examination to an owner or trainer. In addition to the ultrasonographic assessment, a clinician must always consider the physiological principles of tendon and ligament healing and the necessary physiological time for healing for the severity of an injury before advising exercise level increases. With time and as quantitative ultrasonographic analysis is more commonly used to evaluate tendon and ligament repair, more definitive recommendations will develop concerning convalescent time based on the severity and location of an injury and the intended athletic function of the horse. The same applies to the quality of the repair. Horses destined for light work will be able to perform with a less than perfect repair, but racehorses and other high-level athletes will require optimal repair and a reasonable time to give the best chance for return to athletic use without reinjury.
During rehabilitation a qualitative ultrasonographic evaluation of the clinically injured tendon is done to detect obvious lesions, evidence of reinjury, restricting peritendonous tendon sheath fibrosis, or restriction by the PAL. Objective, or quantitative, ultrasonographic assessments should also be determined. Guidelines for an optimum chance to return to racing include the following23:
Nonetheless, even a perfectly healed tendon or ligament injury can be reinjured. Reinjury is especially common in TB racehorses. However, if the repair is of poor quality, reinjury is likely, and these horses should be held back from active training until healing has improved. Decision making is more accurate when it is based on ultrasonographic evaluation and consideration of necessary physiological time for intended use than when relying on clinical inspection.
The advantages of veterinary intervention and using quantitative ultrasonographic parameters in case management provide a means to optimize the chances of returning an injured horse to athletic usefulness and are reviewed in this clinical example. A 4-year-old TB racehorse with a left fore SDFT injury was examined 3 days after a race. The maximal injured zone was zone 2B (59% lesion), T-CSA was 1206 mm2, T-TS was 11, and T-FAS was 16. This was a 49% T-lesion (i.e., category VI). The horse was treated with a series of three external blisters and 6 months’ pasture rest, a typical theory in the early 1990s. The horse was reassessed 8 months after injury to determine whether it could return to training (exercise level 5). The tendon was tight and cold. Qualitative ultrasonographic examination indicated improvement, although abnormalities persisted, which were interpreted to be the end result of repair. Thus the trainer was wrongly advised to return to training.
In light of current knowledge, the ultrasonographic data at the time of reevaluation provided clear indication of an unstable repair. The T-CSA had increased 15% and % T-lesion decreased by only 50%, and therefore was still quite high at 22%. In addition, neither T-TS nor T-FAS met a target decrease of 75%. After 4 weeks of galloping, the horse worked at race speed (breezed) once and became lame again. An ultrasonographic evaluation identified extensive reinjury to the same tendon (i.e., category VI). Thus quantitative analysis of injuries is an extremely beneficial tool to monitor progress of tendon healing.