Legends for color insert figures
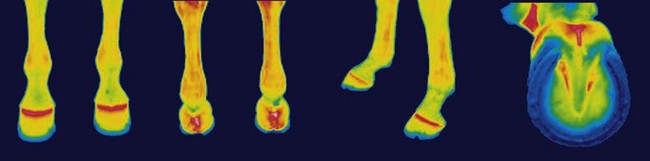
Color Plate 1 Normal dorsal, palmar, left lateral, and solar thermographic images of the distal aspect of the forelimbs of a horse. There is good symmetry between the limbs. The coronary band is the warmest area, and the rest of the hoof becomes colder in a regular pattern closer to the ground surface. The palmar image shows a normal increase in temperature between the heel bulbs. On the solar image there is a V-shaped pattern of increased temperature representing the sulci of the frog.
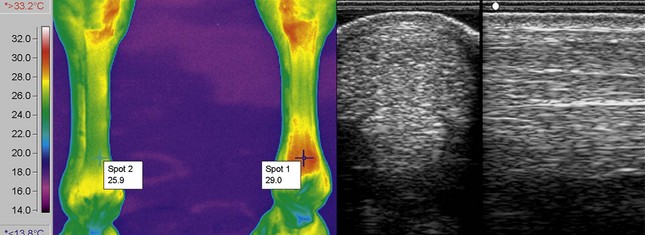
Color Plate 2 An advanced event horse with previous history of midbody superficial digital flexor tendonitis of the right forelimb. More recently peritendonous edema had developed distally in the right forelimb. Ultrasonographic images show increased cross-sectional area of the superficial digital flexor tendon, and areas of hyperechogenicity and hypoechogenicity. It was not possible to determine if there was active pathology or if this was the level of healing that had been reached from the previous injury. The palmar thermographic image shows rectangular clip artifacts on both limbs. There is a clinically significant increase in temperature of the distal palmar aspect of the right forelimb compared with the left, indicating inflammation, and thus the image suggests recurrent tendon injury.
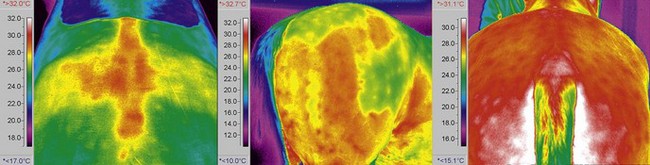
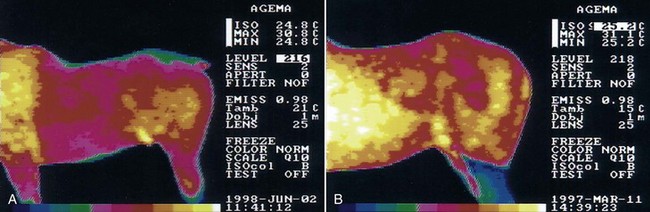
Color Plate 3 Three examples of muscle injury. The left thermographic image shows a left gluteal injury with increased heat signature. The middle image shows an increase in temperature over the biceps femoris muscle. The right image is of a chronic gluteal injury with fibrosis, which has a cooler thermal pattern.
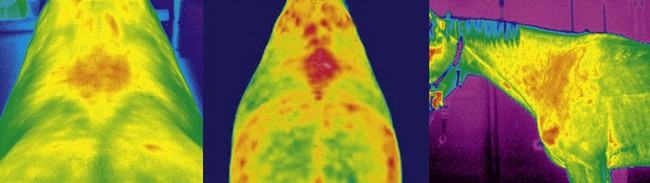
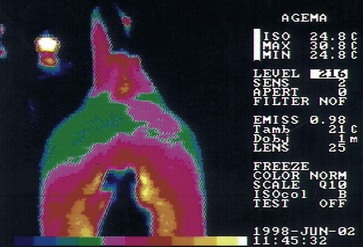
Color Plate 4 The left and middle thermographic images are caudodorsal views of the back, showing areas of increased temperature associated with clinical signs of back pain and impinging dorsal spinous processes evident radiologically. The lateral view of the neck is from a horse with marked caudal cervical facet joint osteoarthritis. There is an increase in superficial blood flow in this region.
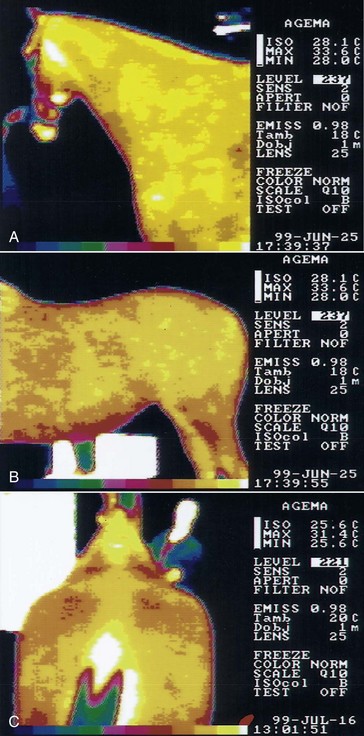
Color Plate 5 Thermographs show the appearance of normal horses. The color scale represents 5.6° C, using 10 colors; that is, each color represents about a 0.5° C change in temperature. The color bar under the image shows the colors used; those to the right side are the hottest, and those to the left are the coldest. White is above the top of the scale, and black below the scale. A, Lateral image of the head, neck, and shoulder. B, Lateral image of the thorax, abdomen, and hindquarters. C, Oblique dorsal image from behind the horse looking toward its head and neck. Temperature variation is 1° C over the neck, trunk, and hindquarters. A warm midline dorsal stripe along the back extends from the withers to the base of the tail, with symmetrical muscle temperature on either side.

Color Plate 6 Lateral image of the neck of a horse with reduced mobility in the occipitoatlantal and atlantoaxial joints. A cool line (red) runs obliquely from the region of the atlantoaxial joint caudally to the base of the neck and is 1.5° C cooler than the surrounding muscle, indicating an area of sympathetic dystonia.
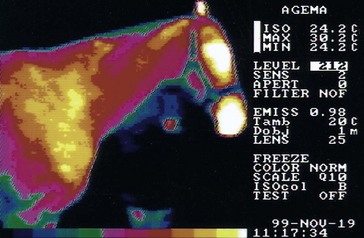
Color Plate 7 Lateral image of the neck of horse with reduced mobility in the neck. Note the cooling (red area) from the occiput back to the level of the sixth and seventh cervical vertebrae, indicating a problem involving all joints in the neck.
Color Plate 8 Lateral images of the thoracolumbar area of two horses, both showing clinically significant cooling (red area) in the musculature of the dorsal spine from the saddle region caudally. A, The vertical cranial boundary to the zone of cooling indicates that the injured area is in the region of the cervicothoracic junction, but the shoulder muscles overlying this area receive innervation from the lower neck, partly masking the muscles supplied by the upper thoracic area. B, The typical appearance of cooling in the muscle resulting from an injury to the region of the twelfth thoracic vertebra, with the cranial border of the region running obliquely down and back. This horse has been clipped, but long hair left on the hindlimb shows as an area 5° C cooler than the surface temperature of the thorax of the horse.
Color Plate 9 Dorsal image of a horse with abnormal temperature patterns of the thoracolumbar spine. Note the complete loss of the normal central stripe (compare with Color Plate 5, C), with cooling indicating the presence of reduced mobility of the entire thoracolumbar spine and pelvis. The asymmetrical nature of the temperature pattern indicates the horse is likely to move with an asymmetrical gait, resulting from increased muscle tone on the left side of the body.
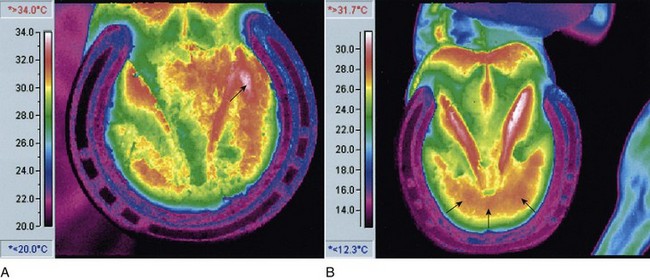
Color Plate 10 Examples of different thermographic foot patterns (solar images). A, This hoof has a medial corn (arrow), manifested as a focal hot spot (white) within an area of increased temperature. B, This hoof has subacute laminitis, with a pattern of increased temperature in the region of the tip of the distal phalanx (arrows).
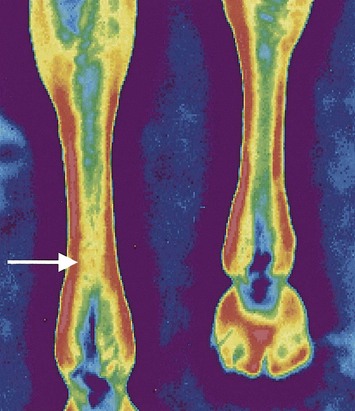
Color Plate 11 Palmar thermographic image and subsequent transverse (left) and longitudinal ultrasonographic images (see Figure 117-5) of an advanced event horse 10 days after successfully completing a Three Day Event. The horse was having a routine examination, and no clinical localizing signs were evident in the tendon. The thermogram demonstrates a focal hot spot over the left distal superficial digital flexor tendon (arrow), and the ultrasonographic images reveal a hypoechoic core lesion in the same region.
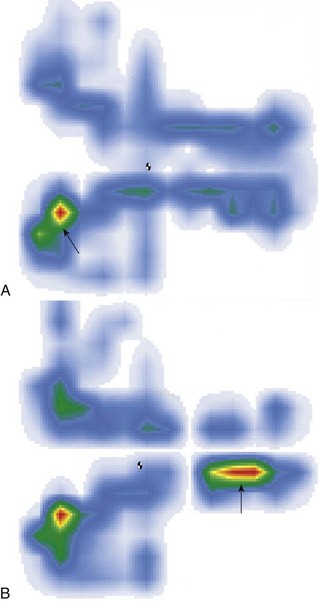
Color Plate 12 Computerized saddle pressure analysis images. Cranial is to the left, and left is to the bottom. A, This image shows a poorly fitting saddle, with a focal pressure point in the left withers region (arrow). B, This image demonstrates failure of a gel pad to alleviate the pressure point and the development of an additional pressure point caudally (arrow).