Measurement in Experimental-Type Research
Think about the nature and scope of experimental-type designs. What would you say is the purpose of data collection using these research designs? This is the question that is addressed in this chapter.
In experimental-type designs, the purpose of data collection is to learn about an “objective reality.” In this tradition, the investigator is viewed as a separate entity from that which is being studied, and an attempt is made to ensure that the researcher’s own perspective and biases are not interjected in the conduct of the research. There must be strict adherence to a data collection protocol. A “protocol” refers to a series of procedures and techniques designed to remove the influence of the investigator from the data collection process and ensure a nonbiased and uniform approach to obtaining information. These data are made more “objective” (unbiased, a singular reality known by scientific method) by the assignment of numerical values, which are submitted to statistical procedures to test relationships, hypotheses, and population descriptors. These descriptions are viewed as representing objective reality. Therefore, in experimental-type research, the process of quantifying information or measurement is a primary concern. The investigator must develop instruments that are reliable and valid or have a degree of correspondence to an objective world or truth.
In this chapter, we examine the measurement process and concepts such as reliability and validity that are critical to the experimental-type research tradition.
Measurement process
What is measurement? In research, measurement has a precise meaning. Broadly speaking, measurement can be defined as the translation of observations into numerical values or numbers. It is a vital action process in experimental-type research that links the researcher’s abstractions or theoretical concepts to concrete variables that can be empirically or objectively examined. In experimental-type research, concepts must be made operational; in other words, they must be put into a format such as a questionnaire or interview schedule that permits structured, controlled observation and measurement. The measurement process involves a number of steps that include both conceptual and operational considerations (Figure 16-1).
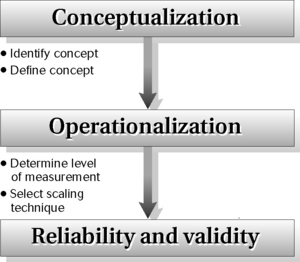
The first step in measurement involves conceptual work by the researcher. The researcher must identify and define what is to be measured. Although this may seem obvious, it is often a difficult initial first step that involves asking, “How will I conceptualize the phenomenon I want to study?” or “How will I define these concepts in words?” Consider such basic concepts as attitude, depression, anxiety, self-mastery, function, disability, wellness, quality of life, or adaptation. Each has been defined in many ways in the research literature. After the researcher identifies a concept, such as “anxiety” or “depression,” the literature must be thoroughly reviewed to decide on an appropriate definition.
The second step in measurement involves developing an operational definition of the concept. This operational step involves asking, “What kind of an indicator will I use as a gauge of this concept?” or “How will I classify and quantify what I observe?” A “measure” is an empirical representation of an underlying concept. Because, by definition, a “concept” is never directly observable, the strength of the relationship between an “indicator” and an underlying concept is critical. This relationship is referred to as “validity.” In other words, does the measurement measure what it aims to measure? Also, it is important for the indicator to measure consistently the underlying concept. The consistency of a measure is referred to as its “reliability.” The greater the reliability and validity, the more desirable is the instrument. Reliability and validity are two fundamental properties of indicators. Researchers engage in major efforts to evaluate the strength of reliability and validity to determine the desirability and value of a measure, as discussed later.
Information gathering in experimental-type research, an important action process, must begin with identifying key concepts. This step is followed by developing conceptual (lexical) and operational definitions of these concepts. On the basis of these definitions, specific indicators (scales, questionnaires, rating forms) are specified or developed. These indicators represent the source of information or data that will be collected.
Levels of measurement
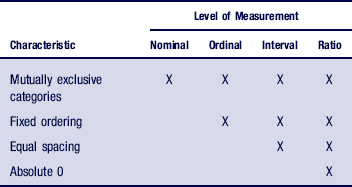
The first step in developing an indicator involves specifying how a variable will be operationalized. This action process involves determining the numerical level at which the variable will be measured. The level of measurement refers to the properties and meaning of the number assigned to an observation. There are four levels of measurement: nominal, ordinal, interval, and ratio. Each level of measurement leads to different types of manipulations. That is, the way in which a variable is measured will have a direct bearing on the type of statistical analysis that can be performed. The decision regarding the level of measurement of a variable is thus a critical component of the measurement process. It is important to understand that the way in which you measure a particular concept dictates the type of analytical approach you will be able to pursue.
 You need to collect information on a person’s age. What are some of the ways you could ask about age? You could categorize people as being either young, middle-aged, or old; you could develop categories that reflect specific ranges of ages (18–35, 36–55, 56–65, 66–75, 76+); or you could record actual ages reported or dates of birth and then calculate age in years.
The level of measurement, whether you use age categories or the full range of possible ages measured in years, will determine the types of analytical approaches you can use, as you will learn here and in Chapter 19.
Several principles are used to determine the level of measurement of a “variable.” The first principle is that every variable must have two qualities. The first quality is that a variable must be exhaustive of every possible observation; that is, the variable should be able to classify every observation in terms of one or more of its attributes.
A simple example is the concept of gender, which most often has been classically defined as either a “male” or “female” attribute. These two categories have represented the full range of attributes for the concept of gender.
The second quality of a variable is that the attributes or categories must be mutually exclusive.
There can be only a male attribute or a female attribute. An attribute cannot be both male and female.1
The second principle in determining a variable’s level of measurement is that variables can be characterized as being either discrete or continuous. A discrete variable is one with a finite number of distinct values. Again, gender is a good example of a discrete variable. Gender, as classically defined, has either a male or a female value. There is no “in-between” category. A continuous variable, in contrast, has an infinite number of values.1,2 Age (measured in years) and height (measured metrically or in feet and inches) are two examples of continuous variables in that they can be measured along a numerical continuum. It is possible to measure a continuous variable using discrete categories, such as the classification of the age variable as young, middle-aged, or old or the height variable as tall, medium, or short.
Discrete and continuous structures represent the natural characteristics of a variable. These characteristics have a direct bearing on the level of measurement that can be applied. We now examine each level in greater detail.
Nominal
Measuring gender as female or male represents the most basic, simplest, or lowest level of measurement, which is called nominal. This level involves classifying observations into mutually exclusive categories. Nominal means “name”; therefore, at this level of measurement, numbers are used, in essence, to name attributes of a variable. This level merely names or labels attributes, and these attributes are not ordered in any particular way.
Your telephone number, the number on your sports jersey, and your Social Security number are used to identify you as the attribute of the variables “person with a telephone,” an “athlete,” or a “taxpayer.” All are examples of nominal numbers.
Variables at the nominal level are discrete. For example, we may classify individuals according to their political or religious affiliation, gender, or ethnicity. In each of these examples, membership in one category excludes membership in another, but there is no order to the categories. One category is not higher or lower than another. Box 16-1 provides examples of mutually exclusive categories.
For data analysis, the researcher assigns a numerical value to each nominal category. For example, “male” may be assigned a value of 1, whereas “female” may be assigned a value of 2. The assignment of numbers is purely arbitrary, and no mathematical functions or assumptions of magnitude or ranking are implied or can be performed. Many survey analyses, conducted by telephone, mail, or face-to-face, use nominal level questions. The intent of these surveys is to describe the distribution of responses along these discrete categories. This level of measurement therefore is also referred to as “categorical” because the assignment of a nominal number denotes category membership.
A survey may provide answers to questions such as how many men versus women have low back pain and how many unemployed versus employed people have health care insurance. In these examples the nominally or categorically measured variables are “gender” and “employment.” A respondent must (and can) only belong to one gender category and one employment condition.
Ordinal
The next level of measurement is ordinal. This level involves the ranking of phenomena. Ordinal means “order” and thus can be remembered as the numerical value that assigns an order to a set of observations. Variables that are discrete and conceptualized as having an inherent order at the theoretical level can be operationalized in a rank-order format. Variables operationalized at the ordinal level have the same properties as nominal categories in that each category is mutually exclusive of the other. In addition, ordinal measures have a fixed order so that the researcher can rank one category higher or lower than another.
Income may be ranked into categories, such as 1 = poor, 2 = lower income, 3 = middle income, and 4 = upper income. Using this ordinal variable, we can say that middle income is ranked higher than lower income, but we can not say anything about the extent to which the rankings differ.
The assignment of a numerical value is symbolic and arbitrary, as in the case of nominal variables, because the distance or spacing between each category is not numerically equivalent. However, the numbers imply magnitude; that is, one is greater than the other. Because there are no equal intervals between ordinal numbers, mathematical functions such as adding, subtracting, dividing, and multiplying cannot be performed. The researcher can merely state that one category is higher or lower, stronger or weaker, or greater or lesser.
Many scales useful to health and human service researchers are composed of variables measured at the ordinal level. For example, the concept of self-rated health is ranked from 1 = very poor to 5 = excellent. Although the numbers imply a state of being in which 5 is greater than 1, it is not possible to say how much greater the distance is between responses. Also, the difference in magnitude between 5 (excellent) to 4 (very good) may be perceived differently from person to person. Thus, you must be careful not to make any assumptions about the degree of difference between numerical values.
We want to raise a caution here to remind you that ordinal data must denote mutually exclusive phenomena. A common mistake is the inclusion of the extreme points of an interval in more than one category. For example, let’s say a questionnaire asks us about our age using categories as 1–10, 10–20, 20–30, and so on. What category do you check if you are 10, 20, or 30 years old? These numbers incorrectly appear in two categories. The investigator should have specified mutually exclusive intervals, such as 1–10, 11–20, 21–30, and so on.
Interval
The next level of measurement shares the characteristics of ordinal and nominal measures but also has the characteristic of equal spacing between categories. This level of measurement indicates how much categories differ. Interval measures are continuous variables in which the 0 point is arbitrary. Although interval measures are a higher order than ordinal and nominal measures, the absence of a true 0 point does not allow statements to be made concerning ratios. However, the equidistance between points allows the researcher to say that the difference between scores of 50 and 70 is equivalent to the difference between scores of 20 and 40.
Examples of a true interval level of measurement include Fahrenheit and Celsius temperature scales and intelligence quotient (IQ) scales. In each there is no absolute 0, but there is equal distance between mutually exclusive categories.
In the social and behavioral sciences, there is considerable debate as to whether behavioral scales represent interval levels of measurement. Typically, such scales have a Likert-type response format in which a study participant responds to one of four to seven categories, such as strongly agree, agree, uncertain, disagree, or strongly disagree. Researchers who accept this type of scaling as an interval measure argue that the distance between “strongly agree” and “agree” is equivalent to the distance between “disagree” and “strongly disagree.” Others argue that there is no empirical justification for making this assumption and that the data generated should be considered ordinal. In the actual practice of research, many investigators assume such scales are at the interval level to use more sophisticated and powerful statistical procedures that are only possible with interval and ratio data. You should be aware that this issue continues to be controversial among experimental-type researchers. If you choose this type of scaling, think about the most purposive assignment of numeric levels to your response set.
Ratio
Ratio measures represent the highest level of measurement. Such measures have all the characteristics of the previous levels and, in addition, have an absolute 0 point. Income is an example of a ratio measure. Instead of classifying income into ordinal categories, as in the previous example, it can be described in terms of dollars. Income is a ratio measurement because someone can have an income of 0, and we can say that an income of $40,000 is twice as high as an income of $20,000.
Determining Appropriate Level
Table 16-1 summarizes the characteristics of each level of measurement.
Experimental-type researchers usually strive to measure a variable at its highest possible level. However, the level of measurement also reflects the researcher’s concepts. If political affiliation, gender, and ethnicity are the concepts of interest, for example, nominal measurement may be the most appropriate level because magnitude does not typically apply to these concepts.
Measurement scales
Now that we have discussed the properties of numbers, let us examine the different methods by which data are collected and transformed into numbers in experimental-type research.
Scales are tools for the quantitative measurement of the degree to which individuals possess a specific attribute or trait. Box 16-2 lists examples of scales frequently used by health and human service professionals in research.
BOX 16-2 Examples of Useful Scales
 Dyadic Adjustment Scale (measure of marital adjustment)3
Self-Rating Anxiety Scale (measure of clinical anxiety)4
Family Adaptability Cohesion Scale5
State-Trait Anxiety Scale6
Session Evaluation Questionnaire7
CES Depression Scale8
SF-36 (measure of health status)9
CES, Center for Epistemological Studies; SF, Short Form.
Scaling techniques measure the extent to which respondents possess an attribute or personal characteristic. Experimental-type researchers use three primary scaling formats: Likert approach to scales, Guttman scales, and semantic differential scales.10 Each has its merits and disadvantages. The researcher who is developing a scale needs to make basic formatting decisions about response-set structure, whereas the researcher selecting an existing scale must evaluate the format of the measure for his or her project.
Likert-Type Scale
In the Likert-type scale, the researcher develops a series of items (usually between 10 and 20) worded favorably and unfavorably regarding the underlying construct that is to be assessed. Respondents indicate a level of agreement or disagreement with each statement by selecting one of several response alternatives (usually five to seven). Researchers may combine responses to the questions to obtain a summated score, examine each item separately, or summate scores on specific groups of items to create subindices. In developing a Likert-type format, the researcher must decide how many response categories to allow and whether the categories should be even or odd in number. Even choices force a positive or negative response, whereas odd numbers allow the respondent to select a neutral or middle response.
The Dyadic Adjustment Scale is an example of a Likert-type scale with several even-numbered response formats. The first set (22 separate items) has six response categories: always agree, agree a lot, agree a little, disagree a little, disagree a lot, and always agree. The instructions read: “Most persons have disagreements in their relationships. Please indicate the approximate extent of agreement or disagreement between you and your partner for each item on the following list.”3
In contrast, the Family Adaptability and Cohesion Scale, which measures family function, is an example of a scale that allows a neutral response by structuring responses into five ordinal categories: almost never, once in a while, sometimes, frequently, and almost always. The “sometimes” category is the middle response and receives a score of three.5
Social science researchers frequently use Likert-type scaling techniques because they provide a closed-ended set of responses while still giving the respondent a reasonable range of latitude. As mentioned, Likert-type scales may be considered ordinal or interval, depending on what is being measured and which analytical procedures are selected. A disadvantage of Likert-type scaling is that there is no way to ensure that respondents have the same understanding of the magnitude of each response.
Guttman Scale
The Guttman scale is referred to as “unidimensional” or “cumulative.”1 The researcher develops a small number of items that relate to one concept. The items form a homogeneous or unitary set and are cumulative or graduated in intensity of expression. In other words, the items are hierarchically arranged so that endorsement of one item means an endorsement of those items below it, which are expressed at less intensity. Knowledge of the total score is predictive of the individual’s responses to each item.
Consider a series of items to measure level of political tolerance.11 If a person answers “no” to each of the three items in Box 16-3, he or she is most tolerant. On the other hand, a person who answers “yes” to all three questions is the least tolerant. Another person who answers “no” to item 2 will probably answer “no” to item 1.
Thus, in the Guttman approach to scaling, items are arranged according to the degree of agreement or intensity in ascending order, such that each subsequent response along the scale assumes the previous one.
Semantic Differential Scale
The semantic differential scale is usually used for psychological measures to assess attitudes and beliefs.12 The researcher develops a series of rating scales in which the respondent is asked to give a judgment about something along an ordered dimension, usually of seven points. Ratings are “bipolar” in that they specify two opposite ends of a continuum (e.g., good–bad, happy–sad). The researcher sums the points across the items.
The Session Evaluation Questionnaire is an example of a semantic differential scale.7 The scale measures two constructs, “depth” and “smoothness,” related to clients’ perceptions of clinical counseling sessions in which they have participated. The scale also measures two postsession mood constructs, “positivity” and “arousal.” The scale includes 24 items, 12 each for the two sections. One item related to the session reads:
The respondent is instructed to place an X in the space that most accurately depicts his or her feelings.
Semantic differential scaling is most useful when natural phenomena can be categorized in opposite or contrary positions. However, it limits the range of responses to a linear format.
Confidence in instruments
In selecting a scale or other type of measurement, the researcher is concerned about two issues: (1) whether the instrument consistently or reliably measures a variable and (2) whether the instrument represents an adequate or valid measure of the underlying concept of interest.
Reliability
Reliability refers to the extent to which you can rely on the results obtained from an instrument. You will want to be assured that if you were to measure the same variable in the same person in the same situation over and over again, your results would be the same. More formally, reliability refers to the degree of consistency with which an instrument measures an attribute. Reliability is an indicator of the ability of an instrument to produce similar scores on repeated testing occasions that occur under similar conditions. The reliability of an instrument is important to consider to ensure that changes in the variable under study represent observable variations and not those resulting from the measurement process itself. If an instrument yields different scores each time the same person is tested, the scale will not be able to detect the “objective” value or truth of the phenomenon being examined.
It is easy to understand the concept of reliability when you consider a physiological measure such as a scale for weight. If you weigh an individual on a scale, you can expect to derive the same weight on repeated measures if that subject stepped on and off the scale several times without doing anything to alter weight between measurements. Instruments such as a weight scale or blood pressure cuff must be consistent to assess an accurate value that approximates a “true” physiological value for an individual. Consider an example involving human behavior to see how this principle applies.
Suppose you are interested in measuring the level of depression in a group of inpatients who are in an experimental intervention program. You want to determine whether depression scores decline after participation in the program. You need to administer a depression scale before beginning the program and after its conclusion. Thus, it is important that the depression measure you select is reliable. If the measure is reliable, any change in depression scores that are observed after the intervention will indicate a “true” alteration in level of depression rather than a variation on a scale.
However, there is always some error in measurement. A scale may not always be completely accurate. Suppose you measure a person’s weight when he or she is wearing shoes, then the next time you measure the person’s weight without shoes. As another example, consider a tape measure that is not precisely held at the same place for each measure. This error is “random” in that it occurs by chance, and the nature of the error may vary with each measurement period.
Reliability represents an indication of the degree to which such random error exists in a measurement. A formal representation of random error in measurement is expressed by examining the relationship among three components: (1) the “true” score (T), which is unknown; (2) the observed score (O), which is derived from an instrument or other measurement process; and (3) an error score (E). An observed score is a function of the “true” score and some error. This tripartite relationship can be expressed as follows:

As you can see in this equation, the smaller the error term (E), the more closely O will approximate T. The standardization of study procedures and instruments serves to reduce this “random error” term. In a questionnaire, for example, a question that is clearly phrased and unambiguous will increase its reliability and decrease random error.
You want to know whether your client is feeling depressed. You ask, “How do you feel today?” The client answers, “Fine,” and then begins to weep. Obviously the client and you do not have the same question in mind, even though you both heard the same words. If you ask the client, “Do you feel depressed today?” you may be more likely to obtain the desired information. Although both questions refer to the same psychological state to you, the second question eliminates room for interpretation by the client. The client understands exactly what you are asking and gives the answer that you seek.
The point just illustrated holds true for measurement as well. Reduction of ambiguity decreases the likelihood of misinterpretation and thus error. Also, the longer the test or the more information collected to represent the underlying concept, the more reliable the instrument will become.
If your client answers that he or she is not depressed but breaks down in your office and weeps, you may experience some cognitive dissonance. However, if you administer a scale to the client that asks multiple questions, all of which measure aspects of depressive behavior, you may be able to obtain a more accurate picture of your client’s mood.
Because all measurement techniques contain some random error (error that occurs by chance), reliability can exist only in degrees. The concept of reliability is thus expressed as a ratio between variation surrounding T (a “true” score) and variation of O (an observed score), as follows:

Because we can never know the “true” score, reliability represents an approximation to that “objective” reality.
Reliability is expressed as a form of a correlation coefficient that ranges from a low of 0 to a high of 1.00. The difference between the observed coefficient and 1.00 tells you what percentage of the score variance can be attributed to error. For example, if the coefficient is 0.65, then 0.35 reflects the degree of inconsistency of the instrument, and 65% of the observed variance is measuring an individual’s “true” or actual score.
To assert reliability, experimental-type researchers frequently conduct statistical tests. These tests of reliability focus on three elements: stability, internal consistency, and equivalence (Table 16-2). The choice of a test depends on the nature and intended purpose of the instrument.
TABLE 16-2
Three Elements in Tests of Reliability
| Element | Applicable Tests |
| Stability | Test–retest |
| Internal consistency | Split-half technique |
| Cronbach’s alpha | |
| Kuder-Richardson formula | |
| Equivalence | Interrater reliability |
| Alternate forms |
Stability
Stability involves the consistency of repeated measures. Test–retest is a reliability test in which the same test is given twice to the same subject under the same circumstances. It is assumed that the individual should score the same on the test and retest. The degree to which the test and retest scores correlate (or are associated) is an indication of the stability of the instrument and its reliability. This measure of reliability is often used with physical measures and paper-and-pencil scales. The use of test–retest techniques is based on the assumptions that the phenomenon to be measured remains the same at two testing times and that any change is the result of random error.
Usually, physiological measures and equipment can be tested for stability in a short period, whereas paper-and-pencil tests are retested in a 2-week to 1-month period. This approach of measuring reliability is not appropriate for instruments in which the phenomenon under study is expected to vary over time. For example, in the measurement of mood or any other transitory characteristic, we anticipate variations in the “true” score at each repeated testing occasion. Thus, a test–retest approach is not an appropriate way of indicating stability.
Tests of Internal Consistency
Also referred to as “tests of homogeneity,” tests of internal consistency are primarily used with “paper-and-pencil” instruments. Note that we put quotation marks around the term “paper and pencil” to denote that it does not refer to the material of the instrument but rather to tests in which multiple items are completed by respondents. These may be delivered electronically as well. In these tests, the issue of consistency is internally examined in relation to a composite score.
In the split-half technique, instrument items are split in half, and a correlational procedure is performed between the two halves. In other words, the scores on one half of the test are compared with the scores on the second half. The higher the correlation or relationship between the two scores, the greater is the reliability. Tests are split in half by comparing odd-numbered with even-numbered responses, by randomly selecting half of the items, or by splitting the instrument in half (e.g., questions 1 through 10 are compared with questions 11 through 20). This technique assumes that a person will consistently respond throughout a measure and therefore demonstrate consistent scores between the halves.
Cronbach’s alpha test and the Kuder-Richardson formula are two statistical procedures often used to examine the extent to which all the items in the instrument measure the same construct. The statistic generated is a correlation coefficient between the values of 0 and +1.00 in which a 0.80 correlation is interpreted as adequate reliability. An “80% correlation” basically means that the test is consistent 80% of the time and that error may occur 20% of the time. A score close to +1.00 is most desirable because it indicates minimal error and maximal consistency.
Equivalence
There are two tests of equivalence: interrater reliability and alternate forms. The interrater reliability test involves the comparison of two observers measuring the same event. A test is given to one subject but scored by two or more raters, or the same rater observes and rescores an event on two occasions. The total number of agreements between raters is compared with the total number of possible agreements and multiplied by 100 to obtain the percentage of agreement. Eighty percent or more is considered to be an indication of a reliable instrument. As in the other tests of reliability, a higher score is more desirable.
Consider the hypothetical data in Table 16-3. There are four potential chances for agreement, but only two occur among the raters. Agreement occurs in the ratio of 2 to 4 (2/4), or 1 to 2 (1/2), so interrater reliability is 50%.
The alternate forms test, or “parallel forms” test, involves the comparison of two versions of the same “paper-and-pencil” instrument. In this case, two equivalent forms of one test are administered to one subject on the same testing occasion. The use of this technique depends on the availability of two equivalent versions of a form.
Validity
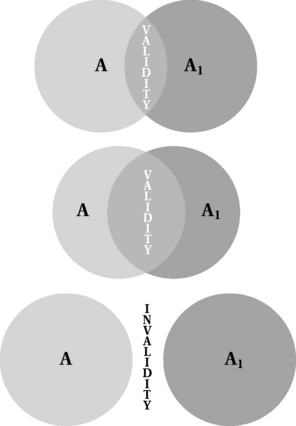
An indicator or measure must not only be reliable but valid as well. Validity addresses the critical issue of the relationship between a concept and its measurement. It asks whether what is being measured is a reflection of the underlying concept. Figure 16-2 diagrams three degrees of validity and highlights how instrumentation (A1) only approximates the underlying concept (A). The closer an instrument comes to representing the “true” definition of the concept, the more valid the instrument.
Researchers argue whether the Wechsler Adult Intelligence Scale, the traditional indicator of adult intelligence, actually measures what it purports to and whether it is valid for different cultures and populations.13 Because researchers can only approximate a perfectly valid instrument, validity is a question of degree, as with reliability, and may vary with the intended purpose of the instrument and the specific population for whom it is developed or intended. Thus, the Wechsler Adult Intelligence Scale may be a valid measure of intelligence as it has been traditionally defined for white, middle-class Americans, but it is an invalid measure of intelligence for groups such as rural and ethnic minorities and those whose first language is not English.
Unlike reliability, the validation of an instrument occurs in many stages, over time, and with many populations. For example, a scale that assesses problem solving that is validated with college students may need further validation before being used with middle-aged and older persons. A scale that measures cognitive status in an older urban group may not be valid for rural Latino elders. Also, a scale that is valid is necessarily reliable, but the opposite may not be true. In other words, a scale may reliably or consistently measure the same phenomenon on repeated occasions, but it may not actually measure what it is intended to assess. Thus, validation of an instrument is extremely critical to ensure some degree of accuracy in measurement.
Whereas reliability is a measure of the random error of the measurement process itself, validity is a measure of systematic error, or “nonrandom error.” Systematic error refers to a systematic bias or an error that consistently occurs.
A weight scale that systematically weighs individuals 5 pounds heavier than an accurate scale is an example of systematic error and an invalid measurement.
A measure that systematically introduces error indicates that it is a poor indicator of the underlying concept it intends to represent. Validity is therefore inversely related to the amount of systematic error present in an instrument; the smaller the degree of systematic error, the greater is the validity of the instrument.
There are three basic types of validity that examine the degree to which an indicator represents its underlying concept: content, criterion, and construct.
Content Validity
Content validity is sometimes referred to as “face validity.” It is considered the most basic form by which an instrument is validated. This type of validity addresses the degree to which the indicator reflects the basic content of the phenomenon or domain of interest. Ideally, the steps to obtain content validity include (1) specification of the full domain of a concept through a thorough literature search and (2) adequate representation of domains through the construction of specific items.
If all domains are known, the investigator can sample items that reflect each domain. The problem with content validity is twofold. First, for most concepts of interest to health and human service professionals, there is no agreed-on acceptance of the full range of content for any particular concept. Concepts such as poverty, depression, self-esteem, and physical function have been defined and conceptualized in many ways, but there is no unified understanding of the domains that constitute any of these concepts. Second, there is no agreed-on “objective” method for determining the extent to which a measure has attained an acceptable level of content validity. One way to obtain some degree of assuredness of content validity is to submit constructed items or drafts of a scale for review by a panel of experts. This review process can be repeated until agreement has been obtained as to the validity of each item. However, this process does not yield a coefficient or other statistical indicator to discern the degree of agreement or the extent to which an instrument is content valid.
Criterion Validity
Criterion validity involves demonstrating a correlation or relationship between the measurement of interest and another instrument or standard that has been shown to be accurate. Central to the validation effort is that scores on a given construct should correlate with conceptually related constructs. Two types of criterion validity are concurrent and predictive.
Concurrent: In concurrent criterion validity, there is a known standardized instrument or other criterion that also measures the underlying concept of interest. It is not unusual for researchers to develop instrumentation to measure concepts, even if prior instrumentation already exists.
Assume you are interested in developing your own measure of self-esteem. To establish concurrent validity, you will administer your instrument along with an accepted and validated instrument measuring the same concept to the same sample of individuals. The extent of agreement between the two measures, expressed as a correlation coefficient, will tell you whether your scale is accurately measuring the same construct measured by the validated scale.
The problem, however, is that this form of validity can only be used if another criterion exists. Also, the concurrent form is only as good as the validity of the selected criterion.
You have developed a measure of physical functioning that you believe is more precise than existing measures. You are interested in examining the relationship between your measure and previously evaluated measures, and you expect a strong relationship because they should be measuring the same underlying construct.
Predictive Validity: Predictive validity is used when the purpose of the instrument is to predict or estimate the occurrence of a behavior or event. For example, this type of validity can be used to evaluate whether an instrument designed to assess risk of falls can predict the incidence of falling. Agreement between the instrument and the criterion (a fall, or an established assessment of the risk of falling) is indicated by a correlation coefficient.
Discriminant
To establish validity, it is important to show not only that the instrument is associated with measures of the same concept but also that it is not associated with measures of concepts that are different. In establishing discriminant validity, you first need to hypothesize what measures you expect to be different from your instrument. Then you examine the level of agreement between the instrument and the criterion, as indicated by a correlation coefficient. In this case, you would want to see a correlation coefficient that is small and not statistically significant.
Construct Validity
Construct validity represents the most complex and comprehensive form of validation. Construct validity is used when an investigator has developed a theoretical rationale underlying the test instrument. The researcher moves through different steps to evolve supporting evidence of the relationship of the test instrument to related and distinct variables. Construct validity is based on not only the direct and full measurement of a concept, but also the theoretical principles related to the concept. Therefore, the investigator who attempts construct validity must consider how the measurement of the selected concept relates to other indicators of the same phenomenon.
The researcher who is developing a measure of depression will base a set of expectations of the measurement outcome on sound theory about the nature of depression. If the instrument is a self-report of depression based in cognitive-behavioral theory, the researcher will hypothesize that certain behaviors and thoughts, such as lethargy, agitation, appetite changes, and melancholia, will frequently be found in subjects who score as “clinically depressed.” Thus, the relationship of the scale score to other expected relationships will be measured as an indicator of construct validity.
Validating a Scale
There are many complex approaches to construct validity, including various types of factor analysis (see Chapter 19) and confirmatory structural equation modeling.
When validating a scale, it is important to consult with a psychometrician or statistician who is familiar with measurement development. The validation of a scale is ongoing; each form (content, criterion, and construct) builds on the other and occurs progressively or sequentially.
Considerations in selecting a measure
A basic action process in experimental-type research is selecting a measure to use in a study. A vast array of measures is available to health and human service researchers, and the selection of one measure over another should be based on a conscious recognition of the type of information that each measure will yield and its relative strengths and limitations.
Purpose of Assessment
In choosing a measure for your study, you first must match the purpose of your investigation to the intent of a particular instrument. This is the most elemental step in choosing a measure. You must clearly articulate what you want to measure and why.
Suppose you want to assess the physical function of older adults who enter your subacute rehabilitation facility after having a stroke. You must decide on the definition of physical function, which aspects of physical function you want to measure, and why. Assume you are introducing new clinical treatment guidelines for helping people who have experienced strokes with daily ambulation, and you want to be able to document significant improvements in mobility functioning at discharge. There are many measures of physical function,14 but not every measure will match your specific purpose and the domain you need to target. You will need to select a measure that includes the ambulation items specific to your treatment focus and that rates physical performance using a response set that is sensitive to detect the type of changes in function that you are hoping will occur. For example, a measure that rates functional difficulty using a three-point scale (1 = no difficulty, 2 = some difficulty, 3 = cannot do at all) may not adequately detect small but clinically important changes. However, a measure that scores level of dependence with more response options, such as a 7-point scale (7 = complete independence to 1 = complete dependence), may offer greater specification and opportunity to detect change before (pre) and after (post) rehabilitation.
The purpose of measuring a particular phenomenon is the initial driving force for selecting an instrument.
Psychometric Properties
After you have clearly articulated your study’s purpose, you can focus on whether a particular instrument conforms to adequate standards of measurement. It is important to use measures that have stable characteristics and that have demonstrated reliability and validity, rather than use a tool you developed yourself or a measure that lacks adequate psychometric properties for the population you intend to study.15 Given that the validation process occurs over time in multiple studies, it is important to examine what level of validation has been established for the measure you are selecting and for which populations. You can feel somewhat secure in using a new measure if it performs adequately compared with a well-tested measure, even if only convergent validation evidence is available. However, it may be unwise to use a tool for which only content validity has been established.
Population
The choice of a particular measure also largely depends on the study population you plan to recruit and enroll in your study. Diverse personal characteristics (e.g., age, cognitive status, background) may affect your decisions about the measure and the approach you choose to obtain information about the phenomenon of interest.
You want to assess mobility of individuals with severe cognitive impairment undergoing rehabilitation for stroke. Self-report of mobility abilities may not yield reliable ratings. Also, the level of exposure of a particular person or cultural group to the items included in a tool may be important to evaluate. Of this present cohort, a woman in her 90s may not have had prior experience with financial management (a typical question in measures assessing activities of daily living), so questioning her on level of performance in this area may not be particularly valid. The use of a standard measure that includes these items would therefore provide an inconclusive understanding of actual performance and potential capabilities.
Also of concern is whether the measure has a “floor” or “ceiling” effect, such that it is not possible to obtain an adequate rating.
Most measures do not differentiate the types and levels of difficulty that may be present among healthy elder persons who do not experience difficulties or dependencies in traditional items of daily function that are assessed. Thus, there is usually a ceiling effect such that this population scores at the highest level, and a measure may not satisfactorily differentiate among this well elder group.
Likewise, for highly impaired persons who require total assistance in basic areas of daily activities, traditional measures may not sufficiently assess the components of a particular task that these persons can perform. Thus, there is a floor effect such that this population scores at the lowest level of the scale, with little differentiation possible within this group.
Another population-related consideration is whether to select a measure that is useful for the population at large or a measure that is specific to a particular diversity issue.
Suppose you are interested in studying stress associated with providing care to persons with a severe impairment. You will need to decide between a general measure of stress or one that includes items specific to the experience of caregiving. A general measure may be preferred if your purpose is to compare caregiver and noncaregiver stress levels. However, if your purpose is to understand the specific aspects of caregiving that serve as stressors, a condition-specific stress measure would be more useful.
Information Sources
Another consideration in selecting a measure is the source from which evaluative judgments will be obtained. Four basic sources of information are self-report, proxy, direct observation, and chart extraction (e.g., medical records, claims data). Each source has its own strengths and limitations. Your decision of source from which to obtain information will be influenced not only by your purpose but also by your resources (e.g., time, money, expertise).
Self-Report
Self-report involves asking persons to rate themselves using a standard metric. Self-report information can be obtained by a face-to-face or telephone interview or through a mail survey. The use of a self-report approach usually does not require special expertise, although some interviewer training is helpful. This is a quick, relatively simple, and cost-effective approach for obtaining information.
Self-report has some limitations, however, and may not be useful for all study populations.
If you are interested in obtaining functional status information, research has shown that community-living older people tend to overestimate their abilities, underestimate their level of dependence, and may be unaware of unsafe interactions in carrying out daily activities within their living environment.14 Also, poor sense of personal mastery and feeling depressed may lead to underestimating performance capabilities.
Persons with cognitive impairment also tend to be “unreliable” sources of information about their health and functioning, often reporting greater functional ability than that reported by their caregivers.
Also, the test–retest reliability of self-report is unclear; certain domains of living may be more amenable to self-report than other domains, and the validity and reliability of obtaining self-report are unclear when using different modalities (e.g., telephone interview vs. home visit).
Nevertheless, increasing evidence supports the important contribution of the self-report perspective to derive a comprehensive understanding of a person’s health and well-being. Self-reports on health and function are highly predictive of actual performance, mortality, psychological well-being, and future expenditures for health care.16
Proxy
The use of a proxy, or informant, is another important source of information, particularly in the clinical setting. This approach involves asking a family member, health professional, or an individual familiar with the targeted person to rate that person on the phenomenon of interest using a standard measure. As in self-report, ratings from a proxy may be obtained through a face-to-face encounter, telephone interview, or mail survey. Proxies play a critical role in obtaining health information, particularly for individuals who may not be able to self-report or evaluate their performance accurately.
At issue, however, is the validity of informant responses and the specific factors that may inflate or otherwise influence proxy ratings. Proxy ratings may be affected by factors such as the relationship of the informant to the person, gender, level of depressive symptoms, or coresidence.17 Although the specific role of gender, education, age, and relationship is unclear, evidence suggests that coresidency may enhance the accuracy of proxy responses. Nevertheless, families who are providing care to the target group and who are burdened or stressed may be more likely to report more impairments relative to the person’s self-appraisal.
Proxy responses can be useful, and subjects and proxies tend to agree in most areas.
Direct Observation
Measures that use direct observation of real-time performance tend to be task oriented and highly structured, and they yield numerical ratings. That is, the performance of each step or component of an activity is observed and rated for its successful completion along a number of dimensions, including the time for activity completion and the need for verbal and tactile cueing. Performance-based measures tend to yield more precise judgments as to the particular aspects of an activity that may or may not be able to be performed independently or safely. These measures also offer a more exacting assessment tool to guide intervention and may be especially useful when self-report and proxy are not possible or not good choices.
Nevertheless, direct observation does have several important limitations. First, performance-based measures need to be administered by highly trained raters and thus are often more costly to administer. Second, direct assessment of a specific area of activity may require special setup or stations in a clinic (e.g., use of the cafeteria) or home setting that may not be feasible to implement. Third, this approach can be time-consuming, even though only a few select skill areas may be observed. Fourth, observing an individual simulate an activity in one setting may still not provide an assessment of how an individual performs in another setting. There is little research to date from which to determine whether a simulated context is ecologically valid or whether ratings derived in the constructed settings reflect daily performance. Fifth, timed performance-based measures have a wide range of test–retest reliability, particularly for unfamiliar tasks or tasks that do not have discrete start and stop points.
Chart Extraction
Another common source of information, particularly in clinical research, is extraction of recordings from provider notes and charts. This method is an inexpensive, relatively easy approach from which to derive specific types of information, such as health status, number and types of medication, physical function, and psychological well-being. However, professionals may rate phenomena differently, and it is not clear whether ratings in health records reflect the outcome of a standard assessment or whether they are anecdotal and based on casual observations.
Item Selection
Another important consideration in selecting a measure is determining whether the items you have included are adequate for the purpose of your study.
Consider the study previously cited on the physical functioning of people who have had strokes, specifically their ability to ambulate after a therapeutic regimen. If you are interested in deriving ratings of “level of dependence” in ambulation and transferring, you will need to ensure that your selected functional measure includes the items that are important to your purpose.
Consider another example. The Child Health Protocol-Adolescent Edition is a global, comprehensive, self-report measure of child health. One of the subsections measures physical endurance and activity by asking questions such as, “When was the last time that you walked a mile?” An adolescent who uses a wheelchair may be in excellent health but is unable to walk. Asking about mobility ability and endurance by restricting its operational definition to walking does not capture health in this case. The health rating for a child using a wheelchair would therefore be misleading because the items are not necessarily relevant to how this child performs.
Response Set
You not only have to consider which items are included in a measure but also whether the response set is suitable for your study purpose.
In your study of functioning in people with strokes, you need to decide whether to obtain information about their perceived level of difficulty in ambulating or their level of dependence or both.
A measure that asks respondents to rate difficulty level will not yield information about whether they must rely on a helper as well. It is important to identify a measure with the response set that will yield the type and scope of information that reflect your study purpose.
Constructing an instrument
Health and human service professionals frequently find that measures must be newly constructed to fit the study or clinical research purpose. The development of a new measure in experimental-type research should always include a plan for testing its reliability and some level of validity (content, at the minimum) to ensure a level of accuracy and rigor to the study findings. This can be a complex and time-consuming enterprise, and investigators often must develop different strategies to address measurement issues. Some investigators combine previously tested and well-established measures with a newly constructed measure to test their relationships and relative strengths in the study and provide evidence of reliability and validity.
The development of new instrumentation is, in itself, a specialty in the world of experimental-type research. We have introduced the basic components of the measurement process and have provided some principles for ensuring that your items are reliable. However, constructing an instrument and its components is a major research task (Boxes 16-4 and 16-5). Many sources of error interfere with the reliability and validity of an instrument. It is best to consider consultation.
For more detailed information on instrument construction, see the references.
Administering the instrument
An instrument in experimental-type research can be administered by self-report using paper-and-pencil, direct observation of the phenomena of interest, face-to-face interview of the subject or a proxy, telephone, or mail. It is important to standardize the administration of an instrument, particularly when more than one person is obtaining information for a study. The influence of the data collector can potentially confound the findings. Consider the following example.
You and another investigator are studying perceived quality of life in a nursing home environment. You both have a set of questions with a closed-ended response set to be answered by the subjects. You begin your interview with a “thank you” statement and then ask the questions, whereas the other interviewer discusses the respondent’s poor health status before beginning the interview schedule. In your data analysis, you find that the subjects you interviewed tend to be more satisfied with their lives than those interviewed by the other investigator. Is it possible that the second investigator influenced the respondents by discussing potentially depressing issues before administering the instrumentation?
This scenario highlights the importance of training for data collectors. Training is essential (1) to ensure that data collection procedures are the same for all data collection action processes and (2) to reduce bias that can be introduced by investigator differences. Establishing a strict protocol for administering an interview and training interviewers in that protocol will result in standardization of procedures to ensure “objective measurement.”
Summary
Data collection instruments for experimental-type designs vary in structure (open or closed), level of measurement, and objectivity (reliability and validity). The purpose of data collection is to ensure minimal researcher obtrusiveness through the systematic and consistent application of procedures. The researcher minimizes systematic and random errors through validation and reliability testing, respectively. Other procedures are developed to ensure consistency in obtaining data (Box 16-6).
Reliability and validity represent two critical considerations when a data collection instrument is selected. When experimental-type research is conducted, the researcher’s first preference is the selection of instruments that have demonstrated reliability and validity for the specific populations or phenomena the investigator wants to study. In health and human service research, however, as in other substantive or content areas (e.g., diversity, disability, caregiving, gerontology, children, family function), instruments to measure relevant researchable concepts are limited. Because of the lack of reliable and valid instruments, some professional organizations and agencies, such as the Health Resources and Services Administration and National Institutes of Health, have placed a high priority on funding research directed at the development of data collection instruments.
References
1. Babbie, E. Practice of social research, ed 12. Belmont, Calif: Wadsworth, 2009.
2. Miller, D., Salkind, N. Handbook of research design and social measurement. Newbury Park, Calif: Sage, 2003.
3. Spanier, G.B. Measuring dyadic adjustment: new scales for assessing the quality of marriage and similar dyads. J Marriage Fam. 1976;38:15–28.
4. Zung, W.K. A rating instrument for anxiety disorders. Psychosomatics. 1971;12:371–379.
5. Olson, D.H., Portner, J., Lavee, Y. FACES-III. In: Family social science. Minneapolis: University of Minnesota; 1985.
6. Spielberger, C.D., et al. Assessment of anxiety: the State-Trait Anxiety Scale, Adv Personality, 2005–2008. http://www.mindgarden.com/products/staisad.htm#about
7. Stiles, W.B., Snow, J.S. Counseling session impact as seen by novice counselors and their clients. J Counsel Psychol. 1984;31:3–12.
8. Radloff, L.S. The CES-D Scale: a self report depression scale for research in the general population. Appl Psychol Measure. 1977;1:385–401.
9. Stewart A.L., Ware J.E., eds. Measuring functioning and well-being: the medical outcomes study approach. Durham, NC: Duke University Press, 1992.
10. DeVellis, R.F. Scale development: theory and applications. Thousand Oaks, Calif: Sage, 2003.
11. Stouffer, S.A. Communism, conformity and civil liberties. New York: Doubleday, 1955.
12. Dunn Rankin, P., Knezek, G.A., et al. Tasks. In Scaling methods, ed. 2, Englewood, NJ: Erlbaum; 2004:11–38.
13. Wechsler, D. The measurement of adult intelligence, ed 4. New York: Psychological Corporation, 1958.
14. Gitlin, L.N. Physical function in the elderly: a comprehensive guide to its meaning and measurement. ProEd Press, 2005.
15. Colton, D., Covert, R. Designing and constructing instruments for social science research and evaluation. Jossey Bass, 2007.
16. Pacala, J.T., Boult, C., Urdangarin, C., McCaffrey, D. Using self-reported data to predict expenditures of the health care of older people. J Am Geriatr Soc. 2003;51:609–614.
17. Neumann, P.J., Araki, S.S., Gutterman, E.M. The use of proxy respondents in studies of older adults: lessons, challenges, and opportunities. J Am Geriatr Soc. 2000;48:1646–1654.