Chapter 52 Genetic Tests for Large Animals
Genetic testing based on deoxyribonucleic acid (DNA) involves the analysis of an animal’s DNA to determine the individual’s genotype for an inherited disorder, trait, or anonymous marker. Genetic testing can be used for positive or negative selection in a population, depending on whether it is being used to identify a disease (negative) or a trait (positive). Genetic testing can also be used for permanent individual identification and parentage determination. Many breed registries require parentage verification to ensure the accuracy of their pedigrees.
Using genetic testing results for selection requires an understanding of the mode of inheritance of the disease or trait. Most often, a genetic test will be performed for a recessive disorder to determine if an animal is a carrier. Carriers are asymptomatic but have the potential to produce diseased progeny. Because they have no outward manifestation of disease, a genetic test is extremely valuable for managing their breeding appropriately. Carrier animals can be bred to noncarriers if needed to retain valuable characteristics while not producing diseased offspring. In the case of positive selection for a trait of interest, carrier animals may have higher breeding values because they can produce a trait if bred to other carriers or to animals with the trait. Genetic tests may also be used for dominant disorders if the disease/trait has a late age of onset or if it is inherited in a co-dominant manner. DNA testing for traits that are controlled by more than one locus (polygenic) may also be used for selection for economically important traits. In these cases, one particular genotype may confer a slight advantage over another and therefore, in a large population, can have a significant effect on production.
Box 52-1 defines key genetic terms; see also Chapter 51.
Box 52-1 Definitions of Genetic Terms
INDIVIDUAL IDENTIFICATION AND PARENTAGE TESTING
Researchers use genetic markers distributed along all the chromosomes as tools to identify regions associated with diseases or traits. The markers are composed of small nucleotide repeats and are called microsatellite markers or short tandem repeats (STRs). These markers have a feature that makes them extremely useful to geneticists; the markers have been chosen to be “polymorphic” (show differences) between individuals. In other words, individual animals will have different lengths of the nucleotide repeats for each of these markers. The high level of polymorphism of this type of marker makes them useful for “mapping” (identifying the chromosomal location of diseases and traits.
The microsatellite markers are assayed by polymerase chain reaction (PCR) amplification using fluorescent-labeled primers. Primers are short (∼20 base pairs), single-strand lengths of DNA that are complementary to a specific region of the genome. PCR is the amplification of a section of DNA contained between two primers designed to complement the unique sequence flanking the STR. The PCR products are then resolved by electrophoresis based on their length. Figure 52-1 shows a single microsatellite marker in three different animals. This marker is polymorphic and would be a useful marker for individual identification or parentage. Because the markers show differences between individuals, a collection of these markers can be used as a form of identification of an animal. High statistical significance can be obtained with as few as 10 markers, depending on the species and breed. The DNA type of an animal will not change over its lifetime and can therefore be used as a form of permanent identification.
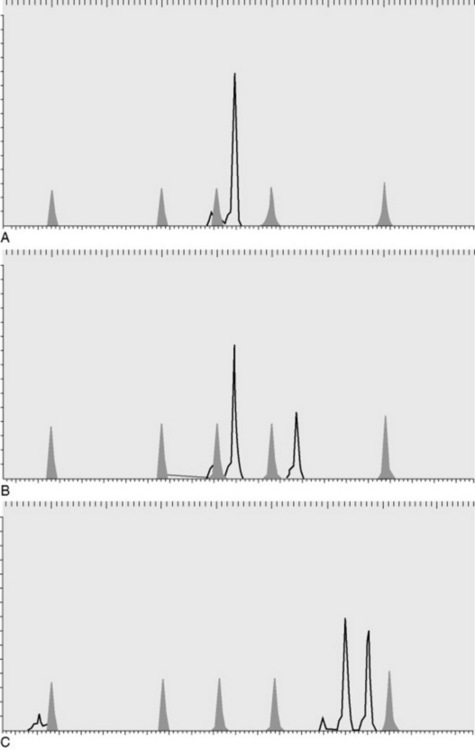
Fig. 52-1 Microsatellite markers are visualized after polymerase chain reaction (PCR) by running the fluorescent-labeled PCR product (shown in black) through capillary electrophoresis, which separates the products based on size relative to an internal size standard (shown in gray). Each panel (A, B, and C) shows the results for a different animal. Size (base pairs of DNA) is resolved along the x axis, and the y axis shows the fluorescence intensity.
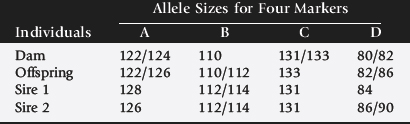
Many purebred registries require parentage verification for registration purposes. To accomplish parentage verification, a DNA sample must be available from both parents as well as the offspring. DNA samples are taken in the form of hair, blood, or buccal swabs (depending on the species and registry) and submitted at the time registration is requested. Each animal inherits one copy of each marker from its sire and one copy from its dam, so the markers can also be used to verify parentage. The most useful marker has a high polymorphism rate because that type of marker will be most likely to show differences not only between the sire and the dam, but also between the two copies (alleles) of the marker. A set of polymorphic markers (∼10 to 20) is used to verify parentage to ensure a high probability that the parentage is correct. Table 52-1 shows the allele sizes for a set of markers in a parentage case. For marker A the offspring inherited a 122 and a 126 allele. The 122 came from its dam, so the 126 came from the sire. Because sire 1 does not have a 126 allele, it has been excluded. In this example, sire 1 is excluded as the sire of the offspring, and sire 2 is verified on the basis of the results for all three markers.
DISEASE TESTING
Clinicians can use DNA testing in disease diagnosis or to determine an animal’s potential for producing diseased progeny. Generally, disease diagnosis is based on clinical signs and other diagnostic tests, but occasionally DNA testing is used, in particular for later-onset diseases or diseases for which diagnosis by traditional methods is difficult or invasive. To offer a genetic test, the gene responsible must be known. Ideally, the actual mutation that causes the disease has been identified. Rather than knowing the exact gene or mutation, only a region of a chromosome may have been implicated in a particular disease. DNA tests can be divided into two categories: mutation tests and linked-marker or haplotype tests. Mutation tests are based on an actual mutation that causes disease, whereas the linked-marker or haplotype test is based on the region of the chromosome that is known to cause disease, but not necessarily the actual mutation. Usually, haplotype tests are offered instead of a mutation test because the mutation has not yet been identified.
Mutations that cause disease appear in many different forms. A change of a single base pair from one base to another can cause a disease either by changing an amino acid (“missense” mutation), truncating the amino acid chain (“nonsense” mutation), or altering expression or proper splicing. For example, missense mutations have been shown to cause lethal white foal syndrome in the American Paint horse.1-3 Insertions or deletions of a single base pair (bp) can cause mutations in the coding sequence by altering the translational frame, which ultimately causes protein truncation. An 11-bp deletion in the myostatin gene causes a frameshift mutation and protein truncation in Belgian blue and Peidmontese cattle with the double-muscle phenotype.4-6 Large deletions or insertions that remove hundreds and thousands of base pairs can also cause disease. For example, the polled intersexuality mutation in goats is caused by an 11.7-kilobase deletion that removes a regulatory element that controls the expression of two genes.7 This endless array of possible changes in the DNA that result in disease makes each individual DNA-based genetic test different.
The basis for DNA testing is PCR. Primers can be designed specifically to amplify either the disease-causing allele or the normal allele. Alternatively, the PCR product can be digested with a restriction enzyme that cleaves the DNA at a particular sequence of bases. A restriction enzyme is chosen that shows a different cleavage pattern between the mutant and the normal version of the PCR product. Direct sequencing of a section of DNA can also be used to determine the animal’s genotype. Many different methods are available to assay changes in DNA that lead to disease. Each company that offers a test may choose a different type of assay for the same mutation.
If the exact mutation that causes the disease has not been discovered, a linked-marker test can be used. A “linked marker” is a microsatellite marker similar to those previously described for individual identification and parentage analysis. The marker is “linked” along the chromosome to the disease gene. It can be used as a proxy for the actual mutation; the associated error rate can be decreased by using a set of markers that flank the gene causing the disease. When a set of markers is used, the test is called a “haplotype” test. Because the test does not directly test for the mutation, an error is still possible. Figure 52-2 shows a pedigree that is segregating a disease allele and a marker. In panel A the disease allele is in linkage phase with the marker allele 132. In this family the 132 allele is correlated to the disease locus. Panel B shows a family in which the linkage phase is different. In this family the sire has a 138 allele associated with the disease allele. Therefore, his affected son would be called a “carrier” and one of his daughters that is a carrier would be called “normal” based on this linked marker. Linked markers can be used in families with affected individuals to test for the presence or absence of the disease allele in other family members. The problem arises when a linked-marker test is used to test individual animals. The linkage phase is assumed based on research done in one family, but may not be true for every animal in the breed.
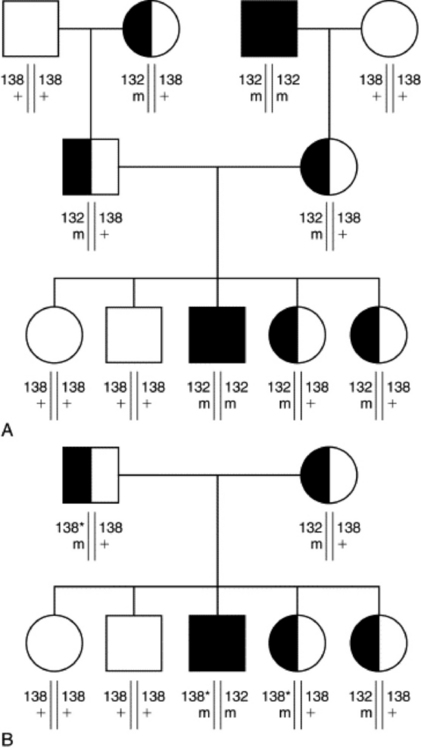
Fig. 52-2 In this pedigree, squares are males and circles are females. Filled symbols represent affected individuals, half-filled symbols represent carriers, and open symbols represent normal animals. The allele sizes for a marker linked to the disease locus are given below each symbol. For clarity, the genotype at the disease locus is also written below each symbol as m for the mutant allele and + for the normal allele. Panels A and B are two different families. The asterisk marks the allele in different linkage phase in family B.
There are limits to all genetic testing. In mutation tests the specific mutation being assayed is the only factor being evaluated. An animal may have a different mutation in that gene or a mutation in a different gene that causes the same phenotype (phenocopy). It is therefore correct to state that an animal has been “DNA tested negative” for this specific mutation rather than “DNA tested clear” of the disease. Linked-marker tests have these same sources of error, as well as additional sources. Recombination events between the markers and the disease gene can lead to false-positive and false-negative results. The use of multiple markers that flank the gene of interest (haplotype test) can increase the probability that a recombination event will be identified. If one is identified, the laboratory will know that the test is not valid in this individual. The second source of error with either a linked-marker or a haplotype test occurs when there is an ancestral recombination event that changes the linkage phase of the alleles. The result is that the laboratory would interpret an animal’s genotype at the disease locus incorrectly, based on the linked markers.
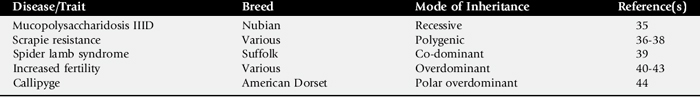
No association or committee evaluates quality control of DNA tests that are available in animals. Most tests are published in the scientific literature not as tests but as articles describing the discovery of the mutation. Because some cases involve patent issues, some tests are offered before publication. Much of the research done to identify the mutations involved in the tests is performed at universities and funded by granting agencies that have both financial and intellectual interest in patenting the tests. Companies then license the rights to offer the tests. Because the companies that have a license for each test can change, company names are not listed in this chapter. Rather, searching on the Internet for the test name will give veterinarians access to the companies offering the tests. Tables 52-2, 52-3, and 52-4 list available genetic tests for horses, cattle, and sheep and goats, respectively. Only tests published in peer-reviewed journals are listed. Additional tests available in cattle for various forms of the milk proteins also are not listed in Table 52-3. The breeds of cattle are not listed because rapid changes in testing mean that tests are always being validated for new breeds. It is therefore recommended that a search be performed for the availability of a test for a particular breed each time the need arises.
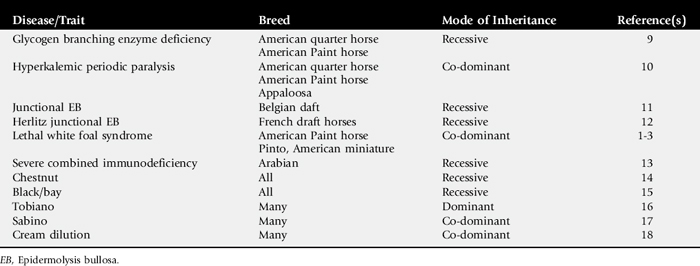
Table 52-3 Genetic Tests for Cattle
| Disease/Trait | Mode of Inheritance | Reference(s) |
|---|---|---|
| Bovine leukocyte adhesion deficiency (BLAD) | Recessive | 19 |
| Growth hormone receptor (milk yield and composition) | Polygenic | 20 |
| Calpastatin (meat tenderness) | Polygenic | 21, 22 |
| μ-Calpain (meat tenderness) | Polygenic | 23, 24 |
| Citrullinemia | Recessive | 25 |
| Complex vertebral malformation (CVM) | Recessive | 26 |
| DGAT1 (milk yield and composition) | Polygenic | 27 |
| Deficiency of uridine monophosphate synthase (DUMPS) | Recessive | 28 |
| Leptin (marbling and milk production) | Polygenic | 29, 30 |
| Myostatin | Recessive | 4-6 |
| Polled | Dominant | 31 |
| Pompe’s disease | Recessive | 32 |
| Red/black coat color | Recessive | 33 |
| Thyroglobulin (marbling) | Polygenic | 34 |
The diseases or traits that are tested can be divided into two categories: those that have straightforward Mendelian inheritance patterns (recessive, dominant, and sex-linked) and those that are more complicated because many genes are involved with conferring the phenotype (polygenic). Quantitative trait loci (QTL) are the genes that contribute to a polygenic disease. In cattle a vast number of QTL have been placed in specific regions of chromosome for quantitative traits such as dairy form, milk production, and fertility.8 Selection for these traits can be done with DNA testing (see Table 52-3). Because so many different QTL exist, however, selection can be challenging, and trade-offs need to be made.
Genetic testing relies on advances made in the field of genomics. Veterinarians and owners are fortunate that both cattle and horses were chosen as economically important species for whole-genome sequencing. A Hereford bull and a thoroughbred mare have both been sequenced, and studies describing the results should be available soon. The number of disease-based or trait-based tests available in the future will increase as the information in the genome sequence is translated.
1 Yang GC, Croaker D, Zhang AL, et al. A dinucleotide mutation in the endothelin-B receptor gene is associated with lethal white foal syndrome (LWFS), a horse variant of Hirschsprung disease. Hum Mol Genet. 1998;7(6):1047.
2 Metallinos DL, Bowling AT, Rine J. A missense mutation in the endothelin-B receptor gene is associated with lethal white foal syndrome: an equine version of Hirschsprung disease. Mamm Genome. 1998;9(6):426.
3 Santschi EM, Purdy AK, Valberg SJ, et al. Endothelin receptor B polymorphism associated with lethal white foal syndrome in horses. Mamm Genome. 1998;9(4):306.
4 McPherron AC, Lee SJ. Double muscling in cattle due to mutations in the myostatin gene. Proc Natl Acad Sci USA. 1997;94(23):12457.
5 Kambadur R, Sharma M, Smith TP, Bass JJ. Mutations in myostatin (GDF8) in double-muscled Belgian Blue and Piedmontese cattle. Genome Res. 1997;7(9):910.
6 Grobet L, Martin LJ, Poncelet D, et al. A deletion in the bovine myostatin gene causes the double-muscled phenotype in cattle. Nat Genet. 1997;17(1):71.
7 Pailhoux E, Vigier B, Chaffaux S, et al. A 11.7-kb deletion triggers intersexuality and polledness in goats. Nat Genet. 2001;29(4):453.
8 Polineni P, Aragonda P, Xavier SR, et al. The bovine QTL viewer: a web accessible database of bovine quantitative trait loci. BMC Bioinformatics. 2006;7:283.
9 Ward TL, Valberg SJ, Adelson DL, et al. Glycogen branching enzyme (GBE1) mutation causing equine glycogen storage disease IV. Mamm Genome. 2004;15(7):570.
10 Rudolph JA, Spier SJ, Byrns G, et al. Periodic paralysis in quarter horses: a sodium channel mutation disseminated by selective breeding. Nat Genet. 1992;2(2):144.
11 Spirito F, Charlesworth A, Linder K, et al. Animal models for skin blistering conditions: absence of laminin 5 causes hereditary junctional mechanobullous disease in the Belgian horse. J Invest Dermatol. 2002;119(3):684.
12 Milenkovic D, Chaffaux S, Taourit S, Guerin G. A mutation in the LAMC2 gene causes the Herlitz junctional epidermolysis bullosa (H-JEB) in two French draft horse breeds. Genet Sel Evol. 2003;35(2):249.
13 Wiler R, Leber R, Moore BB, et al. Equine severe combined immunodeficiency: a defect in V(D)J recombination and DNA-dependent protein kinase activity. Proc Natl Acad Sci USA. 1995;92(25):11485.
14 Marklund L, Moller MJ, Sandberg K, Andersson L. A missense mutation in the gene for melanocyte-stimulating hormone receptor (MC1R) is associated with the chestnut coat color in horses. Mamm Genome. 1996;7(12):895.
15 Rieder S, Taourit S, Mariat D, et al. Mutations in the agouti (ASIP), the extension (MC1R), and the brown (TYRP1) loci and their association to coat color phenotypes in horses (Equus caballus). Mamm Genome. 2001;12(6):450.
16 Brooks SA, Terry RB, Bailey E. A PCR-RFLP for KIT associated with Tobiano spotting pattern in horses. Anim Genet. 2002;33(4):301.
17 Brooks SA, Bailey E. Exon skipping in the KIT gene causes a Sabino spotting pattern in horses. Mamm Genome. 2005;16(11):893.
18 Mariat D, Taourit S, Guerin G. A mutation in the MATP gene causes the cream coat colour in the horse. Genet Sel Evol. 2003;35(1):119.
19 Shuster DE, Kehrli MEJr, Ackermann MR, Gilbert RO. Identification and prevalence of a genetic defect that causes leukocyte adhesion deficiency in Holstein cattle. Proc Natl Acad Sci USA. 1992;89(19):9225.
20 Blott S, Kim JJ, Moisio S, et al. Molecular dissection of a quantitative trait locus: a phenylalanine-to-tyrosine substitution in the transmembrane domain of the bovine growth hormone receptor is associated with a major effect on milk yield and composition. Genetics. 2003;163(1):253.
21 Casas E, White SN, Wheeler TL, et al. Effects of calpastatin and μ-calpain markers in beef cattle on tenderness traits. J Anim Sc. 2006;84(3):520.
22 Schenkel FS, Miller SP, Jiang Z, et al. Association of a single nucleotide polymorphism in the calpastatin gene with carcass and meat quality traits of beef cattle. J Anim Sci. 2006;84:291.
23 Page BT, Casas E, Heaton MP, et al. Evaluation of single-nucleotide polymorphisms in CAPN1 for association with meat tenderness in cattle. J Anim Sci. 2002;80(12):3077.
24 White SN, Casas E, Wheeler EL, et al. A new single nucleotide polymorphism in CAPN1 extends the current tenderness marker test to include cattle of Bos indicus, Bos taurus, and crossbred descent. J Anim Sci. 2005;83(9):2001.
25 Dennis JA, Healy PJ, Beaudet AL, O’Brien WE. Molecular definition of bovine argininosuccinate synthetase deficiency. Proc Natl Acad Sci USA. 1989;86(20):7947.
26 Thomsen B, Horn P, Panitz F, et al. A missense mutation in the bovine SLC35A3 gene, encoding a UDP-N-acetylglucosamine transporter, causes complex vertebral malformation. Genome Res. 2006;16(1):97.
27 Grisart B, Coppieters W, Farnir F, et al. Positional candidate cloning of a QTL in dairy cattle: identification of a missense mutation in the bovine DGAT1 gene with major effect on milk yield and composition. Genome Res. 2002;12(2):222.
28 Schwenger B, Schober S, Simon D. DUMPS cattle carry a point mutation in the uridine monophosphate synthase gene. Genomics. 1993;16(1):241.
29 Kononoff PJ, Deobald HM, Stewart EL, et al. The effect of a leptin single nucleotide polymorphism on quality grade, yield grade, and carcass weight of beef cattle. J Anim Sci. 2005;83(4):927.
30 Lagonigro R, Wiener P, Pilla F, et al. A new mutation in the coding region of the bovine leptin gene associated with feed intake. Anim Genet. 2003;34(5):371.
31 Drogemuller C, Wohlke A, Momke S, Distl O. Fine mapping of the polled locus to a 1-Mb region on bovine chromosome 1q12. Mamm Genome. 2005;16(8):613.
32 Dennis JA, Moran C, Healy PJ. The bovine alpha-glucosidase gene: coding region, genomic structure, and mutations that cause bovine generalized glycogenosis. Mamm Genome. 2000;11:206.
33 Klungland H, Vage DI, Gomez-Raya L, et al. The role of melanocyte-stimulating hormone (MSH) receptor in bovine coat color determination. Mamm Genome. 1995;6(9):636.
34 Barendse W, Bunch R, Thomas M, et al. The TG5 thyroglobulin gene test for a marbling quantitative trait loci evaluated in feedlot cattle. Aust J Exp Agric. 2004;44(7):669.
35 Cavanagh KT, Leipprandt JR, Jones MZ, Friderici K. Molecular defect of caprine N-acetylglucosamine-6-sulphatase deficiency: a single base substitution creates a stop codon in the 5′-region of the coding sequence. J Inherit Metab Dis. 1995;18(1):96.
36 Goldmann W, Hunter N, Benson G, et al. Different scrapie-associated fibril proteins (PrP) are encoded by lines of sheep selected for different alleles of the Sip gene. J Gen Virol. 1991;72(pt 10):2411.
37 Goldmann W, Martin T, Foster J, et al. Novel polymorphisms in the caprine PrP gene: a codon 142 mutation associated with scrapie incubation period. J Gen Virol. 1996;77(pt 11):2885.
38 Billinis C, Panagiotidis CH, Psychas V, et al. Prion protein gene polymorphisms in natural goat scrapie. J Gen Virol. 2002;83(pt 3):713.
39 Beever JE, Smit MA, Meyers SN, et al. A single-base change in the tyrosine kinase II domain of ovine FGFR3 causes hereditary chondrodysplasia in sheep. Anim Genet. 2006;37(1):66.
40 Galloway SM, McNatty KP, Cambridge LM, et al. Mutations in an oocyte-derived growth factor gene (BMP15) cause increased ovulation rate and infertility in a dosage-sensitive manner. Nat Genet. 2000;25(3):279.
41 Wilson T, Wu XY, Juengel JL, et al. Highly prolific Booroola sheep have a mutation in the intracellular kinase domain of bone morphogenetic protein IB receptor (ALK-6) that is expressed in both oocytes and granulosa cells. Biol Reprod. 2001;64(4):1225.
42 Souza CJ, MacDougall C, MacDougall C, et al. The Booroola (FecB) phenotype is associated with a mutation in the bone morphogenetic receptor type 1 B (BMPR1B) gene. J Endocrinol. 2001;169(2):R1.
43 Mulsant P, Lecerf F, Fabre S, et al. Mutation in bone morphogenetic protein receptor-IB is associated with increased ovulation rate in Booroola Merino ewes. Proc Natl Acad Sci USA. 2001;98(9):5104.
44 Freking BA, Murphy SK, Wylie AA, et al. Identification of the single base change causing the callipyge muscle hypertrophy phenotype, the only known example of polar overdominance in mammals. Genome Res. 2002;12(10):1496.