Clinical Pathology
When you have completed this chapter, you will be able to:
1 Describe proper handling of blood samples for hematology, coagulation, and clinical chemistry testing.
2 List the tests included in the complete blood count and the equipment needed to perform those tests.
3 Describe the procedure for counting white blood cells and platelets with the Unopette system.
4 Explain the procedures for the determination of the packed-cell volume and plasma protein concentration.
5 State the calculations for the determination of erythrocyte indices.
6 Describe the procedure for preparing and evaluating a differential blood cell film.
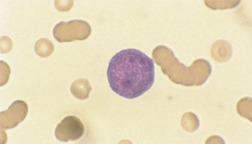
7 Describe normal blood cell morphology and list and describe common morphologic abnormalities of blood cells in a variety of species.
8 State the calculations for the determination of absolute values.
9 State the advantages, disadvantages, and limitations of automated cell counters and clinical chemistry analyzers.
10 List the indications for and the types of tests used in clinical chemistry testing.
11 Describe methods of collection and handling of urine samples.
12 List the test performed and describe the methods used for the evaluation of the physical properties and chemical composition of urine samples.
13 Describe methods for preparing urine samples for the microscopic examination of urine sediment.
14 List and describe the formed elements commonly found in urine sediment.
15 Describe the procedure for the collection of cytology samples by fine-needle aspiration and list the cytology tests performed on body fluids.
HEMATOLOGY
Although the microscopic evaluation of whole blood can occasionally provide direct diagnostic information on infectious and neoplastic blood-borne diseases, more frequently the clinician will indirectly deduce the presence of primary disease at distant tissue sites on the basis of common patterns of hematologic abnormalities.
The basic equipment necessary for hematologic analyses includes a microscope, microhematocrit centrifuge, refractometer, hemacytometer, clean slides, and a modified Wright’s stain. The benefits of conscientious care and cleaning of these items cannot be overlooked. The complete blood count (CBC) provides the veterinarian with invaluable information regarding the patient’s red blood cell (RBC or erythrocyte) mass, white blood cell (WBC or leukocyte) number and distribution, platelet number, and plasma protein. The CBC consists of a packed-cell volume (PCV) and/or hematocrit (Hct), WBC count, RBC count, hemoglobin determination, RBC indices, platelet count or estimate, total plasma protein determination, and evaluation of the blood smear for RBC morphology and a WBC differential count. Hematologic procedures are performed on anticoagulated whole blood. The preferred anticoagulant is ethylenediaminetetraacetic acid (EDTA) because it does not interfere with blood cell morphology and staining. EDTA is commercially available in purple-top Vacutainer tubes in a variety of sizes. A Vacutainer is a sterile, glass tube that is sealed with a removable rubber stopper. There is a vacuum or negative pressure inside it that allows blood to flow freely into it from the intravenous needle without force. Many Vacutainer tubes contain substances, such as EDTA or heparin, to keep the blood from clotting. The color of the rubber stopper indicates the substance in the tube. For example, tubes that have lavender or purple colored stoppers contain EDTA whereas tubes with green stoppers contain heparin and “red-tops” do not contain any additive and are therefore referred to as “clot tubes” because the blood inside them is allowed to clot. Choosing the correct type and size of vacutainer is essential to obtaining accurate results because having a small amount of blood in a large tube will alter some of the values. The various types of sample tubes available and their appropriate uses are listed in Table 16-1.
TABLE 16-1
| Color of Topw | Anticoagulant | Purpose |
| Purple | EDTA | CBC, platelet counts |
| Red | None | Chemistries |
| Tiger (red-black) | Separator gel | Chemistries |
| Green | Heparin | Electrolytes, Stats |
| Turquoise | Citrate | Coagulation assay |
CBC, Complete blood count; EDTA, ethylenediaminetetraacetic acid.
The morphology of the normal and abnormal blood cells is briefly reviewed, but it is strongly recommended that the technician have on hand and consult the appropriate references listed at the end of this chapter. Table 16-2 contains sample reference intervals for normal hematology values in common domestic species.
EQUIPMENT
When a microscope is chosen, the laboratory’s needs must first be assessed. The fewer “extras” that are included will reduce the requirements for maintenance, service, and repairs. A good-quality binocular microscope with a mechanical stage, an adjustable substage condenser, and good-quality objective lenses will accommodate the needs of any hematology laboratory. The most important aspect, and often the cost determinant, of a good laboratory microscope is the objective lens. Planachromatic lenses are recommended because they provide a flat field of vision with superior optical properties. The entire field will be in focus, resulting in reduced eyestrain and improved microscopic images. The basic laboratory microscope should have 10×, 40× (high dry), and 100× (oil immersion) objective lenses in addition to standard 10× ocular objectives. Many microscopists find an additional 50× oil-immersion objective lens useful for evaluation of both blood films and cytology specimens. The manufacturer’s manual should provide directions for adjusting the light for optimal intensity (Köhler illumination), which enhances the clarity of the image. Proper adjustment of the substage condenser is necessary for optimal image quality; in general the condenser should be in a higher position for stained preparations, whereas dropping the condenser in combination with increasing light intensity is needed to visualize unstained wet preparations.
Proper care of the microscope is essential for providing accurate results for an extended period. Great care should be taken to follow the manufacturer’s directions for proper use, cleaning, and maintenance. The oil-immersion lenses require a drop of special immersion oil on the blood film to achieve the appropriate optics. The immersion oil should be wiped from the objective after use to prevent damage to the lens. It is essential that all other objectives be kept free of oil. In practice, the 40× lens (high dry) is most easily dragged through oil while changing magnification, which in many multiuser environments will require constant cleaning or eventually lead to degradation of the lens as oil seeps through the lens seal. Lenses should be cleaned with lens paper only. A dust cover should be placed over the microscope when it is not in use to prevent collection of dust and hairs on the lenses and other surfaces.
 TECHNICIAN NOTE
No laboratory equipment or instrument, regardless of cost, is any better than the care and maintenance it receives.
A microhematocrit centrifuge is required for the determination of the PCV. The force generated by the centrifuge separates the cellular components of blood from the plasma. The manufacturer’s manual should be consulted for recommended speed settings for the sample being spun. As with all laboratory equipment, the accuracy and functional longevity of the centrifuge are directly related to proper care and use. For the purpose of safety, the centrifuge should not be operated unless the lid is closed and properly secured. Samples should always be balanced to ensure accurate separation and reduce wear on the motor. Periodic maintenance, such as lubricating the bearings and checking the commutator, should be scheduled according to the manufacturer’s recommendations to extend the life of the centrifuge and ensure accurate results.
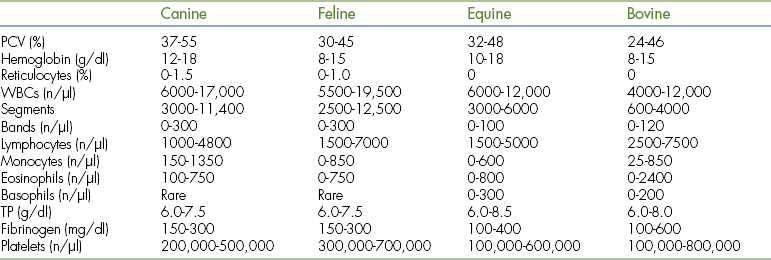
The refractometer is used to determine the plasma protein concentration by measuring the refractive index of the plasma. Careful cleaning of the sample surface is imperative to prolonging the accuracy and functional life of the refractometer. Several models are available, including one designed specifically for veterinary use (Figure 16-1). The veterinary model is less expensive, has a more shock-resistant casing, and is most appropriate for use in the veterinary determination of urine specific gravity (SG). Human calibrated refractometers will have the greatest degree of inaccuracy when reading feline urine SG, but even so the error is generally only a few thousandths higher than the actual value. The calibration of the zero setting should be checked periodically with distilled water and adjusted according to the instructions in the manufacturer’s manual if necessary.
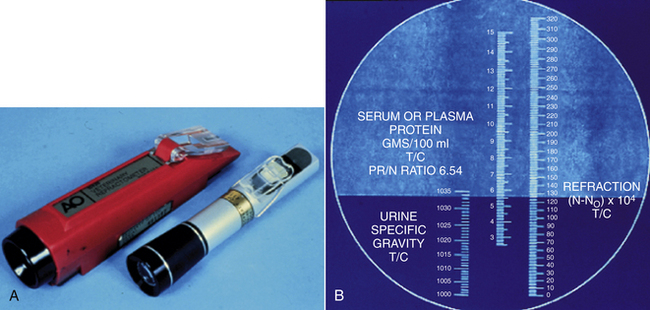
FIGURE 16-1 A, Veterinary (red) and human refractometers. B, The reading scale within the refractometer.
The Neubauer (recommended) hemacytometer is a small but valuable specialized counting chamber used for determining WBC and platelet counts per microliter of blood (Figure 16-2). With the 1:100 dilution Unopette system (Becton Dickinson Inc., Franklin Lakes, N.J.) for WBC and platelet counts, all nine of the large primary squares are counted for WBCs at 10×, and platelets are counted in all 25 squares within the center primary square at 40×. Appropriate calculations are provided with the system used to determine cells per microliter. The hemacytometer has a special weighted coverglass to prevent it from floating upon filling of the chamber because the calculation of the cellular concentration is dependent upon a set 0.1-mm distance between the counting chamber surface and coverglass; should it be damaged, a regular microscopic coverslip cannot be substituted because overestimation of cellular concentration will result if a greater volume of fluid than that corresponding to the expected 0.1-mm depth is present as a result of a floated coverslip. Both the hemacytometer and coverslip must be cleaned carefully to prevent scratching of the surfaces. One must realize that the hemacytometer method is notoriously inaccurate in comparison with many automated cell-counter methodologies. Inaccurate dilutions, high dilution factors, chamber overfilling, miscounting of debris, and the overall relatively low number of cells counted all factors into an erroneous determination of final cellular concentrations. Additionally, cells on two of the four edges must be designated as in the counting field, whereas cells on the other two edges are ignored.
FIGURE 16-2 Neubauer hemacytometer. The large Ws indicate the squares that are counted for a total WBC count with the 1:20 dilution WBC Unopette system. The small Rs indicate the squares that are counted for an RBC count with the RBC Unopette system.
New, clean glass slides are essential for making usable blood films. Slides that are frosted on one end are preferred for labeling purposes. Attempts to save money by washing and reusing slides is discouraged because inferior smear preparations will result, thereby impeding accurate interpretation and resulting in the loss of material that can be archived.
SAMPLE HANDLING
In general, EDTA is the required anticoagulant for hematology. Be sure to use a tube of the appropriate size for the sample drawn. It is often difficult to obtain large samples from small dogs and cats; the 2-ml pediatric collection tube is best for a patient of this size. There are collection tubes for smaller volumes (0.5-ml Microtainer tubes, Becton Dickinson Inc., Franklin Lakes, N.J.). These tubes are excellent for samples from puppies, kittens, and small exotic animal species. Excess anticoagulant resulting from a small amount of blood in a too large tube can erroneously decrease the PCV and increase total protein values determined with a refractometer. Extended storage time in EDTA may lead to changes in the appearance of neutrophils. These changes may resemble those caused by disease processes and may lead to an erroneous diagnosis.
Anticoagulated blood samples should immediately be mixed by gentle inversion of the tube. Blood films should be made from well-mixed blood within 15 minutes of obtaining the sample to decrease in vitro morphologic changes in the blood cells. If the practice uses a reference laboratory, unstained blood films should be sent with the EDTA sample. If samples must be held overnight, refrigerate the whole blood but do not refrigerate the blood film. Water will condense on the surface of the blood film if it is placed in the refrigerator and cause lysis of the RBCs. The blood film and cytology slides should be protected from formalin vapors because formalin will interfere with cell preservation and staining. If samples are sent out, they should be packaged in separate bags.
DETERMINATION OF ERYTHROCYTE NUMBERS
The determination of the PCV, the percentage of total blood volume accounted for by RBCs, is the easiest and most common means of evaluating the RBC mass. This is achieved by filling a plain microhematocrit capillary tube with anticoagulated blood, sealing one end of the tube with a specific type of clay, and spinning the sample in a microhematocrit centrifuge. During centrifugation, the red blood cells separate from the other components of blood and from a solid mass of tightly packed cells at the bottom of the hematocrit tube. The percentage of packed red blood cells relative to the total volume of blood can be deduced by holding the hematocrit tube against a special chart. This method provides a quick and accurate measurement if samples are spun for a standard length of time at a consistent speed. The specific time and speed depend on the particular centrifuge used. Accuracy also depends on the care and operation of the centrifuge. Blood samples from cattle, sheep, and goats may require centrifugation for a longer time because their smaller RBCs do not pack as well as dog and cat RBCs. The plasma portion at the top of the tube should be evaluated for color and clarity and will also be used for a determination of plasma protein values. The Hct provides basically the same information, but is obtained by calculation when an automated analyzer is used and thus may be slightly different from the measured PCV. This is most commonly seen in blood samples from collection tubes that have an inadequate volume of blood (less than 1 ml in a 5-ml tube or less than 0.5 ml in a 2-ml tube). The excess anticoagulant causes the RBCs to shrink, erroneously decreasing the PCV. When the blood is diluted by the electronic cell counter, the diluent reexpands the RBCs to their true size, providing the true value for the Hct.
The actual number of erythrocytes may be determined by using an automated cell counter, which is primarily available in reference laboratories. Erythrocyte counts may also be performed manually, but are too tedious and inaccurate to be of diagnostic value. RBC counts vary proportionately with the PCV and have little to no advantage over a PCV. The major advantage of automated cell counters is that they also measure hemoglobin and measure or calculate the RBC indices. Hemoglobin is the protein in RBCs that is responsible for carrying oxygen from the lungs to the tissues.
RED BLOOD CELL INDICES
RBC indices are commonly provided when automated analyzers are used; these indices include mean corpuscular volume (MCV), mean corpuscular hemoglobin (MCH), mean corpuscular hemoglobin concentration (MCHC), and red cell distribution width (RDW). The MCH is of little value, but the MCV and MCHC are useful in evaluating and determining the cause of anemias. MCH and MCHC values calculated with an electronic cell counter will be erroneous if the cells in the sample have ruptured (hemolyzed) during the blood draw or during rough handling. These values will also be affected if the patient is not fasted, and the blood is filled with lipid (lipemic) which is not uncommon in carnivores and omnivores after a meal. Samples with these properties cannot be used to determine MCH and MCHC.
The RDW is the coefficient of variation of the RBC volumes and is a measure of anisocytosis. An increased RDW signifies that a greater variation in cell volumes are present, but does not imply their actual size (i.e., there may be smaller and/or larger RBCs present).

DETERMINATION OF LEUKOCYTE COUNTS
The total WBC count may be determined manually with the hemacytometer or an automated cell counter. Either way, it is important that the blood tube be well mixed before the sample is taken. The use of the Unopette dilution system is the most accepted method for performing manual WBC counts. Several Unopette systems are available for counting various cell types (Table 16-3), but the system preferred for counting leukocytes is also used for counting platelets and determining cell counts on samples such as synovial fluid. This system consists of a disposable reservoir containing diluent and an agent to lyse RBCs to accommodate the counting of leukocytes. Each Unopette system comes with detailed instructions for obtaining reliable results and a capillary pipette with which to draw a specific volume of blood. The interchangeable use of pipettes from another cell counting system, such as one for RBCs, to obtain WBC counts will result in significant errors and inappropriately decreased WBC counts.
The accuracy of a manual WBC count depends on adherence to the directions and the proper performance of each step. Care must be taken to accurately fill the capillary tube and wipe off any excess blood on the outside of the tube without touching the tip of the pipette and drawing any of the sample out of the pipette; residual blood will artifactually elevate the WBC count. The blood sample must be carefully transferred to the reservoir with careful mixing to ensure the complete delivery of the sample into the diluent. Blood left in the capillary tube or accidentally expelled from the top of the pipette during mixing will result in erroneous WBC counts. It will take practice and may require multiple attempts to completely and accurately fill the hemacytometer chamber. The chambers on both sides of the hemacytometer must be filled for accurate results. Counting both sides and comparing results also serve to check accuracy because the number of cells on one side should closely approximate the number of cells on the other side. Overfilling or underfilling the chamber will cause errors in the final cell count. After the hemacytometer chambers have been charged, the hemacytometer must be allowed to sit for several minutes to allow the cells to settle. WBCs will be counted with the use of the 10× objective; lowering the condenser on the microscope will increase the contrast, making the cells more prominent and easier to identify and count accurately.
Immature red blood cells that still contain nuclei may be released prematurely from the bone marrow during some conditions. These nucleated RBCs (NRBCs) may be erroneously counted along with WBCs by either manual or automated electronic counting methods, resulting in falsely elevated WBC counts. The number of NRBCs encountered on the blood film is counted while the differential count is performed on 100 leukocytes. The WBC count is then corrected by using the following formula:

For example, if 15 NRBCs are counted while the 100-cell differential count is performed and the initial WBC count is 30,000 cells/ml, the corrected count is then calculated as follows:

Although this formula may be applied whenever NRBCs are noted, in practice, some laboratories do not perform corrections if there are less than 10 NRBCs per 100 WBCs since the degree of error is not clinically significant.
Increased WBCs are referred to as leukocytosis, whereas decreased WBCs are referred to as leukopenia. The diagnostic significance of either leukocytosis or leukopenia cannot be appreciated without the WBC differential count. The differential count is performed by examining the blood film (see the discussion of blood film evaluation). At least 100 leukocytes are identified and counted according to cell type (as neutrophils, bands, lymphocytes, monocytes, eosinophils, or basophils). The more cells that are counted, the more accurate the differential count will be. The percentages of each cell type counted are then multiplied by the total WBC count to provide absolute numbers of the cell types present. These numbers are the values used for interpreting changes in the leukogram.
Dramatic increases or decreases in the WBC count may also be noted by looking at the thickness of the buffy coat. The buffy coat is the white band of concentrated WBCs and platelets that is visible in the hematocrit tube between the layers of packed RBCs at the bottom and plasma at the top. Though the buffy coat does not give specific counts of the various WBC types, as does a differential, high numbers of concentrated WBCs on buffy coat smears allow for a rapid, general assessment. For example, infections, and neoplasia may be suspect if the buffy coat is thicker than normal. In addition, the blood-borne, swimming larva of heartworm, called microfilaria, may be seen by examining an intact microhematocrit tube under a microscope. In this way, a quick diagnosis of heartworm disease might be made.
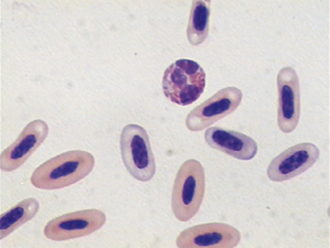
AVIAN AND REPTILIAN LEUKOCYTE COUNTS
Unlike mammals, birds and reptiles have NRBCs (Figure 16-3), and this prevents a determination of their WBC counts by the methods described. However, the WBC counts of these nonmammalian species may be determined indirectly by using another Unopette system for an eosinophil determination. This special Unopette is filled with anticoagulated blood, mixed well, and allowed to incubate for approximately 5 minutes to allow uptake of the stain by the cells. If the sample is allowed to stand for a prolonged time, all the cells will take up the stain, and results will be erroneous. The hemacytometer is filled as for the manual WBC count described, and the red-staining cells are counted in all nine squares of the grid. With proper staining, only the eosinophils and heterophils (equivalent of neutrophils) will be stained. In contrast to the performance of the mammalian manual count, it is important to keep the microscope condenser up to decrease contrast. If the condenser is down, it will be more difficult to count the heterophils and eosinophils because of RBC interference. At the time of writing, this system has had limited availability, and many laboratories have had to make the staining solution themselves; a formula for an acceptable solution follows:
Mix in a 1-L volumetric flask: 1g phloxine + 500 ml propylene glycol, q.s. to 1 L with water.
Filter; protect from light; wrap flask in foil; use within 6 months.
Mix 0.8 ml stain with 25 μl blood in tube; incubate for 5 minutes; count on hemacytometer.
The number obtained does not represent the WBC count, but is used in conjunction with the differential count to calculate the WBC count. When the differential count is completed and the percentages of the various cell types present are known, the WBC count is calculated with the following formula:

The factor of 32 is a simplified mathematic combination of a variety of other factors. For example, if 282 cells are counted on one side of the hemacytometer and you have 70% heterophils and 5% eosinophils on the differential count, the total WBC count would be as follows:

PLATELET DETERMINATION
The determination of platelet numbers is important because platelets play an important role in clot formation. Several diseases cause decreased numbers of platelets (thrombocytopenia), and these can often be diagnosed and treated before a severe bleeding disorder develops; additionally, increased platelet numbers (thrombocytosis) are associated with certain conditions and as such represent useful diagnostic information. Like WBCs, platelets can be counted manually on a hemacytometer or with an automated cell counter. Feline platelets, in particular, have a tendency to clump, which interferes with obtaining accurate platelet counts; whether the count is done manually or by automation, an erroneously low platelet count can result. For this reason, it is important to always examine the blood film for platelet clumping. In addition, because cats often have relatively large platelets and cat RBCs are small, automated electronic counts are often inaccurate because of the inability to separate the cells by size.
Manual platelet counts can be performed by using the same Unopette system and sample used for the manual WBC count. This task can be tedious, especially if the hemacytometer and coverglass are not properly cared for. Scratches and small dust particles are difficult to differentiate from platelets. If platelet clumps are present, the resultant count will be inaccurate. It would be best to obtain another sample with special attention given to ensure a clean venipuncture and adequate mixing of the blood with the anticoagulant. Platelets are identified with the use of the 40× objective and will be easier to see if the condenser is lowered and the light intensity is moderate. The instructions that accompany the Unopette must be followed with regard to the squares of the grid that are counted and the method of determining the total count.
TECHNICIAN NOTE
The blood film should always be scanned for platelet clumps, especially for cats, to prevent reporting erroneously low platelet numbers.
When platelet counts are not available or when it is necessary to verify counts obtained manually or electronically, the number of platelets can be estimated from the blood film. During an examination of the appropriate area of the blood film in which RBCs are spaced in a uniform monolayer, the average number of platelets per 100× oil-immersion field in several fields (10 or more) is determined. This average number of platelets multiplied by a factor of 15,000 to 20,000 will provide an adequate estimation of the number of platelets per microliter.
Decreased platelet counts can have serious implications for the patient. Therefore before low platelet counts are reported, all technical problems must be considered. The feathered edge of the blood film must be checked for platelet clumping. The tube of blood from which the sample was taken should be checked for small clots, which could deplete platelets. Either or both of these problems may occur despite the use of an anticoagulant. If neither the blood film nor the tube reveals evidence of platelet aggregation, the low platelet count should be reported as determined. If platelet clumping or clots are found, another sample should be drawn, and the counts should be repeated.
BLOOD FILM EVALUATION
Examination of the morphology (appearance) of cells is one of the most valuable parts of the CBC, and its importance cannot be overstressed. Cells that appear too big or too small, for example, are indications of disease. The morphology of cells is best examined by spreading a very thin layer of blood over a glass microscope slide. The feather edge or tail of the smear, where the cells are spread at their thinnest, is often the best location for examination of the blood smear.
The blood smear or blood film evaluation not only reveals morphologic abnormalities or normalcy (as the case may be), but may also confirm or refute automated cell count figures. If there appears to be a discrepancy between what the technician sees on the film and the numbers reported by the automated instrument, the counts should be repeated with special attention given to determining what could be causing the difference. A common cause is that the blood tube was not adequately mixed before sampling for either the count or the blood film. Another common problem is seen with platelet clumping. Platelet clumps may be counted as WBCs in the impedance-based automated cell counting systems, resulting in falsely higher WBC counts made by these instruments, although many of the newer systems that use multiple methods to classify cell type do not have this problem. Small platelet clumps may erroneously increase the mean platelet volume (MPV) estimates when in fact the platelet volume is normal. Probably the most commonly encountered error caused by platelet clumping is a decrease in platelet concentration because the platelet clumps are not properly counted by machines. With time and experience, the technician will be able to scan the blood film and recognize the discrepancies between the number of leukocytes apparent on the film and the number of WBCs reported by the instrument. As a general rule, there should be approximately 20 leukocytes per 10× field in a normal canine blood sample.
There are a variety of ways to make quality blood films. New slides should always be used, and they should be handled only by the edges because the transfer of oils from fingers to the slide will result in poor-quality films. If the slides have inadvertently been exposed to dust and debris, it may be helpful to clean them with a nonabrasive tissue, such as Kimwipes. (The reader is referred to Recommended Reading for examples of the different techniques.) What is most important is to try several methods, find the one that is most comfortable, and practice repeatedly until quality films are consistently produced. Most commonly a small drop of blood is placed at one end of a slide, and the edge of a second slide is used to spread the drop. It is important to make the film in one even stroke and not use excessive downward pressure. Increased downward pressure on the spreader slide can cause the leukocytes to be carried to the feathered edge and may even cause the cells to rupture or become distorted. In either case, the accuracy of the differential count will be decreased. The thickness of the blood film can be altered to accommodate samples from severely anemic or dehydrated animals. Increasing the angle between the two slides will concentrate the cells when the PCV is low. Conversely, decreasing the angle will allow greater spreading of the cells in a concentrated sample (Figure 16-4). Alternatively, one can prepare highly reproducible blood smears by placing a small drop of blood between two coverslips, rotating one 45-degrees in relation to the other, and then pulling one by a corner away from the other. These are then stained and mounted upon slides.
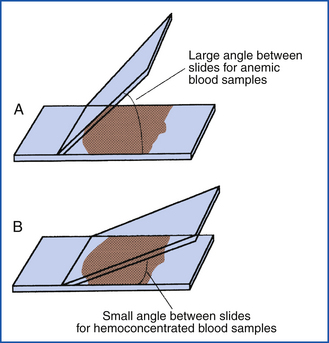
FIGURE 16-4 Difference in slide angle necessary for making blood films from anemic or hemoconcentrated blood. A, Large angle for anemic blood. B, Small angle for hemoconcentrated blood.
Manual staining methodologies with traditional Wright-Giemsa stains are labor intensive and require frequent filtering of the stains. More equipment, a source of distilled water, and critical timing are necessary. Several modifications of the traditional Wright’s stain are available for the suitable staining of blood films for veterinary practices. Stat Stain (VWR Scientific, Philadelphia, Pa.), Diff-Quik (Baxter S/P, McGaw Park, Ill.), CAMCO Quik Stain (Baxter S/P), and Protocol Hema3 (Fischer, Waltham, Mass.) are commonly used. They are relatively economical, less time consuming, and technically easy to use and maintain. The components may be kept in individual Coplin jars. The lids should always be securely replaced after use, and the stains should be freshened or refilled as necessary. Stains should be replaced on a regular basis to prevent bacterial contamination and the accumulation of debris with repeated usage. The disadvantages of these stains are few. Polychromatophilic RBCs do not stain as obviously as they do with Wright-Giemsa stain, and some mast cell and eosinophil granules may be washed out leading to misdiagnosis. Conversely, distemper inclusions (clumps of distempter virus particles inside cells) may be more readily visualized with some of the rapid stains.
It is best to develop a routine for evaluating a blood film and follow the same approach each time to prevent oversights and mistakes. The blood film should first be examined under low power (10×). While scanning on 10×, one can get an impression of the general distribution of nucleated cells (clumped at the edges or spread evenly throughout), estimate the total WBC count (low versus normal versus high), and examine the feathered edge of the blood film for aggregates of platelets, the larger leukocytes, neoplastic cells, and microfilaria of Dirofilaria immitis or Dipetalonema reconditum (Figure 16-5). During the low-power examination, one may identify structures or areas that need a closer look. Last, on low power, one should identify the appropriate area in which RBCs are distributed in a uniform monolayer and the leukocytes are sufficiently spread so that morphologic identification on high power is possible. It is especially important to avoid going too far into the body of the blood film, where the WBCs are rounded and darkly stained. In this area, it is often difficult to differentiate the leukocytes.
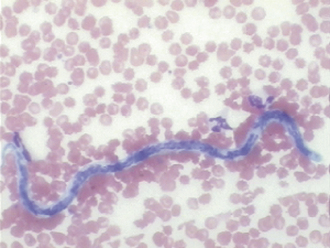
FIGURE 16-5 A microfilaria of D. immitis in a canine blood smear. The parasite is about the same width as an erythrocyte.
The blood film is then studied under high power, generally under oil immersion (100×). The WBC differential count is performed at this power. Erythrocytes should be evaluated for morphologic changes and parasites, and platelets should be evaluated for morphology and counted to make the estimated count. These evaluations may be made before or after the differential count is performed, but they should be done consistently as part of the routine so that they are not overlooked. Platelets in mammals are cytoplasmic fragments, so they have no nuclei, whereas the platelet equivalents known as thrombocytes, which are found in avian and reptilian species, are nucleated; thrombocytes for a given species must be closely examined to differentiate them from relatively similar-appearing lymphocytes. They are generally round to oval or spindle shaped with purplish granules and multiple pointed projections (Figure 16-6). They may vary greatly in size, but increased numbers of large platelets may indicate an increased output from the bone marrow. After the platelets have been evaluated, the erythrocytes should be studied.
ERYTHROCYTE EVALUATION
The erythrocytes of most mammals are disk shaped and anuclear. They appear flat with a varying degree of central pallor (pale area in center of cell with less hemoglobin), depending on the size. The RBCs of different domestic species differ markedly in size, with those of the dog having the largest diameter (7 mm); followed by those of the horse, cow, and cat (5.8 mm); sheep (4.5 mm); and the goat (3.2 mm). Some species have RBCs that vary in size, which is termed anisocytosis. Cows normally have more anisocytosis than do other species. In other species, extreme anisocytosis implies either that many of the RBCs are smaller (microcytic), which may indicate iron deficiency, or that many are larger (macrocytic), which may indicate increased production and release of immature RBCs from the bone marrow in response to anemia. An increase in MCV has been associated with feline leukemia virus (FeLV) infection frequently without an associated regenerative anemia. There are important species and breed variabilities that should not be mistaken as abnormalities. Some poodles have RBCs with increased MCVs as compared with other dogs. Some Akita dogs normally have smaller RBCs. These are genetic traits and do not indicate a change in RBC dynamics.
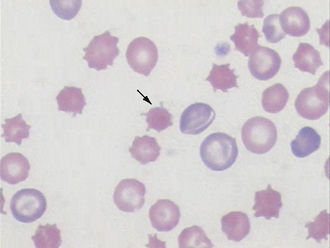
Poikilocytosis is the general term used to indicate changes in RBC shape. Leptocytes are RBCs with an increased surface area that makes them highly deformable. Target cells (codocytes) and cells with a transverse fold are two common forms of leptocytes. Acanthocytes are RBCs with a membrane abnormality that causes them to develop multiple, irregularly spaced, club-shaped projections from the cell surface (Figure 16-7). These must be differentiated from crenated cells, which have numerous rounded, evenly spaced projections. Crenation is most frequently an artifact resulting from high temperatures or slow drying of the blood film, but may also be seen secondary to certain drugs, hypophosphatemia, and in some cases of snake bite venom toxicity. Acanthocytes may be encountered in normal cattle, but in other species, they are often associated with some neoplasms (especially visceral hemangiosarcoma), disorders of lipid metabolism, and with liver dysfunction. Schistocytes are fragmented RBCs. They can be seen during a serious condition called disseminated intravascular coagulation (DIC). The disorder causes blood to clot in vessels leaving strands of fibrin criss-crossing through veins and arteries like a spider’s web. As cells pass through the vessels, they are cleaved by the fibrin strands. DIC is such a grave condition, that it is sometimes referred to as “death is coming” and “dead in cage.”After all of the clotting factors are used up, animals bleed uncontrollably in the terminal stages of DIC. Heartworm disease, and occasionally diseases of the spleen or liver that involve fibrin deposition within the vasculature of those organs, are conditions that can also cause schistocytes to form.
Spherocytes are RBCs that appear smaller than normal RBCs, exhibit no central pallor, but have MCVs comparable with normal RBCs as a result of the increased volume to surface area of a sphere (see Figure 16-6). Spherocytes are most commonly seen in immune-mediated hemolytic anemia (IMHA) and can also be seen after blood transfusions. One must be confident that spherocytes are actually present because many clinicians will start treatment for IMHA if they are reported because of the strong association with this disease process. They are more spherical because bits of their membrane have been removed, making them more rigid and unable to assume the discoid shape more typical of RBCs. They are most easily identified in canine blood because normal canine RBCs are larger and have a distinct zone of central pallor. In the other species with smaller RBCs, including the cat, which typically exhibit little or no central pallor, spherocytes are difficult to confirm (Figures 16-8 and 16-9).
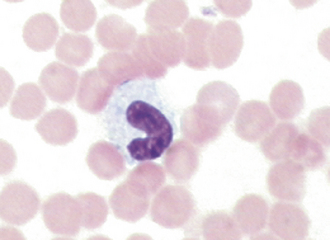
FIGURE 16-8 Feline erythrocytes. Note the lack of central pallor. There is also a toxic band neutrophil.
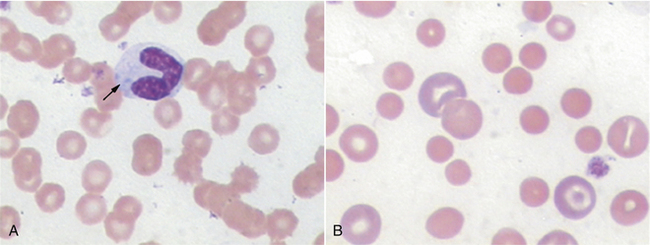
FIGURE 16-9 A, Normal canine RBCs. Note the distinct central pallor. There is also a toxic band with Döhle’s bodies (arrow) in the cytoplasm. B, Blood from a dog with IMHA. Note the lack of central pallor in several smaller cells (spherocytes) and the large polychromatophilic cells.
NRBCs, or metarubricytes, may be seen in peripheral blood films. An occasional NRBC may be found in a normal animal, but increased numbers are a significant finding and should be reported as the number of NRBCs per 100 WBCs; NRBCs may be increased in cases of strongly regenerative anemias or may be representative of bone marrow pathologic conditions, as may be seen with toxins (such as lead) and neoplasia. Care must be taken to avoid confusing NRBCs with lymphocytes. NRBCs of a size similar to small lymphocytes will have more cytoplasm relative to nuclear size, and the cytoplasm will be faintly eosinophilic (reddish). Remember to correct the WBC count if more NRBCs are found (see previous discussion of determination of leukocyte counts).
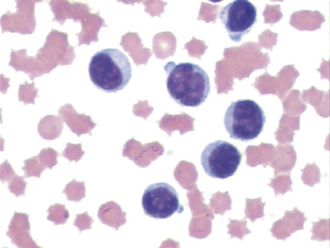
The color of erythrocytes should be noted during the examination of the blood film. Polychromasia is the term used to describe a variation in the color of RBCs. Polychromatophilic RBCs (Figure 16-10) are bluish, although this is not as consistently evident with Diff-Quik stain as it is with Wright’s stain. Some polychromasia may be seen in normal, healthy animals, but increased polychromasia in animals with anemia suggests that the anemia is regenerative (corresponding to an increase in reticulocytes); in other words, the bone marrow is responding to a need for RBCs and releasing immature RBCs. Little or no polychromasia detected on a blood film from an anemic animal suggests that the anemia is nonregenerative (i.e., the bone marrow is not responding appropriately). Although the presence of polychromasia may be suggestive of a bone marrow response to anemia, confirmation cannot be made without a reticulocyte count; because the reticulum of the immature RBCs are not being directly stained with Wright’s staining procedures, they cannot be confirmed as reticulocytes, but instead appear as large bluish polychromatophils (these also may appear as leptocytes).
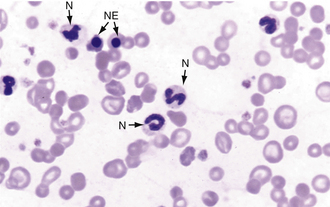
FIGURE 16-10 Canine blood film with several polychromatic erythrocytes, two nucleated erythrocytes (NE), and neutrophils (N).
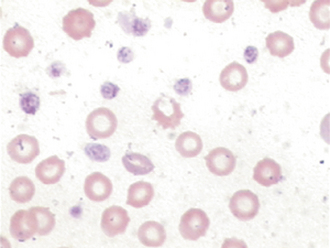
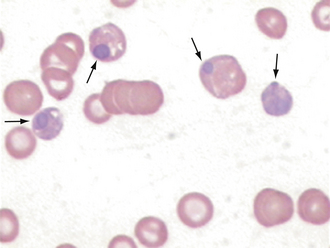
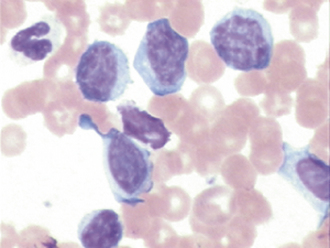
Polychromatophilic RBCs can be identified as reticulocytes (Figure 16-11) when the blood is stained with new methylene blue (NMB). Equal amounts of blood and stain (2 to 5 drops) are mixed in a small tube and left to stand for 5 to 10 minutes. Stain kits (ReticSet, Curtin Matheson Scientific, Houston) in which liquid stain is not used are available for reticulocyte counts. Instead, these kits include stain-coated plastic tubes into which 3 to 5 drops of whole blood are placed and then agitated. Whichever method is chosen, a blood film is made from the mixed sample.
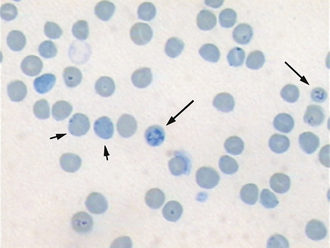
FIGURE 16-11 Feline blood smear with both punctate (short arrows) and aggregate reticulocytes (long arrows).
CASE PRESENTATION 16-1 IMMUNE-MEDIATED HEMOLYTIC ANEMIA (IMHA) AND THROMBOCYTOPENIA (IMT)
Signalment: 2-year-old, spayed female, cocker spaniel
History: acute presentation of severe exercise intolerance, lethargy, and reddish urine
RBC morphology 2+ anisocytosis, 3+ polychromasia, 2+ spherocytes, agglutination noted (negative saline dispersion test)
WBC morphology 2+ Döhle’s bodies, 2+ basophilia, 2+ vacuolation
P. appearance moderately hemolyzed (reddish)
| color | reddish-brownish (unspun), reddish-brownish (spun) |
| turbidity | clear |
| USG | 1.025 |
| pH | 7.0 |
| Protein | 1+ |
| Glucose | neg |
| Ketone | neg |
| Bilirubin | 1+ |
| Blood | 3+ |
| Sediment | occasional reddish casts |
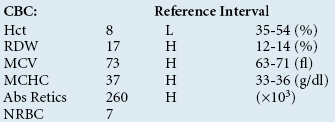
A marked anemia is present, which is regenerative on the basis of the increased absolute reticulocyte count. Reticulocytosis is also supported by the other data, such as the increased MCV, measures of RBC size variation (RDW and morphologic assessment of anisocytosis), and the presence of polychromasia. Although reticulocytes typically have decreased MCHCs, in this case, the presence of free hemoglobin (supported by the reddish plasma) has artifactually increased the MCHC.
Primary IMHA can be deduced from the presence of agglutination and spherocytes, which are strongly associated with immune-mediated RBC destruction, and the lack of transfusion history.
Increased NRBC release in the face of a strongly regenerative anemia is appropriate and commonplace.
A marked thrombocytopenia is present, which is assumed to be accurate because of the lack of platelet clumping. It is interesting to note at this point that decreased MPVs have been associated with IMT, but they are not pathognomonic for it.
A marked neutrophilia with a left shift is defined as an inflammatory leukogram. Lymphopenia and monocytosis are commonly found in inflammatory conditions, either directly as a result of inflammation and/or secondary to a superimposed stress leukogram.
Toxic changes (Döhle’s bodies, basophilia, and vacuolation) are present secondary to the intense inflammatory demand.
The presence of reddish-brownish urine that does not clear upon centrifugation is consistent with pigmenturia (ruling out hematuria). Pigmenturia in the face of a hemolyzed plasma appearance and marked presumptive IMHA is most consistent with hemoglobinuria; the lack of clear plasma and a lack of history and physical examination findings consistent with severe muscle damage rule out myoglobinuria. The 3+ blood reading is due to hemoglobinuria given the aforementioned reasoning. The 1+ protein reading is likely also due to hemoglobinuria, but concurrent hemoglobinuric nephron damage cannot be ruled out; the protein reading is expected to be of a lesser degree than the blood reading in this case as a result of the relative insensitivity of the protein strip to hemoglobin. The reddish casts are most likely hemoglobin imbibed hyaline casts. The 1+ bilirubinuria may be related to hyperbilirubinemia associated with IMHA, but this could also be a normal finding in the dog; the lack of visible icteric plasma should not be surprising given that bilirubinuria precedes hyperbilirubinemia and the potential for it to be masked by the concurrent hemolyzed plasma appearance.
IMHA is primarily deduced by the presence of a marked anemia with agglutination, spherocytes, a hemolyzed plasma appearance, and findings most consistent with hemoglobinuria; it is important to note that IMHA may be also present in cases that do not have every one of the aforementioned findings. Additionally, IMHA commonly is associated with an inflammatory leukogram (sometimes with toxic neutrophils) and a strongly regenerative anemia (unless there is concurrent immune-mediated destruction of reticulocytes).
IMT may be associated with IMHA (known as Evans syndrome in human medicine), but other potential causes of thrombocytopenia need to be ruled out, especially DIC because of its strong association with primary IMHA.
Normal RBCs appear yellowish green with NMB. The reticulocytes will be the same color, but will contain deeply basophilic (bluish) dots or strands. Cats have two types of reticulocytes, punctate and aggregate (see Figure 16-11). Only the reticulocytes that have prominent clumps of reticulum (aggregate reticulocytes) are counted. The RBCs with small single dots (punctate reticulocytes) are generally not included in the count, but their presence should be noted. A reticulocyte count is the number of reticulocytes noted in a count of 1000 RBCs expressed as a percentage. In dogs and cats, reticulocyte counts expressed as percentages should then be corrected to account for the patient’s PCV or Hct (the corrected reticulocyte percentage [CRP]), or the absolute reticulocyte count per microliter can be reported by multiplying the percentage of reticulocytes by the RBC count.
CRPs greater than 1% in the dog and greater than 0.4% in the cat and absolute reticulocyte counts greater than 80,000/μl and greater than 60,000/μl in the cat are supportive of a regenerative anemia, with the degree of response expected to be proportional to the severity of the anemia. Horses do not release immature RBCs from the bone marrow, even when they are severely anemic, so polychromasia and reticulocytosis are not seen in equine peripheral blood. Although an increased MCV is strongly supportive of a regenerative response in an anemic equid, an MCV within the reference interval does not exclude a regenerative response.
Hypochromic RBCs have an increased area of central pallor with a narrow, peripheral rim of hemoglobin resulting from an abnormally low amount of hemoglobin within the cell. The most common cause of hypochromasia is iron deficiency. Hypochromasia can be confirmed by a low MCHC provided by automated instruments. True hypochromic RBCs (see Figure 16-6) must be differentiated from “punched out” RBCs, which are normochromic, but have a more distinct central pallor with a thick dense rim of hemoglobinized cytoplasm. These cells are an artifact of blood film preparation, not a significant pathologic change. Hyperchromasia, or increased hemoglobin content, does not occur in RBCs, although increased MCHC values may be seen secondary to hemolysis, lipemia, icterus, and Heinz body formation. Because this elevation in MCHC is not a symptom of a diseased process but rather is a result of an error in collection, sample storage or patient preparation, it is referred to as an artifact and the MCHC is said to be “artifactually” elevated.
Rouleaux are groupings of RBCs that resemble stacked coins (Figure 16-12). Marked rouleaux formation is normal in horses and, to a lesser extent, in cats. In dogs, rouleaux formation may occur in inflammatory or neoplastic diseases. It is important to differentiate rouleaux from true agglutination (clumping) of RBCs. Agglutinated RBCs tend to appear as clumps rather than as stacked coins. The clumping is caused by strong attachments formed between antibodies on the surfaces of RBCs. This can be seen, for example, when an animal has a reaction during and after a blood transfusion. If the blood of the donor is not compatible with that of the recipient, the RBCs will form strong attachments to one another (Figure 16-13). Needless to say, this is a serious and life threatening complication. Blood types can be tested to see if cross-reactivity occurs by mixing the blood samples together in a glass tube or on a glass slide. If agglutination of RBCs occurs, it can often be seen grossly as clumps on the side of the blood tube and on the blood film. If there is some question about whether a blood sample is exhibiting rouleaux or true agglutination, a saline test can be performed. The blood cells are washed by adding 1 drop of blood to 5 ml of saline solution and centrifuging for 3 minutes. The supernatant is poured off, the RBCs are resuspended in saline solution, and a wet mount preparation is made. Rouleaux will disperse as a result of the dilution of the serum protein, but agglutinated RBCs will remain clumped because of their strong cross-linking.
A Coombs’ test may be requested to confirm the presence of immune mediated hemolytic anemia (IMHA). In IMHA, an animal produces antibodies that attach to and ultimately leads to the destruction of its own RBCs. The Coombs’ test is a species-specific test that detects the presence of these antibodies. Gross or microscopic RBC agglutination precludes the use of a Coombs’ test because surface-bound antibodies are presumed to be present during agglutination. In other words, if you see clumps of RBCs, don’t bother doing a Coombs test, because you can assume it will be positive.
The evaluation of erythrocytes under oil immersion should also include a search for RBC parasites, particularly in cases of anemia. Mycoplasma haemofelis (formally known as Haemobartonella felis), the parasite responsible for feline infectious anemia, appears as small coccoid or rodlike structures on the surface of RBCs (Figure 16-14, A). A careful search for M. haemofelis organisms should be performed on any anemic cat. These parasites may be difficult to identify because they can be easily confused with protein and stain precipitates adhered to the cell surface. Mycoplasma haemocanis (formally known as Haemobartonella canis) is rarely seen, but is more readily identified (Figure 16-14, B). Other Mycoplasma spp., formally known as Eperythrozoon spp., which are found in cattle, sheep, and swine, may appear similar to M. haemofelis or may occur as ring forms on the RBCs. Anaplasma marginale, a parasite of bovine RBCs, appears as a small spherical body within the RBC, close to the cell margin. Another RBC parasite is Babesia spp. Babesia spp. are larger and lighter staining than the previously mentioned parasites, and they tend to occur as tear-shaped structures (often paired) within the RBCs. It is important to note that these parasites are diagnosed on standard Wright’s-stained blood smears; one must take care to not misinterpret reticulum staining with potential parasites when using an NMB stain.
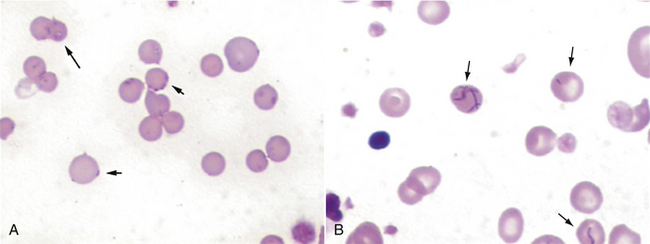
FIGURE 16-14 A, Mycoplasma haemofelis on periphery of RBCs. B, Mycoplasma haemocanis with strands of organisms across the surface.
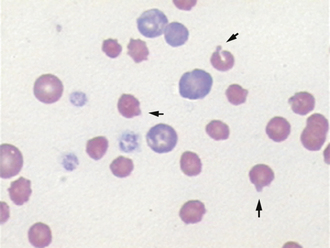
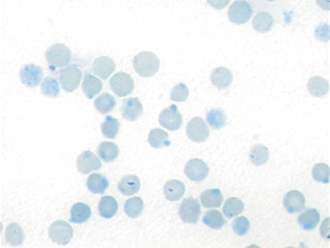
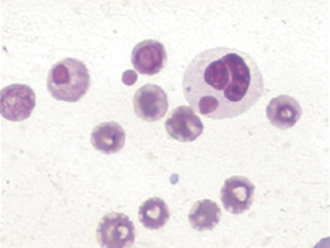
Other RBC morphologic abnormalities include Howell-Jolly bodies, basophilic stippling, Heinz bodies, and viral inclusions. Howell-Jolly bodies are small, often singular, deeply basophilic nuclear remnants that are occasionally seen on normal blood films. Increased numbers of Howell-Jolly bodies can be seen with regenerative anemias and in splenectomized animals. Basophilic stippling is due to staining of small amounts of cytoplasmic RNA in RBCs. These inclusions are multiple tiny, lightly basophilic dots in the RBC cytoplasm. They can be found in cases of markedly regenerative anemia in dogs and cats, but are found more commonly in cattle. Basophilic stippling may also be seen occasionally in cases of lead poisoning. The most consistent finding in lead poisoning is increased numbers of NRBCs with mild to no anemia. Heinz bodies are denatured hemoglobin that has fused to the RBC membrane and appear as hard to distinguish lightly eosinophilic, spherical inclusions (Figure 16-15). These inclusions are most readily seen when the reticulocyte (NMB) stain is applied. They appear as distinct, darkly staining inclusions frequently protruding from the cell surface (Figure 16-16). Distemper virus inclusions may be seen in either RBCs or WBCs. These appear as distinct, spherical, eosinophilic to lightly basophilic inclusions and may sometimes be more readily appreciated with some of the rapid Wright’s stains (Figures 16-17 and 16-18).
LEUKOCYTE EVALUATION
The WBCs also known as leukocytes (leuko = white) are categorized on the basis of nuclear segmentation and cytoplasmic granularity. Leukocytes may have distinct nuclear segmentation, such as neutrophils, eosinophils, and basophils, or may have round to oval nuclei, such as lymphocytes and monocytes; additionally, monocytes may display nuclear lobulation, but not segmentation. Leukocytes can also be characterized on the basis of the presence or absence of cytoplasmic granules, and further subdivided by granule coloration in addition to shape for some species that have similarly colored granules (heterophils and eosinophils). Eosinophil granules have eosinophilic (reddish-orange) coloration, basophil granules are basophilic (bluish-purple), and neutrophil granules are neutral (clear, but identifiable by dropping the substage condenser). The morphologic term heterophil is used to describe the appearance of obvious fine, reddish cytoplasmic granules normally found in neutrophil equivalents that are found in species such as elephants, rodents, avians, reptilians, amphibians, and nonhuman primates. Agranulocytes, such as monocytes and lymphocytes, typically do not display distinct cytoplasmic granulation, but a fine reddish-pinkish granularity may occasionally be seen in monocytes. Certain less commonly encountered subsets of lymphocytes can display focal accumulations of low numbers of small reddish granules (granular lymphocytes).
The evaluation of leukocyte numbers and morphology is important to define various disease states too broad in scope to detail herein, but often such information is used to differentiate potential systemic inflammatory conditions from other causes of neutrophilias, such as secondary to stress (mediated by glucocorticoids) and excitement (mediated by epinephrine). The interpretation of leukocyte responses should be based upon absolute cell concentrations (103/μl) instead of percentages.
Neutrophils
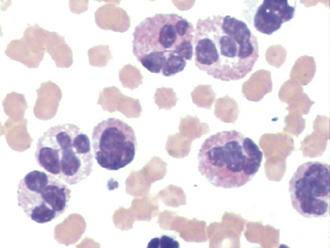
In domestic species such as the dog, cat, and horse, the predominant WBC is the mature segmented neutrophil, referred to as a segmenter or seg (Figure 16-19); in contrast, the predominant leukocyte in cattle, sheep, and goats is the lymphocyte, and as such, a predominance of neutrophils (lymphocyte-neutrophil inversion or reversal) may be indicative of systemic inflammation. Pigs exhibit about equal numbers of lymphocytes and neutrophils. The average time spent by the neutrophil in the blood before entering tissue is only about 5 to 10 hours, so peripheral neutrophil numbers are used as one method of assessing recent systemic inflammatory reactions. Normal neutrophils have deeply staining, clumped, segmented nuclei (three to five lobes) with relatively clear cytoplasm. The degree of segmentation observed for a mature neutrophil varies with species and is important to recognize to prevent misclassification of lesser segmented immature forms.
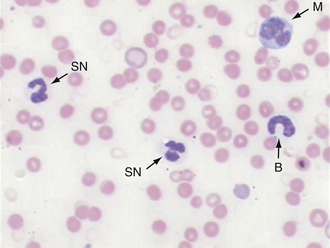
FIGURE 16-19 Canine blood film. Two segmented neutrophils (SN), a band (B) to the right, and a monocyte (M) in upper right corner.
TECHNICIAN NOTE
Extra care must be taken in differentiating monocytes from toxic band neutrophils, particularly in horses.
Charts that depict the maturation of white blood cells typically list the most immature form of the cell on the left hand side of the page and illustrate increasingly mature stages of the cells as the reader moves from the left to the right side of the page. When immature cells are released from the bone barrow before they are fully mature, this is said to be “a left shift” referring to the shift from the mature cells on the right hand side of the chart to the less mature cells toward the left hand side. A left shift is indicative of a disease process. For example, the nuclei of newly formed neutrophils are single circular structures. As the cell matures, the nucleus invaginates and bends forming a band (like a head band). The band then constricts in a number of locations forming thin isthmus-like connections between thicker segments. These mature cells are called segmenters and the immature cells are called bands. During a blood smear evaluation, an important morphologic change in neutrophils is the appearance of immature band-shaped nuclei. Because mature nuclei are segmented, a band shaped nucleus indicates the release of immature neutrophils from the bone marrow. Mild systemic inflammation is frequently reflected in the CBC as an absolute increase in segmenters also known as a mature neutrophilia. As systemic inflammation increases, the bone marrow’s storage pool of segmenters cannot fully meet this increased demand for neutrophils, and increased numbers of bands are released leading to a left shift. In other words, a left shift occurs when systemic inflammatory demands cannot be fully met by the bone marrow storage pool. A degenerate left shift is said to exist if a left shift is present in the absence of increased segmenters, which may occur when extreme systemic inflammatory demands deplete the bone marrow’s storage pool. A band nucleus is less segmented, and nuclear borders assume a more uniform parallel appearance (see Figures 16-8, 16-9, and 16-19). Even more immature cells, with bean-shaped or oval nuclei (metamyelocytes or myelocytes, respectively), may be seen in cases of extreme tissue demand for neutrophils. Neutrophils, mature or immature, may also show evidence of inflammatory disease as demonstrated by certain cytoplasmic characteristics known as toxic changes; these include any combination of Döhle’s bodies, cytoplasmic vacuolation, cytoplasmic basophilia, and, rarely, retention of fine, reddish granules called toxic granulation. Notice that the band neutrofils in Figures 16-8 and 16-9 also show toxic changes. Toxic changes represent cytoplasmic defects in the maturation of blood neutrophils that develop secondary to intense granulopoiesis; this terminology must not be confused with degenerate changes, which represent nuclear dissolution in dying neutrophils found in tissue and fluids. Frequently, toxic changes are quantitated using scales that vary in scoring methodology between laboratories. Döhle’s bodies are small, pale, bluish-gray, irregular cytoplasmic inclusions of RNA containing rough endoplasmic reticulum. Neutrophils from healthy cats may occasionally exhibit a few small Döhle’s bodies, but greater numbers and/or larger ones are likely to be associated with systemic inflammatory disease. Generalized cytoplasmic basophilia is representative of increased amounts of RNA. Cytoplasmic vacuolation occurs secondary to organelle abnormalities. In contrast to these cytoplasmic changes, nuclear hypersegmentation (nuclei with five or more lobes) is a normal aging change that implies a nontoxic environment and prolonged circulation of neutrophils. They are most frequently seen in the presence of excessive steroids, in which neutrophils remain in circulation longer than normal.
An animal’s gender may also be determined by the appearance of a small drumstick-appearing nuclear appendage called a Barr body. The Barr body represents an inactive X chromosome that is present in females. If these are reliably found on blood smears of an animal, it is likely to be a female; if Barr bodies are not found, one cannot determine the animal’s gender.
Eosinophils
Eosinophils help to control allergic or anaphylactic hypersensitivity reactions. They are attracted to the sites of these reactions by substances released from sensitized mast cells; therefore eosinophils tend to occur where mast cells congregate. The eosinophil is characterized by a segmented nucleus, colorless to pale blue cytoplasm, and distinct eosinophilic (reddish-orange) staining granules in the cytoplasm.
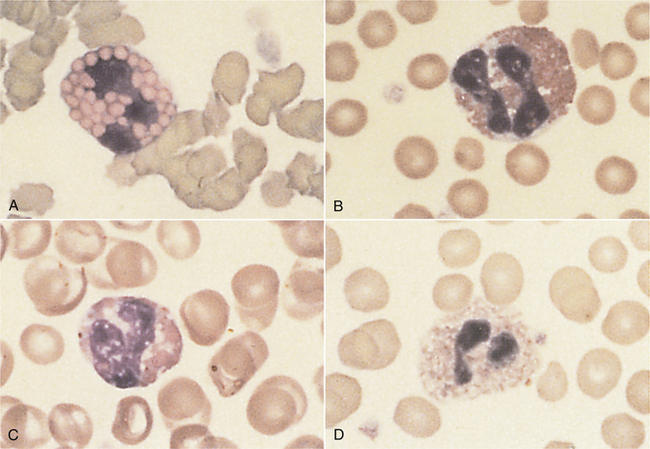
The morphologic appearance of eosinophil granules varies from species to species, so they can be used to identify the origin of a blood sample. The eosinophils of cats contain numerous tiny rod-shaped granules that may obscure the nucleus. The eosinophil granules of dogs are less numerous and are usually round, but may vary considerably in size. Differences may be found between breeds; many Greyhounds have eosinophils that display clear nonstaining granules within a grayish cytoplasm and a relatively less segmented nucleus, which must not be mistaken for toxic bands. The eosinophil granules of horses are extremely distinctive; they are large and round and a much brighter orange than those of small animals. Bovine eosinophil granules are also bright orange, but are much smaller and more numerous than those of the horse and much more uniform in size than those of the dog. Figure 16-20 illustrates the diversity of eosinophil granules found in various domestic species.
Basophils
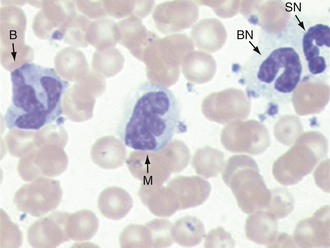
Basophils are relatively rare in blood films, but, when present, tend to occur in association with increased eosinophils. Classically, they have dark basophilic (blue) granules, but they also may vary considerably from species to species. Feline basophils tend to have light lavender to almost pink granules, rather than the dark purple granules seen in other species. Canine basophils may have few to no granules and must be differentiated from neutrophils on the basis of an elongated nucleus and a more basophilic cytoplasm (Figure 16-21). Equine and bovine basophils tend to have variable numbers of the more typical dark basophilic granules. Basophils are frequently confused with mast cells because of similar granules, but the basophil nucleus is segmented, and the mast cell nucleus is round or oval.
Lymphocytes
Lymphocytes are usually small- to medium-sized mononuclear cells. The nucleus of lymphocytes dominates the cell so that only a thin rim of light blue cytoplasm is visible surrounding the nucleus. Lymphocytes are therefore said to have a high nuclear to cytoplasmic ratio or N/C ratio (Figure 16-22). Intermediate- to large-sized lymphocytes may be present more frequently in large animals, but can also be present in most species secondary to antigenic stimulation. These cells have clear cytoplasm, moderate N/C ratios, centralized oval nuclei with a brushed chromatin pattern, and may display a focal accumulation of low numbers of small reddish granules. During periods of antigenic stimulation in all species, some of the lymphocytes in the blood film may have extremely basophilic cytoplasm with a small, pale, perinuclear zone (the site of the Golgi apparatus) and possibly azurophilic granules. These cells are referred to as reactive lymphocytes. Intermediate lymphocytes and reactive lymphocytes and monocytes must be differentiated from lymphoblasts (immature lyphocytes), which may be found circulating in cases of lymphoma and lymphoid leukemias. Lymphoblasts are defined by the presence of one or more variably sized usually round to oval basophilic nucleoli within their nuclei; additionally, these cells are intermediate to large in size, with low to moderate N/C ratios, moderately to darkly basophilic cytoplasm, frequent apparent Golgi zones, close nuclear to plasma membrane apposition along most of the perimeter of their round to oval nucleus, and have relatively less dense chromatin patterns (Figure 16-23).
Monocytes
Monocytes (see Figures 16-19 and 16-21) are derived from the bone marrow and circulate in the blood briefly before entering the tissues in which they become macrophages. Macrophages phagocytize (ingest) large particles and cellular debris that neutrophils cannot handle. Monocytes have gray-blue cytoplasm that frequently has a fine, subtle, lightly eosinophilic granulation and may contain a few clear vacuoles and a variable-shaped nucleus. The nucleus can be round, oval, reniform, ameboid, or lobed. The monocyte is usually larger than the lymphocyte or neutrophil. The most common problem associated with the identification of monocytes is the tendency to confuse monocytes that have a lobate or reniform-shaped nucleus with a toxic band or metamyelocyte, respectively; nontoxic neutrophils have less basophilic cytoplasm and lack cytoplasmic vacuolation. Reactive monocytes may occasionally be seen (e.g., secondary to chemotherapy) that may be difficult to differentiate from lymphoblasts; these cells may have more darkly basophilic cytoplasm and perhaps apparent Golgi zones, but are not expected to display nucleoli.
Other Cells
Occasionally, the evaluation of the blood film reveals abnormal circulating cell types, such as mast cells, lymphoblasts, myeloblasts, and erythroblasts. The number and type of abnormal cells should be noted because they may indicate leukemia (see Figures 16-23 and 16-24) or systemic mastocytosis. Smudge (or basket) cells are swollen nuclear remnants from lysed cells that appear as pale, fibrillar, eosinophilic nuclear material lacking a cytoplasmic or nuclear membrane. These occur when excessive pressure is used in making the film, when old blood is used, and in cases where fragile cells are present (infrequently with circulating lymphoblasts). A few of these are of little significance, but numerous smudge cells can affect the accuracy of the differential count. Blood films with unusual or abnormal cells can be sent to a reference laboratory for evaluation.
ABSOLUTE VERSUS RELATIVE NUMBERS
The numbers obtained when doing the differential count are relative, or percentages of the whole cell population. These numbers have no diagnostic significance, but are used to calculate the absolute numbers of the various WBCs. Absolute numbers are the only numbers with diagnostic significance and should always be calculated and reported as such. These are obtained by multiplying the relative percentages by the total WBC count and are expressed as cells per microliter.
AUTOMATED CELL COUNTERS
A basic understanding of the principles of electronic cell counting is useful for the veterinary technician, regardless of whether the practice has an in-practice laboratory. Many practices find it convenient to use human reference or hospital laboratories, but these instruments must be specially calibrated for use with veterinary samples because of the wide variation in blood cell size among the different species. Several instruments have been designed specifically for veterinary medicine (e.g., Vet ABC-Diff Hematology Analyzer, Heska, Fort Collins, Colo. [Figure 16-25]) that are computer driven with species options and automatically change the instrument settings for multiple-species use. The major advantages of electronic cell counters are their speed, accuracy, and reproducibility. In addition to providing RBC, WBC, and platelet counts, most cell counters will measure hemoglobin and calculate the RBC indices.
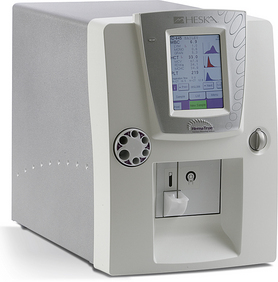
FIGURE 16-25 Heska Corporation’s HemaTrue® Veterinary Hematology Analyzer provides an accurate CBC in only 55 seconds. (Courtesy Heska Corporation, Loveland, CO.)
The disadvantage of electronic cell counters is the quality control and maintenance requirements. The veterinary technician must be able to recognize when the instruments are not functioning properly and determine the problem. The manufacturer should be willing to train the technician to perform quality control and calibration procedures, keep adequate quality control records, and handle minor adjustments. In addition, the manufacturer should be available for service calls, if needed. In some practices, consideration should be given to the purchase of a service contract; this should be discussed before investing in a major instrument.
The operating principle involved in electronic cell counting is based on a type of flow cytometry (the counting of particles as they flow past a detection device). This technology allows the instrument to count blood cells and measure the size. Most instruments use a simple orifice through which an electrical current passes. As particles (e.g., blood cells) move through the orifice, they disrupt the current by increasing the resistance (impedance) proportional to the size of the particle. The instrument is set to detect and count only particles that produce a signal that exceeds a specific resistance or threshold. The threshold settings will determine what particles are counted based on their size. This principle is important when an instrument is evaluated for use in veterinary medicine. Many instruments developed for human medicine do not accurately count RBCs with a volume of less than 55 femtoliters (fl). The RBCs of the cat, horse, cow, goat, and pig have mean cell volumes below this value. More advanced analyzers also attempt to determine cell type on the basis of differential staining patterns and other optical properties. Although veterinary-specific software exists for some of these machines, each laboratory needs to evaluate the validity of automated differential counts for the species in which they are interested; having said that, these results should never be considered absolutely accurate without a technologist’s slide review.
WBCs from different species also have varying sizes after exposure to RBC lysing solutions. Total WBC counts on some instruments can be falsely decreased in the dog because of its small leukocytes. The reverse is true in the cat. The cat’s platelets tend to form large clumps that are counted as leukocytes, thus falsely elevating the WBC count. A close inspection of the blood film will help the technician identify this problem.
Whole blood can be diluted for counting either before introduction of the sample into the machine (predilution) or by the instrument as part of the sampling cycle. In the newer instruments, whole blood is aspirated and diluted for the RBC count, and a portion of the sample is lysed to remove the RBCs and allow the WBCs to be counted. The lysed sample is often used for hemoglobin determination.
It is important to reiterate the limitations of these devices; differential counts obtained should not replace the blood film examination; the automated reticulocyte or platelet count should not be taken at face value. Blood cell morphology is important in evaluating the numbers obtained in the blood cell counts. The automated instruments cannot tell the technician whether band neutrophils, toxic neutrophils, polychromatophilic RBCs, RBC parasites, or NRBCs are present. Although clinicians may sometimes request manual platelet counts in cases of marked thrombocytopenias, automated are more accurate than manual platelet counts if platelet clumping has not been noted and associated quality control parameters are in order.
PLASMA PROTEIN DETERMINATION
The determination of the plasma protein concentration is another standard component of the routine CBC. After plasma color and turbidity have been noted, the capillary tube used for measuring the PCV is broken at a point slightly above the buffy coat (cream-colored layer of WBCs and platelets just above the RBCs), and the plasma is allowed to run through the unbroken end onto the prism of a refractometer by capillary action. Lifting the cover and tapping the Hct tube on the prism may scratch the surface of the prism. Plasma protein values obtained with a refractometer are accurate as long as the plasma is clear. If the plasma is lipemic, hemolyzed, or otherwise cloudy, the refractive index will be increased and provide an erroneously high protein measurement. The lipemic samples often have an indistinct or unfocused line on the refractometer scale. In contrast to the dilution effect of a small blood sample in a large tube, excess anticoagulant will artifactually increase the plasma protein value obtained.
A semiquantitative determination of plasma fibrinogen levels may be useful in the detection of inflammatory processes, particularly in cattle and horses. Two capillary tubes of blood are centrifuged; one is used for the PCV and plasma protein determination, as described. The second tube is placed in a 56° C to 58° C water bath for 3 minutes to cause the precipitation of fibrinogen. The tube is then recentrifuged so the fibrinogen settles just above the buffy coat. The tube is broken above the fibrinogen, and the remaining plasma is placed on the refractometer for protein determination. The difference between the protein concentration of the first tube and the protein concentration of the second tube is the fibrinogen concentration.
Fibrinogen is usually expressed in milligrams per deciliter; therefore if the first tube had a protein concentration of 7.3 g/dl and the second tube has a protein concentration of 6.9 g/dl, the plasma fibrinogen concentration is 0.4 g/dl, or 400 mg/dl. Plasma from cattle with notably increased fibrinogen may completely coagulate during incubation; when the specimen is respun, the fibrinogen does not settle out, and a fibrinogen value cannot be determined.
COAGULATION TESTING
Animals will occasionally be seen with abnormal bleeding tendencies. The ability for blood to clot (hemostasis), depends on vascular integrity, adequate numbers and normal functioning of platelets, and a complete complement of coagulation factors. These are counterbalanced by several thrombolytic factors to prevent excessive thrombosis. When vascular injury is present, the platelets are exposed to collagen fibers normally secluded within the vessel wall. The platelets adhere to the periphery of the lesion and aggregate to form an initial plug to stem the immediate flow of blood. The formation of this initial plug is called primary hemostasis. Subsequently, a complicated cascade of biochemical reactions occurs that leads to the formation of a fibrin mesh that envelopes the plug of platelets and stabilizes it forming a strong clot. This latter stage of coagulation is called secondary hemostasis. Without a fibrin net, the platelets would lose their attachments to one another and the initial plug would break apart. Consequently, bleeding would begin again.
Hemostasis relies upon a wide range of proteins called clotting factors and cofactors such as calcium and vitamin K. These substances interact with one another, forming a cascade of biochemical reactions that ultimately transforms prothrombin into thrombin which in turn converts fibrinogen to fibrin. Each clotting factor is essential for the formation of fibrin. If any single factor is absent, the clotting cascade cannot be completed and a fibrin mesh cannot be manufactured. Basic coagulation testing therefore includes a platelet count and an evaluation of the two major pathways (intrinsic and extrinsic) that leads to the conversion of prothrombin to thrombin. The activated partial thromboplastin time (PTT) test evaluates the intrinsic pathway while the prothrombin time test evaluates the extrinsic pathway.
Most of these tests require special instrumentation and are submitted to a reference laboratory; however, careful sample collection and submission are critical for obtaining valid results. The venipuncture must be accurate to prevent tissue injury, which will invalidate coagulation assays. In addition to collection in an EDTA tube for the platelet count, blood must be collected in tubes with citrate anticoagulant (turquoise or blue top) for coagulation assays. The proper amount of blood must be drawn to maintain the 9:1 ratio of blood to anticoagulant for reliable results. Only plastic or siliconized glass should be used in handling these samples because contact with regular glass will invalidate the results. The samples should be centrifuged, and the plasma should be tested immediately or frozen. The reference laboratory should always be contacted for additional directions before samples are obtained and submitted for coagulation testing.
CLINICAL CHEMISTRY
The blood and urine of healthy animals contain biochemical substances such as enzymes, hormones, and electrolytes that remain stable within certain ranges. These ranges indicate that organs and tissues in the body are functioning normally. In the healthy state, the organs and tissues release specific amounts of these biochemicals into blood and urine. In the unhealthy state, these substances may increase or decrease beyond the normal ranges. Blood and urine is collected from unhealthy animals and evaluated to determine which organs and tissues are diseased. Numerous chemistry parameters can then be evaluated via specialized tests called assays. For example, there are specific enzymes that are produced or processed by the liver that can be analyzed to evaluate liver function. Aspartate aminotransferase (AST) and alanine aminotransferase (ALT) are intracellular enzymes that may be elevated as a result of damage to hepatocytes (liver cells). AST, in particular, may also be increased with muscle injury. Alkaline phosphatase and γ-glutamyltransferase are also produced in the liver, but are more often associated with bile duct (cholestatic) disease. They may also be increased because of steroid use. Abnormal blood levels of bilirubin and albumin may also be associated with liver disease, but may also be altered as a result of injury to other systems.
Two tests that can be used to evaluate kidney function are blood urea nitrogen (BUN) and creatinine. Concentrations of these compounds are used to differentiate simple dehydration from kidney (renal) dysfunction. The interpretation of concentrations of these two substances requires urine to be examined at the same time. An urinalysis and the specific gravity (SG) of urine must be performed at the same time the blood is analyzed.
Measurements of total protein (comprised of albumin, fibrinogen, and globulins) is generally included in the basic chemistry panel. Variations in these proteins may be indicative of a variety of disorders. Values may be increased with dehydration, inflammation, or autoimmune disease. Albumin values may be decreased in association with liver failure, gastrointestinal disorders, or renal glomerular disease.
Levels of serum sodium, potassium, chloride, calcium, and phosphorus, collectively referred to as electrolytes (ions that dissociate in water and have the capacity to conduct electricity; “-lyte” able to be dissolved), can also be affected by various disorders. They may reflect changes in fluid balance, gastrointestinal disorders (vomiting, diarrhea), acid-base disturbances, renal dysfunction, or metabolic and endocrine disorders. Calcium and phosphorus are intimately associated with bone growth, and levels may be higher in younger animals than in adults. Calcium circulates bound to albumin; therefore calcium levels may be low in cases of decreased albumin levels. Phosphorus levels are regulated in the kidney, so the phosphorus level often increases in cases relating to decreased urine production. Phosphorus is also present in RBCs, so if there is hemolysis or serum is allowed to remain on the cells, serum phosphorus results may be falsely elevated.
Several small, relatively inexpensive clinical chemistry instruments have been developed. As with all equipment, veterinary practices must have a demand for these and must be able to justify the expense. Two general types of chemistry analyzers are commonly used: liquid reagent chemistry and dry chemistry. Instruments that use liquid reagents require more technical expertise and time in preparing reagents and monitoring the performance. The dry chemistry instruments are simpler to use and provide consistent performance. The principles of operation differ significantly between the two types of instruments, as does the extent to which specimen quality affects the measurement. An important practical consideration in purchasing an instrument is the per test operating cost versus the relative ease of running individual tests; in general, large run wet reagent costs will have lower per test costs than individual dry reagent methodologies, but the latter may be more appropriate for less requested tests and for after-hours use.
EQUIPMENT
Regardless of whether an in-house chemistry analyzer is maintained and operated, veterinary practices will need a sample collection system consisting of either syringes and needles or Vacutainers plus clean plastic or glass tubes in which to store or transport samples. A centrifuge and pipettes will be necessary for the separation of the serum or plasma from the cells.
CLINICAL CHEMISTRY INSTRUMENTATION
The liquid reagent–based instruments use the principle of photometry (the measurement of light transmittance by a solution). Beer’s law states that the concentration of a substance in a liquid is indirectly proportional to the amount of light that passes through the liquid. In other words, the higher the concentration of a substance in a liquid, the less light is able to pass through it. Most instruments have a spectrophotometer to measure the amount of light transmitted. A spectrophotometer consists of a light source directed through a specific path and a photosensitive detector that converts light into electrical energy. Each substance will transmit light at a specific wavelength. For the purpose of increasing the specificity of the measurement, filters are placed between the light source and the sample to allow only a specific wavelength to pass through the sample. The magnitude of the electrical current produced by the detector corresponds to the concentration of the substance measured.
The instruments that use dry reagents are becoming more popular for in-practice use. The major advantage of these instruments is the elimination of liquid reagents, which must be reconstituted or diluted before use. Dry chemistry instruments use reagent slides or cartridges. A specific amount of the patient’s sample is added as directed, and the intensity of the color that develops is measured by the principle of reflectance. Light is transmitted to the analyte slide, and the reflected light is conducted to a photodetector. The density of the color formed by the chemical reaction is determined and is proportional to the concentration of the substance measured. There is less interference from lipemia or hemolysis because this method does not depend on reading light transmitted through a liquid as with the spectrophotometer-based instruments.
Several dry chemistry instruments (e.g., Heska SPOTCHEM and i-STAT, Abaxis VetScan, IDEXX VetTest) that are designed specifically for use with veterinary samples are available (Figure 16-26). Available tests may vary from analyzer to analyzer, and new tests are often added. The primary advantage of using an instrument intended for veterinary testing is the availability of predetermined reference intervals, which can be used until the laboratory can establish its own values. In most cases with these instruments, little variation occurs from instrument to instrument or operator to operator. Veterinary samples can vary significantly from human samples in the concentration of particular substances. This can be problematic if an analyzer not specifically designed for veterinary samples is used, because the limits of the chemistry test (ranges established for humans) must be adhered to.
QUALITY CONTROL PROGRAMS
Any veterinary practice that decides to establish an in-house laboratory must make a commitment to quality control. Laboratory instruments will provide valid accurate results only if the samples are handled correctly, a well-maintained instrument is used, and the tests are performed correctly. The importance of routine maintenance and calibration procedures for all instruments cannot be overemphasized. However, even the most sophisticated, accurate, and well-maintained instrument cannot overcome errors in technique or poor sample quality. The technician should be familiar with the principles and limitations of all assays performed in the laboratory. Some of the more common causes for inaccurate results because of technical errors or sample quality are listed in Box 16-1. A quality control program consists of monitoring results of known control samples for identification of irregularities in reported values and following generally accepted laboratory procedures. Several textbooks on clinical chemistry and laboratory medicine (see Recommended Reading) provide excellent in-depth reviews of quality assurance programs. The following discussion deals primarily with the basics in monitoring an instrument to ensure the accuracy of reported data.
The three levels of quality control are preanalytic procedures, analytic procedures, and analytic quality monitoring procedures. The preanalytic procedures deal with how the patient is prepared (fasting versus nonfasting samples), patient and specimen identification, specimen acquisition, and specimen processing. The establishment of standard procedures for each of these steps will decrease the likelihood that samples will be misidentified or of poor quality (hemolyzed or lipemic). This aspect of quality control is important even in practices that send their clinical pathology samples to a reference laboratory. Analytic variables include the analytic method, standardization and calibration procedures, documentation of analytic protocols and procedures, and monitoring of equipment during use. This aspect of quality control is usually well defined by the manufacturer of the instrument and should be followed closely. The final level, the monitoring of analytic quality by using statistical methods and control charts, is the aspect that involves the use of control products and record keeping. This aspect is the responsibility of the technician performing the tests.
CONTROLS AND STANDARDS
Standard solutions are quality control products that contain the analyte of interest at a validated “true” concentration as determined by the manufacturer using “gold standard” methodologies; these are expected to accurately represent the stated concentration and as such can be relatively expensive. Control solutions are quality control products that may report a given expected concentration of the analyte of interest, or alternatively a laboratory may use a sample, possibly pooled, from representative animal(s) that has had its concentration repeatedly determined by the analyzer itself; although commercially available control solutions are expected to approximate the reported analyte concentration, they generally have not undergone the same level of rigorous validation and, as such, are generally less expensive than standard solutions. In general, quality control products should have an overall composition similar to the sample assayed, be stable, be available in premeasured amounts to prevent alterations caused by repeated freeze-thaw cycles, and have little vial-to-vial variation. Quality control products can be purchased from an independent source or from the company that makes the test kit or instrument. Most of these products are available as normal, high abnormal, and low abnormal values. The quality control products are analyzed in a manner identical to that used for patients’ samples. The accuracy of an analyzer is judged upon how similar results of a measured standard solution are in comparison with the manufacturer’s reported “true” concentration. The precision of an analyzer is judged upon the reproducibility of repeated measurements of a control solution. An analyzer can be precise and not accurate if the measured values are reproducible, but consistently higher or lower than the “true” value of a standard solution; although the establishment of a laboratory reference interval may allow for such data to still retain diagnostic utility, ideally the sources of the inaccuracy should be identified and resolved.
Many products are provided in a lyophilized (dehydrated) form that requires rehydration with distilled water or a diluent provided by the manufacturer. The solution must be diluted properly to ensure that the concentration of the analytes is correct. Imprecision in diluting the products will yield inaccurate values, even though the instrument is working properly. It is highly recommended that volumetric or other precise pipettes be used to dilute the control products (a graduated cylinder is not acceptable).
The control values must fall within a specific acceptable interval, which usually encompasses the mean ±2 SD (standard deviations). This range is established by the manufacturer of the product by repeated assay of the solution. When the instrument reports a control value above or below the established interval, there is a problem with the procedure, and test results for that particular sample should not be reported until the problem is identified.
A separate log of the quality control results should be kept and reviewed periodically. A useful visual display of the instrument’s performance for quick inspection and review is the Levy-Jennings chart. Figure 16-27 shows the use of the Levy-Jennings chart to keep track of quality control data. By inspection of control data over 1 month, a technician can see the control values gently drift upward or downward, indicating possible deterioration of the control product or a change in the light source intensity. A wide scatter of values outside the range on both the low and high ends indicates imprecision on the part of the instrument or technician. It is best to keep the chart close to the instrument, not hidden in a file drawer. Everyone who uses the instrument must be willing to run controls and chart the results. Other useful laboratory records include calibration logs, sample logs, and maintenance logs.
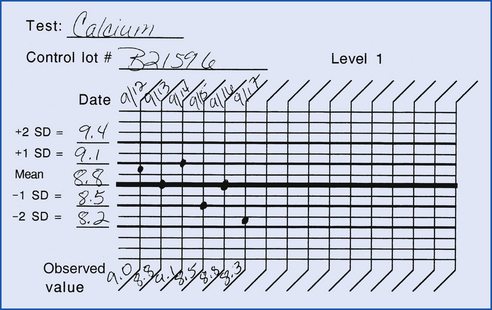
SAMPLE HANDLING
Sample handling is a critical step in obtaining accurate laboratory data. Several factors can interfere with the analysis of a sample. The most common problems in veterinary medicine are hemolysis and lipemia. Difficulty in performing the venipuncture or excess pressure applied to the syringe during collection can cause significant hemolysis. The most common cause of lipemia is collection of a sample after the patient has eaten. At times, both hemolysis and lipemia are unavoidable because they are the result of a disease process.
The effect hemolysis and lipemia will have on laboratory data is method dependent. There are no general rules to assist the interpretation of changes caused by sample quality. A good reference laboratory will provide information on how each of its tests is affected by these two changes. Manufacturers of the instruments and reagents should provide information on how interfering factors, such as hemolysis and lipemia, affect the methods used in their instrument. Hemolysis will commonly affect inorganic phosphorus resulting in artifactually increased or decreased values depending on the assay methodology. Lipemia will interfere with any method that depends on an optical density read on a spectrophotometer. Some chemistry instruments can compensate for this change. The reference laboratory should be able to indicate which tests are affected. Errors in processing the sample can also cause artifactual changes in laboratory data. It is important to use the appropriate collection tube for the test performed.
Samples collected for chemistry profiles can be collected in clot tubes (red tops), which contain no anticoagulant, or in lithium heparin tubes (green tops). Blood collected in clot tubes (tubes without anticoagulant) must be allowed to completely clot before the sample can be centrifuged and the serum removed; complete clot formation usually takes about 30 minutes. Clot tubes with activator gels (tiger tops) will promote clotting, thus decreasing the time required for complete clot formation and facilitating separation of the serum from the RBCs. The sample should not be refrigerated before complete clot formation because this inhibits good serum separation. In addition, a fibrin clot forms above the RBCs if the blood is centrifuged before complete clot formation or at too fast a speed.
TECHNICIAN NOTE
Serum must be removed from the clot as soon as possible to prevent inaccurate results.
Blood collected in lithium heparin tubes (green tops) is excellent for emergency needs because it does not have to clot before it can be separated for analysis. Heparin may interfere with a few chemistry tests, so the reference laboratory should be consulted before the submission of heparinized plasma for chemistry panels. Lithium heparin is also excellent for emergency electrolyte panels. EDTA tubes (purple tops) are unacceptable for most chemistry tests because EDTA binds calcium to prevent clot formation and thus interferes with many of the assays, particularly those that are enzyme based. In addition, potassium EDTA will greatly increase serum potassium levels.
Keep in mind that blood cells collected in blood tubes are alive and metabolically active. They will continue to use up nutrients from the serum such as glucose and give off waste products. Therefore, the necessity of separating serum from the clot as soon as possible cannot be overstressed. Prolonged exposure of serum to the cells will erroneously decrease the glucose level; will increase the phosphorus level; may increase the potassium level, depending on species (especially in the horse); and may affect some enzyme activities. Do not depend on the reference laboratory courier service to get the sample to the laboratory in time to prevent these changes. It is best to take the time and responsibility to separate the serum and ensure the quality of the sample.
URINALYSIS
Urinalysis is one clinical laboratory procedure that should be performed as a part of any minimal database in all veterinary practices. A typical urinalysis consists of gross examination, a urine specific gravity (SG), chemical analysis, and sediment evaluation. Because the concentration of urine changes with the hydration status of a normal animal, a concurrent urine SG is necessary for the accurate evaluation of renal parameters (BUN and creatinine). In other words, if the BUN is elevated, is this due to kidney disease or dehydration? The hydration of the animal must be assessed via SG at the same time the blood is evaluated for abnormal elevations of substances. This is particularly important if fluid therapy has been initiated because the hydration status of the animal is changing. It is an important that urinalysis be performed on fresh urine, when possible, because protein and other substances that might be found in urine can degenerate with time. The techniques involved are simple and require no special instrumentation. Urine samples should be collected into clean glass or plastic containers. In general, no preservatives are necessary.
EQUIPMENT
The equipment necessary for performing the urinalysis is minimal. A supply of clean glass or plastic collection containers, a centrifuge and conical centrifuge tubes, chemical reagent strips, clean glass slides and coverslips, a refractometer, plastic pipettes, and a microscope are all that are required.
URINE COLLECTION
Urine may be collected by several methods. It must be understood that any structures that came into contact with the urine before exiting the body will potentially be a source of pathologic involvement if abnormal results are obtained.
The least invasive method is to catch a free-flow nonsterile sample (“free catch”) as the animal voids spontaneously or is assisted by gentle manual expression. Unfortunately, this method samples the urethra and area around the external opening in addition to the bladder, ureters, and kidneys. If this method is used, the initial stream of urine should not be caught because the first portion may contain especially high amounts of cells and debris from the urethra and lower genital tract. It is better to collect a midstream sample, avoiding collection of the beginning or the end of a voided urine sample.
A second method that may be used to collect urine is cystocentesis. This procedure involves placing a needle (with a syringe attached) through the ventral abdominal wall into the lumen of the bladder and aspirating urine. Aseptic technique must be used. By performing cystocentesis, secretions and debris of the lower urogenital tract are avoided, and the interpretation of urinalysis findings is simplified. Hemorrhage induced through the collection process (iatrogenic hemorrhage) can occur during cystocentesis; therefore it is not unusual to have a widely varying number of RBCs in the sediment of samples obtained by this method.
Another method for collecting urine is by catheterization of the bladder. This procedure must be done as aseptically as possible to prevent the introduction of bacteria into the urinary tract. Urine collected in this manner frequently contains increased numbers of epithelial cells (including squamous cells), which may appear in sheets and clusters. A “traumatic catheterization” is sometimes purposely performed where the clinician tries to abrade a mass with the tip of the catheter to increase the yield of potentially neoplastic cells; this is a method of choice for sampling transitional cell carcinomas since needle aspiration of these masses has been associated with tumor spread along the needle track. Additional information on cystocentesis and catheterization can be found in Chapter 20.
Regardless of how the urine sample is collected, it should be analyzed as soon as possible. Many changes begin to occur immediately. Bacteria present in the urine will multiply, cells may degenerate, casts may dissolve (especially if the urine is alkaline), and bacteria that produce urease will convert urea to ammonia, causing the pH to increase. If there is to be any delay in performing the urinalysis, the sample should be refrigerated to slow these processes. However, refrigeration may cause a change in urine SG and interfere with some of the chemistry reactions on the chemistry reagent strip. Before a urinalysis is performed on refrigerated urine, the specimen should be allowed to come to room temperature.
EVALUATION OF PHYSICAL PROPERTIES
As with all laboratory procedures, it is wise to follow the same routine protocol with every urine sample analyzed. The physical properties evaluated in most routine urinalyses include color, appearance or turbidity, and SG. After making sure the sample is mixed well, the color (e.g., yellow, gold, red) and appearance (e.g., clear, hazy, flocculent) should be recorded.
COLOR
Normal urine is yellow to amber, depending on its concentration and constituents. Bright red urine indicates hematuria (RBCs in the urine) or hemoglobinuria (hemoglobin in the urine). Reddish-brown urine usually suggests hemoglobinuria or myoglobinuria (myoglobin in the urine); note that these two pigments cannot be distinguished from one another solely on the basis of color. High concentrations of bilirubin or urobilin cause yellowish brown urine that when shaken may produce yellowish foam. Whenever an unusual discoloration of the urine occurs, the history of any drug therapy should be evaluated because many drugs can produce abnormally colored urine. Urine that is notably discolored may make it difficult or impossible to interpret color changes when chemical reagent strips are evaluated.
TURBIDITY
Fresh urine is normally transparent at the animal’s body temperature, but as it cools to an ambient temperature, some salts may precipitate, causing the urine to become cloudy. Except for equine urine which is normally cloudy, fresh urine that is cloudy is often pathologic, and it must be examined microscopically to identify the cause: pus, blood, mucus, bacteria, casts, or crystals. Fresh equine urine is normally cloudy because it contains mucus and calcium carbonate crystals. Even clear urine should be examined microscopically because some abnormal constituents may be present in small amounts that may not cause urine to be visually cloudy.
SPECIFIC GRAVITY
A healthy kidney can concentrate and dilute urine depending upon the hydration status of the animal. Therefore determining the SG is one of the most important parts of a urinalysis and gives key insight into hydration status of the patient. SG may be determined before or after centrifugation of the urine sample because the material that settles during centrifugation has little to no effect on SG. The SG value depends on the number and size of particles in the solution and is an indicator of the ability of the kidney to concentrate or dilute urine. The SG is most accurately determined with a refractometer, which is used for determining plasma protein and requires only 1 drop of urine. If the urine sample is turbid, the SG may be determined from the supernatant after centrifugation. Reagent strips are inaccurate for the determination of SG. Common terminology is to state the first two digits as “ten” and the last two digits as either “o” + 1 to 9 or as the number itself if greater than 9; for example 1.008 is stated as “ten-o-eight” whereas 1.035 is stated as “ten-thirty five.”
There is no normal SG for urine, only appropriate SG values for a given hydration state. Animals are expected to concentrate their urine when dehydrated and dilute it when overhydrated. The minimum appropriate SG threshold for a dehydrated adult animal is as follows: cat 1.035, dog 1.030, and horse or cattle 1.025. Inability to achieve this threshold in a dehydrated animal points to renal dysfunction (actual physical damage and/or functional impairment) or postrenal involvement (obstruction and/or rupture of the ureters, urinary bladder or urethra). Dilute urine (SP <1.008) indicates that the kidneys are functioning by actively diluting the urine. The major determinant of urine SG is salt concentration because of the large number of particles involved. Protein, in contrast, has little influence on SG because they are relatively fewer in number. Glucose, likewise, has relatively little effect on SG. Both of these components, however, when found in large amounts in the urine will increase the SG by about 0.001 to 0.002. SG provides a good indication of how well the kidneys are able to function in maintaining the body’s water and osmotic balance. In addition, SG is important in interpretation of other test results. For example, a 2+ protein in dilute urine (SG <1.012) suggests a greater loss of protein than a 2+ protein in concentrated urine (SG >1.030).
As blood enters the kidney, non-cellular components including small- to medium-sized molecules are filtered through glomeruli. The liquid produced from this filtering process is called glomerular filtrate. The specific gravity of glomerular filtrate is the same as plasma. Later, as the filtrate moves through the renal tubules the SG of the filtrate is adjusted depending upon the hydration status of the animal. Urine that has the same SG (1.008 to 1.012) as the glomerular filtrate is called isosthenuric. Isosthenuria indicates that the tubules have not attempted to concentrate or dilute urine. Isosthenuric urine is not abnormal in an adequately hydrated animal. However, if an animal is dehydrated, the renal tubules are expected to concentrate urine. Similarly, if the animal is overhydrated, the kidney is expected to dilute urine.
CHEMICAL EVALUATION
Reagent strip chemistries should be performed on unspun urine, unless the urine is turbid (cloudy). If it is turbid, the chemistry tests may be done after the sample has been centrifuged. Levels of protein, glucose, ketones, blood, and bilirubin in the urine are routinely determined in addition to urinary pH. The strips contain pads that are impregnated with reagents and result in a color change when the appropriate urine constituents are present. Although the strips are simple to use, proper technique and accurate timing for reading the results are critical. The key for evaluating the pad color reactions is commonly found on the bottle itself along with the proper time to read out the result. Automated strip analyzers are available and allow for a consistent and convenient strip analysis. The strips must be properly stored, the urine must be at room temperature and well mixed, and excess urine must be shaken from the strips to obtain valid results. Significantly discolored urine may interfere with the ability to discern colors and color changes on the reagent pads.
Some commercially available strips contain reagent pads for other components, such as leukocytes; the leukocyte strip is not valid for veterinary use.
pH
pH determines the acidity or alkalinity of a substance using a scale from 0 to 14 where 7 is neutral. A pH below 7 is acidic and a pH above 7 is alkalinic. The pH of a fluid decreases as the hydrogen ion concentration increases and vice versa. Small changes in pH represent large changes in hydrogen ion concentration. Physiologically neutral serum pH is generally 7.3 to 7.4 for most species. Readings in the serum above the pH reference interval are said to be alkalemic, and those below are academic. In the case or urine, pH is detected by reagent strips with chemical indicators. Unexpectedly high urinary pH is termed alkaluric, and those below are aciduric. In general, omnivores and carnivores (such as dogs and cats) tend to have more acidic urine than do herbivores (such as cattle, horses, and human vegetarians). A fresh sample must be used because as urine stands, it loses carbon dioxide (analogous to an acid), and bacteria that are present may produce ammonia, both of which result in increased alkalinity (raising the pH). A major function of the kidney is to metabolically compensate for serum pH abnormalities; as such, urine pH is expected to rise and fall in parallel with serum pH if the kidneys are functioning appropriately, but one cannot assume that urinary pH is always an accurate indicator of serum pH.
PROTEIN
Most commercial urine reagent strips include a test for protein. Urine normally contains a small amount of protein, which is due to normal leakage and secretion from the urinary tract lining. However, this normal amount of protein is not detected by routine methods. If the reagent pad shows a positive protein test, the reaction is usually graded trace to 1+ through 4+. As mentioned, a positive protein reaction in dilute urine implies a greater protein loss than the same level of reaction in a concentrated sample. As with most reagent strip chemistry tests, results are at best only semiquantitative and are subject to several types of error. The pH directly affects readings, with false-positive results occurring in alkaline urines (pH >8). The strips are more sensitive to albumin than to other proteins, such as globulins, hemoglobin, and myoglobi, which can result in false-negative or falsely low readings. Newer, more sensitive species-specific enzyme-linked immunosorbent assay (ELISA)-based strip tests (E.R.D., Heska Corp., Fort Collins, Colo.) are now available for the dog and cat that can detect low levels of proteinuria normally undetectable by traditional strips that in theory could aid in the detection of early renal disease; studies are ongoing to determine the clinical utility of this test.
Renal protein loss can occur at the level of the glomerulus and/or the renal tubules. Protein loss into urine can actually result in hypoproteinemia if glomerular dysfunction is severe enough; the degree of protein loss with pure tubular dysfunction is low and will not result in hypoproteinemia. One can make a subjective evaluation of the amount lost by comparing the results with the SG, as previously mentioned; however, a more exact method is to collect all urine produced in a 24-hour period and calculate its total protein content. The collection of 24 hours of urine output generally requires a metabolism cage and is not practical. The urine protein to urine creatinine ratio (UPC) in any single sample is a good index of protein loss in the urine. Both urinary protein and creatinine concentrations increase with an increasing urine concentration, because neither protein nor creatinine is secreted nor resorbed by the tubules. A UPC of less than 1.0 (some state 0.5) is considered normal; a ratio greater than 3.0 (some say 2.0) supports significant glomerular protein loss; and a ratio between these values supports tubular and/or early glomerular protein loss. A urine sample with an active sediment (increased WBCs and/or high numbers of RBCs) is not suitable for the determination of the UPC because the protein present may be secondary to inflammation, tissue damage, and/or hemorrhage and as such is not necessarily indicative of renal loss. For example, an increased UPC in urine from cystocentesis with an active sediment could simply be present secondary to a cystitis (bladder infection). Additionally, prerenal causes of proteinuria must be ruled out before a UPC can be performed; small proteins, such as free hemoglobin (pathologic from hemolysis), myoglobin (pathologic from massive muscle damage), light immunoglobulin chains (pathologic from plasma cell tumors), or postcolostral ingestion, can overload the tubules’ ability to resorb them and result in proteinuria. The pathologic prerenal overflow-overload causes of proteinuria are not directly indicative of renal dysfunction, but may actually lead to renal damage if severe and/or chronic enough. UPCs are usually done at a reference laboratory because they require a sensitive protein determination. There are a few extrarenal factors that may temporarily alter glomerular permeability to protein and result in proteinuria; they include fever, strenuous exercise, shock, and cardiac or central nervous system disease.
When excessive hemorrhage into the urinary tract occurs, the result of the test for urine protein will be positive, and erythrocytes will be seen in the sediment. Possible causes of urinary tract hemorrhage include trauma, neoplasia, and inflammation. It should be noted that free hemoglobin or myoglobin in the urine will cause a positive protein test result and a positive blood test result. In either of these cases although the urine will appear reddish, intact RBCs are not a significant part of the sediment, and centrifugation of the urine will not clear the urine of reddish discoloration.
GLUCOSE
In addition to urine protein, a common reagent strip test for urine is the test for glucose. The reagent strips are quite specific for glucose. However, as with all reagent strip tests, they are not quantitative. Tablets that detect glucose, which are somewhat more quantitative, but not specific, are available.
Normally, urine contains no detectable glucose. Glucose is filtered by the glomerulus, but the body preserves this energy source by reabsorbing it in the proximal renal tubules. This resorption ability is exceeded once the blood glucose level rises above the renal threshold, which is 180 mg/dl in the dog, 280 mg/dl in the cat, or above 100 mg/dl in the cow or horse. The primary cause for glucosuria therefore is hyperglycemia. For confirmation of hyperglycemia as the cause, the blood glucose level should be determined at the same time as the urine glucose level; it should be noted that because urine may sit in the bladder for an indefinite amount of time, glucose may still be present from a previous hyperglycemic event that exceeded the renal threshold and not represent that degree of hyperglycemia in a concurrent serum glucose. Diabetes mellitus is a common cause of hyperglycemia and glucosuria.
KETONES
A test for urine ketones is included on many reagent strips; tablets are also available. Ketones will appear in the urine before they build up to a detectable level in the bloodstream, so ketonuria may occur before a detectable ketonemia occurs. Ketonuria indicates excessive fat metabolism, a deficiency in carbohydrate metabolism, or both, but is most commonly seen in conjunction with glucosuria as a complication of diabetes mellitus.
BILIRUBIN
There are reagent strips and tablets for detecting bilirubinuria, both of which use a similar reaction (diazotization), but the tablets are less subject to interference by urine color than are the strips. The tablets are also highly sensitive, so a 1+ reading, especially in concentrated urine, may not be significant. Bilirubin may be oxidized on exposure to light, so if there is much delay between obtaining the urine sample and performing the urinalysis, the sample should be protected from light to prevent false-negative results. Normal dogs may exhibit low levels of bilirubinuria in concentrated urine because the renal tubular cells can conjugate bilirubin. Bilirubinuria frequently precedes hyperbilirubinemia in most species.
BLOOD
The designation “blood” is somewhat misleading because this test actually detects intact RBCs, hemoglobin, and myoglobin. If the urine is red and erythrocytes are present in the sediment, hematuria is the reason for the positive blood reaction.
Hemoglobinuria (hemoglobin pigment in the urine) results in red to brown urine with a positive urine blood reaction and no erythrocytes in the sediment. A positive urine protein test result may also be apparent, but the degree of positivity will be less than the blood strip since the former is less sensitive to hemoglobin or myoglobin. In contrast to hematuria, hemoglobinuria will be accompanied by hemoglobinemia, imparting a pink to reddish discoloration to the serum or plasma.
Myoglobinuria (myoglobin pigment in the urine) will similarly result in red to brown urine with no erythrocytes in the sediment, a positive urine blood reaction, and a positive urine protein test result. However, during myoglobinuria, the blood serum or plasma generally remains clear. Myoglobin, which is derived from muscles, is a smaller molecule than hemoglobin and does not bind to serum protein; thus it is rapidly excreted into the urine before reaching levels sufficiently high to produce discoloration of the serum. Animals with myoglobinuria generally do not show evidence of anemia, but have some type of muscle disease, such as exertional myopathy in horses (“tying up” syndrome), trauma, electrical shock, or pressure necrosis from prolonged recumbency.
MICROSCOPIC EXAMINATION
The sediment should be prepared for microscopic examination. A urine sediment examination may reveal extremely useful diagnostic information and be crucial for the correct interpretation of the chemical analyses. A few cells and a few casts may be found in normal urine, but increased numbers of various elements indicate certain diseases. A reference is provided for assistance with the sediment evaluation.
Sample Preparation
Pour a standard volume (10 ml is recommended) of urine into a conical-tip centrifuge tube. If the sample available is less than 10 ml, use all that is left after the reagent strip chemistries and SG determinations have been completed. Centrifuge the urine at a slow speed (1500 rpm) for 5 minutes. Higher speeds for centrifugation may disrupt the cells and casts that are present. Decant the supernatant, leaving the sediment in the bottom. Gently tap the tube to resuspend the sediment in the small amount of urine remaining on the sides and in the bottom of the tube. With a small pipette, transfer a drop of suspended sediment to a glass slide and place a coverslip on it. Commercial stains (e.g., SediStain, Clay Adams, Parsippany, N.J.) are available for evaluating urine sediments, but with practice and experience, they are not necessary.
To examine unstained urine sediment, lower the condenser of the light microscope and reduce the intensity of the light. The slide should first be examined at 10× magnification to obtain an overall impression of how much and what type of sediment is present. The 40× or 45× power (high dry) is then used to make the final identification and count of various components. At least 10 microscopic fields must be evaluated, and the average numbers of various cells and casts per high-power field are reported. The presence and relative amounts of other components are also noted.
Epithelial Cells
Three types of epithelial cells can be found in urine sediment: squamous, transitional, and renal tubular. Squamous epithelial cells (Figure 16-28) are large, with angular borders and small nuclei. The cells originate from the lining of the distal urethra and vagina or prepuce and are not generally indicative of disease. Transitional epithelial cells are medium sized and oval, spindled, or caudate cells found lining the proximal urethra, bladder, ureters, and renal pelvis. They may occur in groups, especially if the urine was obtained by catheterization. If transitional epithelial cells are large and variable, basophilic, or found in large clusters, they should be further evaluated for possible neoplasia. Renal tubular epithelial cells are small, round cells and may indicate tubular degeneration.
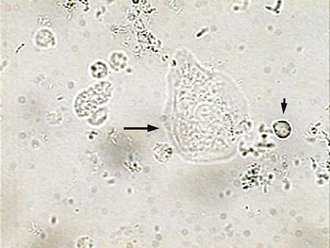
Blood Cells
Erythrocytes in unstained sediment appear colorless or yellowish and are round and slightly refractile with no internal structure. They may be confused with fat droplets, but erythrocytes are fairly uniform in size and do not float in and out of planes of focus as do fat droplets. If there is doubt, a drop of diluted acetic acid will lyse erythrocytes, helping to differentiate them from fat droplets. In concentrated urine, erythrocytes may lose fluid and become crenated (shrunken and spiked). In dilute urine, water may enter the cell causing it to swell or even lyse. Leukocytes in urine sediment are round and granular and larger than erythrocytes, but smaller than epithelial cells (Figure 16-29). The presence of more than five to eight WBCs per high-power field indicates inflammation of the urinary or urogenital tract, depending on the method of collection. When this occurs, a careful check for bacteria should be made.
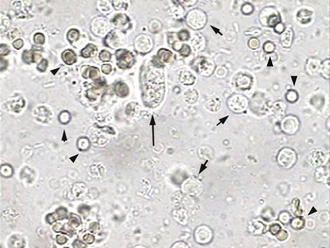
Casts
Casts are another prominent feature of urine sediment. They are elongated structures composed of protein from plasma and mucoprotein from the renal tubules. In general, they form in the distal tubules, in which the urine is more concentrated and acidic. Any structures that happen to be in the tubules at the time the casts form (erythrocytes, leukocytes, or epithelial cells) become embedded in the casts. The presence of increased numbers of casts helps to localize the renal disease to the tubules, but the numbers do not necessarily correlate with the severity of disease. For instance, severe chronic nephritis may be accompanied by just a few casts.
The five main types of casts are as follows:
1. Hyaline casts are colorless, homogeneous, and semitransparent. These may be difficult to see unless the light is reduced. The casts occur in health and also in association with mild glomerular leakage.
2. Cellular casts contain recognizable cells embedded in the protein matrix. Cellular casts may be epithelial cell casts that contain sloughed tubular epithelial cells, erythrocyte casts that indicate renal hemorrhage, or leukocyte casts that indicate renal inflammation or pyelonephritis.
3. Granular casts are derived from degenerating cells or cellular casts. Granular casts are characterized by a nonspecific granular matrix and are designated as either coarsely or finely granular depending on the degree of degeneration. This is probably the most common type of cast found in animals.
4. Waxy casts are wide and homogeneous, usually with distinct blunt or squared ends. These indicate a more chronic renal lesion.
5. Fatty casts contain fat globules from degenerating tubular epithelial cells and are most common in cats because of the high lipid content of feline tubular epithelium.
Crystals
Crystals are another major component of urine sediment. The precipitation and presence of crystals depend on the urine pH and the solubility and concentration of the substance forming them. Urine crystals that accompany pathologic conditions include ammonium biurate, monohydrate calcium oxalate, bilirubin, triple phosphate (struvite, ammonium, magnesium phosphate), and cystine crystals. Dihydrate calcium oxalate crystals can be found in normal urine, but appear distinctly different from the monohydrate calcium oxalate crystals found with ethylene glycol (antifreeze) toxicity. Figure 16-30 shows these two types of calcium oxalate crystals. Bilirubin crystals generally occur in conjunction with bilirubinuria with little to no additional significance. Triple phosphate crystals (Figure 16-31) are often found in alkaline urine when urease-producing bacteria, associated with lower urinary tract disease, are present. Ammonium biurate crystals (Figure 16-32) are dark with distinct, multiple, irregular protrusions and are often associated with portal caval shunts, a specific liver disorder. Cystine crystals (Figure 16-33), although sometimes seen in the urine of healthy dogs, are also found in the urine of dogs with a congenital defect of cystine metabolism that leads to cystinuria. Brushite or calcium phosphate crystals may be found in the acidic urine of healthy dogs and appear as long, relatively thin, rectangular, clear crystals, which may radiate out from a central point. Drugs, such as sulfonamides, may precipitate in the urine of animals, resulting in the formation of crystals.
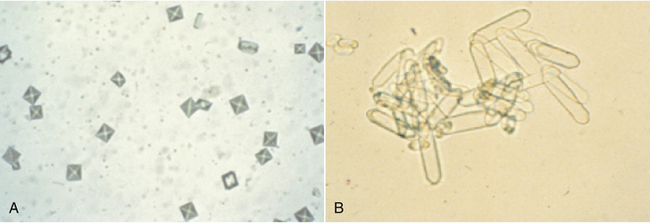
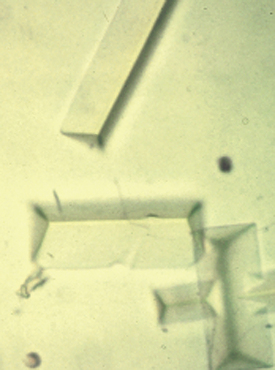
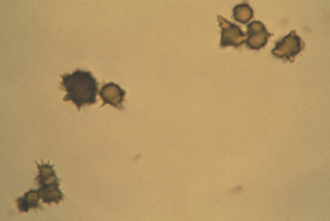
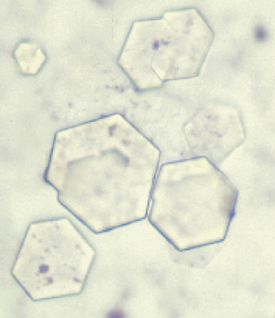
Microorganisms
Bacteria in unstained urine sediment may be difficult to detect. Rods may appear singly or in chains, but cocci may be lost in brownian movement. For this reason, whenever the presence of bacteria is suspected, the sediment should be stained to examine it more thoroughly. Usually the regular examination of the unstained sediment is completed and recorded first, and then the coverslip is removed and the underlying sediment on the slide is allowed to dry. Once dry, the slide can be stained with Gram stain or one of the modified Wright’s stains, and any bacteria present can be identified. On Gram stain, the gram-negative, rod-shaped bacteria may be difficult to see among all the pink-staining cellular debris. With Wright’s stain, all bacteria stain dark purple and are relatively easy to find.
Bacteria in a voided sample are often not significant because they may be normal flora from the distal urogenital tract, especially from the prepuce or vagina. Bacteria are significant if they occur in catheterized or cystocentesis samples. The presence of bacteria is most often correlated with leukocytes in urine because bacteria with no leukocyte response should raise suspicion of contamination of the sample, but urine from diabetic patients may sometimes be an exception. If bacteria are present in a urine sample, they can multiply as time passes, so this should be taken into consideration when the sample is being analyzed. Rarely, fungal organisms are found in urine sediment. The majority of these are insignificant contaminants, although some, such as Blastomyces organisms, may be significant; systemic aspergillosis may occasionally be detected in urinary sediments, especially in the German shepherd dog.
Miscellaneous Findings
Usually insignificant components of urine sediment include mucus, fat, sperm, and parasites. Mucus appears as narrow, twisted, ribbonlike strands. It is normal in equine urine and can be seen in other species because of genital secretions or irritation of the urethra. Fat droplets, as previously noted, take the form of refractile, variably sized spheres in many planes of focus. Fat is rarely significant and is more commonly seen in cats as a result of the common presence of lipid droplets within the proximal tubule cells; alternatively, the lipid droplets may be present secondarily to abdominal fat contamination during cystocentesis collection. Sperm are commonly seen in male canine urine samples. Parasites that can occur in urine include the ova of Stephanurus dentatus, Dioctophyme renale, and Capillaria plica and microfilaria of D. immitis.
CYTOLOGY
Cytology is the study of cells, specifically involving the microscopic examination of individual cells that have exfoliated from a tissue or structure. Unlike histopathology, cytology is not an evaluation of the architecture of a tissue. In most instances, cytology can be used to differentiate an inflammatory lesion from a neoplastic mass. Sometimes cytologic appearance reveals a specific diagnosis, and for certain samples, such as bone marrow or mast cell tumors, it may be more helpful than histopathology. It should be emphasized that cytology is an adjunct diagnostic tool and not a replacement for histopathology.
Cytology requires a significant degree of expertise that can be acquired only through experience, especially for cytology of solid masses. Most veterinary practices prefer to send cytology samples to a reference laboratory for evaluation. For this reason, the discussion on cytology is limited to the preparation of samples from solid tissues for submission to a reference laboratory and fluid analysis. Veterinary technicians interested in becoming adept at cytology should obtain specific training through continuing education workshops. Excellent reference material is available.
EQUIPMENT
One of the advantages of cytology is that it requires no special equipment or supplies other than those used in performing a CBC. A good microscope, clean glass slides, a modified Wright’s stain, and a centrifuge for fluid samples will suffice for most cytologic examinations.
SAMPLE PREPARATION
Most cytology samples of solid masses are obtained through fine-needle aspiration. Although material from a mass may be aspirated with a syringe and needle (22G to 25G), some prefer using the needle alone with a rapid, repetitive stabbing motion. In general, sampling of the mass should stop when blood and/or other material appears in the hub of the needle. The sample can then be expelled onto a glass slide. The material is then spread by placing a second slide on top of the first and without applying downward pressure, slowly sliding it across the first, ideally creating a flame-shaped smear. A gentle compression of the slides before sliding can be done to help spread out thick material. Cells are often fragile, so gentle smear preparation is needed to prevent distortion or damaging the cells, which may make identification difficult, if not impossible.
When handling excised pieces of tissue for cytologic study, keep them wrapped in gauze and slightly moistened with saline solution so they do not dry out. Do not allow the sample or the prepared slides to be exposed to formalin or formalin fumes until after the cytologic slides have been stained. Excised solid masses should be blotted with absorbent paper to remove blood and tissue fluid and gently touched to a slide to make an impression slide. If the mass is of a dense consistency that does not exfoliate cells easily, it may be necessary to scrape it with a scalpel blade and then spread the material gently and thinly onto the slide. An alternative method is to crosshatch cut the surface of the tissue with the scalpel blade and make an imprint preparation. The crosshatching method is often gentler than the scraping method and preserves the cells better. Always make impressions of the cut surface unless otherwise specified by the surgeon; impression smears of superficial surfaces are likely to yield mesothelial-lining cells unrelated to the material comprising the mass.
If the slides are to be sent to a reference laboratory, the use of flat slide mailers should be avoided because many slides will arrive shattered. Most reference laboratories prefer unstained slides, which can be stained at the laboratory by means of their standard stain protocol. If a slide has been stained and there are questions pertaining to that slide, it is a good idea to include that slide for comparison purposes.
FLUID ANALYSIS
For fluid analysis, a refractometer and a cell-counting method (e.g., Unopettes and a hemacytometer) are also needed. Once a sample for cytology has been obtained, slides should be made as soon as possible before the cells degenerate in the fluid. This is especially true of low-protein fluids, such as cerebrospinal fluid and tracheal washings. Many fluid samples can be prepared in the same manner as a blood film, leaving a feathered edge where the largest cells tend to migrate. If the fluid has few cells, as is the case with cerebrospinal fluid, a direct preparation may not provide a sufficient number of cells for a thorough examination. A routine fluid analysis of samples, such as abdominal, thoracic, or synovial fluid, usually includes a WBC count, which is more appropriately referred to as a total nucleated cell count, because some of the cells (mesothelial cells, synovial cells, etc.) may not be derived directly from blood. The total nucleated cell count can be performed in the same manner as a WBC count. If there are numerous cells present, these can be counted on an automated instrument, but lower cell counts will require the use of a hemacytometer as for a manual WBC count but with no dilution.
Total protein is another helpful parameter in fluid analysis and can be done by refractometer, generally with the supernatant portion of a centrifuged fluid sample. Total erythrocyte (RBC) count is often included in the fluid analysis if done on an automated instrument, but the RBC count alone is rarely helpful in evaluating fluid because of the frequency of peripheral blood contamination of samples. It is more important to check for erythrophagocytosis (phagocytosis of RBCs by macrophages) during the cytologic examination because erythrophagocytosis generally implies that the RBCs were present in the fluid before sampling rather than as contaminants.
Fluid samples that have neutrophils as the predominate cell type should be closely evaluated for the presence of bacteria. Bacteria should be present within cells (intracellular) to be considered significant (Figure 16-34). If the bacteria are only extracellular, the possibility of contamination of the sample should be considered. If no bacteria are found, it should not be assumed that they are absent. Bacteria may be present in low numbers and difficult to find. The degree of preservation of the neutrophils needs to be noted because dying or “degenerate” neutrophils may be associated with infectious causes even if organisms were not seen.
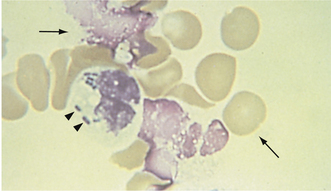
SYNOVIAL FLUID
The analysis of certain fluids includes specific tests that may add more information than routine tests. For instance, the mucin clot test is done on synovial (joint) fluid by mixing a diluted acetic acid solution (0.1 ml of 7N acetic acid in 4 ml of distilled water) and adding 1 ml of synovial fluid; EDTA anticoagulated samples cannot be used for this test. Normal synovial fluid contains mucin, which forms a tight white clot in the acetic acid; if the mucin has been digested by bacterial or cellular enzymes and/or diluted by effusion, the clot will be less distinct or may not form at all, leaving only hazy or cloudy fluid. Therefore good mucin clot formation usually accompanies normal or noninflamed joints, whereas a poor or absent mucin clot is commonly associated with inflammation and/or effusion. The WBC Unopette system cannot be used to obtain nucleated cell counts from synovial fluid because it contains acetic acid as the diluent in the reservoir, which would cause similar clotting of mucin. Total nucleated cell counts of joint fluid samples should be done with the Unopette system for both WBCs and platelets. The reservoir in this system contains ammonium oxalate, which will not precipitate mucin.
TECHNICIAN NOTE
Good mucin clot formation usually accompanies normal or noninflamed joints, whereas a poor or absent mucin clot is commonly associated with inflammation and/or effusion.
Although only semiquantitative, the mucin clot test is the least subjective of tests of joint fluid viscosity; the “string test” and direct microscopic examination of joint fluid also can yield valuable, albeit even less quantitative, information on viscosity. The string test is a simple test where a stick is placed into the joint fluid and then withdrawn; a string of greater than 2 to 3 cm in length is considered adequate. A microscopic assessment of viscosity is the least quantitative and relies upon the subjective assessment of the density of typical finely granular eosinophilic background material; whereas joints with decreased viscosity still have high amounts of this material, it is of a lower density than that from normal joints, which have an uninterrupted carpet of pink material that wells up upon the cell edges.
Duncan, J.R., Prasse, K.W. Veterinary laboratory medicine/clinical pathology. Ames, Iowa: Iowa State University Press; 1994.
Stockham, S.L., Scott, M.A. Fundamentals of veterinary clinical pathology. Ames, Iowa: Iowa State University Press; 2002.
Harvey, J.W. Atlas of veterinary hematology: blood and bone marrow of domestic animals. Philadelphia: WB Saunders; 2001.
Jain, N.C. Essentials of veterinary hematology. Philadelphia: Lea & Febiger; 1993.
Reagan, W.L., et al. Veterinary hematology: atlas of common domestic species. Ames, Iowa: Iowa State University Press; 1998.
Graff, L. A handbook of routine urinalysis. Philadelphia: JB Lippincott; 1983.
Osborne, C.A., Finco, D.R. Canine and feline nephrology and urology. Philadelphia: Lea & Febiger; 1995.
Coffman, J.R. Equine clinical chemistry and pathophysiology,. Bonner Springs, Kan: Veterinary Medicine Publishing; 1981.
Kaneko J.J., ed. Clinical biochemistry of domestic animals. New York: Academic Press, 1989.
Henry, J.B. Clinical diagnosis and management by laboratory methods,, ed 20. St Louis: WB Saunders; 2001.
Avian and Reptilian Hematology
Campbell, T.W. Avian hematology and cytology,. Ames, Iowa: Iowa State University Press; 1988.
Frye, F.L. Biomedical and surgical aspects of captive reptile husbandry,. Edwardsville, Kan: Veterinary Medicine Publishing; 1981.
Baker, R., Lumsden, J.H. Color atlas of cytology of the dog and cat,. St Louis: Mosby; 2000.
Cowell, R.L., et al. Diagnostic cytology and hematology of the dog and cat,, ed 3. St Louis: Mosby; 2008.
Cowell, R.L., et al. Diagnostic cytology and hematology of the horse,, ed 2. St Louis: Mosby; 2002.
Menard, M., Papageorges, M. Fine-needle biopsies: how to increase diagnostic yield. Compend Cont Educ Pract Vet. 1997;19:738.
Raskin, R.E., Meyer, D.J. Atlas of canine and feline cytology,. Philadelphia: WB Saunders; 2001.