Image Analysis Guidelines
After completion of this chapter, you should be able to:
• State the characteristics of an optimal projection.
• Properly display projections of all body structures.
• State the demographic requirements for projections and explain why this information is needed.
• Discuss how to mark projections accurately and explain the procedure to be followed if a projection has been mismarked or the marker is only faintly seen.
• Discuss why good collimation practices are necessary, and list the guidelines to follow to ensure good collimation.
• Describe how positioning of anatomic structures in reference to the x-ray beam and image receptor affects how they are visualized on the image.
• State how similarly appearing structures can be identified on images.
• Determine the amount of patient or central ray adjustment required when poorly positioned projection are obtained.
• Explain the procedural factors that affect the recorded detail sharpness of an image and how they are identified on the resulting image.
• Describe the radiation protection practices that are followed to limit patient dose and discuss how to identify whether adequate shielding was used.
• Discuss the factors that affect radiographic density and contrast and state how they should be adjusted, and to what degree, when an image is produced that demonstrates poor density or contrast.
• List and describe the different artifact categories and discuss how they can be prevented.
• State the procedures to follow after an examination has been completed.
• Discuss the difference between an optimal and acceptable projection.
• List the guidelines for obtaining mobile and trauma projections and state how technical factors should be adjusted to adapt for different mobile and trauma-related conditions.
• Describe the differences to consider when performing procedures and evaluating images of pediatric and obese patients.
WHY IMAGE ANALYSIS?
Radiographic images are such that slight differences in quality do not necessarily rule out the diagnostic value of the image. Radiologists can ordinarily make satisfactory adjustment by reason of their experience and knowledge, although passing less than optimal images may compromise the diagnosis and treatment and result in additional imaging at a higher expense and radiation dose to the patient. Historically, the purpose of image analysis has been to teach technologists how to evaluate an image for passability. The problem with this approach is that it fails to consider the large impact of small variations in positioning and technical factors on what can be demonstrated on an image.
Why should a technologist care about creating optimal images and studying all the small, seemingly insignificant aspects of image analysis? The most important answer to this question lies in why most technologists join the profession—to help people. From the patient's point of view, it provides the reviewer with images that contain optimal diagnostic value, prevents the anxiety that occurs when additional images or studies need to be performed, and prevents the radiation dosage that might be caused by additional imaging. From a societal point of view, it helps prevent additional increases in health care costs that could result because of the need for additional, more expensive imaging procedures and because of the malpractice cases that might result from a poor or missed diagnosis. From a technologist's point of view, it would be the preventable financial burden and stress that arise from legal actions, a means of protecting professional interest as more diagnostic procedures are being replaced with other modalities, and the personal satisfaction gained when our patients, employer, and ourselves benefit from and are recognized for our expertise.
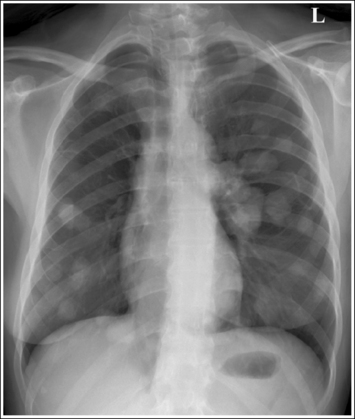
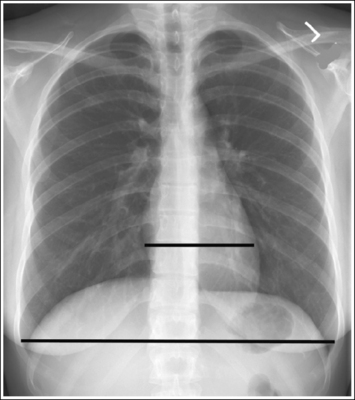
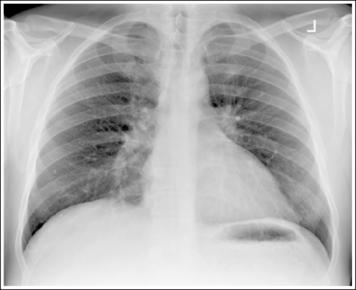
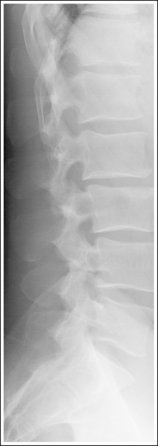
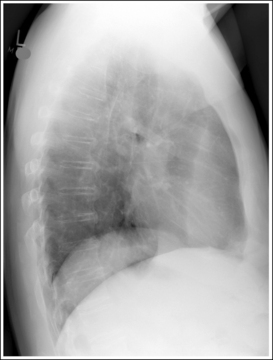
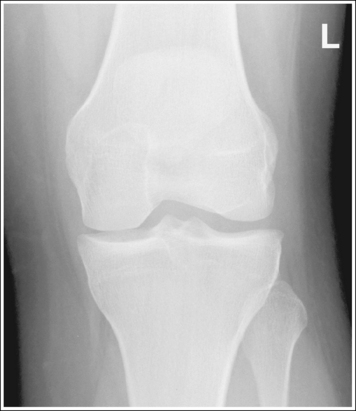
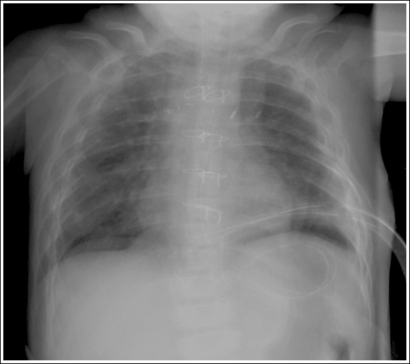
Consider how accuracy in positioning and technical factors affect the diagnostic value of the image. It is estimated that in the United States, 68 million chest imaging procedures are performed each year to evaluate the lungs, heart, and thoracic viscera as well as disease processes such as pneumonia, heart failure, pleurisy, and lung cancer.2 The reviewer must consider all the normal variations that exist in areas such as the mediastinum, hila, diaphragm, and lungs. Should they also have to consider how the appearance of these structures are different with preventable positioning and technical errors? It takes only 2 or 3 degrees of rotation to affect the appearance of the lungs, causing differences in density along the lateral borders of the chest image (Figure 1-1). Similarly, certain conditions such as mediastinal widening or cardiac size cannot be evaluated properly on a rotated posteroanterior (PA) chest projection. The normal heart shadow on such an image will occupy slightly less than 50% of the transverse dimension of the thorax (Figure 1-2). This is evaluated by measuring the largest transverse diameter of the heart on the PA or AP projection and relating that to the largest transverse measurement of the internal dimension of the chest. When the PA chest projection is rotated, bringing a different heart plane into profile, this diagnosis becomes compromised.
According to an article written by Elizabeth Church3 in the Radiologic Technology Journal, a 1999 report from the Institute of Medicine, up to 98,000 Americans die each year from medical errors and remedial care for adverse medical events costs as much as $30 billion annually in the United States.1 The radiology field employs the professionals who are sued most frequently, not because they have the deepest pockets or are the least competent, but because radiologists and radiologic technologists have contact with the vast majority of patients for imaging services. Radiologic technologists are the second in line in regard to imaging responsibilities and competency and should be aware that they may also be named in lawsuits. The article states that radiology-related malpractice cases fall into the following categories: 42%, radiographic misdiagnosis; 22%, failure to order imaging studies; 16%, radiographic procedure complications; 8%, radiation oncology complications; and 5% of patients injured during transportation. Historically, there has been a tendency to place legal responsibility on the highest authority possible and, in the case of a radiographer, actions would typically result in lawsuits against his or her employer or against the physician with whom he or she works. In recent years, however, the rule of personal responsibility has been increasingly applied. This means that everyone is liable for their own negligent conduct. Although radiographers are seldom named specifically in malpractice lawsuits, the rule of personal responsibility has resulted in some unfavorable judgments against radiographers as individuals.
When such judgments are brought forward, the claimant must prove to the court's satisfaction that four conditions are met:
1. The person being sued had a duty to provide reasonable care to the patient.
2. The patient sustained some loss or injury.
3. The person being sued is the responsible party for the loss.
4. The loss is attributable to negligence or improper practice.
The American Society of Radiologic Technologists (ASRT) has developed a code of ethics for the radiography profession and the Canadian Association of Medical Radiation Technologists (CAMRT) has adopted a similar code of ethics. These codes define the ethical responsibilities and the appropriate conduct toward others to which the imaging professional should adhere. It is these codes that are used by lawyers in medical malpractice and negligence claims to determine the accepted level of care and to show whether the professional conducted himself or herself in an ethical manner. To avoid a malpractice suit, professionals must remain vigilant. There is a natural human tendency to let down one's guard or ignore red flags when there have been no recent mistakes. It was also suggested that professionals carefully observe the system that they use and consider their responsibilities carefully, taking a leadership role.3
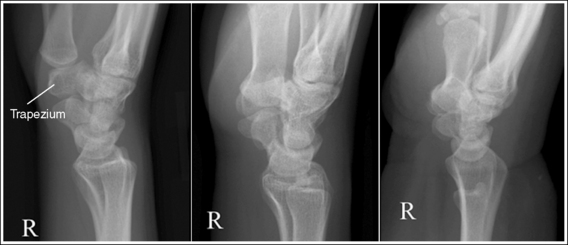
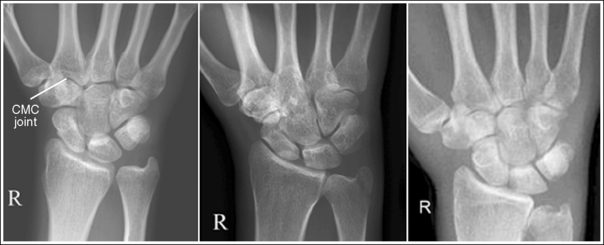
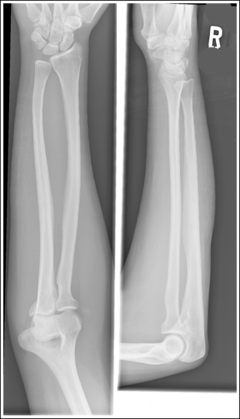
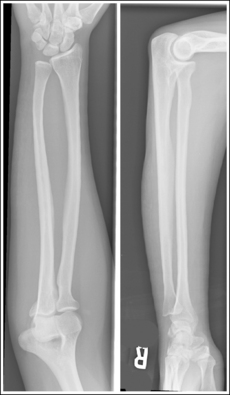
The number of computed tomography (CT) examinations has increased about 600% from the mid-1980s to the mid-1990s and has continued to rapidly grow each year since then. Whereas CT represents only about 5% of all x-ray imaging procedures, it is responsible for 40% to 67% of all medical radiation. Although this increase may be justified considering the diagnostic information that can be gained through such procedures, the effect of the quality of diagnostic images on the increased use of alternative imaging modalities must be considered. A 2008 article in the American Journal of Roentgenology written by R.D. Welling and colleagues5 summarizes a study in which the researchers defined the number and type of wrist fractures diagnosed using diagnostic radiography compared with the use of multidetector computed tomography (MDCT). They examined the records of 60 patients who underwent radiographic and MDCT examinations of the wrist. Two musculoskeletal radiologists and one emergency radiologist reviewed the MDCT results and categorized each of the bones in the wrist as normal or fractured. The study revealed that radiography missed 30% of wrist fractures visible on MDCT. Of the patients demonstrating wrist bone fractures in the distal carpal row, only 33% of the trapezium, 0% of the trapezoidal and capitate, and 60% of the hamate fractures were diagnosed on radiographs. Small variations in wrist positioning can have a large effect on how well the carpal bones are visualized.
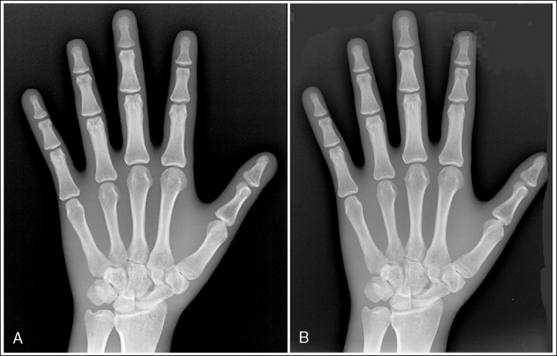
If instead of being evaluated for passability, images are evaluated for optimalism, could more consistent and improved diagnoses be made from diagnostic images? For example, Figures 1-3 and 1-4 demonstrate three lateral and PA wrist projections, all of which were determined to be passable and sent to the radiologist for review. Note how the trapezium is visualized only on the first lateral wrist projection but is not demonstrated on the other two, and observe how the carpometacarpal (CMC) joints and distal carpal bones are well visualized on the first PA wrist projection but are not seen on the other two images. The first lateral wrist projection was obtained with the patient's thumb depressed until the first metacarpal was aligned with the second metacarpal (MC), whereas the other lateral wrist projections were obtained with the first metacarpal elevated. The first PA wrist image was obtained with the metacarpals aligned at a 10- to 15-degree angle with the image receptor (IR), the second PA wrist image was taken with the metacarpals aligned at an angle greater than 15 degrees, and the third image was taken with the metacarpals aligned at an angle less than 10 degrees. If the radiologist cannot arrive at a conclusive diagnosis from the images that the technologist provides, he or she must recommend other imaging procedures or follow-up images.
TERMINOLOGY
Many terms are used in radiography to describe the path of the x-ray beam, the patient's position, the precise location of an anatomic structure, the position of one anatomic structure in relation to another, and the way a certain structure will change its position as the patient moves in a predetermined direction. Familiarity with radiography terminology will help you understand statements made throughout this text and to converse competently with other medical professionals. At the beginning of each chapter, there is a list of key terms that should be reviewed prior to reading the chapter. The glossary at the end of the textbook provides definitions of these terms.
CHARACTERISTICS OF THE OPTIMAL IMAGE
The skills needed to obtain optimal images of all body structures are taught in radiographic procedures, image analysis, and radiographic exposure (imaging) courses.
An optimal image of each projection demonstrates all the most desired features, which should include the following:
• Demographic information (e.g., patient and facility name, time, date)
• Correct markers in the appropriate position without superimposing anatomy of interest
• Desired anatomic structures in accurate alignment with each other
• Appropriate radiation protection
• Best possible density, contrast, and gray scale, with minimal noise
Unfortunately, because of a patient's condition, equipment malfunction, or technologist error, such perfection is not obtained for every image that is produced. A less than optimal image should be thoroughly evaluated to determine the reason for error so that the problem can be corrected before the examination is repeated. An image that is not optimal but is still passable according to a facility's standards should be carefully studied to determine whether skills can be improved before the next similar examination; continuous improvement is sought. An image should never have to be taken a third time because the error was not accurately identified and the proper adjustment made from the first image.
This book cannot begin to identify the standards of acceptability in all the different imaging facilities. What might be an acceptable standard in one facility may not be acceptable in another. As you study the images in this book, you may find that many of them are acceptable in your facility, even though they do not meet optimal standards. The goal of this text is not to dictate to your facility what should be acceptable and unacceptable images. It is to help you focus on improving your image analysis, positioning, and exposure skills and to provide guidelines on how the image may be improved when a less than optimal image results.
DISPLAYING IMAGES
Before an image is evaluated for accuracy, it is displayed on a digital display monitor or made available in the form of a hard-copy radiograph and displayed on a view box. Box 1-1 lists the guidelines to follow when displaying images.
BOX 1-1 Image Displaying Guidelines
• Display torso, vertebral, cranial, shoulder, and hip images as if the patient were standing in an upright position.
• AP, PA, and AP-PA oblique projections of the torso, vertebrae, and cranium should be displayed as if the viewer and the patient are facing one another. The right side of the patient's image is on the viewer's left, and the left side of the patient's image is on the viewer's right. Whenever AP or AP oblique projections are taken, the R (right) or L (left) marker appears correct when the image is accurately displayed, as long as the marker was placed on the IR face-up before the image was taken (Figure 1-5). When PA or PA oblique projections are taken, the R or L marker appears reversed if placed face-up when the image is accurately displayed (Figure 1-6).
• The marker placed on lateral projections of the torso, vertebrae, and cranium represents the side of the patient positioned closer to the IR. If the patient is positioned with the left side against the imaging table for a lateral lumbar vertebrae projection, a left marker should be placed on the IR (Figure 1-7). In general, accurately displayed lateral projections demonstrate a correct marker as long as the marker was placed on the IR face-up before the image was taken. One exception to this guideline may be when left lateral chest projections are displayed; often, reviewers prefer the left lateral projection to be displayed as if taken in the right lateral projection.

• AP/PA (lateral decubitus) chest and abdominal projections are generally displayed so that the side of the patient that was positioned upward when the image was taken is upward on the displayed image.
• Inferosuperior (axial) shoulder and axiolateral hip projections are displayed so the patient's anterior surface is up and posterior surface is down.
• Extremity projections are displayed as if the viewer's eyes were going through the image in the same manner the central ray went through the extremity when the image was taken. For example, a right PA hand projection is displayed with the thumb positioned toward the viewer?s left side and a right lateral hand projection is displayed so the palmar side of the hand is positioned toward the viewer's left side (Figure 1-8).
• Display finger, wrist, and forearm images as if the patient were hanging from his or her fingertips.
• Display elbow and humerus images as if they were hanging from the patient's shoulder.
• Display toe and AP and AP oblique foot projections as if the patient were hanging from his or her toes.
• Display lateral foot, ankle, lower leg, knee, and femur projections as if they were hanging from the patient's hip.
AP, Anteroposterior; IR, image receptor; L, left; PA, posteroanterior; R, right.
IMAGE ANALYSIS FORM
Once an image is correctly displayed, it should be evaluated for positioning and technical accuracy. This should follow a systematic approach so that all aspects of the analytic process are considered, reducing the chance of missing important details and providing a structured pattern for the evaluator to use in a stressful situation. The image analysis form shown in Figure 1-9 is designed to be used when evaluating images to ensure that all aspects of the image are evaluated. Under each item in the image analysis form, there is a list of questions to explore while evaluating an image. The following discussions explore each of these question areas in depth. The answers to all the questions, taken together, will determine whether the image is optimal, acceptable, or needs repeating. The discussions presented in this chapter will focus primarily on screen-film imaging systems, and those unique to digital radiography will be presented in Chapter 2.


Demographic Requirements
Patient and Facility Identification
The correct patient's name and age or birth date, and the facility's name, should be permanently photoflashed onto the identification (ID) plate or displayed on the digital display monitor. This information should be typed and legible. Evaluate all the images within a routine series to ensure that these have been correctly imprinted or displayed on the image. Never assume that an image has been correctly photoflashed or assigned to the correct patient. Always double-check. Flash cards can be easily switched or forgotten.
If the wrong information has been photoflashed onto the ID plate when using a screen-film system, a corrected information sticker should be placed over the incorrect patient information before the images are sent to be interpreted.
Time and Date
The examination time and date must be accurate to distinguish the images in a timed series and to match images with their accompanying requisition and report.
Identification Plate Placement Guidelines
Box 1-2 provides guidelines to help prevent the ID plate from superimposing the anatomy of interest when using screen-film radiography. In digital radiography, the ID plate placement is not as sensitive as it is for a screen-film radiograph because after the image is displayed, the blocker location can be moved to a location away from the anatomy of interest.
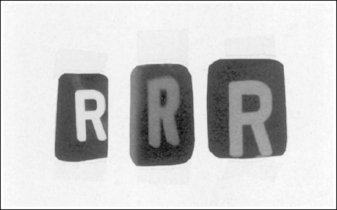
Marking Images
Lead markers are used to identify the patient's right and left sides, indicate variations in the standard procedure, or show the amount of time that has elapsed in timed procedures, such as small bowel studies. The markers are constructed of lead so as to be radiopaque. Whenever a marker is placed on the image receptor (IR) within the collimated light field, radiation will be unable to penetrate it, resulting in an unexposed white area on the image where the marker was located. Each image must include the correct marker. Mismarking an image can have many serious implications, including treatment of the incorrect anatomic structure. The marker must also be included on the image for it to be considered a legal document in a court of law. After an image has been produced, evaluate it to determine whether the correct marker has been placed properly on the image. Box 1-3lists guidelines to follow when marking and evaluating marker accuracy on images.
Using the Collimator Guide for Marker Placement
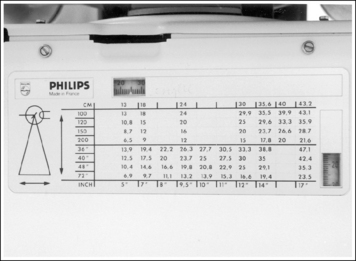
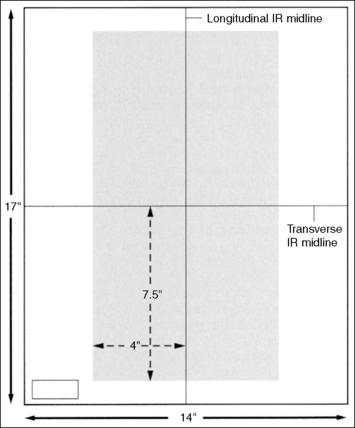
When collimating less than the size of the IR used, it can be difficult to determine exactly where to place the marker on the IR so that it will remain within the collimated field and not obscure anatomic areas of interest. The best way of accomplishing this is first to collimate the desired amount and then use the collimator guide (Figure 1-20) to determine how far from the IR's midline to place the marker. Although different models of x-ray equipment have different collimator guides, the information displayed by all is similar. Each guide explains the IR coverage for the source–image receptor distance (SID) and amount of longitudinal and transverse collimation being used. If a 14- × 17-inch (35- × 43-cm) IR is placed in the Bucky tray at a set SID, and the collimator guide indicates that the operator has collimated to an 8- × 17-inch (20- × 43-cm) field size, the marker should be placed 3.5 to 4 inches (10 cm) from the IR's longitudinal midline to be included in the collimated field (Figure 1-21). If the field was also longitudinally collimated, the marker would also have to be positioned within this dimension. In the preceding example, if the collimator guide indicates that the longitudinal field is collimated to a 15-inch (38-cm) field size, the marker would have to be placed 7.5 inches (19 cm) from the IR's transverse midline (see Figure 1-21).
BOX 1-3 Marker Placement Guidelines
• Position marker in the exposure field (area within collimated light field) as far away from the center as possible.
• Avoid placing marker beneath the anatomy of interest or lead shielding, or over the ID plate.
• Place markers on the IR and not on the imaging table or patient. This placement avoids marker distortion and magnification, prevents scatter radiation from undercutting the marker, and ensures that the marker will not be projected off the IR (Figure 1-10).
• For AP and PA projections of the torso, vertebrae, and cranium, place the R or L marker laterally on the side being marked. The patient's vertebral column is the dividing plane for the right and left sides. If marking the right side, position the R marker to the right of the vertebral column; if marking the left side, position the L marker to the left of the vertebral column (see Figure 1-5).
• For lateral projections of the torso, vertebrae, and cranium, the marker placed on the IR indicates the side of the patient positioned closer to the IR. If the patient's left side is positioned closer to the IR for a lateral lumbar vertebrae projection, place an L marker on the IR (Figure 1-11). Whether the marker is placed anteriorly or posteriorly to the lumbar vertebrae does not affect the accuracy of the image's marking, although the images of markers placed posteriorly are often overexposed (Figure 1-12).
• For AP/PA (lateral decubitus) projections of the torso, vertebrae, and cranium, the marker placed on the IR identifies the side of the patient positioned closer to the IR and is placed on the correct side of the patient (Figure 1-13). As with the AP-PA projections, the vertebral column is the plane used to divide the right and left sides of the body.
• For decubitus projections of the torso, place the R or L marker laterally on the correct side. If marking the right side, position the R marker to the right of the vertebral column; if marking the left side, position the L marker to the left of the vertebral column. The marker will be better visualized and less likely to obscure the anatomy of interest if the side of the patient that is positioned up, away from the cart or imaging table on which the patient is lying, is the side marked. Along with the right or left marker, use an arrow marker pointing up toward the ceiling or lead lettering to indicate which side of the patient is positioned away from the cart or imaging table (Figure 1-14).
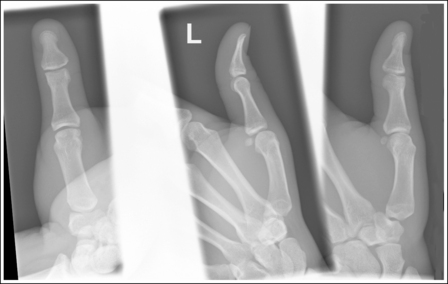
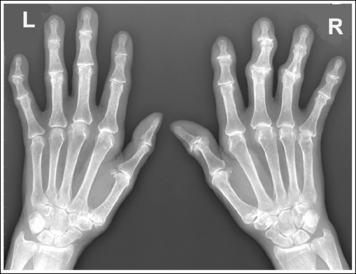
• For extremity projections, mark the side of the patient being imaged. When multiple projections are placed on the same IR, it is necessary to mark only one of the projections placed on the IR as long as they are all images of the same anatomic structure (Figure 1-15). If positions of a right anatomic structure and its corresponding left are placed on the same IR, mark both images with the correct R or L marker (Figure 1-16).
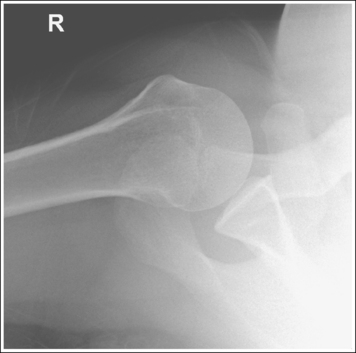
• For AP and AP oblique shoulder and hip projections, the marker placed on the IR should indicate the side of the patient being imaged (Figure 1-17). It is best to place the marker laterally to prevent it from obscuring medial anatomic structures and to eliminate possible confusion about which side of the patient is being imaged. Figure 1-18 demonstrates an AP hip projection with the marker placed medially. Because the marker is placed at the patient's midsagittal plane, the reviewer might conclude that the technologist was marking the right hip.
• For cross-table lateral projections, position the marker anteriorly to prevent it from obscuring structures situated along the posterior edge of the IR. The marker used should indicate the right or left side of the patient when the extremities, shoulder, or hip is imaged (Figure 1-19) and the side of the patient positioned closer to the IR when the torso, vertebrae, or cranium is imaged (see Figure 1-11).
AP, Anteroposterior; IR, image receptor; L, left; PA, posteroanterior; R, right.
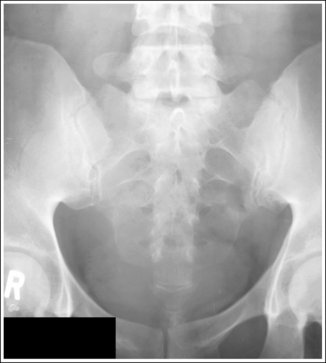
Determining Mismarking Using the Identification Plate
If both sides of the body are demonstrated on the same radiograph, as with an anteroposterior (AP) projection of the pelvis or abdomen, evaluate it to ensure that an R marker is placed to the right of the vertebral column or an L marker is placed to the left of the vertebral column. When the screen-film system is used, this can be accomplished by using the patient ID plate because it is permanently built into the cassette and is always in the same place. Begin by displaying the image on the view box in the same manner that the IR was placed in the Bucky diaphragm. (For posteroanterior [PA] projections, display the image as if the patient's back were facing you. This is not the proper way to display such an image but is a method for determining marker accuracy.) The ID plate is in the lower left corner or the upper right corner on a lengthwise image and in the upper right or lower left corner on a crosswise image. Then, position yourself as the patient was positioned with respect to the IR. If the patient was in an AP projection, turn your back to the image; if the patient was in a PA projection, face the image. The marker on the image should correspond to your right or left side—an R marker on your right side or an L marker on your left side.
When a marker on an image is only faintly visible, circle it and rewrite the information it displays next to it. Do not write the information over it (Figure 1-22).
Mismarked Images
If the R or L marker does not appear on the image or the image has been mismarked, it is best to repeat the image. Do not guess or rely on what you may believe to be a sure sign. The heart shadow, which is normally located on the left side of the thorax, may be shifted toward the right because of a disease process or because the patient has situs inversus (total or partial reversal of the body organs).
Anatomic Structure Requirements and Placement
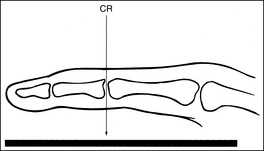
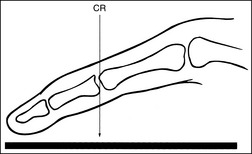
Each image requires that the area of interest be included, as well as a certain amount of the surrounding anatomic structures. For example, because radiating wrist pain may be a result of a distal forearm fracture, all wrist positions require that one fourth of the distal forearm be included with the wrist examination. A lateral ankle projection should include 1 inch (2.5 cm) of the fifth metatarsal base to rule out a Jones fracture.
Size Selection and Placement of Image Receptor
The IR used for a procedure should be just large enough to include the region being examined. Deciding whether to place the long axis of the IR crosswise (CW), lengthwise (LW), or diagonally in respect to the long axis of the part being examined is a simple matter of positioning it so that all the required anatomy can easily be demonstrated on the IR size chosen. This is mostly dictated by the body habitus, part length, and IR system used. As a general rule, the long axis of the part is aligned with the long axis of the IR.
Body Habitus
There are four types of body habitus to consider when positioning a patient for a PA-AP chest or AP abdomen projection—hypersthenic, sthenic, hyposthenic, and asthenic. The hypersthenic patient has a wide, short thorax and a broad peritoneal cavity, with a high diaphragm (Figure 1-23). This body habitus requires the IR to be placed CW for PA-AP chest projections to include the entire lung field and requires two CW IRs to be used for an AP abdomen projection to demonstrate the entire peritoneal cavity. The asthenic patient has a long, narrow thoracic cavity and narrow peritoneal cavity, with a lower diaphragm (Figure 1-24). The sthenic and hyposthenic types of body habitus have thoracic and peritoneal cavities, with lengths and widths that are between those of the hypersthenic and asthenic body habitus (Figures 1-25 and 1-26). The sthenic, hyposthenic, and asthenic types of body habitus require the IR to be placed LW for the PA-AP chest and AP abdomen projections to include the entire lung field and peritoneal cavity, respectively.
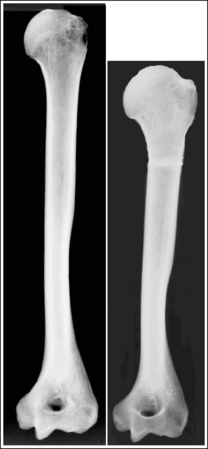
Long Bones
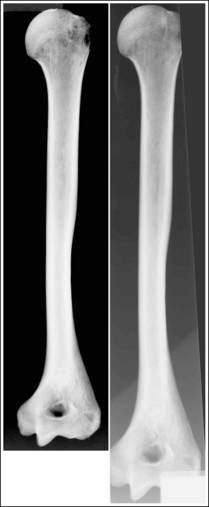
When imaging long bones, such as the forearm, humerus, lower leg, or femur, which require one or both joints to be included on the image, choose an IR that is long enough to allow 1 to 2 inches (2.5 to 5 cm) of the IR to extend beyond each joint space. This is needed to prevent the off-centered joint(s) from being projected off the IR because they will move in the direction in which the diverged x-ray beams that are used to record them on the image are moving (Figure 1-27).
Images of the humerus and lower leg may be placed diagonally on the IR to have enough length that both joints can be included on a single image when a screen-film IR system is used (Figure 1-28). This is not advisable when using a cassette-based computed radiography (CR) system because an exposure field that is not parallel with the edges of the imaging plate may result in poor exposure field recognition and histogram analysis errors. For CR systems, when the structure is too long for the part to fit on one cassette, two separate images should be obtained, with each including a joint and portion of the midshaft and with overlapping of at least 2 inches (5 cm) between the images.
Multiple Projections on Same Image Receptor
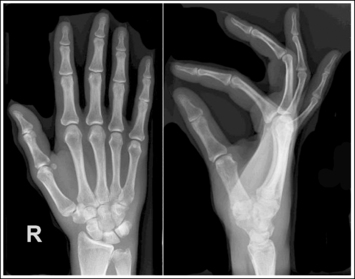
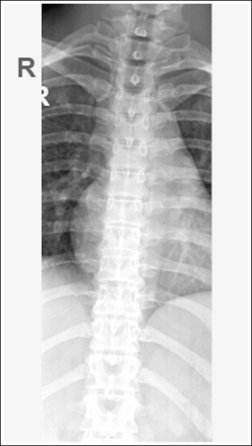
How the IR is placed (LW or CW) often dictates how many images can be placed on the IR. For example, a 10- × 12-inch (24- × 30-cm) IR placed CW can accommodate three images of the wrist, but the same-sized IR placed LW has space available for only two images. When an extremity is imaged and more than one projection of the structure is exposed on the same IR, the images should be evenly spaced on the IR and similar anatomic structures should be located at the same end of the IR. For example, when the AP and lateral projections of the forearm are placed on the same 14- × 17-inch (35- × 43-cm) IR, the AP is positioned on half of the IR and the lateral on the other, with a defined collimated border around each, and the elbows in the two images are to be demonstrated at the same end of the IR (Figure 1-29). Failure to keep this alignment makes displaying and viewing of the image difficult (Figure 1-30).
Collimation
Proper collimation is accomplished when the beam of radiation is narrow enough to include only the areas of interests. Good collimation practices result in the following: (1) decrease the radiation dosage by limiting the amount of patient tissue exposed; (2) improve the visibility of recorded details by reducing the amount of scatter radiation that reaches the IR; and (3) reduces histogram analysis errors when using digital radiography. As a general rule, each image should demonstrate a small collimated border around the entire image of interest. The only time that this rule does not apply is when the entire IR must be used to prevent clipping of needed anatomy, as in chest and abdominal imaging. This collimated border not only demonstrates good collimation practices but also can be used to determine the exact location of central ray placement. Make an imaginary X on the image by diagonally connecting the corners of the collimated border (Figure 1-31). The center of the X indicates the central ray placement for the image.
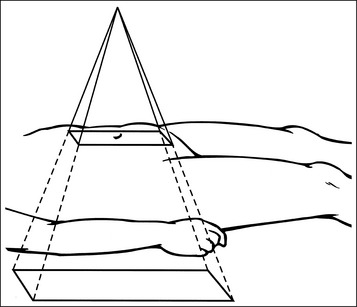
Accurate placement of the central ray and alignment of the long axis of the part with the collimator's longitudinal light line are two positioning practices that will aid in obtaining tight collimation. When collimating, do not allow the collimator's light field to mislead you into believing that you have collimated more tightly than what has actually been done. When the collimator's central ray indicator is positioned on the patient's torso and the collimator is set to a predetermined width and length, the light field demonstrated on the patient's torso does not represent the true width and length of the field set on the collimator. This is because x-rays (and the collimator light, if the patient was not in the way) continue to diverge as they move through the torso to the IR, increasing the field size as they do so (Figure 1-32). The thicker the part being imaged, the smaller the collimator's light field that appears on the patient's skin surface. On a very thick patient, it is often difficult to collimate the needed amount when the light field appears so small but, on these patients, tight collimation demonstrates the largest improvement in the visibility of the recorded details.
Learn to use the collimator guide (see Figure 1-20) to determine the actual IR coverage. For example, when an AP lumbar vertebral projection is taken, the transversely collimated field should be reduced to an 8-inch (20-cm) field size. Because greater soft tissue thickness has nothing to do with an increase in the size of the skeletal structure, the transverse field should still be reduced when a thick patient part is being imaged. Accurately center the patient by using the centering light field and then set the transverse collimation length to 8 inches by using the collimator guide. Be confident that the IR coverage will be sufficient, even though the light field appears small.
Box 1-4 lists guidelines to follow when collimating and evaluating collimation accuracy on images.
BOX 1-4 Collimation Guidelines
• For extremity projections, collimate to within 0.5 inch (1.25 cm) of the skin line of the thickest area of interest. (Figure 1-33).
• For chest and abdomen projections, collimate to within 0.5 inch (1.25 cm) of the patient's skin line (Figure 1-34).
• When collimating structures within the torso, bring the collimated borders as close to the structures of interest as possible. Use palpable anatomic structures around the area of interest to determine how close the borders are to the structure of interest (In Figure 1-35, the collimation field was closed to the palpable symphysis pubis and ASISs to frame the sacrum).
Rotating Collimator Head
On some x-ray equipment, the collimator head can be rotated without rotating the entire tube column. This capability allows the technologist to increase collimation on anatomic structures such as the clavicle, which is not aligned directly with the longitudinal or transverse axis of the light field. Rotating just the collimator head does not affect the alignment of the beam with the grid; this alignment is affected only when the tube column is rotated and is demonstrated on the image by visualization of grid lines artifacts and grid cutoff. Rotation of the collimator head should be avoided when using cassette-based digital radiography because it may affect the exposure field recognition process.
Overcollimation
Evaluate all images to determine whether the required anatomic structures have been included. Poor centering or overcollimation can result in the clipping of required anatomy (Figure 1-36).
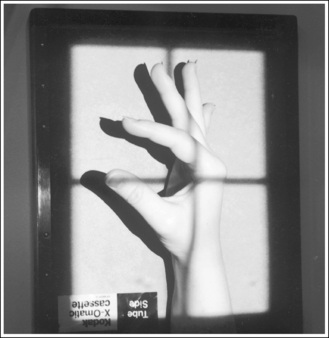
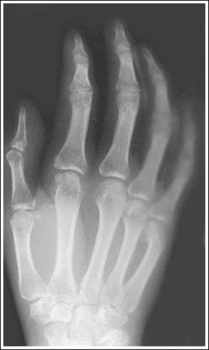
Clipping of required anatomy can also result from overcollimation on a structure that is not placed in direct contact with the IR, such as for a lateral third or fourth finger or lateral hand projection. Clipping occurs because the divergence of the x-ray beam has not been taken into consideration during collimation. To prevent clipping, view the shadow of the object projected onto the IR by the collimator light (Figure 1-37). It will be magnified. This magnification is similar to the magnification that the x-ray beam undergoes when the image is created. Allow the collimated field to remain open enough to include the shadow of the object, ensuring that the object will be shown in its entirety on the image.
Anatomic Relationships
Evaluate each image for proper anatomic alignment, as defined in the procedural analysis sections of this text. Each projection should demonstrate specific bony relationships that will best facilitate diagnosis. For example, an AP ankle projection demonstrates an open talotibial joint space (medial mortise), whereas the AP oblique projection demonstrates an open talofibular joint space (lateral mortise), and the lateral projection demonstrates the talar domes and soft tissue fat pads.
Positioning Routines and Understanding the Reason for the Procedure
Most positioning routines require AP-PA and lateral projections to be taken to demonstrate superimposed anatomic structures, localize lesions or foreign bodies, and determine alignment of fractures. When joints are of interest, oblique projections are also added to this routine to visualize obscured areas better. In addition to these, special projections may be requested for more precise demonstration of specific anatomic structures and pathologic conditions.
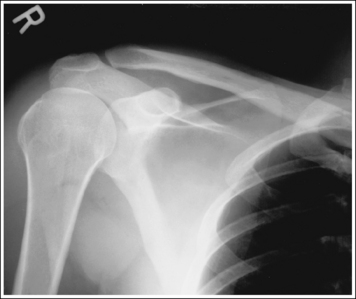
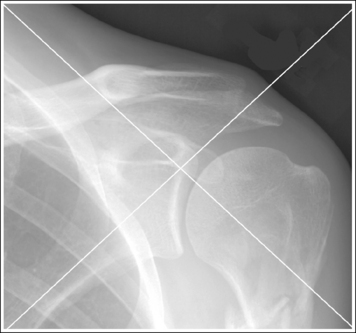
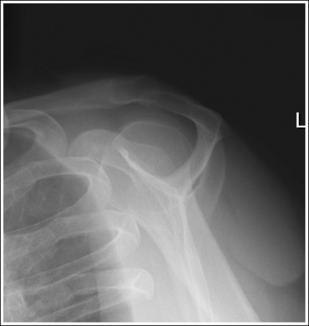
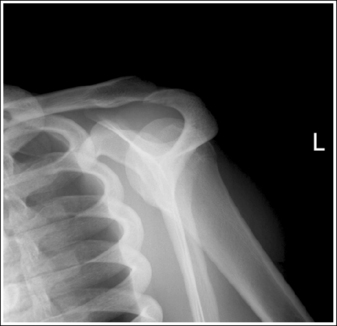
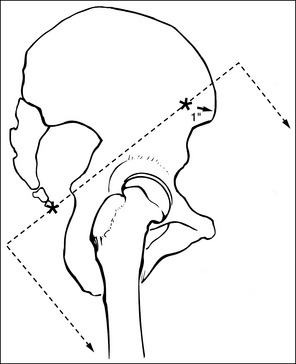
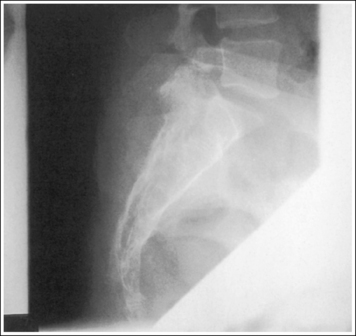
To appreciate the importance of the anatomic relationships on an image, one must understand the clinical reason for what the procedure is to demonstrate for the reviewer. This is particularly important when obtaining special projections that are not commonly performed and require specific and accurate anatomic alignment to be useful. For example, an optimally positioned tangential (supraspinatus outlet) shoulder projection (Figure 1-38) should demonstrate the supraspinatus outlet (opening formed between acromion and humeral head) and the posterior aspects of the acromion and acromioclavicular (AC) joint in profile. The technologist produces these anatomic relationships when the patient's midcoronal plane is positioned vertically and can be ensured that the proper positioning was obtained when the superior scapular angle is positioned at the level of the coracoid tip on the image. From this optimal image, the radiologist can evaluate the supraspinatus outlet for narrowing caused by variations in the shape (spur) or slope of the acromion or AC joint, which has been found to be the primary cause of shoulder impingements and rotator cuff tears. If instead of being vertical, the patient's upper midcoronal plane was tilted toward the IR, the resulting image would demonstrate the superior scapular angle positioned above the coracoid tip, preventing clear visualization of the acromion and AC joint deformities, because their posterior surfaces would no longer be in profile and would narrow or close the supraspinatus outlet (Figure 1-39). Because the reviewer would be unable to diagnose outlet narrowing that results from variations in the shape or slope of the acromion or AC joint, this image would not be of diagnostic value.
Correlating the Anatomic Relationships and Positioning Criteria
For each projection in the procedural analysis sections of this book, there is a list of analytic criteria to use when evaluating the anatomic relationships that should be seen on an optimal image of that projection, an explanation that correlates it with the specific positioning procedure, and a description of related positioning errors. This information is needed to reposition the patient properly if a poorly positioned image is obtained because only the aspect of the positioning procedure that was inaccurate should be changed when repeating the image. For example, a PA chest projection that is demonstrated without foreshortening visualizes the manubrium superimposed by the fourth thoracic vertebra, with approximately 1 inch (2.5 cm) of the apical lung field visible above the clavicles. This analysis criterion is demonstrated on the image when the patient's midcoronal plane is positioned vertically. If a PA chest projection demonstrates all the required analysis criteria, with the exception of the manubrium and fourth thoracic vertebral alignment, the technologist who understands the correlation between the analysis criteria and positioning procedure would know to adjust only the positioning of the patient's midcoronal plane before repeating the image.
Identifying Anatomic Structures
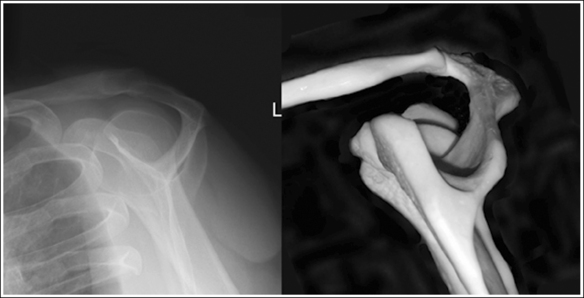
An optimal image should appear as much like the real object as possible, but because of unavoidable distortion that results from the shape, thickness, and position of the object and beam, part, and IR alignment, this is not always feasible, resulting in some anatomic structures appearing different than the real object. Using skeletal bones positioned in the same manner as the projection will greatly aid in identification of the anatomic structures on an image. Closely compare the visualization of the anatomic structures on the skeletal scapular bone photograph and x-ray image shown in Figure 1-40. Note that the superior scapular angle and lateral borders of this surface on the skeletal image are well demonstrated, obscuring the coracoid, but on the x-ray image the superior scapular angle is seen as a thin cortical line, its lateral borders are not demonstrated, and the coracoid can be clearly visualized. Also, note that the superior surface of the spine is visualized on the skeletal bone image between the lateral and medial scapular spine borders, but is not seen on the x-ray image.
When identifying anatomic structures, one must consider how anatomy may appear different from the real object. The following concepts, when understood and applied to how the procedure was obtained, can help with identification of the anatomic structures on the image.
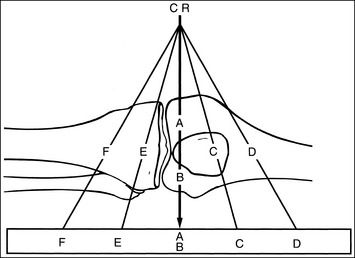
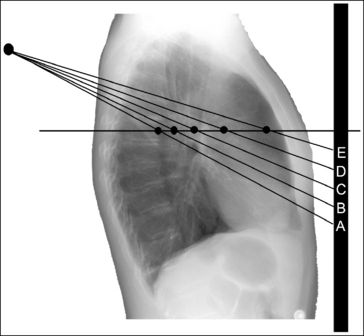
Off-Centering: X-rays used to create an image are emitted from the x-ray tube's focal spot in the form of a fan-shaped beam. The central ray is the center of this beam; it is used to center the anatomic structure and IR. It is here that the x-ray beam has the least divergence and the image of an anatomic structure demonstrates the least amount of distortion. As one moves away from the center of the beam, the x-rays used to record the image diverge and expose the IR at an angle (Figure 1-41). The farther one moves away from the central ray, the larger is the angle of divergence. Whether straight or angled beams are used to record the anatomic structures, and how those beams traverse the structures, will determine where and how they are visualized on the image.
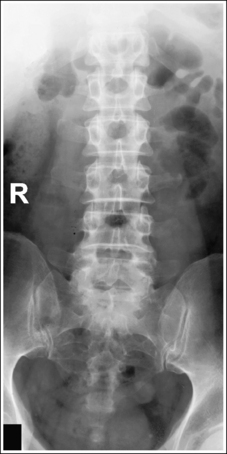
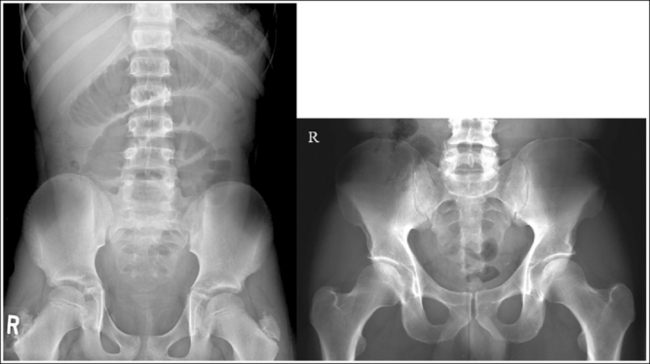
Compare the relationship of the symphysis pubis and coccyx, and how differently the sacrum is visualized on accurately positioned AP abdominal and pelvic projections (Figure 1-42). Both images are taken with a perpendicular central ray, but the central ray is centered to the midpoint of the abdomen at the level of the iliac crest for the abdominal image and is centered at the midpoint of the sacrum for the pelvic image. The symphysis pubis and coccyx on both images were recorded using diverged beams, but because the central ray is centered more superiorly and beams with greater angle of divergence were used to record the symphysis pubis and coccyx on the abdomen image, the symphysis pubis is moved more inferiorly to the coccyx on this image when compared with its alignment with the coccyx on the pelvic image. Also, compare sacral visualization on these two images. Because of the more inferior centering used in the pelvic image, the x-rays recording the sacrum are angled cephalically into the curve of the sacrum and those recording the sacrum for the abdominal image are angled caudally, against the sacral curve. This results in decreased sacral foreshortening on the pelvic image and increased sacral foreshortening on the abdominal image. The off-centered diverged beams will affect structures in the same manner that an angled central ray will (see preceding section for discussion of angled central ray). According to an experiment on beam divergence that is indicated in Q.B. Carroll's Practical Radiographic Imaging textbook, at a 40-inch SID, the divergence of x-rays is 2.5 degrees for every inch (1 degree/cm) off-centered in any direction from the central ray; at a 72-inch SID, beam divergence is off-centered about 1.5 inches (3.75 cm).
Angled Central Ray: When an angled central ray or diverged beam is used to record an object, the object will move in the direction in which the beams are traveling. The more the central ray is angled, the more the object will move. Also, note that objects positioned on the same plane but at different distances from the IR, which would have been superimposed if a perpendicular central ray were used, will be moved different amounts. Figure 1-43 demonstrates this concept. Point A is farther away from the IR than point C. Even though point A is horizontally aligned with point C, an angled central ray used to record these two images would project point A farther inferiorly than point C. If these two structures were closer together (points A and B on Figure 1-43), the amount of separation on the image would be less. If these two structures were farther apart (points A and E on Figure 1-43), the separation on the image would be greater.
Magnification: Magnification, or size distortion, is present on an image when all axes of a structure demonstrate an equal percentage of increase in size over the real object. Because of three factors—no image is taken with the part situated directly on the IR, no anatomic structure imaged is flat, and not all structures are imaged with a perpendicular beam—all images demonstrate some type of size distortion. The amount of magnification mostly depends on how far each structure is from the IR at a set source–image receptor distance (SID). The farther away the part is situated, the more magnified the structure will be (Figure 1-44). Magnification also results when the same structure, situated at the same object–image receptor distance (OID), is imaged at a different SID. Size distortion should be kept to a minimum by using the shortest possible OID and the longest feasible SID.
Differences in magnification can be noticed between one side of a structure when compared with the opposite side if they are at significantly different OIDs. This can be seen on an accurately positioned lateral chest image, which demonstrates about 0.5 inch (1 cm) of space between the right and left posterior ribs, even though both sides of the thorax are of equal size. Because the right lung field and ribs are positioned at a greater OID than the left lung field and ribs on a left lateral projection, the right lung field and ribs are more magnified (Figure 1-45).
Elongation: This is the most common shape distortion and occurs when one of the structure's axes appears disproportionately longer on the image than the opposite axis (Figure 1-46). The least amount of elongation occurs when the central ray, part, and IR set up is ideal as demonstrated in Figure 1-47, A, and is most noticeable in the following situations:
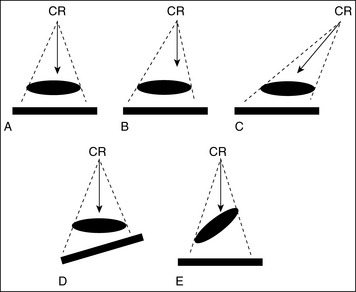
• The central ray is perpendicular to the part and the IR is parallel with the part (Figure 1-47, B), but the part is not centered to the central ray (off-centered). The greater the off-centering, the greater the elongation.
• The central ray is angled and is not aligned perpendicular to the part, but the IR and the part are parallel with each other (Figure 1-47, C). The greater the central ray angulation, the greater the elongation.
• The central ray and part are aligned perpendicular to each other, but the IR is not aligned parallel with the part (Figure 1-47, D). The greater the angle of the IR, the greater the elongation.
Foreshortening: This is another form of shape distortion and is demonstrated when one of the structure's axes appears disproportionately shorter on the image than the opposite axis (Figure 1-48). Foreshortening occurs when the central ray and IR are perpendicular to each other, but the part is inclined (see Figure 1-47, E). The greater the incline, the greater will be the foreshortening.
Distinguishing Between Structures of Similar Shape and Size
The most difficult structures to identify are those that are identical in shape and size, such as the femoral condyles or talar domes. For these structures, three methods may be used to distinguish the structures from one another.
1. Use the structures that surround the area of interest. For example, if a poorly positioned lateral ankle image demonstrates inaccurate anterior alignment of the talar domes and a closed tibiotalar joint space, one cannot view the joint space to determine which talar dome is the more anterior, but the relationship of the tibia and fibula can easily be used to deduce this information.
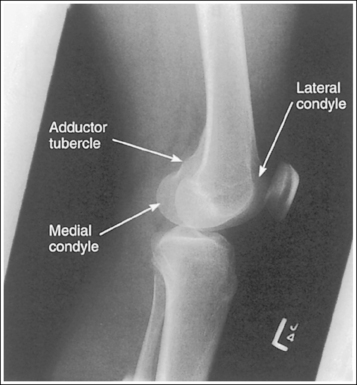
2. Use bony projections such as tubercles to identify a similar structure. For example, the medial femoral condyle can be distinguished from the lateral condyle on a lateral knee image by locating the adductor tubercle situated on the medial condyle (Figure 1-49).
3. Identify the more magnified of the two structures. The anatomic structure situated farthest from the IR is magnified the most (see Figure 1-44).
Determining the Degree of Patient Obliquity
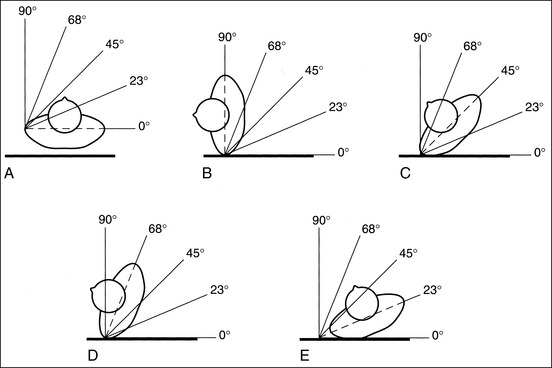
To align the anatomic structures correctly, it is necessary to demonstrate precise patient positioning and central ray alignment. How accurately the patient is placed in a true AP-PA, lateral, or oblique projection, whether the structure is properly flexed or extended, and how accurately the central ray is directed and centered in relation to the structure determines how properly the anatomy is aligned. Because few technologists carry protractors, there must be a method for determining whether the patient is in a true AP-PA or lateral projection, or specific degree of obliquity. For every projection described, an imaginary line (e.g., for the midsagittal or midcoronal plane, a line connecting the humeral or femoral epicondyles) is given that can be used to align the patient with the IR or imaging table. When the patient is in an AP-PA projection, the reference line should be aligned parallel (0-degree angle) with the IR (Figure 1-50, A) and, when the patient is in a lateral projection, the reference line should be aligned perpendicular (90-degree angle) to the IR (see Figure 1-50, B). For a 45-degree AP-PA oblique projection, place the reference line halfway between the AP-PA projection and the lateral position (see Figure 1-50, C). For a 68-degree AP-PA oblique projection, place the reference line halfway between the 45- and 90-degree angles (see Figure 1-50, D). For a 23-degree AP-PA oblique projection, place the reference line halfway between the 0- and 45-degree angles (see Figure 1-50, E). Even though these five angles are not the only angles used when a patient is positioned for images, they are easy to locate and can be used to estimate almost any other angle. For example, if a 60-degree AP-PA oblique projection is required, rotate the patient until the reference line is positioned at an angle slightly less than the 68-degree mark. I have used the torso to demonstrate this obliquity principle, but it can also be used for extremities. When an AP-PA oblique projection is required, always use the reference line to determine the amount of obliquity. Do not assume that a sponge will give you the correct angle. A 45-degree sponge may actually turn the patient more than 45 degrees if it is placed too far under the patient or if the patient's posterior or anterior soft tissue is thick.
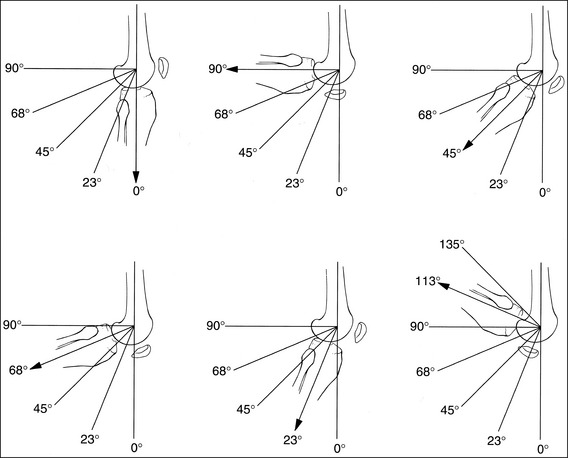
Determining the Degree of Extremity Flexion
For many examinations, a precise degree of structure flexion or extension is required to adequately demonstrate the desired information. Technologists need to estimate the degree to which an extremity is flexed or extended when positioning the patient and when evaluating images. When an extremity is in full extension, the degree of flexion is 0 (Figure 1-51, A), and when the two adjoining bones are aligned perpendicular to each other, the degree of flexion is 90 degrees (see Figure 1-51, B). As described in the preceding discussion, the angle found halfway between full extension and 90 degrees is 45 degrees (see Figure 1-51, C). The angle found halfway between the 45- and 90-degree angles is 68 degrees (see Figure 1-51, D), and the angle found halfway between full extension and a 45-degree angle is 23 degrees (see Figure 1-51, E). Because most flexible extremities flex beyond 90 degrees, the 113- and 135-degree angles (see Figure 1-51, F) should also be known.
Demonstrating Joint Spaces and Fracture Lines
For an open joint space or fracture line to be demonstrated, the central ray or diverged rays recording the area must be aligned parallel with the joint or fracture line of interest (Figures 1-52 and 1-53). Failure to accomplish this alignment will result in closed joint or poor fracture visualization because the surrounding structures are projected into the space or over the fracture line (Figures 1-54 and 1-55).
STEPS FOR REPOSITIONING THE PATIENT FOR REPEAT IMAGES
1. Identify the two structures that are mispositioned (e.g., the medial and lateral femoral condyles for a lateral knee projection or the petrous ridges and supraorbital rims for an AP axial (Caldwell method) cranial projection.
2. Determine the number of inches or centimeters that the two mispositioned structures are “off.” For example, the anterior surfaces of the medial and lateral femoral condyles should be superimposed on an accurately positioned lateral knee projection, but a 0.5-inch (1.25-cm) gap is present between them on the produced image (see Figure 1-49). Or, consider how the supraorbital margins should be demonstrated 1 inch (2.5 cm) superior to the petrous ridges on an accurately positioned AP axial cranial projection, but they are superimposed on the produced image (Figure 1-56).
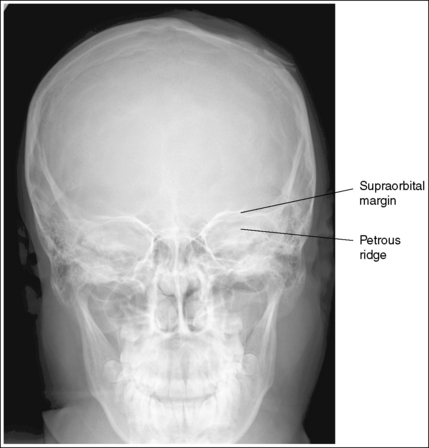
3. Determine if the two structures will move toward or away from each other when the main structure is adjusted. For example, when the medial femoral condyle is moved anteriorly, the lateral condyle moves in the opposite direction (posteriorly). Also, when the patient's chin is elevated away from the chest, the supraorbital margins move superiorly, whereas the petrous ridges, being located at the central pivoting point in the cranium, do not move.
4. Begin the repositioning process by first positioning the patient as he or she was positioned for the poorly positioned image. From this position, move the patient as needed for proper positioning.
5. If the structures move in opposite directions from each other when the patient is repositioned, adjust the patient half the distance that the structures are off. For example, if the anterior surface of the lateral femoral condyle is situated 0.5 inch (1.25 cm) anterior to the anterior surface of the medial femoral condyle on a poorly positioned lateral knee projection (see Figure 1-49), the medial condyle should be rotated anteriorly 0.25 inch (0.6 cm).
6. If only one structure moves when the patient is repositioned, adjust the patient so that the structure that moves is adjusted the full amount. For example, if the petrous ridges should be located 1 inch (2.5 cm) inferior to the supraorbital margins on an accurately positioned AP axial cranial projection but they are superimposed (see Figure 1-56), then adjust the patient's chin 1 inch (2.5 cm) away from the chest, moving the supraorbital margins superiorly and 1 inch (2.5 cm) above the petrous ridges.
STEPS FOR REPOSITIONING THE CENTRAL RAY FOR REPEAT IMAGES
1. Identify the two structures that are mispositioned—for example, the medial and lateral femoral condyles for a lateral knee projection.
2. Determine which of the identified structures is positioned farthest from the IR. This is the structure that will move the most when the central ray angle is adjusted. For example, the medial femoral condyle is positioned farthest from the IR for a lateral knee projection.
3. Determine the direction in which the structure situated farthest from the IR must move to be positioned accurately with respect to the other structure. For example, in Figure 1-49, the medial femoral condyle must be moved anteriorly toward the lateral condyle to obtain accurate positioning.
4. Determine the number of inches or centimeters that the two mispositioned structures are off on the image. For example, the anterior surfaces of the medial and lateral femoral condyles should be superimposed on an accurately positioned lateral knee projection, but a 0.5-inch (1.25-cm) gap is present between them on the produced image (see Figure 1-49).
5. Estimate how much the structure situated farthest from the image will move per 5 degrees of angle adjustment placed on the central ray. How much the central ray angulation will project two structures away from each other depends on the difference in the physical distance of the structures from each other, as measured on the skeletal bone, and the IR.
Box 1-5 lists guidelines that can be used to determine the degree of central ray adjustment required when dealing with different anatomic structures. For example, the physical space between the femoral condyles of the knee, as measured on a skeletal bone, is approximately 2 inches (5 cm). Using the central ray adjustment guidelines in Box 1-5, we find that structures that are 2 inches apart will require a 5-degree central ray angle adjustment to move the part situated farthest from the IR 0.25 inch (0.6 cm) more than the structure situated closer to the IR.
6. Place the needed angulation on the central ray, as determined by steps 4 and 5 above, and direct the central ray in the direction indicated in step 3 above. For example, if a lateral knee image demonstrates a separation between the medial and lateral femoral condyle of 0.5 inch (1.25 cm), then the central ray would need to be adjusted 10 degrees and directed toward the part farthest from the IR that needs to be moved to superimpose the condyles on the image. To obtain an optimal lateral knee projection for Figure 1-49 using the central ray only to improve positioning, it should be angled 10 degrees and directed anteriorly. This will move the medial condyle 0.5 inch (1.25 cm) anteriorly.
Figure 1-56 demonstrates a poorly positioned AP axial projection (Caldwell method). To obtain an optimal AP axial projection using the central ray, the technologist will do the following:
• Identify that the petrous ridges and supraorbital margins are superimposed on the image in Figure 1-56 and the supraorbital margins should be 1 inch (2.5 cm) superior to the petrous ridges on an optimal projection.
• Determine that the supraorbital margins are the farthest from the IR and that they will need to be moved 1 inch (2.5 cm) superiorly to obtain optimal alignment with the petrous ridges.
• Measure the physical distance between the petrous ridges and supraorbital margins on a skeletal structure, which will be found to be about 3 inches (7.5 cm), and then use the chart in Box 1-5 to determine the degree of angulation adjustment that is needed to move the supraorbital margins 1 inch (2.5 cm) superiorly.
• Adjust the central ray angulation by 10 degrees cephalically before repeating the image.
Recorded Detail
Recorded detail refers to the sharpness of the lines of the image. If the lines are recorded as sharp, the image demonstrates good recorded detail. Poor recorded detail is visualized as a blurry edge around the lines. The factors that influence how well the recorded details are resolved include the focal spot size, SID, OID, speed of the image receptor system, contact between the film and intensifying screen, motion, and double exposure.
Focal Spot Size
A detail that is smaller than the focal spot used to produce the image will not be visible. This is why a small focal spot is recommended when fine detail demonstration is important, such as images of the extremities. Compare the trabecular patterns on the ankle images in Figures 1-57 and 1-58. Figure 1-57 was taken using a large focal spot and Figure 1-58 was taken using a small focal spot. Note how the use of a small focal spot increases the visibility of the bony trabeculae.
Using a small focal spot may not be feasible when imaging structures that require a high milliampere-seconds (mAs) setting because milliamperage (mA) settings of 300 mA or below can only be used when the small focal spot is chosen and the need for a long exposure time to obtain the density required may result in patient motion. Weigh the expected exposure time and the possibility of motion against the advantages gained by choosing a small focal spot. If the patient's thickness measurement is large or the patient's ability to hold still is not reliable, a large focal spot and high milliamperage is the better choice.
Distances
By using the shortest possible OID and the longest feasible SID, size distortion can be kept to a minimum. This is especially important, because size distortion reduces an object's recognizability and blurs the recorded details.
In nonroutine clinical situations, the technologist may be unable to get the part as close to the IR as possible. For example, if a patient lying flat on the imaging table were unable to straighten his or her knee and had to keep it bent, the knee would be up off the table and have an increased OID. The technologist can compensate for this by increasing the SID above the standard used. It is often not feasible to increase the SID the needed amount to offset the magnification completely because the ratio between the OID and SID must remain the same for equal magnification to result. For example, an image taken at a 1-inch OID and 40-inch SID would demonstrate the same magnification as one taken at a 4-inch OID and 160-inch SID because both have a 1:40 ratio. When the SID is increased to offset magnification, it is also necessary to increase the mAs using the square law to maintain density.
Image Receptor Systems
Image receptors are chosen for their ability to demonstrate fine recorded details or for their speed. For maximum recorded detail sharpness, choose a single-emulsion film with a low-speed single-screen IR. This single-emulsion system (referred to as a slow detail system) eliminates the unsharpness caused by the parallax and crossover effects seen when a thick or large crystal screen emulsion is used to increase speed. Figure 1-59 demonstrates a hand image exposed using a slow detail screen and a fast screen system. Compare the trabecular patterns on these hand images. As a general rule, the higher the relative speed of the intensifying screen used, the lower will be the sharpness of detail demonstrated. Use a low-speed system for most extremity examinations. This system is for tabletop work only and should not be used when a grid is used or when a thick body part is being imaged. A medium-speed system should be used when the detail capability provides little benefit. For example, hands and feet can have hairline fractures that may be visualized only on a detail screen; because a fracture of the femoral bone is very obvious, however, we do not need to see small details to identify it. Use a high-speed system for examinations such as those performed for scoliosis, in which the bony cortical outlines are all that need to be demonstrated for measurements to be taken. Such a system should not be used when information about the structure itself is desired.
Poor Screen-Film Contact: This results when a screen-film system is used and a foreign object is wedged between the IR and the screen or the cassette is damaged or warped. Radiographically, poor screen-film contact is demonstrated by a blurred image only in the area in which the screen and film are not making direct contact. Figure 1-60 demonstrates a PA oblique hand projection. Note how the hand image is sharp everywhere, except at the fourth and fifth digits. Because it would be impossible for these two fingers to move without also causing the rest of the hand to move, it can be concluded that this blurring is a result not of patient motion but of poor screen-film contact. The screen should be thoroughly cleaned and tested on a phantom. If the test radiograph does not demonstrate improved screen-film contact, the cassette should be replaced.
Motion
The term motion unsharpness refers to lack of detail sharpness in an image that is most often caused by patient movement during the exposure. This movement can be voluntary or involuntary. Voluntary motion refers to the patient's breathing or otherwise moving during the exposure. It can be controlled by explaining to the patient the importance of holding still, making the patient as comfortable as possible on the imaging table, using the shortest possible exposure time, and using positioning devices. Voluntary motion can be identified on an image by blurred bony cortical outlines (Figure 1-61). Involuntary motion is movement that the patient cannot control. Its effects will appear the same as those of voluntary motion in most situations, with the exception of within the abdomen. In the abdomen, peristaltic activity of the stomach and small or large intestine can be identified on an image by sharp bony cortices and blurry gastric and intestinal gases (Figure 1-62). The only means of decreasing the blur caused by involuntary motion is to use the shortest possible exposure time, which in some cases is not good enough. At times, normal voluntary motions such as breathing or shaking can become involuntary motions. For example, an unconscious patient is unable to control breathing and a patient with severe trauma may be unable to control shivering.
Double-Exposed Image
A double-exposed image may also appear blurry and can easily be mistaken for an image affected by patient motion (Figure 1-63). When evaluating a blurry image, look at the cortical outlines of bony structures that are lying longitudinally and transversely. Is there only one cortical outline representing each bony structure, or are there two? Is one outline lying slightly above or to the side of the other? If one outline is demonstrated, the patient moved during the exposure, but if two are demonstrated, the image was exposed twice, and the patient was in a slightly different position for the second exposure.
Radiation Protection
Diagnostic imaging professionals have a responsibility to adhere to effective radiation protection practices for the following reasons: (1) to prevent the occurrence of radiation-induced nonstochastic effects by adhering to dose-equivalent limits that are below the threshold dose-equivalent levels and (2) to limit the risk of stochastic effects to a reasonable level compared with nonradiation risks and in relation to society's needs, benefits gained, and economic factors.3
More than adults, children are susceptible to low levels of radiation because they possess many rapidly dividing cells and have a longer life expectancy. In rapidly dividing cells, the repair of mutations is less efficient than in resting cells. When radiation causes DNA mutations in a rapidly dividing cell, the cell cannot repair the damaged DNA sufficiently and continue to divide; therefore, the DNA remains in disrepair. The risk of cancer from radiologic examinations accumulates over a lifetime, and because children have a longer life expectancy, they have more time to manifest radiation-related cancers. This is particularly concerning because many childhood diseases require follow-up imaging into adulthood.
Continually evaluating one's radiation protection practices is necessary because radiation protection guidelines for diagnostic radiology assume a linear, nonthreshold, dose-risk relationship. Therefore any radiation dose, whether small or large, is expected to produce a response. Even when radiation protection efforts are not demonstrated on the image, good patient care standards dictate their use. Following are radiation protection practices that should be evaluated to provide images that can be obtained by following the ALARA (as low as reasonably achievable) philosophy.
Effective Communication
Taking the time to explain the procedure to the patient and giving clear, concise instructions during the procedure will help the patient understand the importance of holding still and maintaining the proper position, reducing the need for repeat radiographic exposures and additional radiation dose.
Immobilization Devices
If the patient moves during a procedure, the resulting image will be blurred. Such images have little or no diagnostic value and need to be repeated with additional exposure to the patient. Using appropriate immobilization devices can eliminate or minimize patient motion, which is especially important when imaging children, who may have a limited ability to understand and cooperate.
Source-Skin Distance
Mobile radiography units do not have the SID lock that department equipment is required to have to prevent exposures from being taken at an unsafe SID. When operating mobile radiography units, the technologist must maintain a source-skin distance (SSD) of at least 12 inches (30 cm) to prevent an unacceptable entrance skin dose. The entrance skin dose represents the absorbed dose to the most superficial layers of skin. As the distance between the source of radiation and the person increases, radiation exposure decreases. The amount of exposure decrease can be calculated using the inverse square law.
Compensating Filters
Compensating filters are constructed of aluminum or lead-acrylic and are used to create more homogeneous density across objects that vary in thickness. The filter absorbs x-ray photons before they reach the IR. The thicker part of the filter absorbs more photons than the thinner part. When a compensating filter is used, a technique is set that will adequately expose the thickest part being examined. If the filter has been accurately positioned, it will absorb the excessive radiation directed toward the thinnest structures, resulting in uniform image density throughout the image. Compensating filters that are positioned between the focal spot and the patient will reduce radiation dose to structures positioned beneath the filter.
Grids
Grids are used to improve radiographic contrast by eliminating some of the scatter radiation before it exposes the IR and should be used when imaging anatomic parts that are 4 inches (10 cm) or larger and using tube potentials above a 60-kilovoltage peak (kVp). When a grid is added, the mAs must be increased to compensate for the density loss that occurs as scatter is reduced. This increase will cause a direct increase in patient dose. To keep patient exposure as low as possible, grids should be used only when appropriate and the grid ratio should be kept to the lowest possible value that will provide sufficient contrast improvement as based on the kVp range used (see later, Table 1-1).
Screen-Film Image Receptor Speed
Relative screen speed is a major factor in reducing the radiation dose to the patient. By changing to a faster screen that requires less radiation to produce the image, the technologist can significantly reduce the patient's radiation dose. Unfortunately the reduction in dose gained from switching to a higher speed screen must be weighed against the sharpness of detail loss that occurs.
Possible Pregnancy
When imaging a female of childbearing age, it is essential that the technologist question the patient regarding the possibility of pregnancy. In some departments this is required of all females older than 11 years. Teenage girls may not admit to being pregnant until they reach the radiology department. If there is hesitancy rather than denial, additional questioning should occur, with follow-up questions such as, “Are you sexually active? If so, are you taking precautions?” If the patient is to have a procedure that requires significant pelvic exposure and there is some doubt as to her pregnancy status, it is recommended that a pregnancy test be performed.
Avoiding unnecessary radiation exposure or limiting it during the embryonic stage of development is essential because it is in this stage that the embryonic cells are dividing and differentiating and they are extremely radiosensitive and easily damaged by ionizing radiation.
Gonadal Shielding
Proper gonadal shielding practices have been proven to reduce radiation exposure of the female and male gonads. Gonadal shielding is recommended in the following situations:
• When the gonads are within 2 inches (5 cm) of the primary x-ray beam
• If the patient is of reproductive age
• If the gonadal shield does not cover information of interest
Professional technologists must always strive to improve skills and develop better ways to ensure good patient care while obtaining optimal images. All images should be evaluated for the accuracy of gonadal shielding.
Gonadal Shielding in the AP Projection for Female Patients
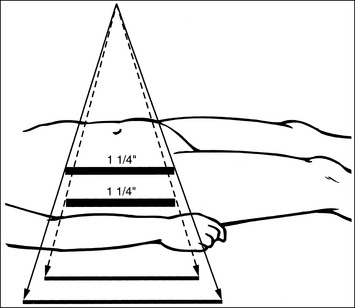
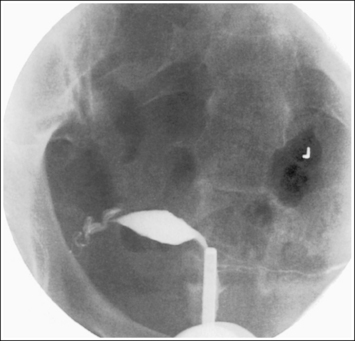
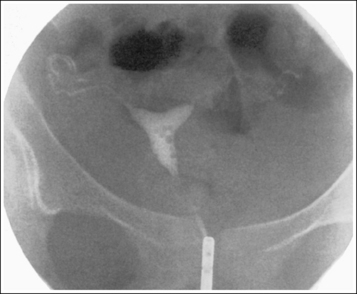
Shielding the gonads of the female patient for an AP projection of the pelvis, hip, or lumbar vertebrae requires more precise positioning of the shield to prevent the obscuring of pertinent information. The first step in understanding how to shield a woman properly is to know which organs should be shielded and their location. These are the ovaries, uterine (fallopian) tubes, and uterus. The uterus is found at the patient's midline, superior to the bladder. It is approximately 3 inches (7.5 cm) in length; its inferior aspect begins at the level of the symphysis pubis and it extends anterosuperiorly. The uterine tubes are bilateral, beginning at the superolateral angles of the uterus and extending to the lateral sides of the pelvis. Tucked between the lateral side of the pelvis and the uterus and inferior to the uterine tubes are the ovaries. The exact level at which the uterus, uterine tubes, and ovaries are found varies from patient to patient. Figures 1-64 and 1-65 show images from two different hysterosalpingograms. Note the variation in the location of the uterus, uterine tubes, and ovaries in these two patients. Because the location of these organs within the inlet pelvis cannot be determined with certainty, the entire inlet pelvis should be shielded to ensure that all the reproductive organs' have been protected.
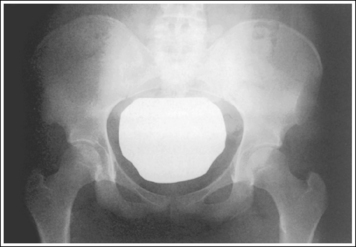
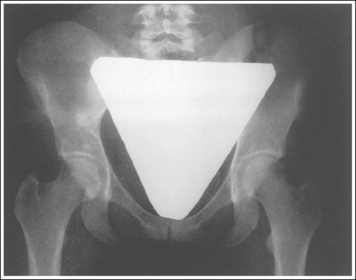
To shield the female gonads properly, use a flat contact shield made from at least 1 mm of lead and cut to the shape of the inlet pelvis (Figure 1-66). Oddly shaped and male (triangular) shields do not effectively protect the female patient (Figure 1-67). The dimensions of the shield used should be varied according to the amount of magnification that the shield will demonstrate, which is determined by the OID and SID and by the size of the patient's pelvis, which increases from infancy to adulthood. Each department should have different-sized contact or shadow shields for variations in female pelvic sizes for infants, toddlers, adolescents, and young adults.
To position the shield on the patient, place the narrower end of the shield just superior to the symphysis pubis and allow the wider end of the shield to lie superiorly over the reproductive organs. Side-to-side centering can be evaluated by placing an index finger just medial to each anterior superior iliac spine (ASIS). The sides of the shield should be placed at equal distances from the index fingers. When imaging children, do not palpate the pubic symphysis because they are taught that no one should touch their “private parts.” Instead use the greater trochanters to position the shield because they are at the level of the superior border of the pubic symphysis. It may be wise to tape the shield to the patient. Patient motion such as breathing may cause the shield to shift to one side, inferiorly, or superiorly.
Gonadal Shielding in the AP Projection for Male Patients
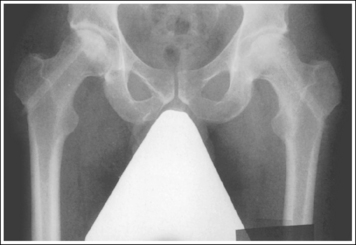
The reproductive organs that are to be shielded on the male are the testes, which are found within the scrotal pouch. The testes are located along the midsagittal plane inferior to the symphysis pubis. Shielding the testes of a male patient for an AP projection of the pelvis or hip requires more specific placement of the lead shield to avoid obscuring areas of interest. For these examinations, a flat contact shield made from vinyl and 1 mm of lead should be cut out in the shape of a right triangle (one angle should be 90 degrees). Round the 90-degree corner on this triangle. Place the shield on the adult patient with the rounded corner beginning approximately 1 to 1.5 inches (2.5 to 4 cm) inferior to the palpable superior symphysis pubis. When accurately positioned, the shield frames the inferior outlines of the symphysis pubis and inferior ramus and extends inferiorly until the entire scrotum is covered (Figure 1-68). Each department should have different-sized male contact shields for the variations in male pelvic sizes for infants, youths, adolescents, and young adults.
Gonadal Shielding in the Lateral Projection for Male and Female Patients
When male and female patients are imaged in the lateral projection, use gonadal shielding whenever (1) the gonads are within the primary radiation field and (2) shielding will not cover pertinent information. In the lateral projection, male and female patients can be similarly shielded with a large flat contact shield or the straight edge of a lead apron. Begin by palpating the patient's coccyx and elevated ASIS. Next, draw an imaginary line connecting the coccyx with a point 1 inch posterior to the ASIS, and position the longitudinal edge of a large flat contact shield or half-lead apron anteriorly against this imaginary line (Figure 1-69). This shielding method can be safely used on patients being imaged for lateral vertebral, sacral, or coccygeal projections without fear of obscuring areas of interest (Figure 1-70).
Shielding of Radiosensitive Cells Not Within Primary Beam
Shielding of radiosensitive cells should be done whenever they lie within 2 inches (5 cm) of the primary beam. Radiosensitive cells are the eyes, thyroid, breasts, and gonads. To protect these areas, place a flat contact shield constructed of vinyl and 1 mm of lead or the straight edge of a lead apron over the area to be protected. Because the atomic number of lead is so high, radiation used in the diagnostic range will be readily absorbed in the shield.
Collimation
Tight collimation reduces the radiation exposure of anatomic structures that are not required on the image. For example, its use on chest images will reduce exposure of the patient's thyroid; on a cervical vertebral image, it will reduce exposure of the eyes; on a thoracic vertebrae image, it will reduce exposure of the breasts; and, on a hip image, it will reduce exposure of the gonads.
Exposure Factors to Minimize Patient Exposure
Selection of appropriate technical exposure factors for a procedure should focus on producing an image of diagnostic quality with minimal patient dose. This is accomplished by selecting the highest practical kilovoltage and the lowest mAs that will produce an image with sufficient information. Also, when the patient has difficulty holding still or halting respiration, the shortest possible exposure time should be used by selecting a high-milliampere station.
Automatic Exposure Control Backup Timer
The backup timer is a safety device that prevents overexposure to the patient when the automatic exposure control (AEC) is not properly functioning or the control panel is not set correctly. When using the AEC, set the AEC backup time at 150% to 200% of the expected manual exposure time. Once the backup time is reached, the exposure will automatically terminate.
Anatomic Artifacts
These are anatomic structures of the patient or x-ray personnel that are demonstrated on the image but should not be there (Figure 1-71). Note in the figure how the patient's other hand was used to help maintain the position. This is not an acceptable practice. Many sponges and other positioning tools are available to aid in positioning and immobilizing the patient. Whenever the hands of the patient, x-ray personnel, or others must be within the radiation field, they must be properly attired with lead gloves.
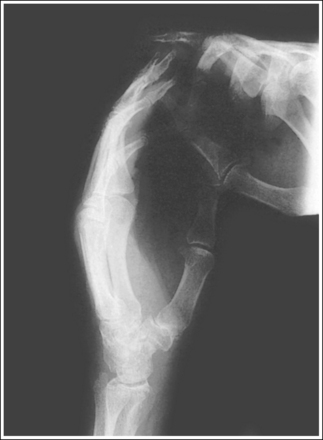
Personnel and Family Members in Room During Exposure
Appropriate immobilization devices should be used and all personnel and family members should leave the room before the x-ray exposure is made. If the patient cannot be effectively immobilized or left alone in the room during the exposure, lead protection attire such as aprons, thyroid shields, glasses, and gloves should be worn by the personnel during any x-ray exposure. Anyone remaining in the room should also stand out of the path of the radiation source and as far from it as possible.
Radiographic Density
Radiographic density is a visibility of detail factor that describes the amount of overall blackness seen on the image and is directly related to the quantity of radiation that reaches the IR. The technologist evaluates each image for sufficient density by determining whether the bony and soft tissue structures of interest are visualized. If the anatomic structures of interest are not adequately seen, the technologist must determine which factors contributed to the density error. Before making any changes and repeating an examination because the image is too dark or light, evaluate all factors that affect radiographic density:
• Did you read the technique chart correctly and set the mAs and kVp as stated on the technique chart?
• Was the patient measured correctly?
• Was the patient properly positioned in respect to the activated ionization chamber(s)?
• Was a grid used, if required, and was it positioned correctly with the central ray?
• Did you use the correct receptor system, and was the correct IR placed in that system?
• Did you use maximum collimation?
• Was a compensating filter used when applicable?
• Did you position the part to use the anode heel effect to your advantage?
Only if all of these factors are considered can one be ensured that the correct adjustment was made prior to repeating the image.
The following discussion will present the factors that cause excessive and insufficient radiographic density. Tables 1-1 and 1-2 can be used when evaluating the causes of poor radiographic density on images and determining how to improve the image.
TABLE 1-2
Insufficient Radiographic Density
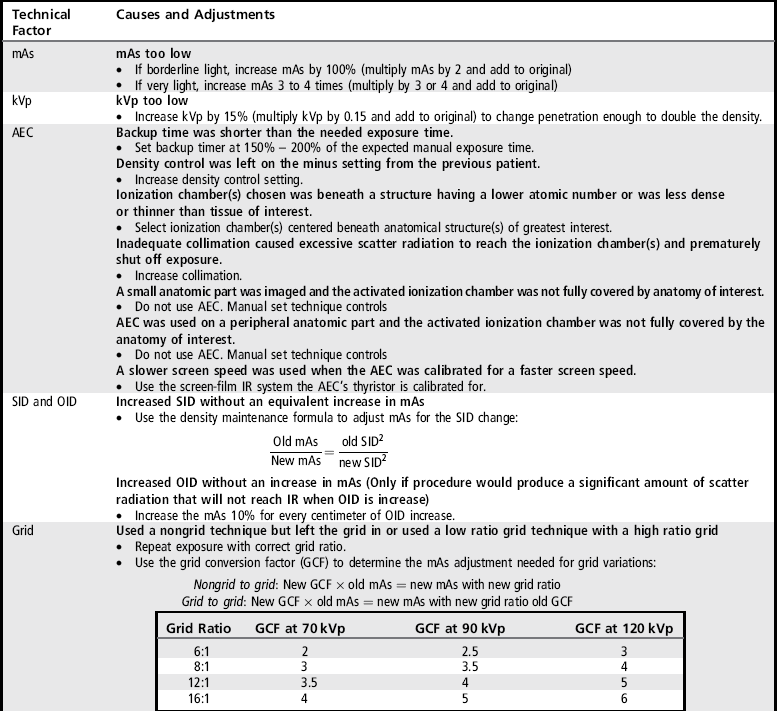
AEC, Automatic exposure control; mAs, milliampere-seconds; IR, image receptor; OID, object–image receptor distance; SID, source–image receptor distance.
Milliampere-Seconds
Density is directly related to the quantity of radiation that reaches the IR and mAs is the controlling factor for quantity. With adequate penetration, an increase in mAs will cause an increase in radiographic density and a decrease in mAs will cause a decrease in radiographic density. If an image is exposed using excessive mAs, it demonstrates density that is so dark that some or all of the bony and soft tissue structures of interest are not well visualized. A dark image produced using excessive mAs can be distinguished from one that was produced using very high kVp by evaluating the contrast on the image.
An overexposed image obtained using excessive mAs will demonstrate acceptable contrast as long as the kVp is optimal. Even though the overall image will be dark, the cortical outlines of the bone should remain high in contrast. Figure 1-72 demonstrates an accurately exposed and overexposed AP pelvic projection.
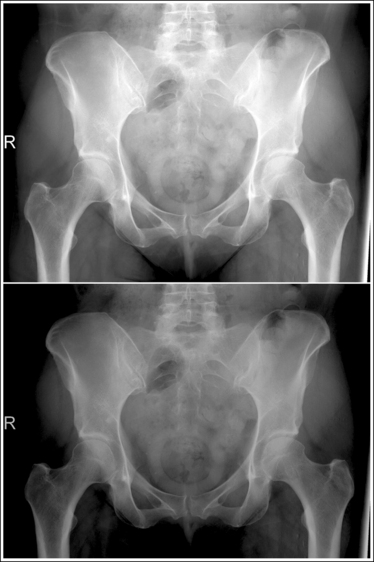
An underexposed image obtained using insufficient mAs will demonstrate density that is so light that some or all of the anatomic structures cannot be evaluated. Evaluating the visualization of the bony trabecular patterns is valuable when determining acceptability of such an image because usually on light images, unless underexposure is extreme, the demonstration of the soft tissue structures is better. Because underexposed and underpenetrated images demonstrate low density, it is necessary to learn to identify each technical error. One way to distinguish whether an image has been underexposed rather than underpenetrated is to study the bony cortical outlines of the structures of interest. On an image that has been underexposed, the cortical outlines are visible, even though their density is light, whereas an underpenetrated image will not demonstrate areas of the cortical outlines that were not penetrated. Figure 1-73 shows accurately exposed and underexposed AP pelvic projections.
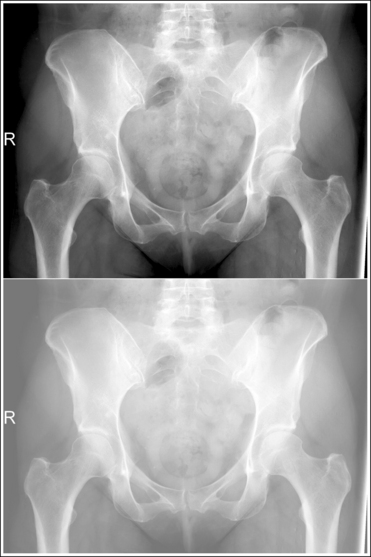
When image density is inadequate, mAs is the controlling factor of choice. How much adjustment in mAs should be made to obtain an optimal image is directly proportional to the amount of increase or decrease in density that is needed. Typically, three adjustments are made when making density changes:
• A 30% change in mAs adjusts the image density just enough for the eyes to be able to visualize that a change has been made. This amount of adjustment should never be used when an image needs to be repeated because the density is too light or dark. However, it is an ideal adjustment to make when the image demonstrates acceptable but not optimal density and needs to be repeated because of a factor other than density, such as an artifact, patient motion, or mispositioning. To calculate a 30% change, multiply the original mAs value by 0.30; then, add the result to the original mAs value to increase density or subtract the result from the original mAs value to decrease density.
• An image that is borderline too light requires a 100% increase in mAs (see Figure 1-73) and an image that is borderline too dark requires a 50% decrease in mAs (see Figure 1-72). To calculate a 100% increase in density, multiply the original mAs by 2 and add the result to the original mAs. If the original mAs were 20, the new mAs would be 40. To calculate a 50% decrease in density, divide the original mAs by 2 and subtract the result from the original mAs, so that if the original mAs were 20, the new mAs would be 10.
• An image that is so light or dark that you immediately know absolutely that it needs to be repeated requires a 3 or 4 times increase in mAs if it is too light (Figure 1-74) and a 3 or 4 times decrease in mAs if it is too dark (Figure 1-75). To calculate a 3 or 4 times increase in density, multiply the original mAs by 3 or 4, respectively, and add the results to the original mAs. To calculate a 3 or 4 times decrease in density, multiply the original mAs by 3 or 4 times, respectively, and subtract the result from the original mAs.
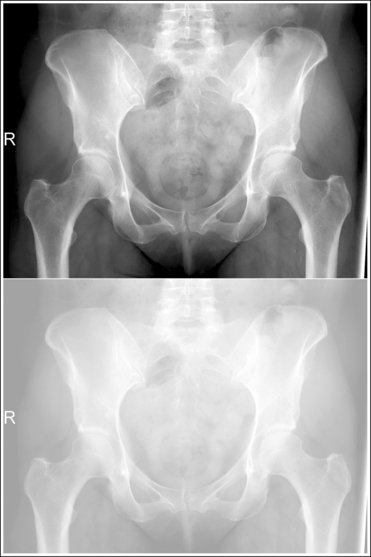
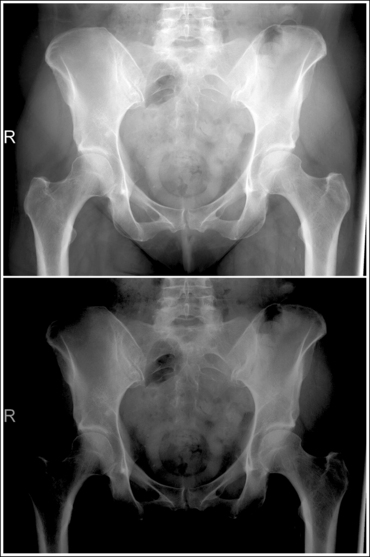
Kilovoltage
The penetrating ability of the primary x-ray beam is controlled by the kilovoltage peak that is used. Radiographic density is affected by a change in kVp because it alters the quality of photons, which changes the ratio of penetrated to absorbed photons. The higher the kVp, the greater is the number of photons that penetrate the patient and reach the IR, resulting in greater image density; the lower the kVp, the greater is the number of photons absorbed in the patient, decreasing the numbers reaching the IR and image density. Because no amount of mAs will ever compensate for insufficient kVp, an optimum kVp level based on the tissue's composition and thickness is required for each body part. Optimum kVp is defined as the kVp that will provide adequate body part penetration and sufficient gray scale.
An image that has been adequately penetrated demonstrates the cortical outlines of the thinnest and thickest bony structures of interest. If these structures have not been penetrated (not enough kVp used), the image demonstrates too little density but, in comparison with an underexposed image, the cortical outlines of the thickest parts of the structure are not visible. Compare the bottom images in Figures 1-76 and 1-73. Note that if a transparency were laid over the images and an outline of the bony structures drawn on the transparency, with lines made only where the cortical outlines of the bone were clearly visible, many of the hip structures around the acetabulum would not be drawn. If the cortical outlines of the structure of interest can be seen even though the image density is light, it can be concluded that the mAs needs adjusting; if the cortical outlines of the structure cannot be seen and the image density is light, a kVp adjustment is required.
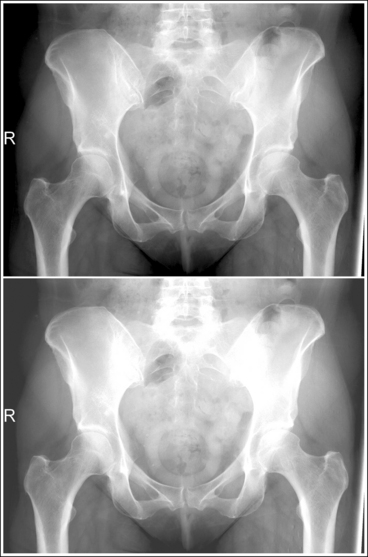
Figure 1-76 Accurately penetrated (top) and underpenetrated (100% density difference; bottom) AP pelvic projections.
An underpenetrated image may also demonstrate inadequate density. The amount of density adjustment needed must also be considered when deciding how much kVp adjustment is to be made:
• If an image has to be repeated because it was underpenetrated and the density (see earlier, density discussion, for the explanation) was 100% too light, increase the kVp by at least 15%. (If 50 kVp was the level used on the original image, the new kVp level is calculated by multiplying 50 by 0.15 and adding the result [7.5] to the original 50 kVp; the new kVp value would be 57.5.) The mAs should remain the same as that used on the original image, because a 15% kVp change will also increase density by 100% (see Figure 1-76).
• If an image is underpenetrated and light enough to require a 3 or 4 times density adjustment, a combination kVp and mAs change is indicated. Figure 1-77 demonstrates an underpenetrated AP pelvic projection. How much of the adjustment should be with kVp in this situation depends on your departmental standard for contrast; it can be determined by using the optimal kVp level for the structure being imaged as a guideline. As a general rule, the kVp should be kept relatively close to the optimal level. First, calculate a 15% increase in the kVp. Is this new kVp reasonably close to the optimal level for the structure being imaged? If so, you know that there will be a significant penetration change, and any additional density adjustment could be made with mAs without negatively affecting image contrast. Increasing the kVp too far above optimum results in an increase in scatter radiation being directed toward the IR and a decrease in image contrast.
Patient Condition
Additive and destructive patient conditions that result in change to the normal bony structures, soft tissues, or air or fluid content of the patient may require technical changes as compensation before exposing the patient. Additive diseases cause tissues to increase in mass density or thickness, resulting in them being more radiopaque, whereas destructive diseases cause tissues to break down, resulting in them being more radiolucent. Table 1-3 lists common additive and destructive diseases that may require technique adjustments and provides a starting point for adjusting technical factors for the condition.
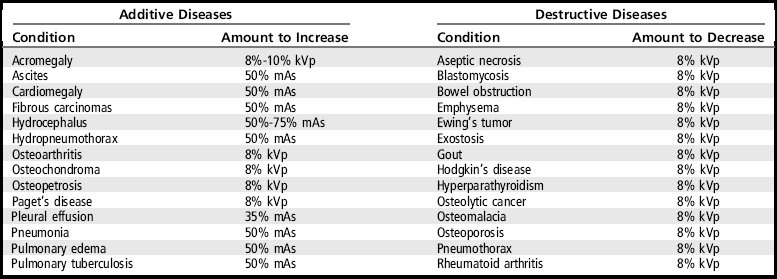
Automatic Exposure Control
The AEC allows the mAs to be automatically determined by controlling the exposure time, but it is the technologist's responsibility to set an optimum kVp and optimal mA manually. Optimum mA refers to using a high enough mA at a given focal spot size to minimize motion, but not so high that the exposure times are shorter than the AEC's minimum response time. The minimum response time is the time that it takes for the circuit to detect and react to the radiation received; this is determined by the AEC manufacturer.
Guidelines for Using Automatic Exposure Control and Evaluating Images Produced
• Set optimum kVp for body part being imaged to obtain appropriate part penetration and contrast scale. kVp must be set to assure accurate part penetration and the desired contrast.
See earlier discussions of kVp, penetration, and contrast scale to determine the appropriate adjustment in kVp to be made when penetration and contrast scale are inadequate. If less than optimum kVp is used for the anatomy of interest, this anatomy will be underpenetrated and underexposed, although the radiographic density of any anatomic structures that were penetrated may be adequate as long as the backup time is long enough to accommodate the increased exposure time needed to compensate. An underexposed light image will result if the kVp is so low that inadequate penetration occurred in all anatomic structures beneath the activated chamber(s). No amount of mAs will compensate for inadequate penetration.
• Set mA at the highest station for the focal spot size needed, but not so high that the exposure time required for proper radiographic density is less than the minimum response time.
Exposures taken with an exposure time that is less than the minimum response time will result in overexposed, dark images. This is because the AEC circuit does not have enough time to detect and react to the radiation received to shut the exposure off in the time needed to produce the ideal image. The mA station should be decreased until exposure times are sufficient to produce the desired density.
• Set backup time at 150% to 200% of the expected manual exposure time. As a general guideline, use 0.2 seconds for all chest and proximal extremities, 1 second for abdominal and skull projections, and 2 – 4 seconds for very large torso projections.
The backup timer is the maximum time that the x-ray exposure will be allowed to continue. Once the backup time is met the exposure will automatically terminate. If the set backup time is too short the exposure will prematurely stop before adequate exposure has reached the ionization chamber(s), resulting in an underexposed, light image. If the set backup time is too long and the AEC is not functioning properly or the control panel is not correctly set, the exposure will continue much longer than needed to produce adequate density, resulting in an overexposed, dark image and excessive radiation dose to the patient.
• Select and activate the ionization chamber(s) that will be centered beneath the anatomic structures of greatest interest.
Recommendations for ionization chamber selection can be found at the beginning of each procedural analysis chapter of the book. Failure to properly activate the correct ionization chamber(s) and center the anatomic structures of greatest interest beneath them will result in images that are over- or underexposed. An overexposed image results when the ionization chamber chosen is located beneath a structure that has a higher atomic number or is thicker or denser than the structure of interest. For example, when an AP abdomen projection is taken, the outside ionization chambers should be chosen and situated within the soft tissue, away from the lumbar vertebrae, to yield the desired abdominal soft tissue density. If the chamber situated under the lumbar vertebrae is used instead, the capacitor (device that stores energy) requires a longer exposure time to reach its maximum filling level and terminate the exposure. This occurs because of the high atomic number of bone and the higher number of photons that bone absorbs compared with soft tissue. The result will be an image with adequate bone density but overexposed soft tissue (Figure 1-78).
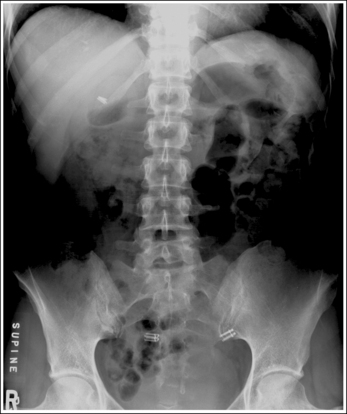
An underexposed image results, however, when the ionization chamber chosen is located beneath a structure that has a lower atomic number or is thinner or less dense than the structure of interest. When an AP lumbar vertebral projection is taken, the center ionization chamber is chosen and centered directly beneath the lumbar vertebrae. If one or both of the outside chambers are used or the center ionization chamber is off center, the image is underexposed, because soft tissue, which has a lower atomic number than bone, is above the activated chamber (Figure 1-79).
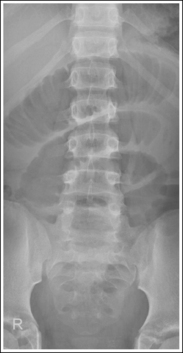
• Do not use AEC on peripheral or very small anatomy where the activated chamber(s) is not completely covered by the anatomy, resulting in a portion of the chamber(s) being exposed with a part of the x-ray beam that does not go through the patient.
Each activated ionization chamber measures the average amount of radiation striking the area it covers. The part of the chamber not covered with tissue will collect radiation so quickly that it will charge the capacitor to its maximum level, terminating the exposure before proper density has been reached, resulting in an underexposed light image (Figure 1-80).
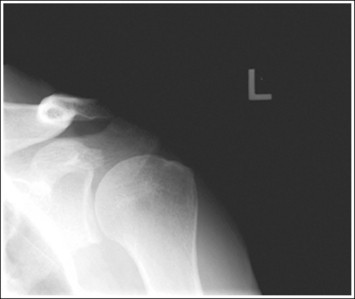
Figure 1-80 AP oblique (Grashey method) shoulder projection that was exposed with the center AEC chamber positioned too peripherally.
• Tightly collimate to the area of interest to reduce scatter radiation from the table or body that may cause the AEC to shut off prematurely.
For example, an AP thoracic vertebrae projection that has inadequate side-to-side collimation will demonstrate too much scatter through the lungs, hitting the AEC before the vertebrae can be adequately exposed.
• Do not use the AEC when the structures of interest are in close proximity to thicker structures and both will be situated above the activated ionization chamber.
For example, it is best not to use the AEC on an AP atlas and axis (open-mouthed) projection of the dens. With this examination, the upper incisors, occipital cranial base, and mandible add thickness to the areas superior and inferior to the dens and atlantoaxial joint. This added thickness causes the area of interest to be overexposed, because more time is needed for the capacitor to reach its maximum level as photons are absorbed in the thicker areas (Figure 1-81).
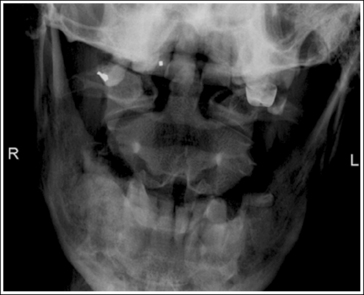
Figure 1-81 AP atlas and axis (open-mouthed) projection that was exposed using the center AEC chamber.
• Never use the AEC when any type of radiopaque hardware or prosthetic device will be positioned above the activated chamber(s). For these situations, use a manual technique.
• Make certain that no external radiopaque artifacts such as lead sheets or sandbags are positioned over the activated chamber(s).
Radiopaque materials, such as metal, lead sheets, or sandbags, have a much higher atomic number than that of the bony and soft tissue structures of the body. When a radiopaque material is situated within the activated chamber(s), the AEC will attempt to expose the radiopaque structure adequately, resulting in the anatomic structures being overexposed and a dark image (Figure 1-82).
• Use only the screen-film IR combination that the AEC's thyristor (device used to set the maximum capacitor charge) is calibrated to accommodate.
If a higher speed screen-film IR system is used with an AEC that is calibrated for a lower screen-film system, an overexposed dark image will result; if a lower speed screen-film IR system is used with an AEC that is calibrated for a higher screen-film system, an underexposed light image will result. The AEC will not adjust for changes in receptor system speeds without the thyristor being recalibrated for the system.
• Density controls can temporarily be used when AEC equipment is out of calibration and to fine tune radiographic density when the anatomic structure of interest and activated chamber(s) are only slightly misaligned.
The density controls change the preset thyratron sensitivity so that the exposure time will be increased or decreased, adjusting radiographic density by the density control setting amount. Typical density control settings change the exposure level by increments of 25%, with the +1 and +2 buttons increasing the exposure and the −1 and −2 buttons decreasing the exposure. The 1 buttons will result in a 25% density change and the 2 buttons in a 50% density change. Some facilities have the AEC density controls set to obtain a 100% density increase and a 50% density decrease.
Correcting Poor Automatic Exposure Control Images
Tables 1-1 and 1-2 list reasons why an AEC image may have inadequate density. When an unacceptable AEC image is produced, the technologist needs to consider each potential cause to determine the correct adjustment to make before repeating the image. Many imaging units include an mAs readout display, on which the amount of mAs used for the image is shown after the exposure. In situations in which it is not advisable to repeat an unacceptable image using the AEC, the technologist can revert to a manual technique by using this readout to adjust the mAs to the value needed.
Source–Image Receptor Distance
Increasing the SID will decrease radiographic density. Decreasing the SID will increase density by the inverse square law, because the area through which the x-rays are distributed is spread out or condensed, respectively, with distance changes. It takes only a 20% change in SID for a visible density change to occur. When the technologist uses a manual technique and varies the SID from the standard, the mAs should be adjusted by using the direct square law ([new mAs]/[old mAs] = [new distance squared]/[old distance squared]), preventing an over- or underexposed image. Failure to make this adjustment may require the image to be repeated. If this occurs, leave the SID at the same setting and adjust the mAs the needed amount (see Tables 1-1 and 1-2).
Object–Image Receptor Distance
Although it is standard to maintain the lowest possible OID, there are situations in which increasing the OID is unavoidable. Increasing the OID may result in a noticeable density loss because of the reduction in the amount of scatter radiation detected by the IR when a portion of the scattered x-rays generated in the patient are scattered away from the IR. The amount of density loss will depend on the degree of OID increase and the amount of scatter that would typically reach the IR for such a procedure, which is determined by the kVp selected, field size, and patient thickness. As tube potentials are raised above 60 kVp, scatter radiation is directed in a more increasingly forward direction, so the image will demonstrate significant density loss as the OID is increased and the scatter is diverged away from the IR. With tube potentials below 60 kVp, there is a decrease in the number of scatter photons that are scattered in a forward direction, so an increase in OID will not result in a significant enough change in the amount of scatter reaching the IR or image density to be noticeable. A larger field size and body part thickness will affect the amount of scatter produced, with more production resulting in increased reduction of scatter reaching the IR as the OID increases. When the OID is increased, causing significant scatter radiation to be diverted from the IR, the mAs should be increased by about 10% for every centimeter of OID to compensate for the loss in density that such a change will cause.
Grids
When a grid is added or the technologist changes from one grid ratio to another, radiographic density will be inadequate unless the mAs is adjusted (see Table 1-2) to compensate for the resulting change in scatter radiation cleanup. When changing to a higher grid ratio, an increase in mAs is needed or insufficient radiographic density will result; when changing to a lower grid ratio, a decrease in mAs is needed or excessive radiographic density will be demonstrated.
Inadequate radiographic density will also be seen when the grid and central ray are misaligned, causing a decrease in the number of transmitted photons that reach the IR. The density decrease caused by grid cutoff can be distinguished from other density problems by the appearance of grid lines (small white lines) on the image where the cutoff is demonstrated. (See later, “Equipment-Related Artifacts,” for examples of grid cutoff.)
Air-Gap Technique
An alternative to using a grid is to use the air-gap technique. To use the air-gap technique, move the IR 10 to 15 cm from the patient. The long OID will cause scatter radiation that would typically expose the IR at a short OID to scatter away from the IR. Because much of the scatter radiation is not being directed toward the IR, density is decreased and contrast is enhanced. When the air-gap technique is used, increase the mAs by about 10% for every centimeter of air gap. It is usually equivalent to using an 8:1 grid.
Screen-Film Receptor System Speed
Intensifying screens convert x-ray energy into light energy through fluorescence. The more light that is emitted for a given x-ray exposure, the greater is the relative speed value of the intensifying screen. Rare earth receptor systems are the most commonly used today and are defined with the descriptive names of extremity, medium speed, regular speed, and high speed, with relative speeds of 80, 300, 400 and 800, respectively. When changing from one intensifying screen speed to another, a new mAs must be calculated because each relative speed value produces a different density or the image will be too dark or too light. Each screen has a conversion factor that is calculated by forming a fraction with 100 in the numerator and the relative speed value of the screen in the denominator. Then divide the numerator by the denominator; the decimal produced is the conversion factor (e.g., a rare earth screen at a relative speed value of 400 would have a conversion factor of 100/400 = 0.25). Tables 1-1 and 1-2 list the rare earth receptors conversion factors and the formula for calculating the new mAs when changing from one screen speed to another.
Collimation
An increase or decrease in the area exposed on the patient, as determined by collimation, changes the amount of scatter radiation produced and hence the amount of scatter reaching the IR and the overall radiographic density. The amount of density change will depend on the field size and the amount of scatter that would typically reach the IR for such a procedure, which is determined by the kVp selected and patient thickness (see earlier). The mAs needs to be changed to compensate for density changes when the collimation field size is changed and the part produces significant scatter radiation. If the field size is changed from a size that will cover a 14- × 17-inch IR to a size that will cover a 10- × 12-inch IR, the mAs should be increased by about 35%. If the change is to an 8- × 10-inch IR, the mAs should be increased by about 50%. Failure to make a mAs adjustment may result in an image with inadequate density.
Compensating Filter
With some examinations, when an exposure is set that will adequately demonstrate one structure of interest, other structures of interest are overexposed. This occurs because of the differences in thickness among the structures being imaged. AP projections of the shoulder, feet, and thoracic vertebrae are three examples that demonstrate this problem. To offset this thickness difference and obtain homogeneous density, place a compensating filter over or under the thinnest structures (Figure 1-83). A compensating filter absorbs x-ray photons before they reach the IR. The thicker part of the filter absorbs more photons than the thinner part. Set a technique that will adequately expose the thickest part being examined. If the filter has been accurately positioned, it will absorb the excessive radiation directed toward the thinnest structures, resulting in uniform image density throughout the image. Figures 1-84 and 1-85 show AP foot projections. The image in Figure 1-84 was taken without using a compensating filter, whereas the image in Figure 1-85 was taken with a compensating filter positioned over the distal metatarsals and phalangeal regions. Note the increased visibility of anatomic structures covered by the compensating filter.
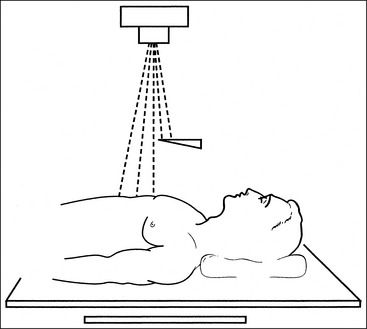
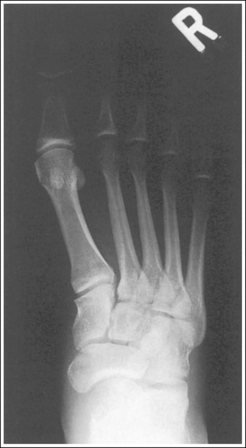
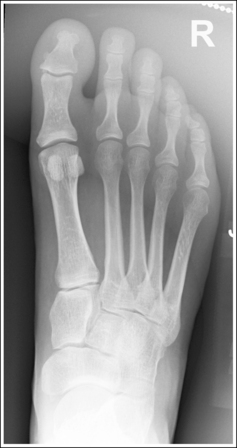
If the compensating filter is inaccurately positioned, there will be a density variation defining where the filter was and was not placed over the structures (Figure 1-86). Having too much of the filter positioned over or under a structure that does not need it will result in too many of the photons being absorbed and too little radiographic density in the area.
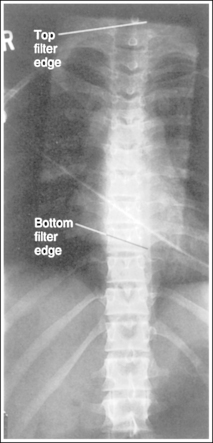
Anode Heel Effect
Another exposure factor that should be considered when positioning long bones and the vertebral column, when a long 17-inch (43-cm) field length is used to accommodate the structure, is the anode heel effect. When this field length is used, a noticeable density variation occurs across the entire field size that is significant enough between the ends of the field that when they are compared, it can be seen. This density variation is a result of the greater photon absorption that occurs at the thicker “heel” portion of the anode compared with the thinner “toe” portion when a long field is used. Consequently, radiographic density at the anode end of the tube is lower because fewer photons emerge from that end of the tube than at the cathode end.
Using this knowledge to our advantage can help produce images of long bones and vertebral column that demonstrate uniform density at both ends. Position the thinner side of the structure at the anode end of the tube and the thicker side of the structure at the cathode end. Set an exposure (mAs) that will adequately demonstrate the midpoint of the structure (where the central ray is centered). Because the anode will absorb some of the photons aimed at the anode end of the IR and the thinnest structure, but not as many of the photons aimed at the cathode end and the thickest structure, a more uniform density across that part will be demonstrated (Figure 1-87). Table 1-4 provides guidelines for positioning structures to take advantage of the anode heel effect. Because the density variation between the ends of the IR is only approximately 30%, the anode heel effect will not adequately adjust for large thickness differences but will help improve images of the structures listed in Table 1-4.
TABLE 1-4
Guidelines for Positioning to Incorporate the Anode Heel Effect
| Projection(s) | Placement of Anode | Placement of Cathode |
| AP and lateral forearm | Wrist | Elbow |
| AP and lateral humerus | Elbow | Shoulder |
| AP and lateral lower leg | Ankle | Knee |
| AP and lateral femur | Knee | Hip |
| AP thoracic vertebrae | Cephalic | Caudal |
| AP lumbar vertebrae | Cephalic | Caudal |
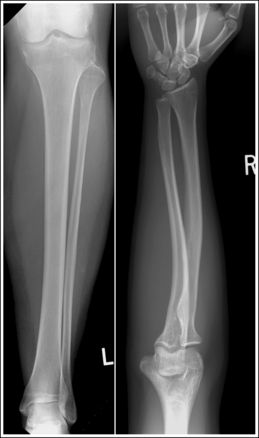
Figure 1-87 AP lower leg projection where anode heel effect was used properly (knee positioned at cathode end) and AP forearm projection where the anode heel effect was not used properly (wrist positioned at cathode end).
Most imaging rooms are designed so that the patient's head is positioned on the technologist's left side (when facing the imaging table), placing the anode end of the x-ray tube at the head end of the patient. The placement of the anode end of the tube may vary in reference to the patient as the tube is moved into the horizontal position. To identify the anode and cathode ends of the x-ray tube, locate the + and − symbols attached to the tube housing where the electrical supply enters. The + symbol is used to identify the anode end of the tube and the − symbol indicates the cathode end (Figure 1-88).
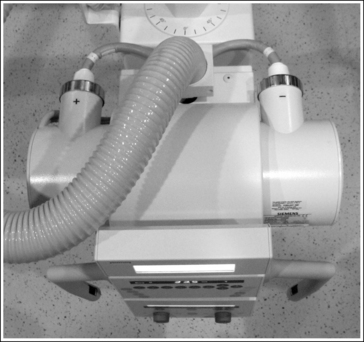
Radiographic Contrast
Radiographic contrast is a visibility of detail factor that describes the difference between adjacent densities on an image. For an anatomic structure to be visualized on an image as a separate and distinct entity, it must exhibit a contrasting shade of black, white, or gray compared with the structures surrounding it. Images that display just a few gray shades and appear mostly black and white are considered to have a short contrast scale and images with many shades of gray and fewer blacks and whites are considered to have a long contrast scale.
Subject contrast plays a significant role in the production of radiographic contrast and is the contrast caused by the atomic density, atomic number, and thickness composition differences of the patient's body parts and how differently each tissue composition will absorb x-ray photons (differential absorption). Box 1-6 describes the different appearances of tissues on images.
BOX 1-6 Subject Contrast Appearances on Images
• Patients who are in good physical shape, with strong muscles, low fat content, and dense bones, usually display the highest subject contrast (Figure 1-89).
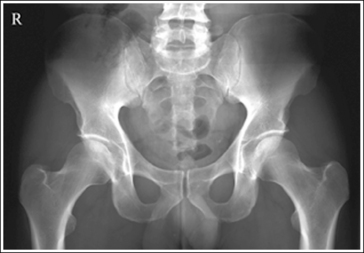
• Patients whose bodies have deteriorated because of disease or age and obese patients will ordinarily display less subject contrast because their muscles have lost strength and have become the consistency of fat. On an image of this patient, subject contrast will be low because the densities representing fat and muscle will be more alike (Figure 1-90).
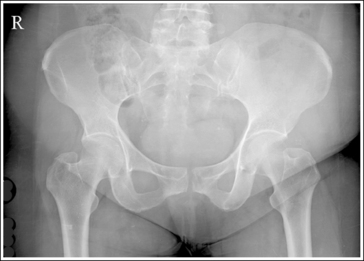
• Images of bony structures that have lost minerals and are less dense because of disease appear gray on images rather than white, blending in more with the surrounding structures and demonstrating reduced subject contrast (Figure 1-91).
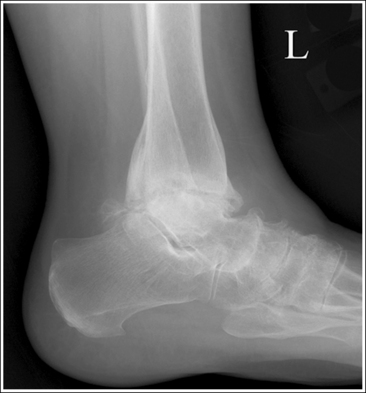
Figure 1-91 Lateral ankle projection demonstrating low subject contrast caused by a destructive disease.
• Patients who have retained fluid because of disease or injury display decreased subject contrast because the fluid surrounds the body tissues and causes their tissue densities to become more alike (Figure 1-92).
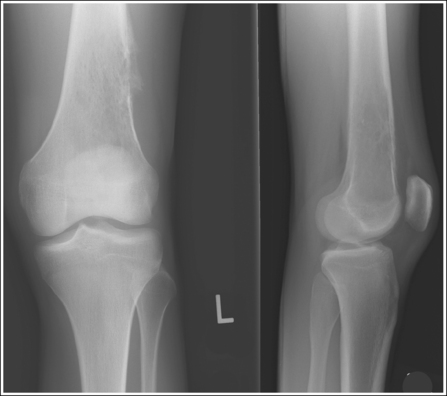
Figure 1-92 AP and lateral knee projections that demonstrate fluid around the knee joint that affects subject contrast.
• The bones of infants and children are less dense and more porous than adult bones, resulting in less image contrast being demonstrated between the bone and soft tissue in children's images than on adults' images (Figure 1-93).
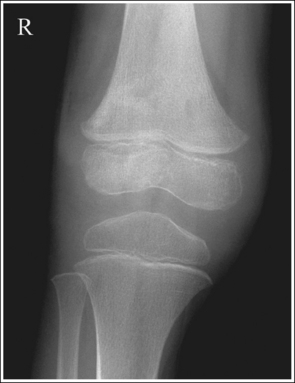
Controlling Factor (Kilovoltage)
The kVp is the factor that determines the energy of the x-ray photons produced and consequently the differential absorption that occurs in the patient's tissue as the photons traverse the body. High kVp produces high-energy photons that penetrate through body tissues, decreasing differential absorption and producing low-contrast (long-scale) images (Figure 1-94). Low kVp produces low-energy photons that are easily absorbed in the patient's tissues, increasing differential absorption and producing high-contrast (short-scale) images (Figure 1-95).
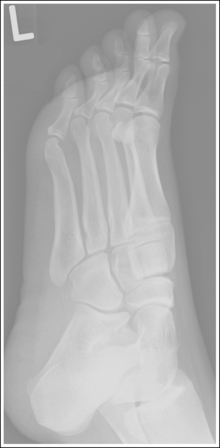
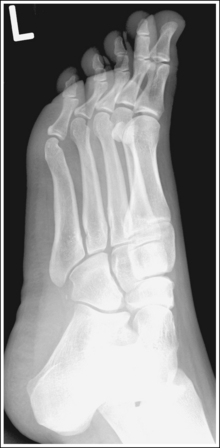
To obtain the desired level of radiographic contrast and gray scale, the technologist must evaluate the composition of the body part to be imaged and select a kVp level that will produce the appropriate differential absorption. Recommendations for the optimal kVp level to use for each body part can be found at the beginning of each procedural analysis chapter in this book. Optimal kVp is the kVp that will provide adequate body part penetration and sufficient image contrast.
Adjusting Contrast With kVp Using the 15% Rule
Even when optimum kVp levels are used, there are different situations and patient conditions that occur in which this kVp level does not provide the best penetration or contrast. In these cases the kVp must be adjusted from the routinely used optimal level (see Table 1-3). In situations in which the density on the image is adequate but the contrast level is not sufficient to visualize all the anatomic structures adequately, the contrast level can be adjusted by varying the kVp and the density can be maintained by counteracting the kVp adjustment with a comparable mAs adjustment.
• If higher contrast is desired, decrease the original kVp used by 15% and increase the mAs value used by 100%. For example, if the original settings were 80 kVp at 10 mAs, the new settings would be 68 kVp at 20 mAs.
• If lower contrast is desired, increase the original kVp used by 15% and decrease the mAs value used by 50%. For example, if the original technique was 80 kVp at 10 mAs, the new technique would be 92 kVp at 5 mAs.
In both these situations the image density has remained the same as in the original image, because the density adjustment made with kVp is offset by an equal mAs adjustment. The amount of kVp adjustment depends on how dramatic a contrast change is desired. As a general rule, you should stay relatively close to the optimal kVp level for the structure being imaged to prevent insufficient penetration or excessive image fogging.
Scatter Radiation
Radiographic contrast is also affected by the amount of scatter radiation that reaches the IR, which is determined by the kVp, field size, and patient thickness. Scatter radiation degrades the radiographic contrast by putting a blanket of density, also referred to as fog, over the image. The once individual and distinct gray shades of the image become blended with each other when fog is added to an image, resulting in a very gray low-contrast image. As the amount of scatter radiation reaching the IR increases, the greater is the decrease in radiographic contrast and decrease in detail visibility. Technologists can control the amount of scatter that reaches the IR and improve radiographic contrast by reducing the amount of tissue irradiated, decreasing the field size, and using a grid. The higher the grid ratio, the greater will be the scatter cleanup and the higher the radiographic contrast.
Flat contact shields made of lead can also be used to control the amount of scatter radiation that reaches the IR by eliminating scatter produced in the table from being scattered toward the area of interest. When the anatomic structures being examined demonstrate an excessive amount of scatter fogging along the outside of the collimated borders (e.g., the lateral lumbar vertebrae), place a large, flat contact shield or the straight edge of a lead apron along the appropriate border. This greatly improves the visibility of the recorded details. Compare the lateral lumbar vertebral projections in Figure 1-96 and Figure 1-97. Figure 1-96 was taken with a lead contact shield placed against the posterior edge of the collimator's light field, but a contact shield was not used for Figure 1-97. Note the improvement in visualization of the lumbar spinous processes using a contact shield.
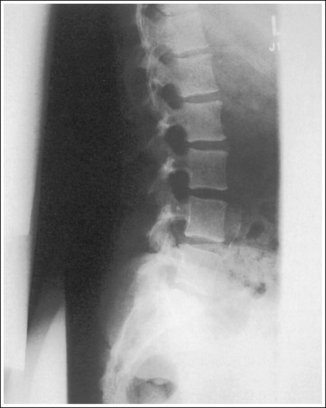
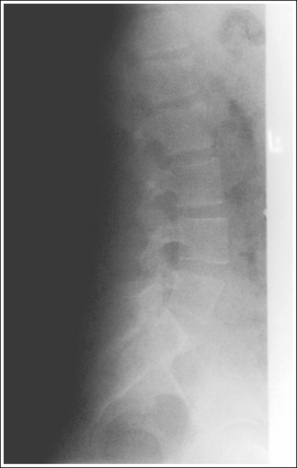
Artifacts
An artifact is any undesirable structure or substance recorded on an image. They may be grouped into several categories: (1) anatomic structures that obscure the area of interest or have no purpose for being there and can be removed from the image; (2) externally removable objects, such as patient or hospital possessions; (3) internal objects, such as prostheses or monitoring lines; and (4) appearances that result from improper use of equipment.
Before an image is taken, it may be wise to have the patient change into a hospital gown and to ask whether any patient belongings are in or around the area being imaged. Patients are often nervous and may forget to remove articles of clothing or, for sentimental reasons they may not remove jewelry, so you should recheck the area of interest, even after the patient has changed into a gown. Once the patient is positioned and the IR is ready to be exposed, take a last look to make sure that all hospital possessions that can be moved out of the imaging field have been moved. Check that those items that must remain in the field, such as heart monitoring leads, have been shifted so that they will superimpose the least amount of information.
It would be impossible to delineate in this book all the possible artifacts that can appear on an image, but it is important for technologists to familiarize themselves with as many artifacts as possible. It might be wise for your department to keep a folder of images that had to be repeated because of artifacts. These can be studied occasionally to help keep all technologists updated on the possibilities for facility-related artifacts.
Most possession-related artifacts are demonstrated on the image as lighter densities than the anatomic structures that surround them. Artifacts that are related to poor film or phosphor plate handling, such as film creases, static, and light leaks, most often exhibit greater density. The following discussion concerns different categories of image artifacts and common examples of each.
Anatomic Artifacts
An anatomic artifact is any anatomic structure that is within the image that could have been removed. These include those that are superimposed over an area of interest, as well as those that are not superimposed over an area of interest but are still located within the collimated field and could easily have been excluded. A common anatomic artifact is the patient's own hand or arm. Figure 1-98 shows an AP abdomen projection obtained in the supine position in which the patient's hands are superimposed over the upper abdominal region. More than likely the patient was not positioned in this manner when the technologist left the room. After the technologist positioned the patient and before the exposure was taken, however, the patient found a more comfortable position. This example stresses the importance of explaining examinations to patients so that they understand how important it is for them to remain in the position in which the technologist placed them. This also shows the importance of rechecking each patient's position before the exposure is taken if much time has elapsed between positioning the patient and exposing the image. It is also not uncommon for a patient who is experiencing hip or lower back pain from lying on the imaging table to place a hand beneath an affected hip. This will result in superimposition of the hip and hand on the image. Remember, the patient does not know that repositioning because of discomfort is not acceptable. Figure 1-99 shows an AP chest projection produced with a mobile x-ray machine, which was taken with the patient's arms positioned tightly against the sides. Because humeri are not evaluated on a chest image, there is no reason for them to be included, and they could easily have been shifted out of the imaging field.
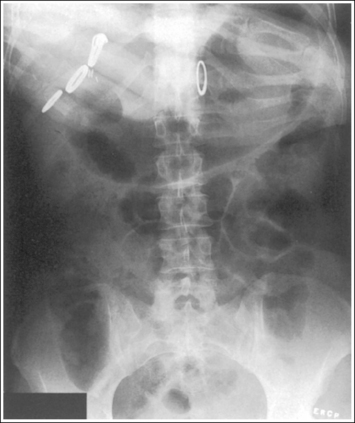
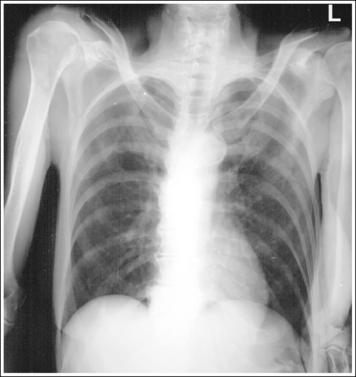
Double-Exposure Artifacts
A double-exposed image occurs when two exposures are taken on the same IR without processing having been done between them. The images exposed on the IR can be totally different and easy to identify, such as AP and lateral lumbar vertebrae projections (Figure 1-100), or they may be the same image, with almost identical overlap. Double-exposures of images of the same procedure typically appear blurry and can easily be mistaken for patient motion (Figure 1-101). When evaluating a blurry image, look at the cortical outlines of bony structures that are lying longitudinally and transversely:
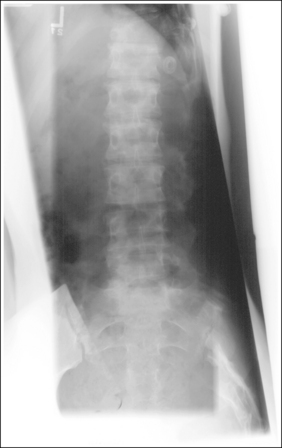
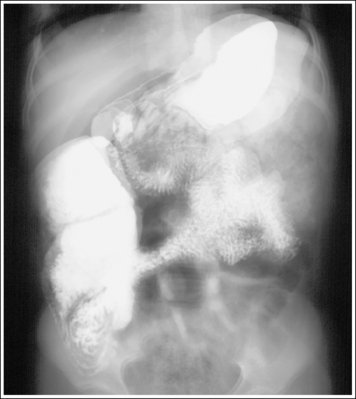
Figure 1-101 Screen-film double-exposure (two AP abdomen projections with barium in stomach and intestines).
• Is there only one cortical outline to represent each bony structure, or are there two?
• Is one outline lying slightly above or to the side of the other?
If one outline is demonstrated, the patient moved during the exposure, but if two are demonstrated, the image was exposed twice and the patient was in a slightly different position for the second exposure. Another indication of a double-exposed image in conventional radiography is its density (Figure 1-102). When the screen-film system is used, a double-exposed image will result in high image density because the film was exposed to radiation twice.
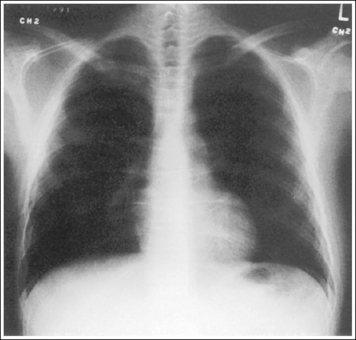
External Artifacts
An external artifact is found outside the patient's body, such as a patient's possession that remained in a pocket or a hospital possession (e.g., needle cap, ice bag) that was lying on top of or beneath the patient. Common external artifacts include earrings, rings, necklaces, bra hooks, dental structures, hairpins, heart monitoring lines, and gown snaps (Figure 1-103). Two external artifacts that are not as common but that do occasionally appear are caused by pillows (Figure 1-104) and by the imprinted designs on shirts and pants (Figure 1-105). Most of these artifacts can easily be avoided with proper patient preparation and positioning. Being aware of as many objects as possible that can create artifacts on the image is the best way of preventing them.
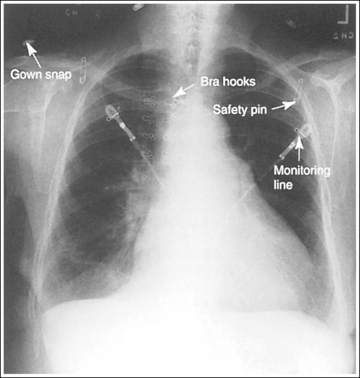
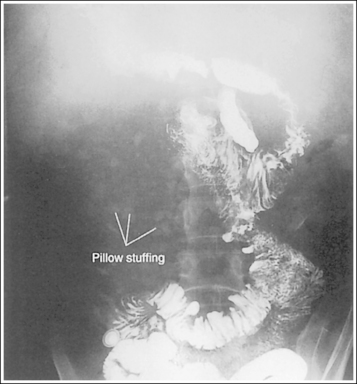
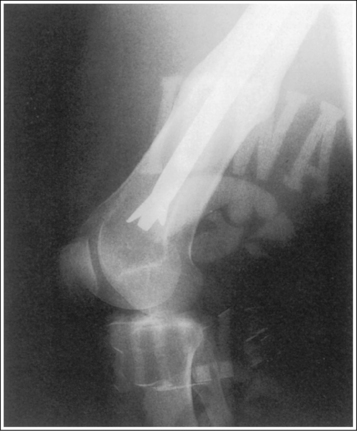
Internal Artifacts
Internal artifacts are found within the patient. They cannot be removed and must be accepted. Examples of commonly seen internal artifacts are the prosthesis (Figures 1-105 and 1-106), pacemaker (Figure 3-16), central venous catheter (Figures 3-12 and 3-13), pleural drainage tube (Figures 1-107 and 3-11), and endotracheal tube (Figure 3-9).
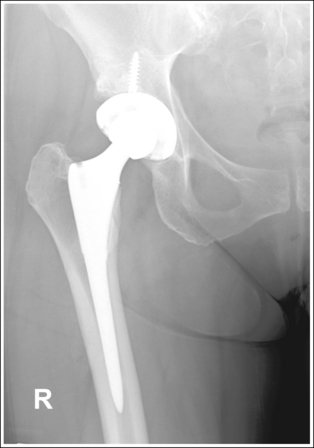
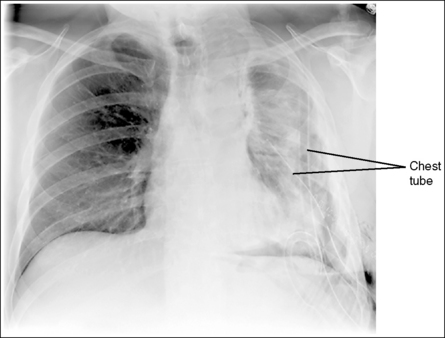
If an artifact that is normally not found within the body is identified on an image, it is the technologist's duty to discretely search and interview the patient or to consult the ordering physician to determine whether the artifact can be located outside the patient's body. If it is not found, it may have been introduced into the patient through one of the body orifices. Your search and interview discoveries should be recorded on the patient's requisition. Figure 1-108 shows a pelvic image of a patient who had swallowed several batteries.
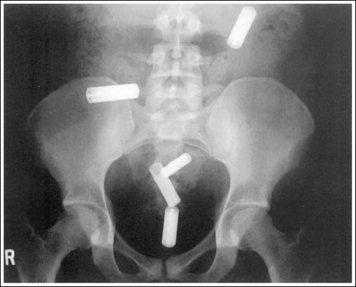
Equipment-Related Artifacts
Equipment-related artifacts are caused by improper use of the imaging equipment.
Grid Alignment Artifacts
Grid alignment artifacts are grid lines that result from the use of stationary grids and the improper use of all grid types. They occur because the grid's lead strips absorb primary radiation and are visible as small white lines on the image. Grid line artifacts caused by improper grid alignment are more noticeable with higher ratio grids and can be avoided by choosing a moving grid whenever possible and by properly aligning the central ray and grid.
Causes of grid cut-off include the following:
• If a parallel grid was tilted (off level) or the central ray was angled toward the grid's lead strips, the image demonstrates grid lines on the side toward which the central ray was angled (Figures 1-109, A, and 1-110).
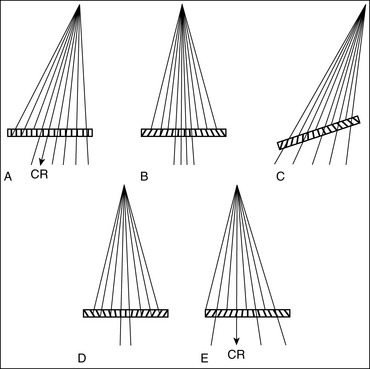
Figure 1-109 Causes of grid cutoff. A, Central ray angled against grid's lead lines. B, Off focus. C, Off level. D, Inverted. E, Off center.
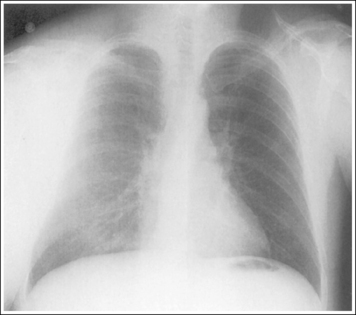
Figure 1-110 AP chest projection showing an equipment-related artifact. Parallel grid was tilted or the central ray was angled toward the grid's lead strips.
• If a parallel or focused grid was off focus (taken at an SID outside focusing range), the image demonstrates grid lines on each side of the image (Figure 1-111; see Figure 1-109, B).
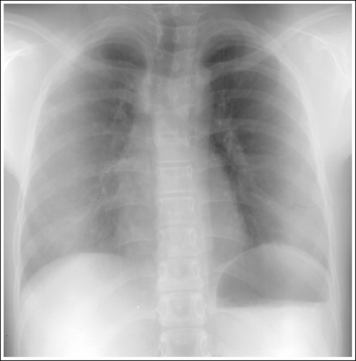
• If a focused grid was tilted (off level) or the central ray was angled toward the grid's lead strips, the image demonstrates grid lines across the entire image (Figure 1-112; see Figure 1-109, C).
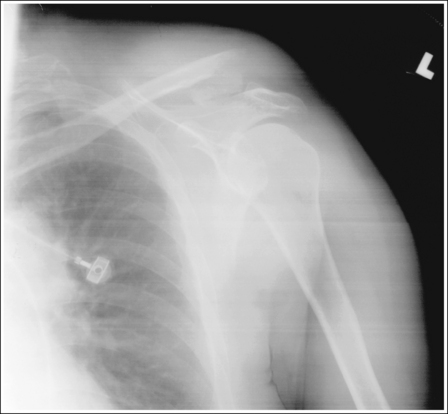
Figure 1-112 AP shoulder projection showing an equipment-related artifact. Focused grid was tilted or the central ray was angled toward the grid's lead strips.
• If a focused grid was upside down, the image demonstrates grid lines on each side of the image (Figure 1-113; see Figure 1-109, D).
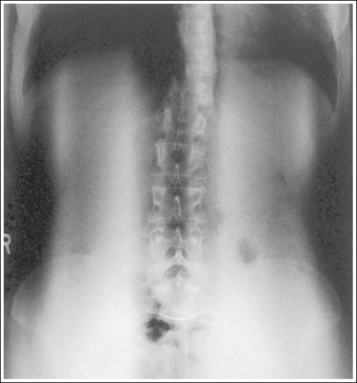
Figure 1-113 AP abdomen projection showing an equipment-related artifact. Focused grid was inverted.
• If a focused grid was off center (central ray not centered on the center of the grid), the image demonstrates grid lines across the entire image (Figure 1-114; see Figure 1-109, E). If the image was taken with the table Bucky, the image will not be in the center of the IR but will be demonstrated to one side.
When conventional screen-film radiography is used, an image taken with a grid alignment artifact demonstrates a loss in density where the grid lines are shown. The degree of density loss will be greater on the side toward which the central ray is angled and will increase with increased severity of misalignment. Density loss will also be greater when higher grid ratios are used.
Film Handling and Processing Artifacts
Improper film handling and processing can cause artifacts such as film creases, static (Figure 1-115), fog, stains, scratches (Figure 1-116), and hesitation marks (Figure 1-117). They can be avoided by following a good quality control program for the darkroom, film storage, and processor.
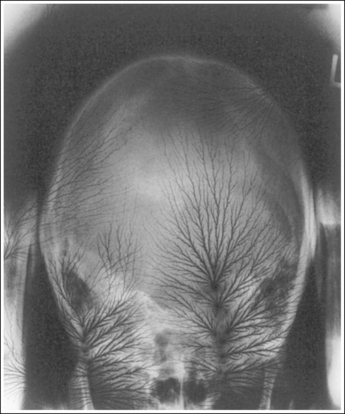
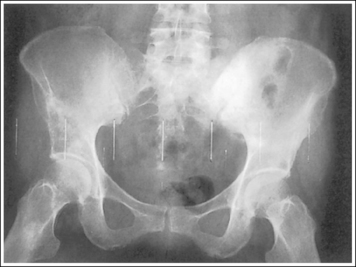
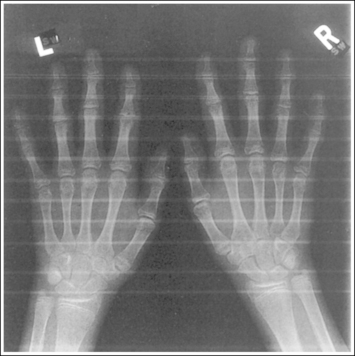
Locating and Repeating for Artifacts
Whenever an external or unidentifiable internal artifact is demonstrated on an image, discretely examine and interview the patient to determine the artifact's location. To pinpoint where to look for the artifact, study the image to locate a palpable anatomic structure situated close to the artifact. This is the area where the search should begin.
If an artifact that can be eliminated obscures any portion of the area of interest, the image needs to be repeated. A gown snap superimposed on an area of the lungs on a chest image can easily obscure a small lesion. A ring can easily obscure a hairline finger fracture.
If the artifact is located outside the field of interest, the image does not need to be repeated, although the patient should be discretely examined and interviewed to determine whether the artifact is located externally or internally.
Postprocedure Requirements
One of the last steps to take before deciding whether an image is acceptable is to make sure that you have taken all the images that are recommended by your facility for the body part being imaged. For example, many facilities require that AP and lateral projections are taken whenever images of the knee are requested. This series of images provides the reviewer with the needed information to accurately evaluate the patient's knee.
Not only should the entire series be taken, but you should also determine whether the indication for the examination has been fulfilled. If an elbow examination is ordered and the indication for the examination was to evaluate or rule out a radial head fracture, an additional external AP oblique or axiolateral (Coyle method) projection of the elbow may be needed to rule out this fracture definitively. Consult with the reviewer before allowing the patient to leave the imaging department.
Completing the Requisition Form
These are the sections of the requisition form that should be completed by the technologist: (1) the number and sizes of films that were used during conventional screen-film radiography; (2) the number of images obtained during digital imaging; (3) the mAs, kVp, and distance used; (4) the room number where the images were taken; (5) the technologist's name; (6) the date and time of the procedure; and (7) any additional patient history obtained from the patient-technologist interview (Figure 1-118).

Figure 1-118 The requisition form. The areas to be filled out by the technologist are shaded. (Courtesy of the University of Iowa Hospital and Clinics, Iowa City, Iowa.)
Recording the number and sizes of films or images obtained on the requisition form tells the reviewer how many images are to be evaluated. The name(s) of the technologist(s) involved in the examination is valuable information if a question arises about the image or patient or if the patient is found to have a contagious disease and measures need to be taken to protect the technologist(s). Recording the same date and time of the procedure on the requisition form as are shown on the image, as well as double-checking that the name of the patient is correct, provides a means of verifying that the requisition form goes with a certain set of images.
The patient's history should be completed by the ordering physician before the requisition form arrives in the imaging facility; any information that the technologist has learned from interviewing and observing the patient that might assist the reviewer in the diagnosis should be added, however. This area of the form may also be used to note any situation necessitating departure from the routine examination procedure. For example, if a hand image was taken with the patient's ring still on the finger because the ring could not be removed, the technologist should record this fact in the patient history or notes section of the requisition form so that the reviewer understands why the ring appears on the image.
Repeat-Reject Analysis
The facility's repeat or reject analysis card, an example of which is shown in Figure 1-119, should be filled out to indicate any positioning or technical errors that occurred during the procedure. This information provides your facility with a means of distinguishing areas in which patient service can be improved through in-service personnel training or equipment repair.
Defining Image Acceptability
When an image meets all the necessary requirements, it is considered an optimal image and it should not be repeated. When an image is not optimal but may be acceptable, the question arises as to whether it is poor enough to repeat or whether the information needed can be obtained without exposing the patient to further radiation. Factors that should be considered when making this decision include the following:
• The age and condition of the patient
• The conditions under which the patient was imaged
• Whether obvious pathology is evident
• Whether the indications for the examination have been fulfilled
Each facility has its own standards that will determine whether an image should be repeated. If standards are low, improving imaging skills can raise them, thereby increasing the accuracy of diagnosis. The age and condition of the patient, as well as the conditions under which the patient was imaged, are most important in the decision to repeat an image. Sometimes a less than optimal image must be accepted because repeating the image is impossible, as in a surgery case; at other times, the patient cannot or will not cooperate. Whenever an examination is accepted that does not meet optimal standards, record on the requisition form any information about the patient's condition or situation that resulted in acceptance of this examination. A less than optimal image may also be passed when the indication for the examination is clearly fulfilled by the images obtained. For example, a lower leg examination is taken without the required knee joint when the patient history states that the patient has had a distal fibular fracture and the indication for the examination is to evaluate the healing of the distal fibular fracture. In this case, it is obvious that the patient's knee is not being evaluated. As long as the distal fibula is included in its entirety on the original image, the image should not be repeated.
It is important that all unacceptable images and those less than optimal images that have been accepted are studied carefully to determine whether the situation(s) that caused them could be eliminated on future examinations. When an image is repeated, the overall radiation dose to the patient increases and the cost of patient care rises because reimaging requires more technologist time, supplies, and equipment use.
SPECIAL IMAGING SITUATIONS
The goal of mobile and trauma imaging is the same as that of routine imaging—to demonstrate accurate relationships among the anatomic structures for the projection imaged, without causing further patient injury and with minimal discomfort. The following are general guidelines for obtaining this goal.
1. Based on the requisition or request form, determine the projections that will be needed and the order in which they will be completed. First, obtain the projections that will provide information about the most life-threatening condition (cross-table lateral cervical vertebrae projection if a cervical fracture is questioned or when obtaining an AP chest projection for a patient having difficulty breathing). Speed is of the essence in many mobile and trauma situations, because the patient can be quite ill. Having a thought-out plan of action before starting allows the technologist to work in an organized and speedy manner. As a general rule, after the initial projections associated with life-threatening conditions have been exposed and checked by the radiologist or physician, the remaining projections are exposed in an order that will require the least amount of central ray adjustment. All AP projections are exposed, and then the central ray is moved horizontally for the lateral projections.
It is important that projections be obtained that are at 90-degree angles from each other (AP-PA and lateral) when fractures and foreign bodies are suspected to determine the degree of bone displacement (Figure 1-120) and depth location.
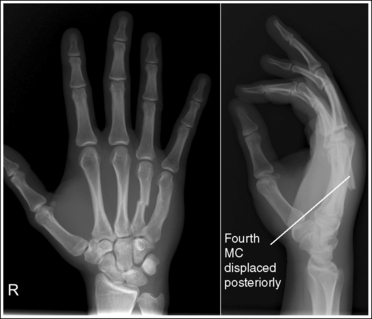
Figure 1-120 PA and lateral hand projections showing posterior displacement of the fourth metacarpal (MC) caused by a fracture.
2. Gather and organize the supplies (e.g., IRs, IR holders, positioning aides, disposable gloves, radiation protection supplies) that will be needed, and determine the starting technical factors (kVp, mAs, AEC) for the needed images. Cover the positioning aids and IRs to protect them from contamination.
3. Determine the degree of patient mobility, alertness, and ability to follow requests. Can the patient be placed in a seated position or be rotated to one side? Can the arm or leg fully extend or flex? When the patient is asked to breathe deeply, can he or she follow the request? Can the patient control movement?
4. Assess the site of interest for physical signs of injury (swelling, bruising, deformity, pain). Understanding the degree of injury will help the technologist prevent further injury during the positioning process.
5. Determine whether positioning devices (e.g., slings, backboards, and casts) and artifacts (e.g., heart leads, clothing, jewelry) may be removed and, if not, whether they will obscure the area of interest on the ordered projections. If positioning devices or artifacts will obscure the area, consult with the radiologist or ordering physician about possible alternatives (e.g., taking a slight oblique instead of a true projection).
6. Set an optimal kVp and mAs or AEC for the anatomic structure and projection being imaged. Technical adjustments may also be needed as a result of the increase in absorption that may occur because of the positioning device or artifact. Either increase (+) or decrease (–) the kVp or mAs from the routine amount for the patient thickness measurement, as indicated in Table 1-5.
TABLE 1-5
Technical Adjustments for Trauma Patients
| Immobilization Device or Patient Condition | kVp Adjustment | mAs Adjustment |
| Small to medium plaster cast | +5–7 kVp | +50%- 60% |
| Large plaster cast | +8–10 kVp | +100% |
| Fiberglass cast (Figure 1-121) | No adjustment | No adjustment |
| Inflated air splint | No adjustment | No adjustment |
| Wood backboard (Figure 1-122) | +5 kVp | +25%- 30% |
| Ascites (accumulation of fluid in abdomen or swelled joint) (Figure 1-92) | +50%- 75% | |
| Pleural effusion (fluid in pleural cavity) | +35% | |
| Pneumothorax (air or gas in pleural cavity) | -8% kVp | |
| Postmortem imaging of head, thorax, and abdomen (because of pooling of blood and fluid) | +35%-50% | |
| Soft tissue injury (used for foreign objects, such as slivers of wood, glass, or metal, embedded in the soft tissue and to demonstrate the upper airway) | -15% - 20% kVp |
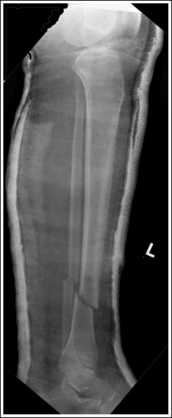
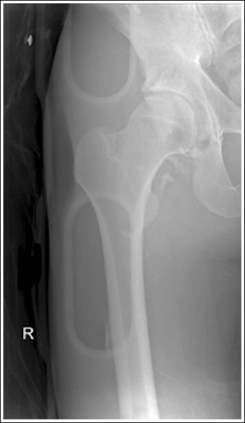
7. Obtain the requested images. The technologist should use the routine positioning guidelines such as for patient positioning, central ray centering, IR size, and collimation when obtaining mobile and trauma projections. For patients who are unable to follow the routine positioning requirements, adaptations to this setup can be made. Never force the patient into a position. Instead, adjust the central ray and IR. As long as the central ray, part, and IR form the same alignments, identical projections will result. The word part with regard to alignment refers to the specific plane, imaginary line, or anatomic structure used to position the patient with the central ray and IR in routine positioning.
GUIDELINES FOR ALIGNING CENTRAL RAY, PART, AND IMAGE RECEPTOR
• Whenever possible, set up the routinely used central ray, part, and IR alignments for the projection imaged.
Lateral Projections
Routine lateral foot projections require that the foot's lateral surface be aligned parallel to the IR and the central ray be aligned perpendicular to the part and the IR. In this situation the lateral foot surface is the part, because this is what is used to position the foot in relation to the central ray and IR. If the lateral foot projection is taken on the imaging table, the patient will externally rotate his or her leg until the lateral foot surface is parallel to the IR, and the central ray will be aligned perpendicular to the IR and part (Figure 1-123).
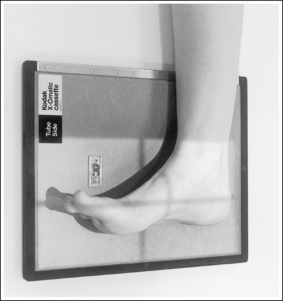
If the lateral foot projection is taken in a standing position, the IR will be positioned vertically and the central ray horizontally. Even though the setup appears different, the central ray, part, and IR alignments are the same as in the previous setup. The lateral foot surface is positioned parallel to the IR, and the central ray is perpendicular to the IR and lateral foot surface. Often, when a cross-table image is created, the projection taken is opposite. For a routine tabletop lateral foot projection, a mediolateral projection is performed, whereas a lateromedial projection is used for cross-table images. To obtain identical images for both pathways, the technologist must maintain the same central ray, part, and IR alignment. This means that the lateral surface of the foot must still be positioned parallel to the IR for a lateromedial projection, even if this surface is not placed directly adjacent to the IR. For a lateral foot projection, this will require the medial aspect of the heel to be positioned slightly away from the IR (Figure 1-124).
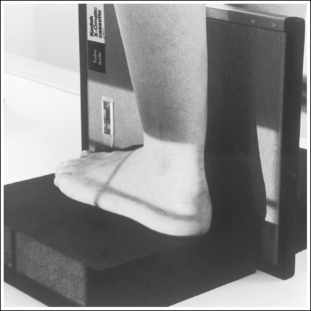
If a patient arrives in the radiology department in a wheelchair and is unable to move to the imaging table for the lateral foot projection easily, the projection can be obtained with the patient remaining in the wheelchair. First, align the lateral foot surface with the IR and then align the central ray perpendicular to the IR and lateral foot surface. Again, because the relationships among the central ray, IR, and part are the same as in the two previous setups, the resulting image will be identical (Figure 1-125).
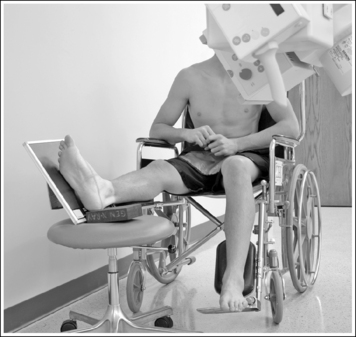
Oblique Projections
For trauma oblique images, begin by aligning the central ray with the plane, line, or anatomic structure that is used for an AP projection of the part being imaged. Next, adjust the central ray in the direction needed to set up the correct alignment between the central ray and structure. Because the degree of angulation in which patients are rotated for oblique projections is always referenced from the AP-PA projection, the amount of angle adjustment would be the same as the required degree of obliquity. For a routine internal AP oblique elbow projection, the central ray is aligned at a 45-degree angle with an imaginary line connecting the humeral epicondyles (the medial epicondyle is placed farther from the tube than the lateral). To obtain the same image in a patient who is unable to rotate his or her arm, the technologist first positions the central ray perpendicular to the line connecting the epicondyles and then adjusts the angle 45 degrees medially, positioning the medial epicondyle farther from the x-ray tube than the lateral epicondyle. The IR would then be angled so that it is perpendicular to the central ray (Figure 1-126).
• To obtain open joint spaces, clearly see fracture lines, or obtain specific anatomic relationships, the alignment of the central ray with the part must be accurate. This is more important than the alignment of the central ray or part with the IR.
When an open joint space or a particular anatomic relationship is required, it is the central ray alignment with the part that accomplishes the required results. Although IR alignment with the central ray and part is important to prevent distortion, it does not have an effect on the anatomic relationships that are demonstrated. After the central ray and part are accurately aligned, the IR should be positioned as close to perpendicular to the central ray as possible. If the central ray is not positioned perpendicular to the IR, the resulting image will demonstrate elongation in the direction toward which the central ray was angled, but the anatomic alignment of the structures should be demonstrated as required for the projection. The more acute the central ray and IR angle, the greater will be the elongation. In this situation, the IR will need to be offset from side to side or cephalocaudally in the direction toward which the central ray is angled more than what would occur if the IR were positioned perpendicular to the CR. Because of this offset, careful attention should be given to centering the central ray to the center of the IR.
• When imaging long bones the IR should be positioned as close to parallel with it as possible. If the bone and IR are not parallel, the law of isometry should be used to minimize shape distortion.
The law of isometry indicates that the central ray should be set at half of the angle formed between the object and IR to minimize shape distortion. If the patient's knee cannot be fully extended for an AP femur projection, causing the femur to be at a 30-degree angle with the IR, the central ray should be angled 15 degrees. The direction of the angle should be such that it brings the central ray closer to perpendicular with the IR (Figure 1-127).
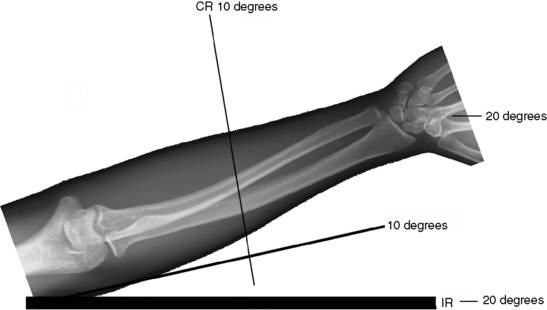
Figure 1-127 Using the law of isometry to image long bones. (Modified from Holt MH. Minimizing distortion with geometry, Radiol Technol 78:436–436, 2007.)
• When imaging long bones that require both joints to be included on the same image, but the joints cannot be positioned in the true projection simultaneously because of a fracture, the joint closest to the fracture should be positioned in the true projection (Figure 1-128).
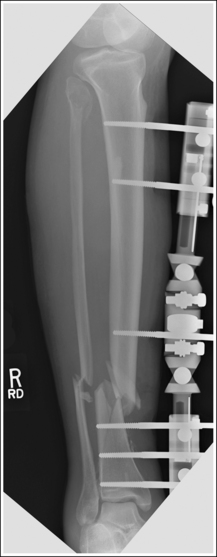
8. Use the smallest possible OID and increase the SID to compensate if a longer than routine OID is needed.
9. Use a grid if the patient part thickness is over 4 inches (10 cm) and over 60 kVp is used. When positioning latitude is narrow because of the patient's condition or when the mobile unit is used, choose a linear low-ratio grid to allow for the greatest positioning error latitude. Evaluate the alignment of the central ray and grid:
• Is the central ray aligned accurately with the center of the grid?
• If a central ray angle is used, is it angled with the grid lines?
10. Use good radiation protection practices. Ask female patients if there is any chance they could be pregnant. Never assume that other staff members have asked. Use gonadal shielding whenever possible, collimate tightly, and provide those assisting with patient holding during the exposure with aprons and lead gloves. Images of the extremity should not be taken by placing the IR and part on the patient's torso unless it is the only means of obtaining accurate positioning. If this is the case, always place a lead apron between the IR and torso. Not all the radiation directed toward the IR is absorbed; high-energy beams will exit through the back of the IR, exposing structures beneath.
11. Never leave a confused patient or a trauma patient unattended in the imaging room.
12. Process the images and evaluate them for positioning and technical accuracy. Determine whether repeat images are needed and how much adjustment will be required. When the trauma is severe, all the evaluating criteria listed in the procedural sections of this textbook may not be evident. This is one of the reasons why I have often described more than one anatomic relationship to indicate accurate positioning in the evaluating criteria. For example, on the lateral ankle image in Figure 1-129, the tibial-fibular relationship cannot be used to determine accuracy of the positioning, but the domes of the talus are well visualized and indicate that the ankle was well positioned.
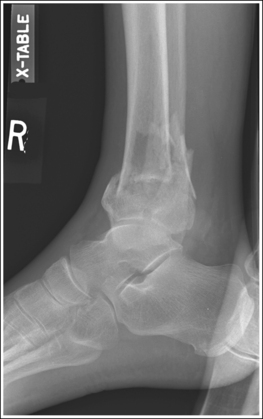
13. Repeat any necessary images.
14. Return the patient to the emergency room or, if the images were taken with the mobile unit, replace the bed, monitoring devices, and personal items to the positions they occupied when you entered the room or to positions that make the patient most comfortable.
15. Disinfect all equipment, IRs, and positioning devices used during the procedures.
Pediatric Imaging
The images of pediatric patients are very different from those of adults and from each other during the various stages of bone growth and development (Figure 1-130). Bones throughout the body enlarge through the deposits of bone at cartilaginous growth regions, and long bones lengthen by the addition of bone material at the epiphyseal plate. Cartilaginous spaces and epiphyseal plates exist throughout the skeletal structure. They appear as dark spaces and lines on images and may look similar to an irregular fracture or joint space to those unfamiliar with pediatric imaging. The appearances of these spaces and lines are reduced as the child develops, until early adulthood, when they are replaced by bone and no longer are visible on the image. Round bones, such as the carpal and tarsal bones, are rarely formed at birth and therefore are not demonstrated on images of neonatal and very young pediatric patients. Because of this continual state of development, some anatomic relationships described in the imaging analysis sections may not be useful for determining accurate positioning for the pediatric patient. It is beyond our scope here to explain all the differences that could be demonstrated at different growth stages for each projection included in this text. When evaluating pediatric images for proper anatomic alignment, use only the analysis criteria that describe bony structures that are developed enough to use. For example, the section on PA wrist projection analysis describes the alignment of the carpal bones and metacarpals to determine accurate positioning. The carpal bone alignment cannot be used to evaluate young pediatric wrists, because all the carpal bones are not formed, but the metacarpals can be used to determine the accuracy.
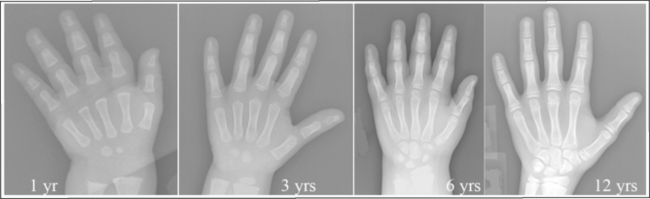
Technical Considerations
Pediatric imaging requires lower technical values (kVp and mAs) when compared with those for adults. Box 1-7 lists guidelines to follow when selecting technical values for pediatrics patients.
Clothing Artifacts
Because lower kVp is used in pediatrics, clothing artifacts may be problematic in neonates and smaller children (Figure 1-131). The kVp used may not be high enough to burn out creases or folds, particularly in unlaundered material or flame-resistant clothing. It is best to image children without upper clothing or with a tee shirt when modesty is an issue. Skinfolds of neonates may also cause artifacts when they overlie the chest.
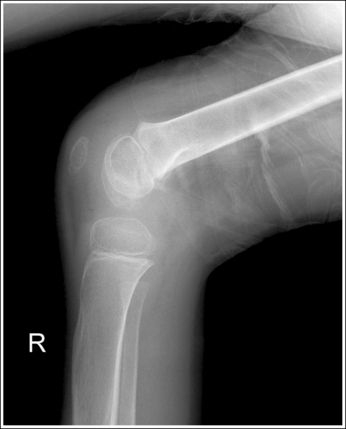
Obese Patients
According to the U.S. Centers for Disease Control and Prevention (CDC), approximately 64% of Americans are overweight. This has a direct impact on the health care system and imaging departments because these individuals have an increased incidence of diabetes, heart disease, and certain types of cancer and there is increasing popularity of bariatric surgery to help manage this condition. The challenges facing technologists as they image obese patients include transporting and accommodating larger patients on the current equipment, and difficulties in acquiring quality images.4 The following are considerations for imaging this population.
1. Obese patients often feel unwelcome in medical settings, where they encounter negative attitudes, discriminatory behavior, and a challenging physical environment. The emotional needs of these patients must be considered when they are imaged. Avoid making remarks about their size, being mindful of terms used such as “big” when referring to special equipment needs or requests for “lots of help” when transferring the patient.
2. Patient weight and body diameter are factors that should be evaluated before transporting the patient to the department or performing the examination. Use this information to determine whether the patient's weight exceeds any of the equipment weight limits, including waiting room chairs or support structures, or his or her diameter exceeds the wheelchair or cart dimensions.
3. Avoid injury to the patient and personnel by making certain that enough people are available to assist if the patient requires moving before or during the procedure. Use moving devices, such as table sliders and lifts, whenever possible.
4. Determine how the positioning procedure (IR size, CW-LW position of IR) will need to be adjusted from the routine to accommodate the increased structure size. For example, to include the entire abdomen on a morbidly obese patient may require a separate IR for each of the four abdominal quadrants, instead of one for the top and bottom.
5. Obese patients have inherently low subject contrast because their muscles have lost strength and have become the consistency of fat, so technical values must be set to enhance subject contrast while producing the lowest possible patient dose to produce an image with sufficient image contrast.
Technical Considerations
Thicker patients attenuate more of the primary x-ray photons than thin patients, requiring the technologist to increase mAs and/or kVp to compensate for the density loss that would result if a change were not made. Thicker patients also demonstrate a higher scatter–to–primary photon ratio (SPR) reaching the IR, causing a loss in image contrast. For example, a typical abdominal image taken on a patient measuring 20 cm will demonstrate a SPR of 3:1, meaning that 75% of the photons striking the IR are scattered photons that carry little or no useful information. For larger patients, the ratio in the abdomen can approach 5:1 or 6:1 (83% to 86%).
When determining how to adjust the technique for a thicker patient, the technologist must consider the effect that the change will have on patient dose and image contrast. As long as the kVp is set to allow penetration through the part, increasing the mAs will generate enough x-rays to provide more photons. As a general rule, for every 4 cm of added tissue thickness, the mAs should be doubled to maintain density. This technique adjustment will have a significant increase on patient dose because the increase in dose is directly proportional to the mAs increase. It will also demonstrate lower image contrast because the SPR will increase with increased thickness.
Another technique adjustment option is to increase the kVp. This will increase the penetration ability of the photons, resulting in more of them reaching the IR. As a general rule, for every centimeter of added tissue thickness, the kVp should be adjusted by 2 kV. With this option, the patient dosage will increase, but not directly, as with mAs, so the amount of dosage increase is significantly less. Image contrast will be also lowered, because an increase in kVp decreases subject contrast and causes scatter radiation to be directed at a forward angle toward the IR, which is difficult for the grid to remove.
For best results when adjusting technique for a thick patient, the kVp should be set as high as possible (to reduce radiation dose), but should not exceed a kVp value that will provide sufficient subject contrast. After the kVp value maximum has been attained, additional adjustments should be made with mAs.
Scatter Radiation Control
One of the biggest obstacles when imaging the obese patient is controlling scatter radiation enough to provide an image that has sufficient image contrast. This is accomplished by using very aggressive, tight collimation, using a high-ratio grid, or using an air-gap technique.
1. Tight collimation is often difficult when imaging obese patients because the collimator's light field demonstrated on the patient does not represent the true width and length of the field set on the collimator. The thicker the part being imaged, the smaller the collimator's light field that appears on the patient's skin surface. On a very thick patient, it is difficult to collimate the needed amount when the light field appears so small but, on these patients, tight collimation demonstrates the largest improvement in the visibility of recorded details. Learn to use the collimator guide (see Figure 1-20) to determine the actual IR coverage.
2. Many projections, such as the inferosuperior (axial) shoulder projection, which do not require a grid on the typical patient, will need to be performed using a grid. Measure all structures and use a grid when the part thickness is more than 10 cm.
Focal Spot Size
When using a small focal spot, the milliamperage is typically limited to 300 mA or less. Using such a small focal spot may not be feasible when imaging an obese patient because it would require a long exposure time to achieve the needed radiographic density and motion may result.
Automatic Exposure Control
Select a high mA to avoid long exposure times and the potential motion it causes. Also, adjust the backup timer to 150% to 200% of the expected manual exposure time.
1. When possible, remove overlapping soft tissue from the area being imaged to decrease the thickness of the tissue being penetrated. Figure 1-132 demonstrates an AP pelvis projection in which the soft tissue overlapping the hips could have been pulled superiorly and held with tape or by the patient, decreasing the soft tissue over the hips and allowing them to be demonstrated more effectively. Overlapping breast and arm tissue can also be held away from the shoulder during inferosuperior (axial) shoulder projections to decrease thickness and improve detail visibility.
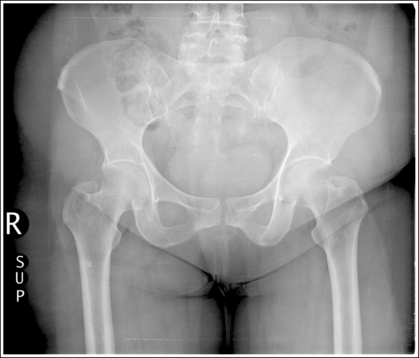
Figure 1-132 AP pelvis projection showing overlapping soft tissue, preventing uniform density of hip joints and proximal femurs.
2. Use palpable bony structures to position the patient and to collimate whenever possible. Remember, the skeletal structure does not increase in size with an increase in the soft tissue surrounding it. Figure 1-133 shows a bone scan on an obese patient that clearly illustrates this point. Using palpable bony structures to determine where structures are located whenever possible will help you to position accurately and collimate more specifically to the structures of interest.
When the soft tissue thickness prevents palpation of bony structures, use signs such as depressions or dimples in the soft tissue that suggest where the bony structures are located. Observe closely how the patient is positioned for each image so if a repeat is needed, you can adjust the amount needed from the original positioning.
REFERENCES
1. Church, E.J. Legal trends in imaging. Radiol Technol. 2004;76:31–45.
2. Hobbs, D.L. Chest radiography for radiologic technologists. Radiol Technol. 2007;78:494–516.
3. Statkiewicz Sherer, M.A., Visconti, P.J., Ritenour, E.R. Radiation protection in medical radiography, ed 5. St. Louis: Mosby Elsevier, 2006.
4. Upport, R.N., Sahani, D.V., Hahn, P.F., et al. Impact of obesity on medical imaging and image-guided intervention. AJR Am J Roentgenol. 2007;188:433–440.
5. Welling, R.D., Jacobson, J.A., Jamadar, D.A., et al. MDCT and radiography of wrist fractures: Radiographic sensitivity and fracture patterns. AJR Am J Roentgenol. 2008;190:10–16.
Bushberg, J.T., Seibert, J.A., Leidholdt, E.M., Boone, J.M. The essential physics of medical imaging, ed 2. Philadelphia: Lippincott Williams & Wilkins, 2002.
Bushong, S.C. Radiologic science for technologists, ed 9. St. Louis: Mosby Elsevier, 2008.
Holt, M.H. Minimizing distortion with geometry. Radiol Technol. 78(5), 2007. May/June