Lower Extremity
Toe(s): Anteroposterior Axial Projection,
Toe(s): Anteroposterior Oblique Projection,
Toe(s): Lateral Projection (Mediolateral and Lateromedial),
Foot: Anteroposterior Axial Projection (Dorsoplantar),
Foot: Anteroposterior Oblique Projection (Medial Rotation),
Foot: Lateral Projection (Mediolateral and Lateromedial),
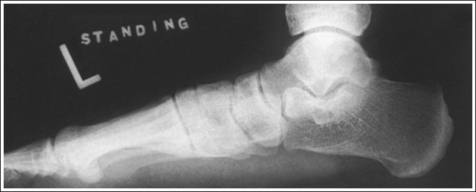
Weight-Bearing Lateromedial Projection,
Calcaneus: Axial Projection (Plantodorsal),
Calcaneus: Lateral Projection (Mediolateral),
Ankle: Anteroposterior Projection,
Ankle: Anteroposterior Oblique Projection (Medial Rotation),
Ankle: Lateral Projection (Mediolateral),
Lower Leg: Anteroposterior Projection,
Lower Leg: Lateral Projection (Mediolateral),
Knee: Anteroposterior Projection,
Knee: Anteroposterior Oblique Projection (Medial and Lateral Rotation),
Knee: Medially (Internally) Rotated Anteroposterior Oblique Position,
Laterally (Externally) Rotated Anteroposterior Oblique Projection,
Knee: Lateral Projection (Mediolateral),
Intercondylar Fossa: Posteroanterior Axial Projection (Holmblad Method),
Intercondylar Fossa: Anteroposterior Axial Projection (Béclère Method),
Patella and Patellofemoral Joint: Tangential Projection (Merchant Method),
After completion of this chapter, you should be able to do the following:
• Identify the required anatomy on lower extremity images.
• Describe how to properly position the patient, image receptor (IR), and central ray for lower extremity images.
• State how to properly mark and display lower extremity images.
• List the image analysis criteria used to determine the accuracy of lower extremity images and state how to improve images when the criteria are not met.
• List the image requirements for accurate positioning for lower extremity images.
• Discuss how the degree of central ray angulation is adjusted for an AP axial foot projection and how the degree of obliquity is adjusted for an AP oblique foot projection in patients with high and low longitudinal arches.
• Describe how the central ray angulation is adjusted when a patient is unable to dorsiflex the foot for an axial calcaneal projection.
• Describe what effect the anode heel effect has on lower leg and femoral images and how the leg should be positioned to take advantage of it.
• Explain how the central ray angulation used for AP and AP oblique knee projections is determined by the thickness of the patient's upper thigh and buttocks, and discuss why this adjustment is required.
• State how to determine what central ray angulation to use for an AP knee projection in a patient who cannot fully extend the knee.
• State which anatomic structures are placed in profile on AP oblique knee projections with accurate positioning.
• List the soft tissue structures of interest found on lower extremity images. State where they are located and why their visualization is important.
• State how the patient's knee is positioned for a lateral knee projection if a patella fracture is suspected.
• State the relationship of the medial and lateral femoral condyles, and describe the degree of femoral inclination demonstrated in a patient in an erect and recumbent lateral projection.
• State the femoral length and pelvic width that demonstrate the least amount of femoral inclination.
• Describe how patellar subluxation is demonstrated on a tangential knee projection.
• State the importance of securing the legs and instructing the patient to relax the quadriceps femoris muscles for a tangential knee projection.
• Explain how the positioning setup for a tangential knee projection is adjusted for a patient with large posterior calves.
IMAGE ANALYSIS CRITERIA
The following image analysis criteria are used for all adult and pediatric lower extremity images and should be considered when completing the analysis for each lower extremity projection presented in this chapter (Box 6-1).
• Visibility of lower extremity details. An optimal kilovoltage peak (kVp) technique, as shown in Table 6-1, sufficiently penetrates the bony and soft tissue structures of the lower extremity and provides a contrast scale necessary to visualize the bony details. To obtain optimal density, set a manual milliampere-seconds (mAs) value based on the part thickness. If the patient's lower extremity thickness measures less than 4 inches (10 cm), a grid is not required. If the patient's lower extremity thickness measures more than 4 inches (10 cm), a grid should be used because this thickness would produce enough scatter radiation to negatively affect image contrast. When a grid is used, increase the kVp to approximately 70 to penetrate the structure and to provide an adequate scale of contrast. Increase the exposure (mAs) by the standard density conversion factor for the grid ratio being used to compensate for the scatter and the primary radiation that the grid will absorb.
TOE(s): ANTEROPOSTERIOR AXIAL PROJECTION
See Figures 6-1, 6-2, and 6-3 and Box 6-2.
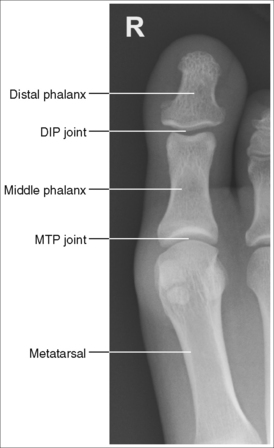
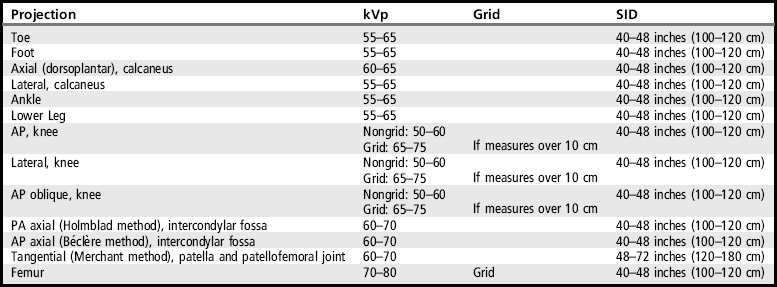
FIGURE 6-1 First AP axial toe projection with accurate positioning. DIP, Distal interphalangeal; MTP, metatarsophalangeal.
The digit demonstrates no rotation. Soft tissue width and midshaft concavity are equal on both sides of the phalanges.
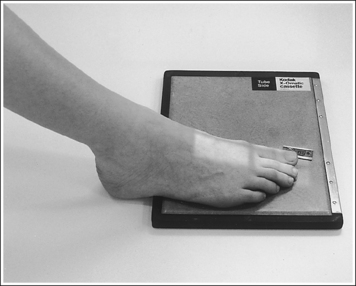
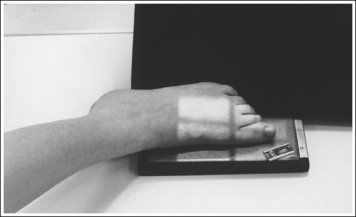
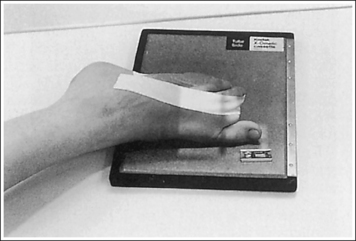
• An AP axial projection of the toe is obtained by flexing the supine patient's knee until the plantar foot surface rests flat against the image receptor (IR). The lower leg, ankle, and foot should remain aligned, and equal pressure should be applied across the plantar surface (Figure 6-4).
• Detecting toe rotation. Toe rotation is controlled by the position of the foot. Take a few minutes to study a toe skeleton and note that in an AP projection, concavity of the midshaft of the proximal phalanx is equal on both sides. Also, note that the posterior (plantar) surface of the proximal phalanx demonstrates more concavity than the anterior (dorsal) surface. As the skeleton is rotated medially or laterally, the amount of concavity increases on the side toward which the posterior surface is rotated, whereas the side toward which the anterior surface is rotated demonstrates less concavity. The same observations can be made about the soft tissue that surrounds the phalanges. More soft tissue thickness is present on the posterior surface than the anterior surface, so the side demonstrating the greatest soft tissue width on an image will be the side toward which the posterior surface is rotated. Look for this midshaft concavity and soft tissue width variation to indicate rotation on an AP axial toe projection. With lateral toe rotation, phalangeal soft tissue width and midshaft concavity are greater on the side positioned away from the lateral foot surface (see Image 1). With medial toe rotation, phalangeal soft tissue width and midshaft concavity are greater on the side positioned away from the medial foot surface (see Image 2). If the patient's toenail is visualized, which is often the case with the first toe, it can also be used to determine the direction of toe rotation. The nail rotates in the same direction as the foot.
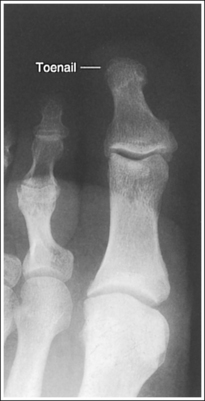
IMAGE 1
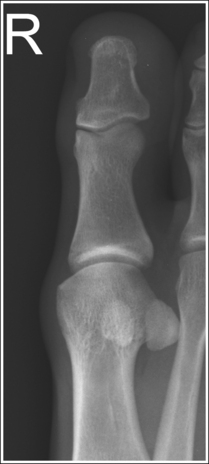
IMAGE 2
The interphalangeal (IP) and metatarsophalangeal (MTP) joints appear as open spaces, and the phalanges are demonstrated without foreshortening.
• The IP and MTP joint spaces are open and the phalanges are demonstrated without foreshortening when the toe(s) was fully extended and a 10- to 15-degree proximal (toward the calcaneus) central ray was centered to the MTP joint(s). The central ray angulation is required to align the central ray placement closer to parallel with the joint spaces and perpendicular to the phalanges, preventing closed joint spaces and foreshortened phalanges (see Image 3).
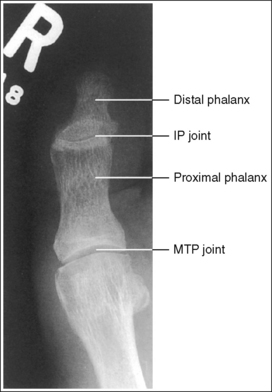
IMAGE 3
• Central ray angulation for nonextendable toes. For patients who have extremely flexed toes that will not extend, the toes and forefoot may be elevated on a radiolucent sponge to bring the phalanges parallel with the IR.
No soft tissue or bony overlap from adjacent digits is present.
• Spreading the toes slightly prevents soft tissue and bone from overlapping from adjacent toes. It is difficult to evaluate the soft tissue of an affected toe when it is superimposed by other soft tissue.
The MTP joint is at the center of the exposure field for an AP toe projection and the third MTP joint is at the center when all the toes are imaged. The phalanges and half of the metatarsal(s) are included within the collimated field.
• Centering the central ray to the MTP joint for a toe image or to the third MTP for images of the toes places the joint(s) in the center of the image.
• Open the longitudinal collimation to include the toe(s) and the distal half of the metatarsal(s). To include half of the metatarsal(s), extend the light field 2 inches (5 cm) proximal to the between-toe interconnecting tissue. Transverse collimation should be to within 0.5 inch (1.25 cm) of the toe or foot skin line.
• One third of an 8- × 10-inch (18- × 24-cm) detailed screen-film or computed radiography IR placed crosswise should be adequate to include all the required anatomic structures.
Anteroposterior Axial Toe Projection Analysis
The phalanges demonstrate greater soft tissue width and midshaft concavity on the medial surface. The toe was laterally rotated.
Analysis
The phalanges demonstrate greater soft tissue width and midshaft concavity on the lateral surface. The toe and foot were medially rotated.
TOE(s): ANTEROPOSTERIOR OBLIQUE PROJECTION
See Figures 6-5 and 6-6 and Box 6-3.
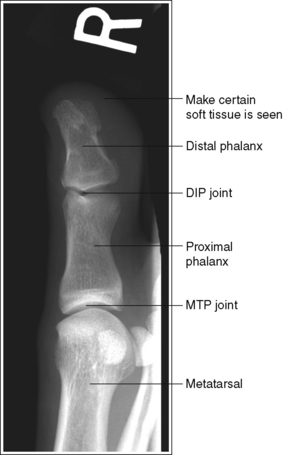
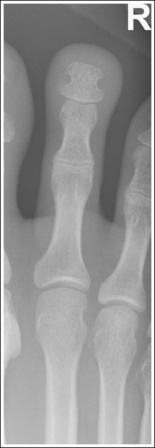
FIGURE 6-5 AP oblique toe projection with accurate positioning. DIP, Distal interphalangeal; MTP, metatarsophalangeal.

The digit(s) is rotated 45 degrees. Twice as much soft tissue width and more phalangeal and metatarsal concavity are present on the side of the digit rotated away from the IR.
• An AP oblique toe(s) projection is obtained by placing the affected foot on the IR and then rotating the foot until the affected toe is rotated 45 degrees from the AP projection (Figure 6-7). When the first through third toes are of interest, the foot should be rotated medially. When the fourth and fifth toes are of interest, the foot should be rotated laterally. The variation in rotation for the different toes is to obtain an AP oblique projection with the least amount of OID.
• Verifying toe rotation on AP oblique projections. To verify the accuracy of rotation on an AP oblique toe projection and to determine the proper way to reposition the patient when digit obliquity was insufficient or excessive, study the midshaft concavity of the proximal phalanx and compare the soft tissue width on both sides of the digit. An AP oblique toe projection taken at 45 degrees of obliquity demonstrates more phalangeal midshaft concavity and twice as much soft tissue width on the side positioned farther from the IR. When the midshaft concavity of the proximal phalanx and soft tissue width are closer to equal on both sides of the digit, the toe was not adequately rotated (see Image 4). When more than twice the width of soft tissue is present on one side of the digit than on the other and when the posterior aspect of the proximal phalanx's midshaft demonstrates more concavity than the anterior aspect, the toe was rotated more than 45 degrees for the image (see Image 5).
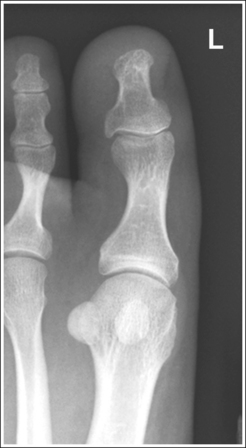
IMAGE 4
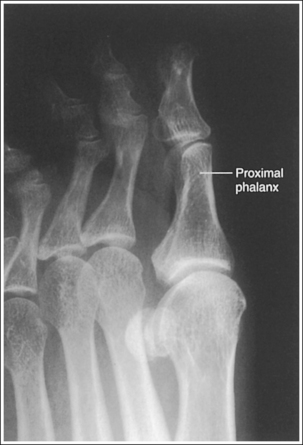
IMAGE 5
The IP and MTP joints are visible as open spaces, and the phalanges are demonstrated without foreshortening.
• The IP and MTP joint spaces are open and the phalanges are demonstrated without foreshortening when the toe(s) was fully extended and a perpendicular central ray was centered to the MTP joint. This toe positioning and central ray placement align the joint spaces perpendicular to the IR and parallel with the central ray. They also prevent foreshortening of the phalanges, because the long axes of the phalanges are aligned parallel with the IR and perpendicular to the central ray. If the toe was not extended, the resulting image demonstrates closed joint spaces and foreshortened phalanges (see Image 6).
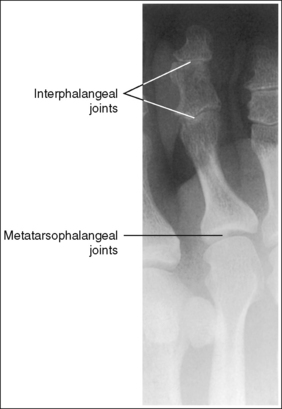
IMAGE 6
• Central ray angulation for nonextendable toes. In patients who are unable to extend their toes, the central ray should be angled proximally (toward the calcaneus) until it is perpendicular to the phalanx of interest or parallel with the joint space of interest or the toes and forefoot may be elevated on a sponge to bring phalanges closer to parallel with the IR.
No soft tissue or bony overlap from adjacent digits is present.
• The adjacent toes should be drawn away from the affected toe to prevent overlapping. It may be necessary to use tape or another immobilization device to maintain the unaffected toe's position. If the unaffected toes are not drawn away, they may be superimposed over the affected toe (see Image 7).
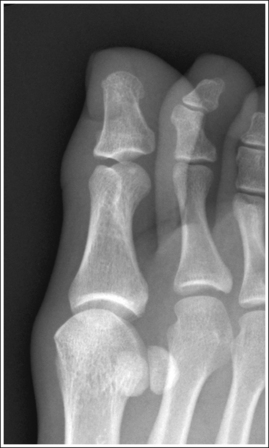
IMAGE 7
The MTP joint is at the center of the exposure field for an AP toe projection or the third MTP joint is at the center for images of the toes. The phalanges and half of the metatarsal(s) are included within the collimated field.
• Centering the central ray to the MTP joint for a toe or to the third MTP for toes places the joint(s) in the center of the image and aids in opening the joint spaces.
• Open the longitudinal collimation to include the toe(s) and the distal half of the metatarsal(s). To include half of the metatarsal(s), extend the light field 2 inches (5 cm) proximally to the between-toe interconnecting tissue. Transverse collimation should be to within 0.5 inch (1.25 cm) of the toe or foot skin line.
• One third of an 8- × 10-inch (18- × 24-cm) detailed screen-film or computed radiography IR placed crosswise should be adequate to include all the required anatomic structures.
Anteroposterior Oblique Toe Projection Analysis
Soft tissue width and midshaft concavity on both sides of the phalanges are almost equal. The toe was rotated less than 45 degrees.
Correction
Increase toe and foot obliquity until the affected toe is at a 45-degree angle with the IR.
Analysis
The proximal phalanx demonstrates more concavity on the lateral aspect of the toe than the medial aspect. The toe has been rotated close to a lateral position.
Correction
Decrease toe and foot obliquity until the affected toe is at a 45-degree angle with the IR.
Analysis
The IP and MTP joint spaces are obscured, and the phalanges are foreshortened. The patient's toe was flexed, and the central ray was not angled to open these joints or to demonstrate the phalanges without foreshortening.
Correction
If the patient's condition allows, extend the toe, placing it flat against the IR. If the patient's toe cannot be extended, angle the central ray until it is aligned perpendicularly to the phalanx of interest or parallel with the joint space of interest.
TOE(s): LATERAL PROJECTION (MEDIOLATERAL AND LATEROMEDIAL)
See Figures 6-8 and 6-9 and Box 6-4.
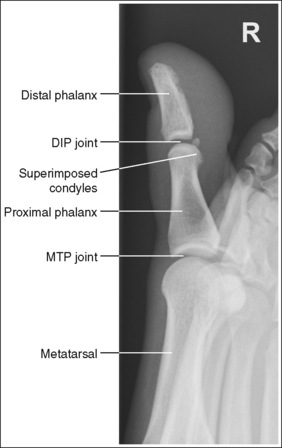
FIGURE 6-8 First lateral toe projection with accurate positioning. DIP, Distal interphalangeal; MTP, metatarsophalangeal.
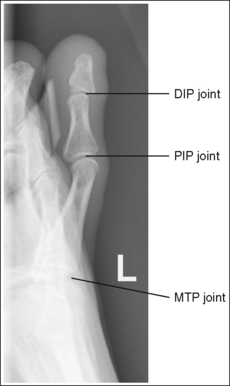
FIGURE 6-9 Second lateral toe projection with accurate positioning. DIP, Distal interphalangeal; MTP, metatarsophalangeal; PIP, proximal interphalangeal.
The digit is demonstrated in a lateral projection. The posterior surface of the proximal phalanx demonstrates more concavity than the anterior surface, and the condyles are superimposed. The soft tissue outline of the nail, when shown, is in profile anteriorly.
• A lateral toe projection is obtained by rotating the foot and toe until the affected toe is lateral. Whether the foot is medially or laterally rotated to achieve this goal depends on which toe is being imaged. When the first, second, and third toes are imaged, rotate the foot medially (Figure 6-10). When the fourth and fifth toes are imaged, rotate the foot laterally (Figure 6-11).
• Inadequate toe rotations. In a lateral projection, the posterior (plantar) surface of the proximal phalanx demonstrates more concavity than the anterior (dorsal) surface and the condyles are superimposed. Inadequate rotation demonstrates almost equal concavity on the posterior and anterior surfaces of the proximal phalanx and the condyles without superimposition (see Image 8). Evaluate the degree of metatarsal head superimposition to determine whether the toe was rotated too much or not enough when a poor lateral toe projection is produced. Compare Images 8 and 9. In Image 8, the metatarsal heads are shown without superimposition, indicating that the amount of foot and toe rotation should be increased. In Image 9, the metatarsal heads demonstrate slight superimposition, indicating that the amount of foot and toe rotation should be decreased.
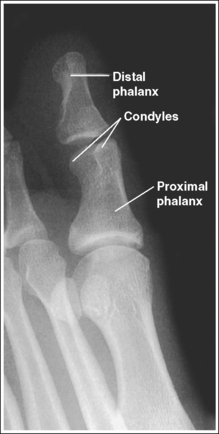
IMAGE 8
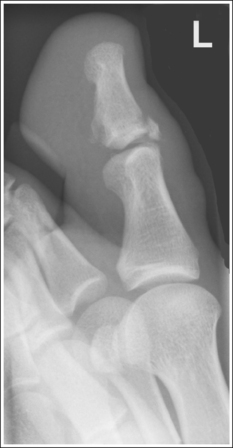
IMAGE 9
No soft tissue or bony overlap from adjacent toes is present.
• The adjacent toes should be drawn away from the affected toe to prevent overlapping. It may be necessary to use tape or another immobilization device to maintain the unaffected toe's position. If the unaffected toes are not drawn away, they may be superimposed over the affected toe (see Image 10).
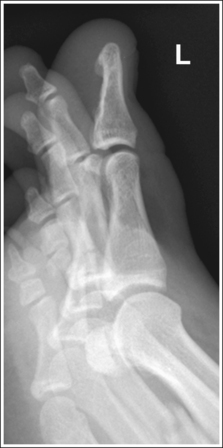
IMAGE 10
The proximal interphalangeal (PIP) joint is at the center of the exposure field. The phalanges and MTP joint space are included within the collimated field.
• Centering a perpendicular central ray to the PIP joint places the joint in the center of the image.
• Open the longitudinal collimation to include the distal phalanx and MTP joint space. The MTP joint space is located approximately 1 inch (2.5 cm) proximal to the between-toe interconnecting tissue. Transverse collimation should be to within 0.5 inch (1.25 cm) of the toe skin line.
• One third of an 8- × 10-inch (18- × 24-cm) detailed screen-film or computed radiography IR placed crosswise should be adequate to include all the required anatomic structures.
Lateral Toe Projection Analysis
The proximal phalanx demonstrates almost equal midshaft concavity, the condyles are shown without superimposition, and the metatarsal heads are shown without superimposition. The foot and toe were not rotated enough for the toe to be placed in a lateral position.
Correction
Increase the patient's toe and foot obliquity until the affected toe is in a lateral position. For this patient it may also be necessary to draw the unaffected toes away from the affected toe to prevent superimposition.
Analysis
The proximal phalanx demonstrates almost equal midshaft concavity, the condyles are shown without superimposition, and the metatarsal heads are slightly superimposed. The foot and toe were rotated too much for the toe to be placed in a lateral position.
Correction
Decrease the patient's toe and foot obliquity until the affected toe is in a lateral projection.
FOOT: ANTEROPOSTERIOR AXIAL PROJECTION (DORSOPLANTAR)
See Figure 6-12 and Box 6-5.
The foot demonstrates uniform density across the phalanges, metatarsals, and tarsals.
• When an exposure (mAs) is set that will adequately demonstrate the proximal metatarsals and tarsals, the distal metatarsals and phalanges are often overexposed because of the difference in AP foot thickness in these two regions (see Image 11). A wedge-type compensating filter placed over the phalanges and MTP joints can be used to absorb some of the photons that reach these areas, thereby obtaining more uniform foot density (Figure 6-13). Position the thinnest part of the filter 1 inch (2.5 cm) proximally to the between-toe interconnecting tissue and the thickest over the phalanges.

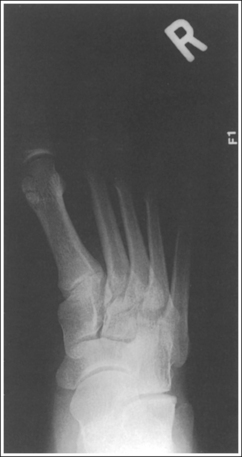
IMAGE 11
The foot demonstrates an AP projection. The joint space between the medial (first) and intermediate (second) cuneiforms is open, approximately 0.75 inch (2 cm) of the calcaneus is demonstrated without talar superimposition, and concavity on both sides of the first metatarsal midshaft is equal.
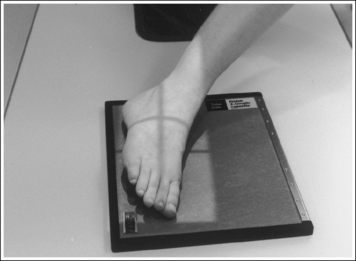
• An AP projection of the foot is obtained by flexing the supine patient's knee and placing the plantar foot surface against the IR (Figure 6-14). The lower leg, ankle, and foot should remain aligned, and equal pressure should be applied across the plantar surface.
• Effect of foot rotation. If the lower leg, ankle, and foot are not aligned or if more pressure is placed on the medial or lateral plantar surface, foot rotation will result, and the medial and intermediate cuneiform joint space will be closed. When the foot is laterally rotated, the navicular tuberosity, which superimposes itself on an AP projection, is rolled into profile, and the talus moves over the calcaneus, resulting in less than 0.75 inch (2 cm) of calcaneal demonstration without talar superimposition. An increase in metatarsal base superimposition also occurs (see Images 11 and 12). When the foot is medially rotated, the talus moves away from the calcaneus, resulting in more than 0.75 inch (2 cm) calcaneal visualization without talar superimposition. A decrease in superimposition of the metatarsal bases also occurs (see Image 13).
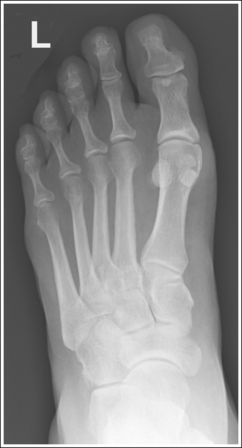
IMAGE 12
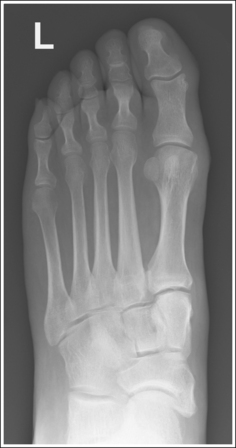
IMAGE 13
• Standing AP projection of the foot. This image may also be obtained with the patient in a standing position. An AP standing foot projection should meet the same evaluating criteria used for a nonstanding AP foot projection.
The tarsometatarsal (TMT) and navicular-cuneiform joint spaces are open.
• The bones of the foot, with their ligamentous and muscular structures, are arranged in a longitudinal arch that is visible on the medial foot surface. This arch places the tarsometatarsal and navicular-cuneiform joint spaces at a set angle with the IR. To demonstrate these joints as open spaces, angle the central ray until it is aligned parallel with them. This is accomplished in most patients by using a 10- to 15-degree proximal (toward the calcaneus) angle or aligning the central ray perpendicularly with the dorsal surface. The exact degree of angulation needed depends on the height of the longitudinal arch. A 10-degree angle should be used when the patient's longitudinal arch is low, as shown in Figure 6-15. A 15-degree angle is needed in a patient with a high arch, as shown in Figure 6-16. Higher arched patients require a slightly higher angle. Omitting or employing an inaccurate central ray angulation results in obstructed TMT and navicular-cuneiform joint spaces (see Image 14).
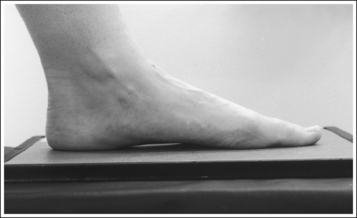
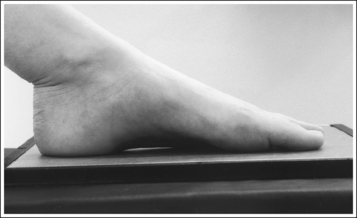
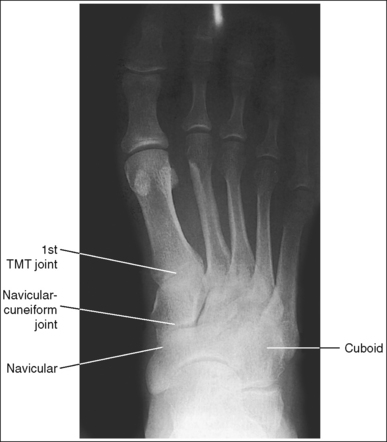
IMAGE 14
The third metatarsal base is at the center of the exposure field. The proximal calcaneus, talar neck, tarsals, metatarsals, phalanges, and surrounding foot soft tissue are included within the collimated field.
• To place the third metatarsal base in the center of the image, center the central ray to the midline of the foot at a level 0.5 inch (1.25 cm) distal to the fifth metatarsal tuberosity. The fifth metatarsal tuberosity can be palpated along the lateral foot surface, approximately halfway between the ball of the foot and the calcaneus.
• Open the longitudinal collimation enough to include the phalanges. Transverse collimation should be to within 0.5 inch (1.25 cm) of the foot skin line.
• Half of a 10- × 12-inch (24- × 30-cm) detailed screen-film or computed radiography IR placed lengthwise should be adequate to include all the required anatomic structures.
Anteroposterior Axial Foot Projection Analysis
The phalanges and distal metatarsals are overexposed. A compensating filter was not used on this portion of the foot. The joint space between the medial and intermediate cuneiforms is closed, the navicular tuberosity is demonstrated in profile, and less than 0.75 inch (2 cm) of the calcaneus is demonstrated without talar superimposition. More pressure was placed on the patient's lateral plantar surface than on the medial surface, resulting in lateral foot rotation. The TMT joint spaces are observed. The central ray was not aligned parallel with these joint spaces.
Correction
Position a compensating filter over the phalanges and distal metatarsal. Rotate the foot medially until the pressure over the entire plantar surface is equal. The lower leg, ankle, and foot should be aligned. Direct the central ray 10 to 15 degrees proximally.
Analysis
The joint space between the medial and intermediate cuneiforms is closed, the navicular tuberosity is demonstrated in profile, and less than 0.75 inch (2 cm) of the calcaneus is demonstrated without talar superimposition. The TMT joint spaces are obscured. More pressure was placed on the patient's lateral plantar surface than on the medial surface, resulting in lateral foot rotation, and the central ray was not aligned parallel with these joint spaces.
Correction
Rotate the foot medially until the pressure over the entire plantar surface is equal. The lower leg, ankle, and foot should be aligned. Direct the central ray 10 to 15 degrees proximally (toward the calcaneus), or angle the central ray until it is perpendicular with the dorsal surface.
Analysis
The joint space between the medial and intermediate cuneiforms is closed, the calcaneus demonstrates no talar superimposition, and the metatarsal bases demonstrate decreased superimposition. More pressure was placed on the patient's medial plantar surface than on the lateral surface, resulting in medial foot rotation.
Correction
Rotate the foot laterally until the pressure over the entire plantar surface is equal. The lower leg, ankle, and foot should be aligned.
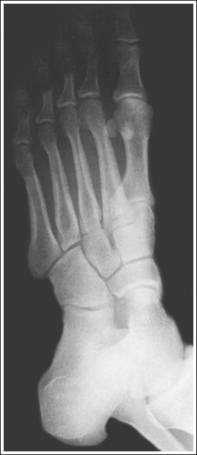
FOOT: ANTEROPOSTERIOR OBLIQUE PROJECTION (MEDIAL ROTATION)
See Figures 6-17 and 6-18 and Box 6-6.
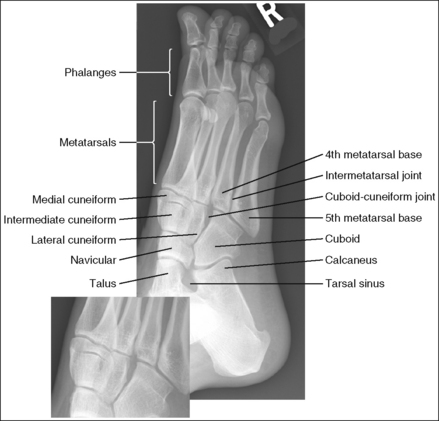
FIGURE 6-17 AP oblique foot projection with accurate positioning in a patient with a high longitudinal arch.
The foot demonstrates uniform density across the phalanges, metatarsals, and tarsals.
• A wedge-type compensating filter placed over the patient's phalanges and distal metatarsals can be used to obtain uniform foot density. Position the thinnest part of the filter 1 inch (2.5 cm) proximally to the between-toe interconnecting tissue and the thickest over the phalanges.
The foot demonstrates adequate obliquity. The cuboid-cuneiform joint space is open, the first and second intermetatarsal joints are closed, but the second through fifth intermetatarsal joint spaces are open, and the tarsi sinus and fifth metatarsal tuberosity are well demonstrated.
• To obtain an AP oblique foot projection, begin with the patient in a supine position with the knee flexed until the plantar foot surface rests against the receptor. Medially rotate the patient's leg and foot until the foot forms a 30- to 60-degree angle with the IR (Figure 6-19).
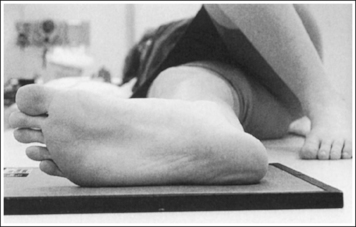
• Determining required obliquity. To determine whether a 30- or 60-degree rotation is needed, view the medial aspect of the patient's foot in an AP projection to judge the height of the patient's longitudinal arch. Less obliquity is required in a patient with a low longitudinal arch than in a patient with a high arch. If the patient has a low arch (Figure 6-20; also see Figure 6-15), rotate the patient's foot approximately 30 degrees medially; if the patient's foot has an average arch (Figure 6-21; also see Figure 6-16), rotate the foot approximately 45 degrees medially; and, if the patient's arch is high (Figure 6-22; also see Figure 6-17), rotate the foot approximately 60 degrees. The average arch requires 45 degrees of rotation. As the foot is rotated, keep the lower leg, ankle, and foot aligned to judge the degree of foot obliquity better.
• Judging the degree of the rotation on AP oblique foot projections. On lateral foot projections, the height of the longitudinal arches can be compared by evaluating the amount of cuboid demonstrated posterior to the navicular bone. Note that more cuboid is visible posterior to the navicular bone on the lateral foot projection in Figure 6-22 than in Figure 6-20 and Figure 6-23. A lateral foot projection from a patient with an average longitudinal arch demonstrates approximately 0.5 inch (1.25 cm) of cuboid posterior to the navicular bone, whereas a patient with a high arch will demonstrate approximately 0.75 inch (2 cm) and a patient with a low arch approximately 0.25 inch (0.6 cm). On AP oblique projections, accurate obliquity has been obtained when the cuboid-cuneiform and second through fifth intermetatarsal joint spaces are open. This accuracy is demonstrated on the AP oblique projections in Figures 6-17 and 6-21, even though they were taken with different degrees of obliquity. This can be confirmed by studying the amount of first and second metatarsal base superimposition, the amount of space demonstrated between the metatarsal heads, and the demonstration of the sinus tarsi (opening between the calcaneus and talus). When the foot is rotated medially, the first metatarsal base rotates beneath the second metatarsal base, and the second through third metatarsal heads move closer together. The greater the foot obliquity, the greater the superimposition of the metatarsal heads.
• Underrotation versus overrotation. If the degree of foot obliquity is inadequate for an AP oblique foot projection, the longitudinally running foot joints (cuneiform-cuboid, navicular-cuboid, and second through fifth intermetatarsal joint spaces) are closed. To determine whether the patient's foot has been underrotated or overrotated, evaluate the intermetatarsal joint spaces between the fourth and fifth metatarsals. If this joint space is closed and the fourth metatarsal base is superimposed over the fifth metatarsal base, the foot was underrotated (see Images 15 and 16). If the fourth-fifth intermetatarsal joint space is closed and the fifth proximal metatarsal is superimposed over the fourth metatarsal tubercle, the foot was overrotated (see Image 17). The fourth metatarsal tubercle is a rounded protruding surface located just distal to the fourth metatarsal base.
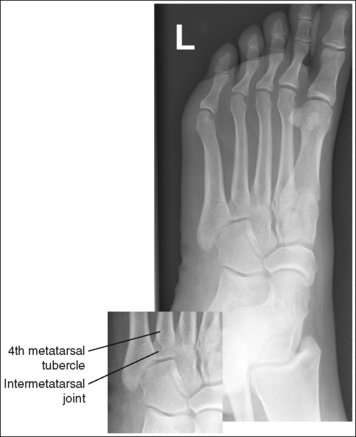
IMAGE 15
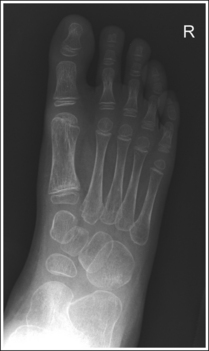
IMAGE 16
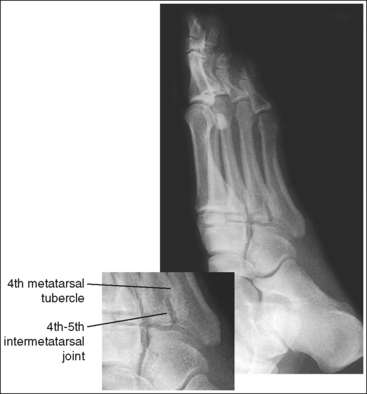
IMAGE 17
The third metatarsal base is at the center of the exposure field. The phalanges, metatarsals, tarsals, calcaneus, and surrounding foot soft tissue are included within the collimated field.
• Centering a perpendicular central ray to the midline of the foot at the level of the fifth metatarsal tuberosity places the base of the proximal third metatarsal in the center of the image.
• Open the longitudinal collimation enough to include the phalanges and calcaneus. Transverse collimation should be to within 0.5 inch (1.25 cm) of the foot skin line.
• Half of a 10- × 12-inch (24- × 30-cm) detailed screen-film or computed radiography IR placed lengthwise should be adequate to include all the required anatomic structures.
Anteroposterior Oblique Foot Projection Analysis
The lateral cuneiform-cuboid, navicular-cuboid, and third through fifth intermetatarsal joint spaces are closed. The fourth metatarsal tubercle is demonstrated without superimposition of the fifth metatarsal. The foot was not medially rotated enough.
Correction
Increase the degree of medial foot rotation. The amount of increase needed is half the amount of fourth and fifth metatarsal base superimposition demonstrated on the image.
Analysis
The lateral cuneiform-cuboid and third through fifth intermetatarsal joint spaces are closed. The foot was not medially rotated enough.
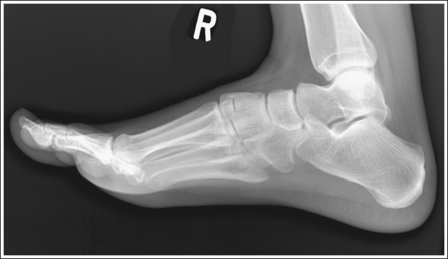
FOOT: LATERAL PROJECTION (MEDIOLATERAL AND LATEROMEDIAL)
See Figures 6-23 and 6-24 and Box 6-7.
Contrast and density are adequate to demonstrate the anterior pretalar and posterior pericapsular fat pads on the foot and ankle.
• Fat pads on the foot and ankle. Two soft tissue structures located around the foot and ankle may indicate joint effusion and injury, the anterior pretalar fat pad and posterior pericapsular fat pad. The anterior pretalar fat pad is visible anterior to the ankle joint and rests next to the neck of the talus (Figure 6-25). Surrounding the ankle joint is a fibrous, synovium-lined capsule attached to the borders of the tibia, fibula, and talus. On injury or disease invasion the synovial membrane secretes synovial fluid, resulting in distention of the fibrous capsule. Anterior fibrous capsule distention results in displacement of the anterior pretalar fat pad. Because neither the fibrous capsule nor the ankle ligaments can be detected on plain radiography, displacement of this fat pad indicates joint effusion and the possibility of underlying injuries.
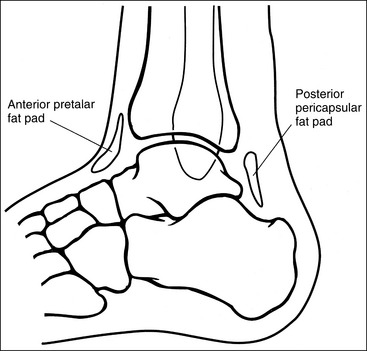
• The posterior fat pad is positioned within the indentation formed by the articulation of the posterior tibia and talar bones (see Figure 6-25). This fat pad is displaced in the same manner as the anterior pretalar fat pad, although it is less sensitive and requires more fluid evasion to be displaced.
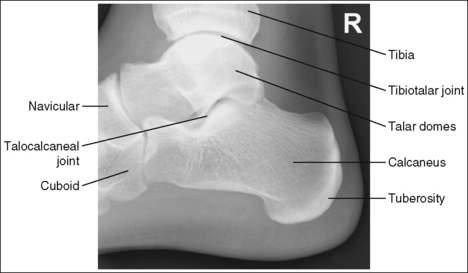
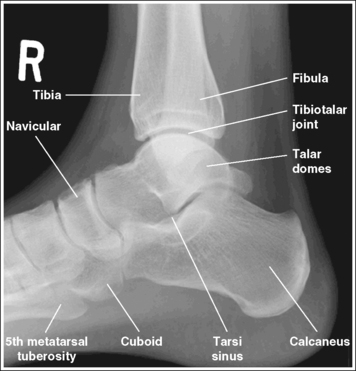
The foot is in a lateral projection. The talar domes are superimposed, the tibiotalar joint is open, and the distal fibula is superimposed by the posterior half of the distal tibia.
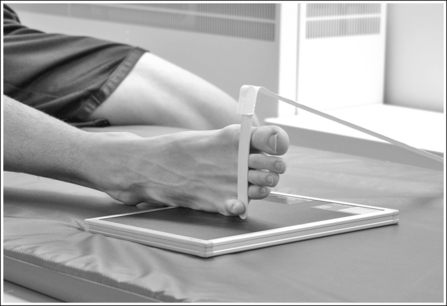
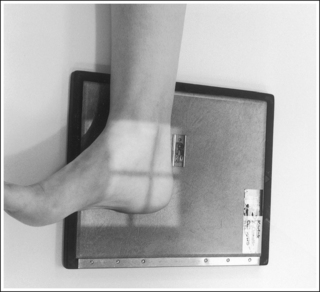
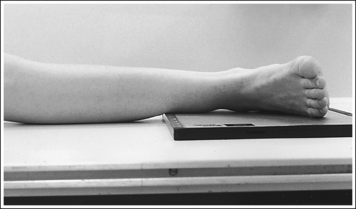
• To obtain a lateral foot projection, begin with the patient in a supine position with the leg extended and the foot dorsiflexed until its long axis forms a 90-degree angle with the lower leg (Figure 6-26). Rotate the patient toward the affected leg until the lateral foot surface is against the IR, and then adjust the degree of rotation until this surface is aligned parallel with the IR (Figure 6-27). For most patients, this positioning places the lower leg parallel with the imaging table. If this is not the case, as for a patient with a large upper thigh, the foot and IR should be elevated with an immobilization device until the lower leg is brought parallel with the imaging table.

• Accurate longitudinal arch visualization: This position may not bring the medial plantar foot surface perpendicular to the IR. If this is so, do not try to adjust the leg in an attempt to position this surface perpendicular to the IR. The true relationship of this surface to the IR and the metatarsals to one another depends on the height of the patient's longitudinal arch and the incline of the calcaneus. Adjusting the patient's plantar surface may result in poor talar dome positioning and an erroneous longitudinal arch height.
The height of the longitudinal arch can be determined by measuring the amount of cuboid demonstrated posterior to the navicular bone. The average lateral foot projection demonstrates approximately 0.5 inch (1.25 cm) of the cuboid, as shown in Figure 6-23. Because the bones that form the foot arch are held in position by ligaments and tendons, weakening of these tissues may result in a decreased or low arch. On a lateral foot projection, this decrease in arch height is demonstrated as a decrease in the amount of cuboid demonstrated posterior to the navicular bone. Figure 6-20 shows a lateral foot projection of a patient with a low longitudinal arch and approximately 0.25 inch (0.6 cm) of cuboid posterior to the navicular bone, whereas Figure 6-22 shows a patient with a high arch and approximately 0.75 inch (2 cm) of cuboid posterior to the navicular bone.
• Talar domes. The domes of the talus are formed by the most medial and lateral aspects of the talar's trochlear surface. On a lateral foot projection, they appear as domed structures that articulate with the tibia. On a properly positioned lateral foot projection, the talar domes should be superimposed and appear as one and the tibiotalar joint should be open. When the lateral foot is mispositioned, the domes are individually demonstrated, and they obscure the tibiotalar joint. Proximal-distal misalignment of the domes results from poor knee and lower leg positioning, and AP misalignment of the domes results from poor foot positioning.
• Effect of lower leg and knee positioning on proximal-distal talar dome superimposition. Often, if the knee is not fully extended (Figure 6-28) or if the distal tibia is not elevated to place the lower leg parallel with the IR in patients with large upper thighs, the proximal tibia is positioned farther from the imaging table than the distal tibia. The resulting image demonstrates the lateral talar dome proximal to the medial talar dome, the height of the longitudinal arch appears less than it actually is because the cuboid shifts anteriorly and the navicular bone moves posteriorly in this position, and the talocalcaneal joint will be narrowed (see Image 18). If the distal tibia is positioned farther from the table than the proximal tibia, the medial talar dome is demonstrated proximal to the lateral dome, the height of the longitudinal arch appears higher than it actually is because the cuboid shifts proximally and the navicular bone moves anteriorly in this position, and the talocalcaneal joint will be widened (see Image 19).

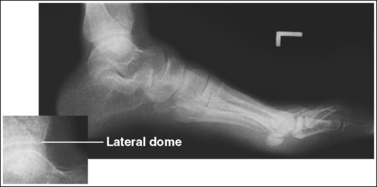
IMAGE 18
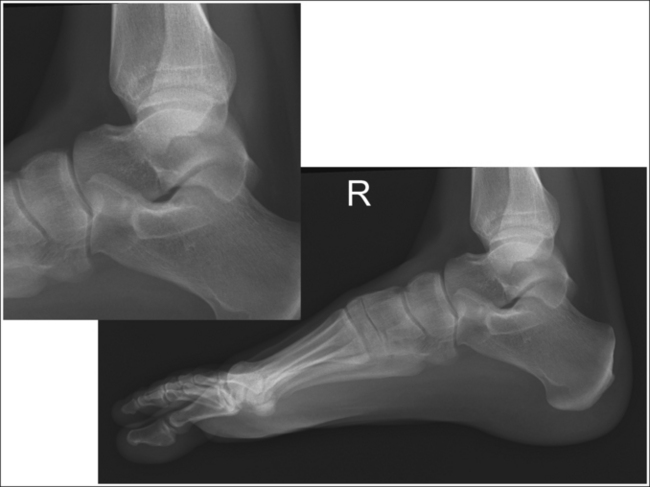
IMAGE 19
When viewing a lateral foot projection that demonstrates one of the talar domes proximal to the other, evaluate the height of the longitudinal arch and the degree of narrowing or widening of the talocalcaneal joint to determine which dome is the proximal dome. If the navicular bone is superimposed over more of the cuboid than expected and the talocalcaneal joint is narrowed, the lateral dome is the proximal dome; if the navicular bone is superimposed over less of the cuboid than expected and the talocalcaneal joint is wider, the medial dome is the proximal dome.
• Effect of foot positioning on AP talar dome superimposition. To demonstrate accurate AP alignment of the talar domes, position the lateral surface of the foot parallel with the IR. If this surface is not parallel with the IR, one of the talar domes is demonstrated anterior to the other. When the leg is rotated more than needed to place the lateral foot surface parallel with the IR, as shown in Figure 6-29, the medial talar dome is demonstrated anterior to the lateral talar dome (see Image 20). If the leg is not rotated enough to place the lateral foot surface parallel with the IR, as shown in Figure 6-30, the medial talar dome is demonstrated posterior to the lateral talar dome (see Image 21).

FIGURE 6-29 Poorly positioned lateral foot projection with the calcaneus elevated (leg externally rotated).
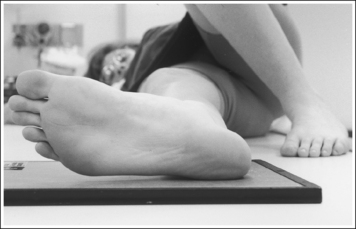
FIGURE 6-30 Poorly positioned lateral foot projection with the calcaneus depressed (leg internally rotated).
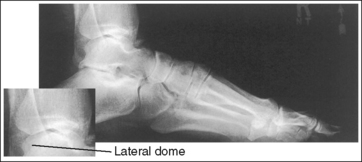
IMAGE 20
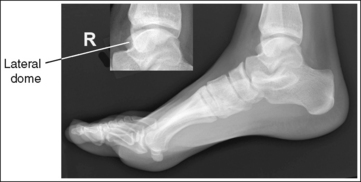
IMAGE 21
When viewing a lateral foot projection that demonstrates one of the talar domes anterior to the other, evaluate the position of the fibula in relation to the tibia to determine how to reposition the patient. On most lateral foot projections with accurate positioning, the fibula is positioned in the posterior half of the tibia. If the fibula is demonstrated more posteriorly than this relationship on a lateral foot projection with poor positioning, the medial talar dome is anterior and the patient was positioned with the forefoot depressed and the heel elevated (leg externally rotated), as shown in Figure 6-29. If the fibula is demonstrated more anteriorly than this relationship, the medial talar dome is posterior and the patient was positioned with the forefoot elevated and the heel depressed (leg internal rotation), as shown in Figure 6-30.
The long axis of the foot is positioned at a 90-degree angle with the lower leg.
• In most cases, when a patient is relaxed, the foot rests in plantar flexion. Plantar flexion results in a forced flattening of the anterior pretalar fat pad, reducing its usefulness in the detection of joint effusion (see Image 22). Consequently, it is best to dorsiflex the foot, placing its long axis at a 90-degree angle with the lower leg. This positioning also places the tibiotalar joint in a neutral position and helps keep the leg and foot from rolling too far anteriorly. Anterior foot rotation elevates the heel and rotates the foot.
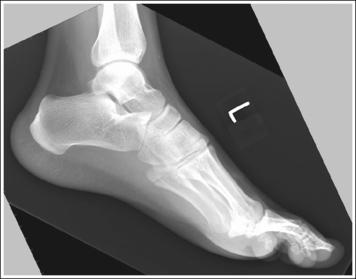
IMAGE 22
The proximal metatarsals are at the center of the exposure field. The phalanges, metatarsals, tarsals, talus, calcaneus, 1 inch (2.5 cm) of the distal lower leg, and surrounding foot soft tissue are included within the collimated field.
• Centering a perpendicular central ray halfway between the distal toes and heel and the AP aspect of the foot places the bases of the metatarsals at the center of the exposure field.
• Open the longitudinal collimation enough to include the patient's toes and heel. Transverse collimation should be to a point 1 inch (2.5 cm) proximal to the medial malleolus (Figure 6-31).
• A diagonally placed 8- × 10-inch (18- × 24-cm) or a 10- × 12-inch (24- × 30-cm) detailed screen-film or computed radiography IR placed crosswise should be adequate to include all the required anatomic structures.
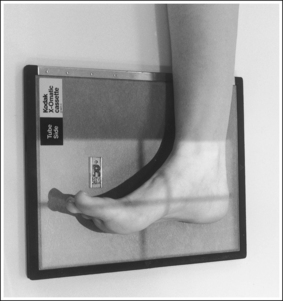
WEIGHT-BEARING LATEROMEDIAL PROJECTION
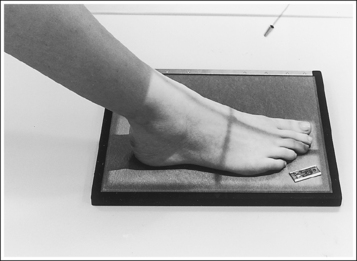
A standing lateromedial foot projection is accomplished by placing the IR against the medial aspect of the foot and aligning the lateral foot surface parallel with the IR, as shown in Figure 6-32. Even pressure should be applied to both feet. Notice that the patient's heel is situated slightly away from the IR when the lateral foot surface is parallel with the IR. The resulting image should meet all the analysis requirements listed for the mediolateral projection.
The most common misposition for the standing lateromedial projection of the foot shows the medial talar dome positioned anterior to the lateral talar dome and the distal fibula positioned too posteriorly on the tibia (see Image 20). This misposition is a result of aligning the medial foot surface parallel with the IR, as shown in Figure 6-33, rather than the lateral surface. When such an image is obtained, move the patient's heel away from the IR (leg internally rotated).
Lateral Foot Projection Analysis
The tibiotalar joint space is obscured, and one talar dome is demonstrated proximal to the other dome. Because the navicular bone is superimposed over most of the cuboid and the talocalcaneal joint is narrowed, the lateral talar dome is the proximal dome. The proximal tibia was elevated, as shown in Figure 6-29.
Correction
Extend the knee, positioning the lower leg parallel with the IR, as shown in Figure 6-26. If the knee was extended for this image, elevate the lower leg until it is positioned parallel with the IR.
Analysis
The tibiotalar joint space is obscured, and one talar dome is demonstrated proximal to the other dome. Because more than 0.5 inch (1.25 cm) of cuboid is visible posterior to the navicular bone and the talocalcaneal joint is widened, the medial dome is the proximal dome. The distal tibia was elevated.
Analysis
The medial talar dome is positioned anterior to the lateral dome, as indicated by the posterior position of the fibula on the tibia. The lateral foot surface was not positioned parallel with the IR. If this is a mediolateral projection, the forefoot was depressed and heel was elevated (leg externally rotated), as shown in Figure 6-29. If this is a standing lateromedial projection, the medial surface of the patient's heel was placed next to the IR, as shown in Figure 6-33.
Correction
For a mediolateral projection, elevate the patient's forefoot and depress the patient's heel (internally rotate the leg) until the lateral foot surface is positioned parallel with the IR, as shown in Figure 6-27. For a standing lateromedial projection, draw the patient's heel away from the IR until the lateral foot surface is positioned parallel with the IR, as shown in Figure 6-32.
Analysis
The medial talar dome is positioned posterior to the lateral dome, as indicated by the anterior position of the distal fibula on the tibia. The lateral foot surface was not positioned parallel with the IR but was positioned with the forefoot elevated and heel depressed (leg internally rotated), as shown in Figure 6-30.
Correction
Depress the patient's forefoot and elevate the heel (externally rotated leg) until the lateral foot surface is positioned parallel with the IR, as shown in Figure 6-27.
CALCANEUS: AXIAL PROJECTION (PLANTODORSAL)
See Figure 6-34 and Box 6-8.
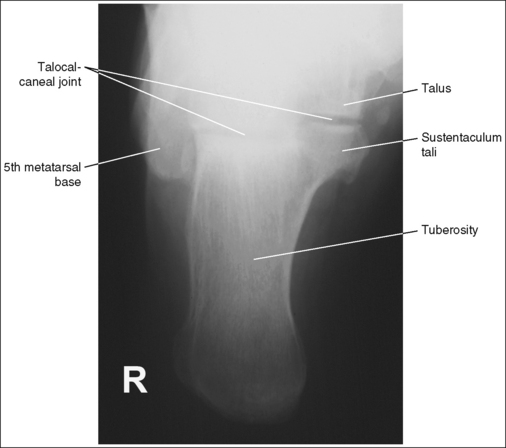
The talocalcaneal joint is demonstrated as an open space, and the calcaneal tuberosity is demonstrated without distortion.
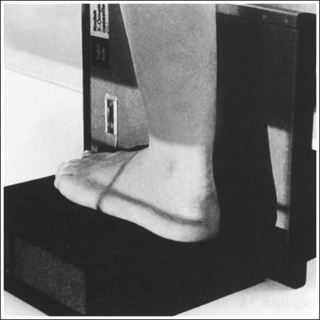
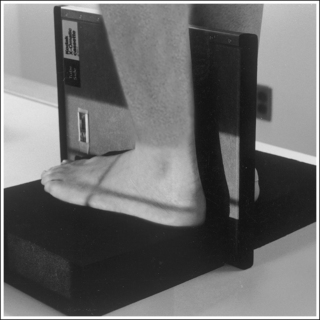
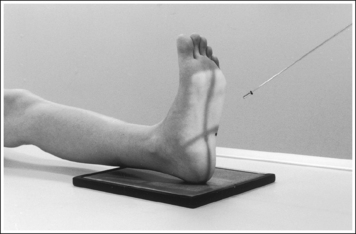
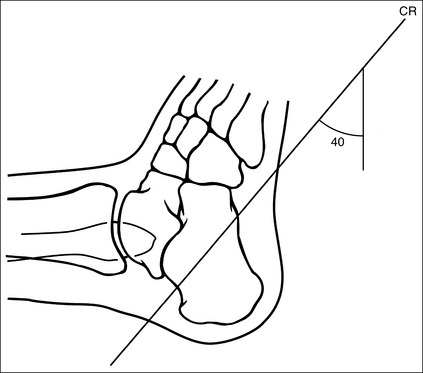
• The talocalcaneal joint space is demonstrated as an open space, and the calcaneal tuberosity appears without distortion, when the correct central ray angulation and foot position are used. For a patient who has foot mobility, place the foot in a neutral-vertical position and direct a 40-degree central ray angulation toward the plantar foot surface (Figure 6-35). This positioning places the central ray parallel with the talocalcaneal joint space and perpendicular to the calcaneal tuberosity (Figure 6-36).
• Compensating for plantar-flexed or dorsiflexed foot. When the patient's foot is dorsiflexed beyond a 90-degree position with the lower leg or is plantar-flexed, the central ray needs to be adjusted to maintain its accurate position with the calcaneal joint space and tuberosity. If the patient's foot is dorsiflexed beyond the vertical position and a 40-degree angulation is used, the calcaneal joint spaces would be obscured and the tuberosity elongated (Figure 6-37; see Image 23). In this situation the central ray angulation should be decreased to maintain accurate central ray alignment. If the patient's foot is plantar-flexed and a 40-degree central ray angulation is used, the calcaneal joint space is obscured and the tuberosity foreshortened (see Image 24 and Figure 6-38). In this situation the central ray angulation should be increased to maintain accurate central ray alignment. The angulation required for each of these situations can be estimated by locating the base of the fifth metatarsal and the distal point of the fibula. The fifth metatarsal base is palpable on the lateral foot surface approximately halfway between the ball of the foot and the heel. Once these structures are located, angle the central ray parallel with an imaginary line drawn between them. When the axial calcaneal projection is taken with the foot in plantar flexion and the central ray is angled as just discussed to demonstrate the talocalcaneal joint space, the calcaneal tuberosity will be elongated because of the acute angle created between the central ray and IR (see Image 25).
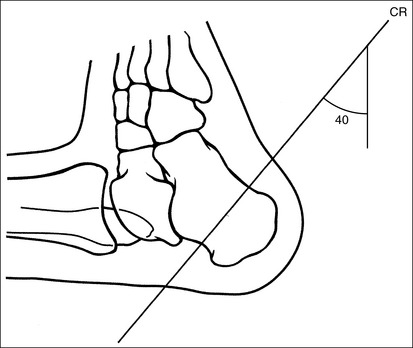
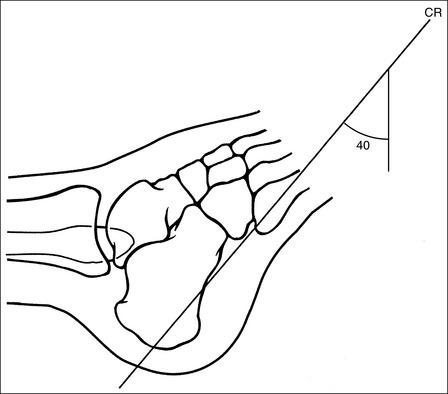
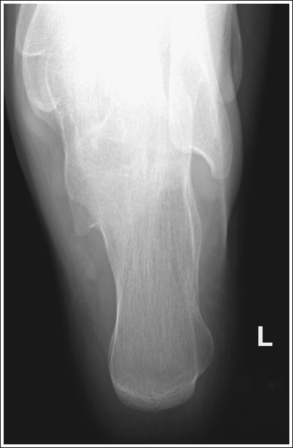
IMAGE 23
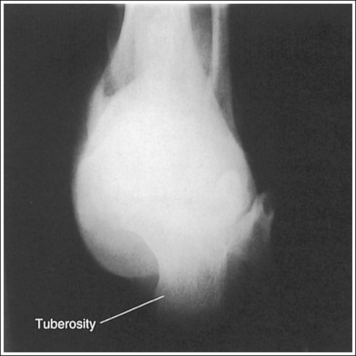
IMAGE 24
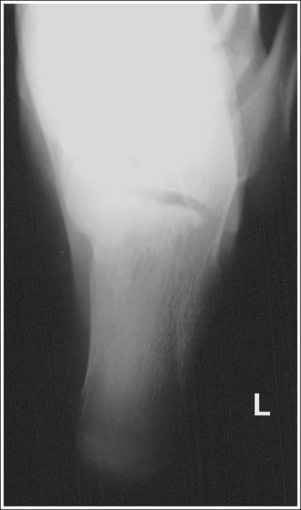
IMAGE 25
The second through fourth distal metatarsals are not demonstrated on the medial or lateral aspect of the foot, respectively.
• To prevent calcaneal tilting, place the patient supine on the imaging table, with the leg fully extended and the foot dorsiflexed until its long axis is placed in a vertical position, without medial or lateral rotation or foot inversion or eversion. If the ankle is internally rotated or the foot inverted, the first and second metatarsals are demonstrated medially. If the ankle is externally rotated or the foot everted, the fourth and fifth metatarsals are demonstrated laterally (see Images 25 and 26).
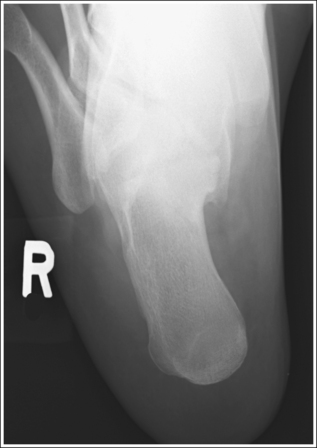
IMAGE 26
The proximal calcaneal tuberosity is at the center of the exposure field. The calcaneal tuberosity and the talocalcaneal joint space are included within the collimated field.
• Centering the central ray to the midline of the foot at the level of the fifth metatarsal base places the proximal tuberosity in the center of the exposure field.
• Open the longitudinal collimation enough to include the patient's entire heel. Transverse collimation should be to within 0.5 inch (1.25 cm) of the heel skin line.
• Half of an 8- × 10-inch (18- × 24-cm) IR detailed screen-film or computed radiography IR placed crosswise should be adequate to include all the required anatomic structures.
Axial Calcaneal Projection Analysis
The talocalcaneal joint space is obscured, and the calcaneal tuberosity is elongated. The foot was dorsiflexed beyond the vertical position, and a 40-degree central ray angulation was used.
Correction
Plantar-flex the foot to a vertical position and use a 40-degree angulation. If the patient cannot plantar-flex the foot, decrease the degree of central ray angulation, aligning the central ray with the fifth metatarsal base and the distal point of the fibula.
Analysis
The talocalcaneal joint space is obscured, and the calcaneal tuberosity is foreshortened. The foot was in plantar flexion, and the standard 40-degree central ray angulation was used.
Correction
If patient condition allows, dorsiflex the foot to a vertical, neutral position. If the patient cannot dorsiflex the foot, increase the central ray angulation, aligning the central ray with the fifth metatarsal base and the distal point of the fibula. Because of the acute angle that will be set up between the central ray and IR with this method, the calcaneal tuberosity will be elongated (see Image 23).
Analysis
The talocalcaneal joint space is shown as an open space and the calcaneal tuberosity demonstrates elongation. The foot was in plantar flexion, and the central ray was angled so that it was aligned with an imaginary line that connects the fifth metatarsal tuberosity and the distal point of the fibula. The fourth and fifth metatarsals are demonstrated on the lateral aspect of the foot. The ankle was externally rotated, and/or the foot was everted.
Correction
Elongation is not preventable if the patient's foot cannot be dorsiflexed because of the acute angle created between the central ray and IR. Internally rotate the leg until the ankle is in an AP projection, and/or bring the foot to a neutral position without eversion.
CALCANEUS: LATERAL PROJECTION (MEDIOLATERAL)
See Figure 6-39 and Box 6-9.
The calcaneus and distal tibia and fibula are in a lateral projection. The domes of the talus are superimposed, the tibiotalar joint space is open, and the distal fibula is superimposed by the posterior half of the distal tibia.
• To obtain a lateral calcaneal projection, begin with the patient in a supine position, with the leg extended (Figure 6-40) and the foot dorsiflexed until its long axis forms a 90-degree angle with the lower leg. Rotate the patient toward the affected leg until the lateral foot surface is against the IR; then, adjust the degree of rotation until the surface is aligned parallel with the IR (Figure 6-41). For most patients, this positioning places the lower leg parallel with the imaging table. If this is not the case, as with a patient with a large upper thigh, the foot and IR should be elevated to place the lower leg parallel with the imaging table.


• Talar domes: The domes of the talus are formed by the most medial and lateral aspects of the talar's trochlear surface. They are visible on a lateral calcaneal projection as domed structures that articulate with the tibia. When a lateral calcaneus projection has been obtained, the talar domes should be superimposed and appear as one, and the tibiotalar joint should be open. If the lateral calcaneus is mispositioned, the domes are individually demonstrated and obscure the tibiotalar joint. Misalignment of the domes will result from poor knee and foot positioning.
• Effect of lower leg positioning on talar dome superimposition. Often, if the knee is not fully extended (Figure 6-42) or if the distal tibia is not elevated to place the lower leg parallel with the IR (in a patient with a large upper thigh), the proximal tibia is positioned farther from the imaging table than the distal tibia. The resulting image demonstrates the lateral talar dome proximal to the medial talar dome, and the height of the longitudinal arch appears less than it actually is because the cuboid shifts anteriorly and the navicular bone moves posteriorly in this position; the talocalcaneal joint will be narrowed (see Image 27). If the distal tibia is positioned farther from the imaging table than the proximal tibia, the medial talar dome is demonstrated proximal to the lateral dome, and the height of the longitudinal arch appears higher than it actually is because the cuboid shifts posteriorly, the navicular bone moves anteriorly, and the talocalcaneal joint will be wider (see Image 28).

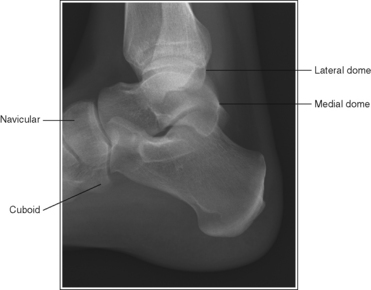
IMAGE 27
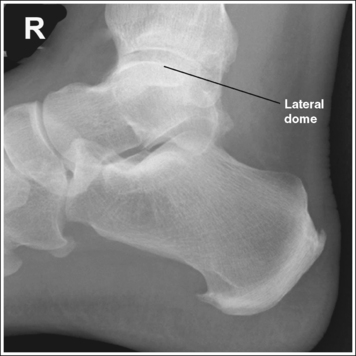
IMAGE 28
When viewing a lateral calcaneal projection that demonstrates one of the talar domes proximal to the other, evaluate the height of the longitudinal arch and the degree of narrowing or widening of the talocalcaneal joint to determine which dome is the proximal dome. If the navicular bone is superimposed over more of the cuboid than expected and the talocalcaneal joint is narrowed, the lateral dome is the proximal dome; if the navicular bone is superimposed over less of the cuboid than expected and the talocalcaneal joint is wider, the medial dome is the proximal dome.
• Effect of foot positioning on talar dome superimposition. To demonstrate accurate AP alignment of the talar domes, the lateral surface of the foot should be positioned parallel with the IR. If this surface is not parallel with the IR, the talar domes are demonstrated with one anterior to the other. When the leg is rotated more than needed to place the lateral foot surface parallel with the IR, as shown in Figure 6-43, the medial talar dome is demonstrated anterior to the lateral talar dome (see Image 29). If the leg is not rotated enough to place the lateral foot surface parallel with the IR, as shown in Figure 6-44, the medial talar dome is demonstrated posterior to the lateral talar dome (see Image 30). When imaging a lateral calcaneus projection that demonstrates one of the talar domes anterior to the other, image the position of the fibula in relation to the tibia to determine how the patient should be repositioned. On most lateral calcaneus projections with accurate positioning, the fibula is positioned in the posterior half of the tibia. On a lateral calcaneus projection with poor positioning, if the fibula is demonstrated more posteriorly, the medial talar dome is anterior and the patient was positioned with the forefoot depressed and the heel elevated (leg externally rotated), as shown in Figure 6-43. If the fibula is demonstrated more anteriorly (leg internally rotated), the medial domes are posterior and the patient was positioned with the forefoot elevated and the heel depressed, as shown in Figure 6-44.
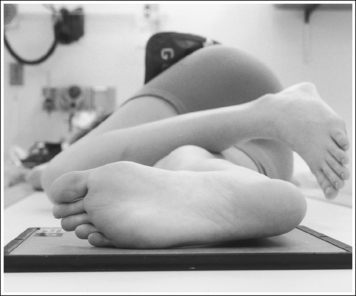
FIGURE 6-43 Poorly positioned lateral foot projection with the calcaneus elevated (leg internally rotated).

FIGURE 6-44 Poorly positioned foot projection with the calcaneus depressed (leg externally rotated).
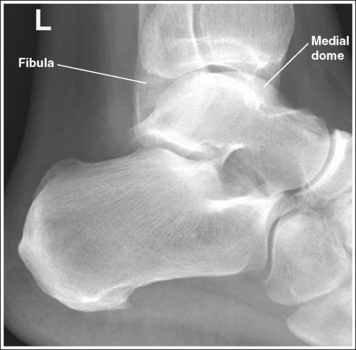
IMAGE 29
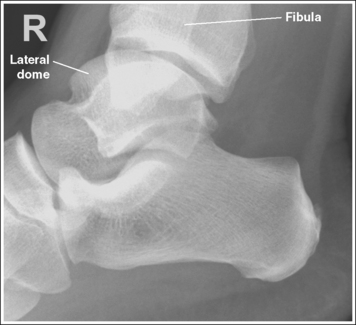
IMAGE 30
The long axis of the foot is positioned at a 90-degree angle with the lower leg.
• In most cases, when a patient is relaxed, the foot rests in plantar flexion, making it difficult for the patient to maintain a lateral position. Often, the patient rotates the foot too far anteriorly, elevating the heel and rotating the foot (see Image 31). Consequently, it is best to dorsiflex the patient's foot, placing its long axis at a 90-degree angle with the lower leg.
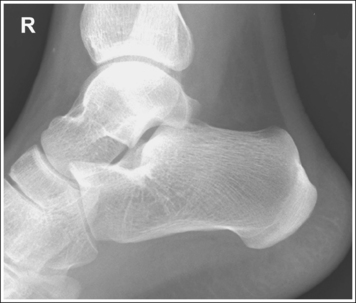
IMAGE 31
The midcalcaneus is at the center of the exposure field. The tibiotalar joint, talus, calcaneus, and calcaneus-articulating tarsal bones are included within the collimated field.
• Center a perpendicular central ray 1 inch (2.5 cm) distal to the medial malleolus to place the calcaneus in the center of the exposure field. Centering to the midcalcaneus better demonstrates the calcaneus and the surrounding calcaneotarsal and talocalcaneal articulations, allowing for accurate calcaneal inclination measurements and for visualization of calcaneal tuberosity displacement.
• Open the longitudinal collimation enough to include the calcaneus and tibiotalar joint, which is located at the level of the palpable medial malleolus. Including the tibiotalar joint on all lateral calcaneal projections provides a method of judging rotation and determining how to reposition when a rotated lateral calcaneal projection has been obtained. Transverse collimation should be to the calcaneal tuberosity and the calcaneotarsal joint spaces. Ensure that the calcaneotarsal joint spaces are included by extending the transverse collimation at least 2 inches (5 cm) anterior to the medial malleolus (Figure 6-45).
• Half of an 8- × 10-inch (18- × 24-cm) detailed screen-film or computed radiography IR placed crosswise should be adequate to include all the required anatomic structures.
Lateral Calcaneal Projection Analysis
The tibiotalar joint space is obscured, and one talar dome is demonstrated proximal to the other dome. Because the navicular bone is superimposed over most of the cuboid and the talocalcaneal joint is narrowed, the lateral dome is the proximal dome. The proximal tibia was elevated, as shown in Figure 6-42.
Correction
Extend the knee to position the lower leg parallel with the IR, as shown in Figure 6-40. If the knee was extended for this image, elevate the lower leg until it is positioned parallel with the IR.
Analysis
The tibiotalar joint space is obscured, and one talar dome is demonstrated proximal to the other dome. Because more than 0.5 inch (1.25 cm) of cuboid is demonstrated posterior to the navicular bone and the talocalcaneal joint is widened, the medial dome is the proximal dome. The distal tibia was elevated.
Analysis
The medial talar dome is positioned anterior to the lateral talar dome, as indicated by the posterior position of the fibula on the tibia. The lateral foot surface was not positioned parallel with the IR. The patient's forefoot was depressed and the heel was elevated (leg externally rotated), as shown in Figure 6-43.
Correction
Elevate the patient's forefoot and depress the heel (internally rotate the leg) until the lateral foot surface is parallel with the IR, as shown in Figure 6-41.
Analysis
The medial talar dome is positioned posterior to the lateral dome, as indicated by the anterior position of the distal fibula on the tibia. The lateral foot surface was positioned not parallel with the IR but with the forefoot elevated and the heel depressed, as shown in Figure 6-44.
Correction
Depress the patient's forefoot and elevate the heel until the lateral foot surface is positioned parallel with the IR, as shown in Figure 6-41.
ANKLE: ANTEROPOSTERIOR PROJECTION
See Figure 6-46 and Box 6-10.
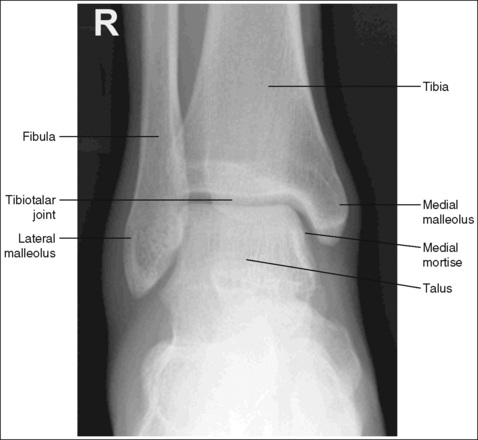
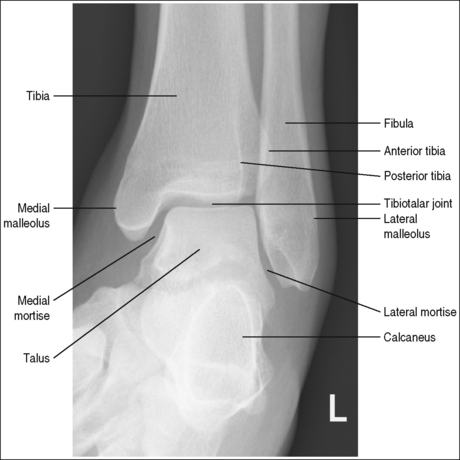
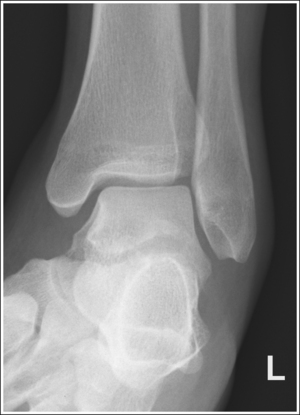
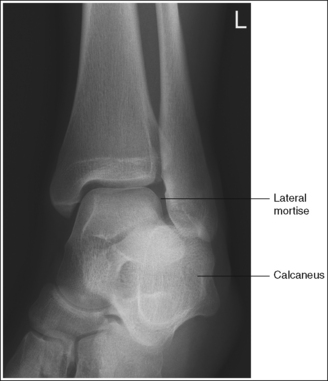
The ankle is demonstrated in an AP projection. The medial mortise (tibiotalar articulation) is open, and the distal tibia and talus are superimposed over the distal fibula by a small amount (0.125 inch [3 mm]), closing the lateral mortise (fibulotalar articulation).
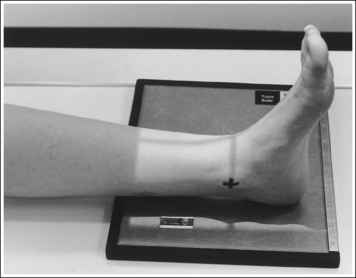
• An AP projection of the ankle is obtained by positioning the patient supine on the image table, with the leg fully extended and the foot dorsiflexed until its long axis is placed in a vertical position (Figure 6-47). In this position, the intermalleolar line (imaginary line drawn between the medial and lateral malleoli) is at a 15- to 20-degree angle with the IR. The medial malleolus is positioned farther from the IR than the lateral malleolus.
• Detecting direction of ankle rotation. If the ankle was not positioned in an AP projection but is rotated laterally or medially, the medial mortise is obscured. When an AP ankle projection demonstrates a closed medial mortise, one can determine which way the patient's leg was rotated by evaluating the amount of tibia and talar superimposition of the fibula and the position of the medial malleolus. In external rotation, the tibia and talus demonstrate greater superimposition of the fibula and the posterior aspect of the medial malleolus (Figure 6-48) is situated medial to the anterior aspect (see Image 32). In internal rotation, the fibula is demonstrated without talar superimposition (see Image 33).
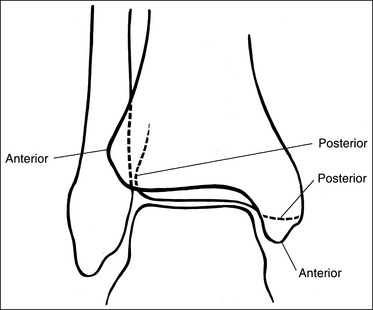
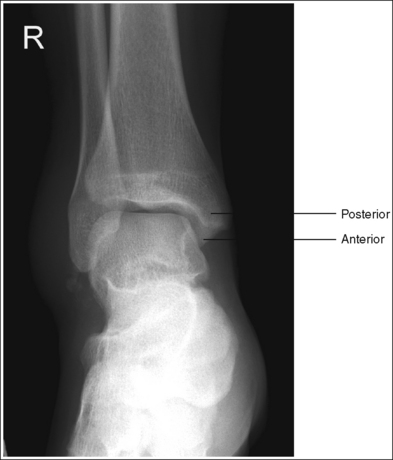
IMAGE 32
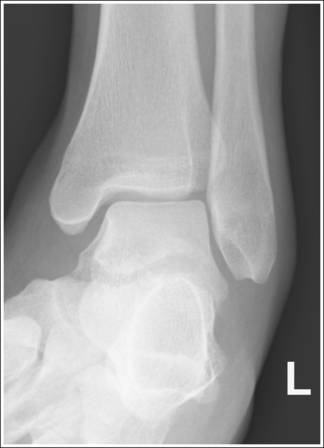
IMAGE 33
The tibiotalar joint space is open, and the tibia is demonstrated without foreshortening.
• The tibiotalar joint is open and the tibia is demonstrated without foreshortening if the patient's lower leg was positioned parallel with the IR and the central ray was centered at the level of the tibiotalar joint.
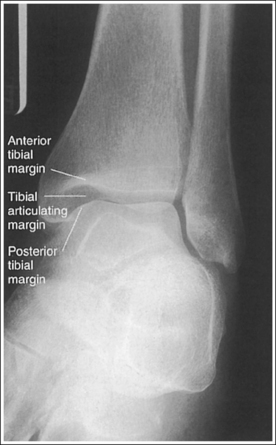
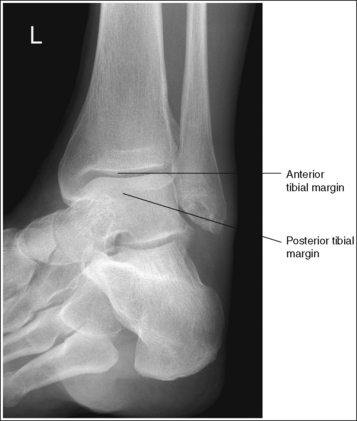
• Evaluating the openness of the tibiotalar joint. On an AP ankle projection, determine whether an open joint was obtained and whether the tibia is demonstrated without foreshortening by evaluating the anterior and posterior margins of the distal tibia. On an AP ankle projection with accurate positioning, the anterior margin is demonstrated approximately 0.125 inch (3 mm) proximally to the posterior margin (see Figure 6-48). If the proximal lower leg was elevated or the central ray was centered proximal to the tibiotalar joint, the anterior tibial margin is projected distally, resulting in a narrowed or obscured tibiotalar joint space (see Image 34). If the distal lower leg was elevated or the central ray was centered distal to the tibiotalar joint, the anterior tibial margin is projected more proximally to the posterior margin than on an AP ankle projection, expanding the tibiotalar joint space and demonstrating the tibial articulating surface (see Image 35).
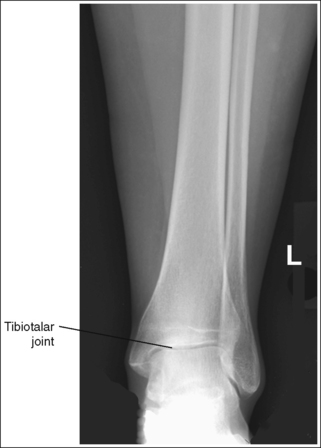
IMAGE 34
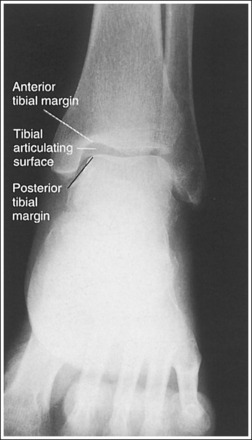
IMAGE 35
• Effect of foot positioning on tibiotalar joint visualization. The position of the foot also determines how well the tibiotalar joint space is demonstrated. The patient's foot should be placed vertically, with its long axis positioned at a 90-degree angle with the lower leg. When the AP ankle projection is taken with the foot dorsiflexed, the trochlear surface of the talus is wedged into the anterior tibial region, resulting in a narrower appearing joint space. If the foot is plantar-flexed, the calcaneus is moved proximally, beneath the body of the talus, resulting in talocalcaneal superimposition and possibly hindering visualization of the talar trochlear surface.
The tibiotalar joint space is at the center of the exposure field. The distal fourth of the tibia and fibula, the talus, and the surrounding ankle soft tissue are included within the collimated field.
• To place the tibiotalar joint in the center of the image, center a perpendicular central ray to the ankle midway between the malleoli. The medial malleolus is located at the same level as the tibiotalar joint space. Open the longitudinal collimation to include the calcaneus and one fourth of the distal lower leg. Transverse collimation should be to within 0.5 inch (1.25 cm) of the ankle skin line.
• Either half of a 10- × 12-inch (24- × 30-cm) detailed screen-film IR placed crosswise or a single 8- × 10-inch (18- × 24-cm) digital IR placed lengthwise should be adequate to include all the required anatomic structures.
Anteroposterior Ankle Projection Analysis
The ankle was not placed in an AP projection. The medial mortise is obscured, the tibia and talus demonstrate increased superimposition of the fibula, and the posterior aspect of the medial malleolus is situated medial to the anterior aspect. The ankle was externally rotated.
Analysis
The ankle was not placed in an AP projection. The fibula is demonstrated without talar superimposition. The ankle was internally rotated.
Analysis
The tibiotalar joint is closed. The anterior tibial margin has been projected into the joint space. Either the proximal tibia was elevated because of knee flexion, or the central ray was centered proximal to the tibiotalar joint.
Correction
Extend the knee, lowering the proximal tibia until the lower leg is parallel with the IR, or center the central ray to the tibiotalar joint (located at the level of the medial malleolus).
ANKLE: ANTEROPOSTERIOR OBLIQUE PROJECTION (MEDIAL ROTATION)
See Figures 6-49, 6-50, and 6-51 and Box 6-11.
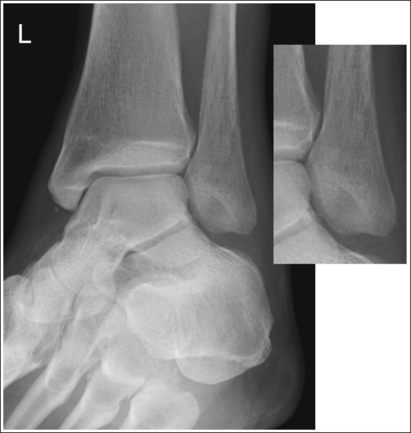
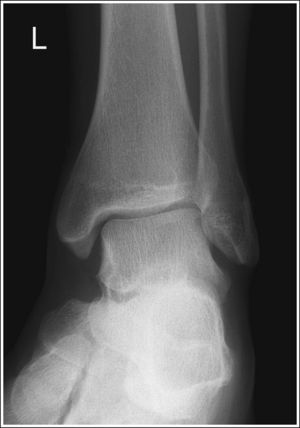
Mortise (15 to 20 degrees oblique): The ankle demonstrates 15 to 20 degrees of obliquity. The distal fibula is demonstrated without talar superimposition, demonstrating an open lateral mortise (talofibular joint), and the lateral and medial malleoli are in profile. The fibula demonstrates slight (0.125 inch [33 mm]) tibial superimposition.
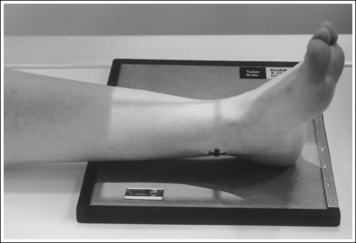
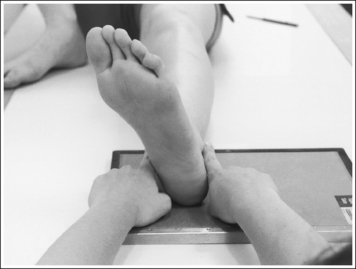
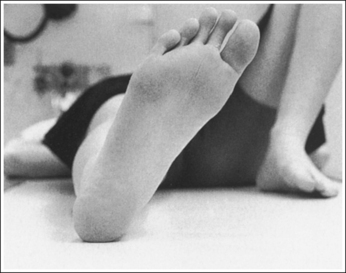
• To obtain a mortise AP oblique ankle projection with accurate positioning, place the patient in a supine AP projection with the leg extended and the foot positioned vertically (Figure 6-52). The leg and foot are then rotated the desired amount. Make certain that the foot does not invert during rotation. While viewing the plantar surface of the foot, place your index fingers on the most prominent aspects of the lateral and the medial malleoli. Rotate the patient's entire leg internally (medially) 15 to 20 degrees, until your index fingers and the malleoli are positioned at equal distances from the IR (Figure 6-53). An imaginary line drawn between the malleoli (intermalleolar plane) is then aligned parallel with the IR. This rotation moves the fibula away from the talus to demonstrate an open lateral mortise.
• Identifying poor ankle and leg rotation. If the ankle and leg are internally rotated less than the needed 15 to 20 degrees, the medial mortise will be open while the lateral mortise will be closed (see Image 36). If the ankle was internally rotated more than 15 to 20 degrees, the image will demonstrate a closed medial mortise and decreased tibial superimposition of the fibula or an open tibiofibular joint, depending on the degree of increased rotation (see Image 37).
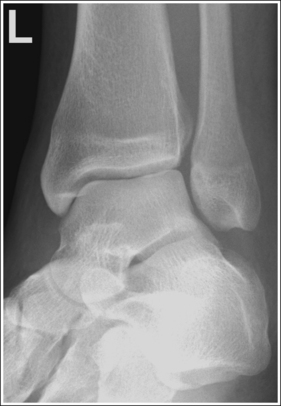
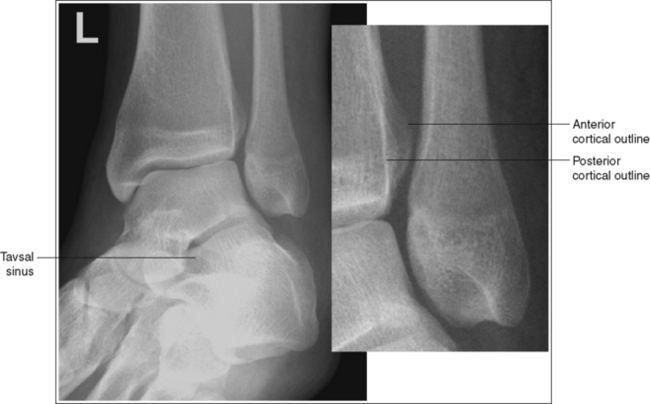
The ankle demonstrates 45 degrees of obliquity. The lateral mortise is partially closed, the anterior and posterior cortical outlines of the lateral tibia are superimposed, visualizing the fibula without tibial superimposition, and the tarsal sinus is demonstrated. Whether or not there is an open space between the tibia and fibula on this image will depend on how closely aligned the two structures are with each other (compare the superimposition of the anterior and posterior cortical outlines of the lateral tibia and the openness of the tibiotalar joint spaces in Figures 6-50 and 6-51).
• To obtain a 45-degree AP oblique ankle projection with accurate positioning, place the patient in a supine AP projection, with the leg extended and the foot positioned vertically. The leg and foot are then internally rotated until the long axis of the foot is aligned 45 degrees with the IR (Figure 6-54).
• Identifying poor ankle and leg rotation. If the ankle and leg are internally rotated less than 45 degrees, the anterior cortical outline of the lateral tibia will be lateral to the posterior cortical outline of the lateral tibia (see Image 38). If the ankle and leg are internally rotated slightly more than 45 degrees, the anterior cortical outline of the lateral tibia will be medial to the posterior cortical outline of the lateral tibia.
The tibiotalar joint space is open, and the tibia is demonstrated without foreshortening.
• The tibiotalar joint space is open and the tibia is demonstrated without foreshortening when the patient's lower leg was positioned parallel with the IR and the central ray was centered at the level of the tibiotalar joint (see Figure 6-52).
• Evaluating the openness of the tibiotalar joint. On an AP oblique ankle projection, you can determine whether the positioning and central ray alignment goals have been met by evaluating the anterior and posterior margins of the distal tibia. On an AP oblique ankle projection with accurate positioning, the anterior margin should be visualized approximately 0.125 inch (3 mm) proximal to the posterior margin. If the proximal lower leg was elevated or the central ray was centered proximal to the tibiotalar joint, the anterior tibial margin is projected distally, resulting in a narrowed or obscured tibiotalar joint. If the patient's distal lower leg was elevated or the central ray was centered distal to the tibiotalar joint, the anterior tibial margin is projected too far proximal to the posterior margin, expanding the tibiotalar joint space and demonstrating the tibial articulating surface (see Images 39 and 40).
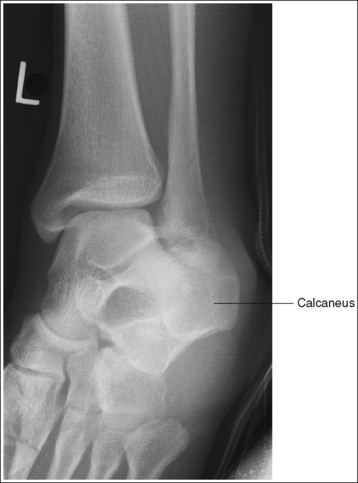
The calcaneus is demonstrated distal to the lateral mortise and fibula.
• To position the calcaneus distal to the lateral mortise and fibula, place the foot in a neutral position by positioning its long axis at a 90-degree angle with the lower leg. If the foot was plantar-flexed for an AP oblique projection, the calcaneus obscures the distal aspect of the lateral mortise and the distal fibula (see Images 41 and 42).
The tibiotalar joint space is at the center of the exposure field. The distal fourth of the fibula and tibia, the talus, and the surrounding ankle soft tissue are included within the collimated field.
• To place the tibiotalar joint in the center of the image, center a perpendicular central ray to the ankle midway between the malleoli. The medial malleolus is located at the same level as the tibiotalar joint space. Open the longitudinal collimation to include the calcaneus and one fourth of the distal lower leg. Transverse collimation should be to within 0.5 inch (1.25 cm) of the ankle skin line.
• Either half of a 10- × 12-inch (24- × 30-cm) detailed screen-film IR placed crosswise or a single 8- × 10-inch (18- × 24-cm) digital IR placed lengthwise should be adequate to include all the required anatomic structures.
Anteroposterior Oblique Ankle Projection Analysis
The lateral mortise (talofibular joint) is closed, and the medial mortise is partially open. The tarsal sinus is not visible. The patient's leg and ankle were not internally rotated enough.
Correction
Rotate the entire leg internally until the most prominent aspects of the lateral and medial malleoli are positioned at equal distances from the IR, as shown in Figure 6-53.
Analysis
The medial mortise is closed and there is no tibial superimposition of the fibula. The image was obtained with more than 15 to 20 degrees of leg and ankle obliquity.
Correction
Externally rotate the leg and ankle until the medial and lateral malleoli are positioned at equal distances from the IR.
Analysis
The lateral and medial mortises are open and the tibia superimposes a portion of the fibula. The tarsi sinus is not demonstrated. The patient's leg and ankle were rotated less than 45 degrees.
Correction
Rotate the leg and foot internally until the long axis of the foot is at a 45-degree angle with the IR.
Analysis
The tibiotalar joint space is expanded. The anterior tibial margin has been projected proximal to the posterior margin, and the tibial articulating surface is demonstrated. Either the distal tibia was elevated or the central ray was centered distal to the tibiotalar joint.
Correction
Depress the distal tibia or elevate the proximal tibia until the lower leg is placed parallel with the IR, or center the central ray to the tibiotalar joint at the level of the medial malleolus.
Analysis
The calcaneus is obscuring the distal aspect of the lateral mortise and distal fibula. The foot was in plantar flexion when the image was taken.
ANKLE: LATERAL PROJECTION (MEDIOLATERAL)
See Figure 6-55 and Box 6-12.
Contrast and density are adequate to demonstrate the anterior pretalar and posterior pericapsular fat pads on the foot and ankle.
• Fat pads on the ankle. Two soft tissue structures located around the ankle may indicate joint effusion and injury—the anterior pretalar fat pad and the posterior pericapsular fat pad. The anterior pretalar fat pad is demonstrated anterior to the ankle joint and rests next to the neck of the talus (Figure 6-56). The posterior fat pad, positioned within the indentation formed by the articulation of the posterior tibia and talar bones (see Figure 6-56), is displaced in the same manner as the anterior pretalar fat pad, although it is less sensitive and requires more fluid evasion to be displaced.

The ankle is in a lateral projection. The domes of the talus are superimposed, the tibiotalar joint is open, and the distal fibula is superimposed by the posterior half of the distal tibia.
• To obtain a lateral ankle projection, begin with the patient in a supine position, with the leg extended (Figure 6-57) and the foot dorsiflexed until its long axis forms a 90-degree angle with the lower leg. Rotate the patient and affected leg until the lateral foot surface is against the IR, and then adjust the degree of rotation until the surface is aligned parallel with the IR (Figure 6-58). For most patients, this positioning places the lower leg parallel with the imaging table. If this is not the case, as with a patient with a large upper thigh, the foot and IR should be elevated until the lower leg is parallel with the imaging table.

• Effect of lower leg positioning on talar dome superimposition. Often, if the knee is not fully extended (Figure 6-59) or if the distal tibia is not elevated to place the lower leg parallel with the IR in a patient with large upper thighs, the proximal tibia is positioned farther from the imaging table than the distal tibia. The resulting image demonstrates the lateral talar dome proximal to the medial talar dome and the height of the longitudinal arch appears less than it actually is because the cuboid shifts anteriorly and the navicular bone moves posteriorly in this position and the talocalcaneal joint will be narrowed (see Image 43). If the distal tibia is positioned farther from the table than the proximal tibia, the medial talar dome is demonstrated proximal to the lateral dome, and the height of the longitudinal arch appears greater than it actually is because the cuboid shifts posteriorly and the navicular bone moves anteriorly in this position and the talocalcaneal joint will be widened (see Image 44). When viewing a lateral ankle projection that demonstrates one of the talar domes proximal to the other, evaluate the height of the longitudinal arch and the degree of talocalcaneal joint visualization to determine which dome is the proximal dome. If the navicular bone is superimposed over more of the cuboid than expected and a narrowed talocalcaneal joint is seen, the lateral dome is the proximal dome. If the navicular bone is superimposed over less of the cuboid than expected and a wider talocalcaneal joint is seen, the medial dome is the proximal dome.
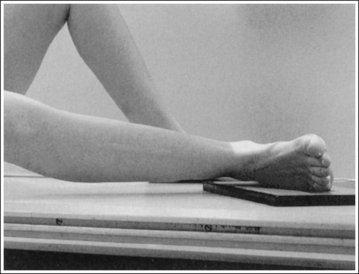
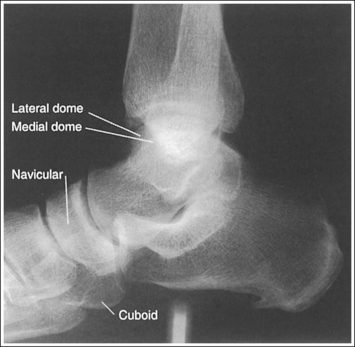
IMAGE 43
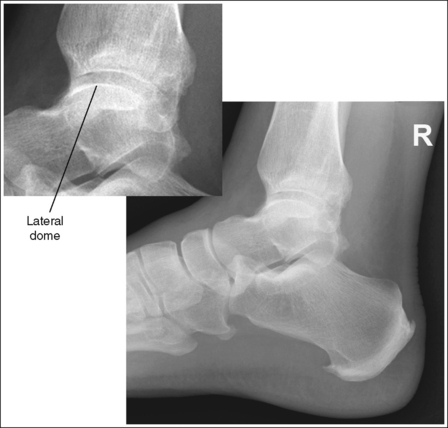
IMAGE 44
• Effect of foot positioning on talar dome superimposition. To demonstrate accurate AP alignment of the talar domes, position the lateral surface of the foot parallel with the IR. If this surface is not parallel with the IR, the talar domes are demonstrated one anterior to the other. When the leg is rotated more than needed to place the lateral foot surface parallel with the IR (leg externally rotated), as shown in Figure 6-60, the medial talar dome is demonstrated anterior to the lateral talar dome (see Image 45). If the leg is not rotated enough to place the lateral foot surface parallel with the IR (leg internally rotated), as shown in Figure 6-61, the medial talar dome is demonstrated posterior to the lateral talar dome (see Image 46). When taking a lateral ankle projection that demonstrates one of the talar domes anterior to the other, observe the position of the fibula in relation to the tibia to determine how the patient should be repositioned. On most lateral ankle projections with accurate positioning, the fibula is positioned in the posterior half of the tibia. On a lateral projection with poor positioning, if the fibula is demonstrated more posteriorly, the medial dome is anterior and the patient was positioned with the forefoot depressed and the heel elevated (leg externally rotated), as shown in Figure 6-60. If the fibula is demonstrated more anteriorly, the medial domes are posterior and the patient was positioned with the forefoot elevated and the heel depressed (leg internally rotated), as shown in Figure 6-61.


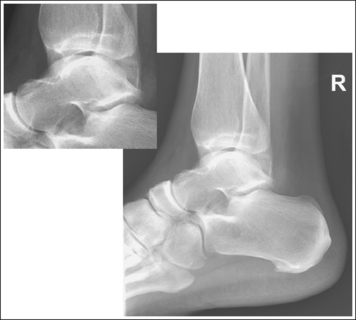
IMAGE 45
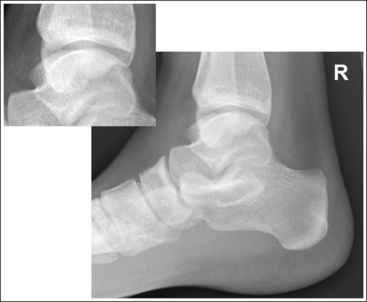
IMAGE 46
The long axis of the foot is positioned at a 90-degree angle with the lower leg.
• In most cases, when the patient is relaxed, the foot rests in plantar flexion. Plantar flexion results in a forced flattening of the anterior pretalar fat pad, reducing its usefulness in the detection of joint effusion (see Image 47). Consequently, it is best to dorsiflex the patient's foot, placing its long axis at a 90-degree angle with the lower leg. This positioning also places the tibiotalar joint in a neutral position and helps prevent the leg from rolling too far anteriorly. Anterior foot rotation elevates the heel and rotates the foot.
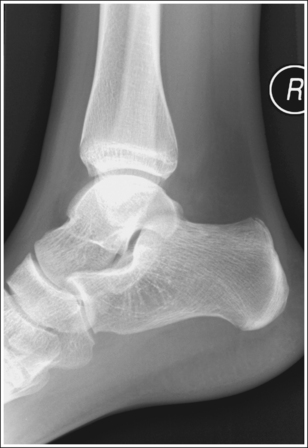
IMAGE 47
The tibiotalar joint is at the center of the exposure field. The talus, 1 inch (2.5 cm) of the fifth metatarsal base, the surrounding ankle soft tissue, and the distal fourth of the fibula and tibia are included within the collimated field.
• Centering a perpendicular central ray to the ankle midline at the level of the palpable medial malleolus places the tibiotalar joint in the center of the collimated field (Figure 6-62).
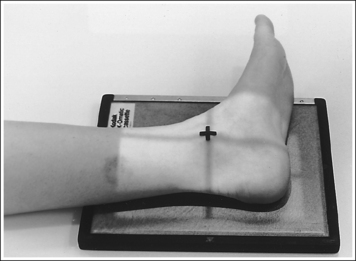
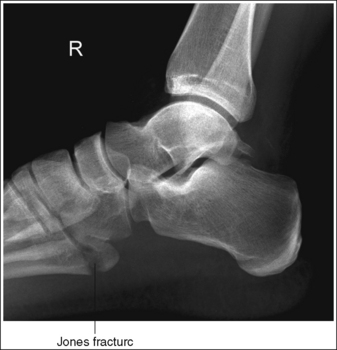
• Open the longitudinal collimation enough to include the calcaneus and one fourth of the distal tibia and fibula. Transversely collimate to include 3 inches (7.5 cm) of the proximal forefoot, ensuring that approximately 1 inch (2.5 cm) of the fifth metatarsal base is included on the image. An inversion injury of the foot and ankle may result in a fracture of the fifth metatarsal base, known as a Jones fracture (Figure 6-63). Including the fifth metatarsal base on the lateral ankle projection allows it to be evaluated for a Jones fracture.
• Either half of a 10- × 12-inch (24- × 30-cm) detailed screen-film IR placed crosswise or a single 8- × 10-inch (18- × 24-cm) computed radiography IR placed lengthwise should be adequate to include all the required anatomic structures.
Lateral Ankle Projection Analysis
The tibiotalar joint space is obscured, and one talar dome is demonstrated proximal to the other dome. Because the navicular bone is superimposed over most of the cuboid, and the talocalcaneal joint will be narrowed, the lateral dome is the proximal dome. The proximal tibia was elevated, as shown in Figure 6-59.
Correction
Extend the knee to position the lower leg parallel with the IR, as shown in Figure 6-57. If the knee was extended for this image, elevate the lower leg until it is positioned parallel with the IR.
Analysis
The tibiotalar joint space is obscured, and one talar dome is demonstrated proximal to the other dome. Because more than 0.5 inch (1.25 cm) of cuboid is visible posterior to the navicular bone and the talocalcaneal joint is widened, the medial dome is the proximal dome. The distal tibia was elevated.
Analysis
The medial talar dome is positioned anterior to the lateral talar dome, as indicated by the posterior position of the fibula on the tibia. The lateral foot surface was not positioned parallel with the IR. The patient's forefoot was depressed and the heel elevated (leg externally rotated), as shown in Figure 6-60.
Correction
Elevate the patient's forefoot, and depress the heel (internally rotate the leg) until the lateral foot surface is parallel with the IR, as shown in Figure 6-58.
Analysis
The medial talar dome is positioned posterior to the lateral dome, as indicated by the anterior position of the distal fibula on the tibia. The lateral foot surface was positioned not parallel with the IR, but with the forefoot elevated and the heel depressed (leg internally rotated), as shown in Figure 6-61.
Correction
Depress the forefoot and elevate the heel (externally rotate the leg) until the lateral foot surface is positioned parallel with the IR, as shown in Figure 6-58.