Chapter 48 Gas Transport in the Blood
1. A small amount of oxygen is transported in solution in plasma, but most is in combination with hemoglobin.
2. A molecule of hemoglobin can reversibly combine with four molecules of oxygen.
3. The binding of oxygen and hemoglobin is determined by oxygen tension.
4. The oxyhemoglobin dissociation curve can be displayed with percent saturation of hemoglobin as a function of oxygen tension.
5. The affinity of hemoglobin for oxygen varies with blood temperature, pH, carbon dioxide tension, and the intracellular concentration of certain organic phosphates.
6. As hemoglobin is depleted of oxygen, its color changes from bright red to bluish red.
7. Carbon monoxide has 200 times the affinity of oxygen for hemoglobin.
8. Methemoglobinemia occurs in certain toxic states, notably nitrite poisoning.
OXYGEN TRANSPORT
A Small Amount of Oxygen Is Transported in Solution in Plasma, but Most Is in Combination with Hemoglobin
Oxygen is poorly soluble in water and therefore in plasma. Because of this low solubility, most animals need an oxygen-carrying pigment to transport sufficient oxygen to the tissues. The only animals that can exist without hemoglobin live deep in the ocean in the cold parts of the world. The depth at which they live results in a high ambient pressure and thus a high oxygen tension (Po2). In addition, the cold environment results in a low metabolic rate and therefore little need for oxygen. The high Po2 and low oxygen demand enable them to exist without an oxygen-carrying pigment. All land-dwelling animals seen by veterinarians have such a pigment, and in mammals and birds, that pigment is hemoglobin.
When blood in the pulmonary capillaries flows past the alveoli, oxygen diffuses from the alveoli into the blood until the partial pressures (tensions) equilibrate: that is, there is no further driving pressure difference. Because oxygen is poorly soluble in water, only a very small amount dissolves in the plasma, and hemoglobin is necessary for delivery of sufficient oxygen to the tissues. Without hemoglobin, which transports the majority of the oxygen, the cardiac output would have to be inordinately high to maintain the oxygen supply to the body organs.
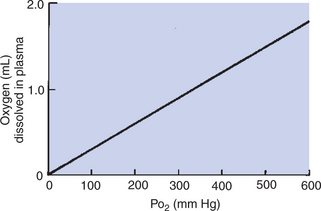
Even though the amount of oxygen dissolved in plasma is small, it increases directly as the partial pressure of oxygen increases; 0.003 mL of oxygen dissolves in each 100 mL (1 dL) of plasma at an oxygen tension (Po2) of 1 mm Hg (Figure 48-1). The pulmonary capillary blood equilibrates with the alveolar oxygen tension (PAo2) of 100 mm Hg; therefore, 0.3 mL of oxygen dissolves in each deciliter of blood. If an animal breathes pure oxygen so that the PAo2 increases to approximately 600 mm Hg, 1.8 mL of oxygen dissolves in each deciliter of plasma.
A Molecule of Hemoglobin Can Reversibly Combine with Four Molecules of Oxygen
Mammalian hemoglobin consists of four units, each containing one heme and its associated protein (globin). Globin is a polypeptide composed of 140 to 150 amino acids. Heme is a protoporphyrin consisting of four pyrroles with a ferrous iron at the center. Each ferrous iron can combine reversibly with a single molecule of oxygen. The complete hemoglobin molecule has four hemes each with its associated globin and thus can combine reversibly with up to four molecules of oxygen. The type and sequence of amino acids that compose globin are critical to oxygen binding. Without the presence of globin, oxygen would irreversibly oxidize the ferrous iron to ferric iron. The amino acids in globin cradle the heme and limit access of oxygen to the ferrous iron. This prevents oxidation and allows uptake and release of oxygen in response to local Po2.The type and sequence of amino acids that compose globin define the different types of mammalian hemoglobin. Adult hemoglobin contains two alpha (α) and two beta (β) amino acid chains; fetal hemoglobin contains two α and two gamma (γ) chains. Closely related species, such as humans and anthropoid apes, have similar amino acid sequences on the side chains, whereas more divergent species have more differences in amino acid sequences.
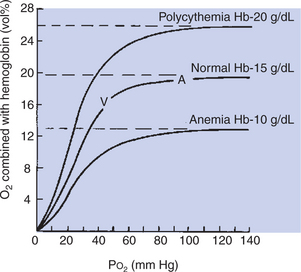
Each hemoglobin molecule can reversibly bind up to four molecules of oxygen, one with each heme. The reversible combination of oxygen with hemoglobin is shown in the oxyhemoglobin dissociation curve (Figure 48-2). The binding of oxygen is a four-step process, and the oxygen affinity of a particular heme is influenced by the oxygenation of the others. This means that when the first heme unit is oxygenated, oxygen affinity of the second heme unit is increased, and so on. These heme-heme interactions are responsible for the sigmoid shape of the oxyhemoglobin dissociation curve.
The Binding of Oxygen and Hemoglobin Is Determined by Oxygen Tension
Figure 48-2 shows that the oxygen content of blood—that is, the amount of oxygen combined with hemoglobin—is determined by Po2. At a Po2 of more than approximately 70 mm Hg, the oxyhemoglobin dissociation curve is virtually flat, which indicates that further increases in Po2 add little oxygen to hemoglobin. At this point, the hemoglobin is saturated with oxygen because each iron atom is associated with an oxygen molecule. The fact that hemoglobin becomes virtually saturated with oxygen at a Po2 of more than 70 mm Hg has important clinical consequences. Many animals live at altitudes considerably above sea level, where the lower barometric pressure results in a low PIo2 (inspired oxygen tension). Although these animals have a lower Pao2 (arterial oxygen tension) than their sea-level–dwelling counterparts, they are still able to transport sufficient oxygen to their tissues because their hemoglobin is well saturated with oxygen. Clearly, at extreme altitudes, hemoglobin begins to desaturate.
One gram of saturated hemoglobin can hold 1.36 to 1.39 mL of oxygen; therefore, average mammalian blood with 10 to 15 g of hemoglobin per deciliter has an oxygen capacity of 13.6 to 21 mL of oxygen per deciliter (volume percentage [vol%]) when hemoglobin is saturated with oxygen. The oxygen capacity of the blood is the maximal amount of oxygen that can be carried in the blood at any given time. Anemia, a reduction in the number of circulating erythrocytes (red blood cells) with a consequent reduction in the amount of hemoglobin in the blood, decreases oxygen capacity. When the hemoglobin content of blood increases, oxygen capacity increases as well. The latter occurs during exercise; contraction of the spleen forces more erythrocytes into the circulation. More erythrocytes than normal in the blood is known as polycythemia, and these red blood cells increase the oxygen capacity of the blood.
When the Po2 is less than 60 mm Hg, the oxyhemoglobin dissociation curve has a steep slope. This is in the range of tissue Po2 at which oxygen is unloaded from the blood. Tissue Po2 varies in accordance with the blood flow/metabolism ratio, but average tissue Po2 is 40 mm Hg. Blood exposed to such a Po2 loses 25% of its oxygen to the tissues. In rapidly metabolizing tissues in which tissue Po2 is lower, more oxygen is unloaded from the blood. The oxygen remaining in combination with hemoglobin forms a reserve that can be tapped in emergencies.
Oxygen content is a term that describes the amount of oxygen in the blood, most bound to hemoglobin. When hemoglobin is saturated with oxygen, oxygen content and oxygen capacity are equal. When oxygen leaves the blood in the tissues, oxygen content decreases, but the oxygen capacity remains the same.
The Oxyhemoglobin Dissociation Curve Can Be Displayed with Percent Saturation of Hemoglobin as a Function of Oxygen Tension
Percent saturation of hemoglobin is the ratio of oxygen content to oxygen capacity. Hemoglobin is more than 95% saturated with oxygen when it leaves the lungs of an animal at sea level. Percent saturation of mixed venous blood averages 75%; venous oxygen tension (P–vo2) averages 40 mm Hg. Although all mammals have similarly shaped oxyhemoglobin dissociation curves, the position of the curve with regard to Po2 varies (Figure 48-3). This can be described by measurement of P50, the partial pressure at which hemoglobin is 50% saturated with oxygen. A higher P50 is generally found in small mammals and allows unloading of oxygen at a high Po2 to satisfy their higher metabolic demands.
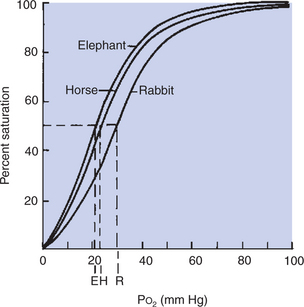
FIGURE 48-3 Oxyhemoglobin dissociation curve of three species of mammal. Percent saturation of hemoglobin is plotted as a function of oxygen tension (Po2). Although the curves have similar shapes in all mammals, they are not superimposed. The differences between the curves can be expressed by the partial pressure (tension) at which hemoglobin is 50% saturated with oxygen (P50). P50 for each species is indicated as E (elephant), H (horse), and R (rabbit).
The Affinity of Hemoglobin for Oxygen Varies with Blood Temperature, pH, Carbon Dioxide Tension, and the Intracellular Concentration of Certain Organic Phosphates
An increase in tissue metabolism produces heat, which elevates blood temperature and shifts the oxyhemoglobin dissociation curve to the right (increases P50). Such a shift facilitates dissociation of oxygen from hemoglobin and releases oxygen to the tissues; hemoglobin is then said to have “less affinity” for oxygen. Conversely, excessive cooling of the blood, as occurs in hypothermia, shifts the dissociation curve to the left. Because of this increased affinity of hemoglobin for oxygen, tissue Po2 must be lower than usual to release oxygen from hemoglobin.
Changes in carbon dioxide tension (Pco2) and pH also affect the affinity of hemoglobin for oxygen. The shift in the oxyhemoglobin dissociation curve resulting from a change in Pco2 is called the Bohr shift. This shift results in part from the combination of carbon dioxide with hemoglobin, but mostly from the production of hydrogen ions, which decrease the pH. A change in pH alters the oxygen binding by changing the structure of hemoglobin. As a result, a higher, more alkaline pH shifts the oxyhemoglobin dissociation curve to the left, and a lower, more acidic pH shifts the curve to the right (Figure 48-4). The Bohr effect is not constant among species; a given change in pH produces a greater shift in the dissociation curve for small mammals than for large mammals, supposedly ensuring the delivery of oxygen during high rates of metabolic activity, when carbon dioxide production is greatest.
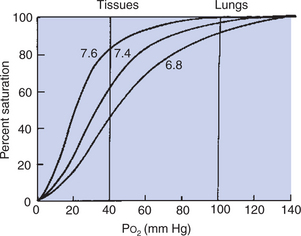
FIGURE 48-4 Effect of pH on the oxyhemoglobin dissociation curve. A decrease in pH shifts the dissociation curve to the right and therefore assists in unloading oxygen at the tissues. The shift in the dissociation curve has much less effect on the percent saturation of hemoglobin when oxygen is being loaded into the blood in the lungs (i.e., Po2 = 100 mm Hg) than when oxygen is being unloaded in the tissues (i.e., Po2 = 40 mm Hg).
A solution of mammalian hemoglobin generally has a lower affinity for oxygen than does whole blood until organic phosphates, such as 2,3-diphosphoglycerate (2,3-DPG) and adenosine triphosphate (ATP), are added to the solution. In erythrocytes, DPG has a molar content equivalent to that of hemoglobin, much higher than in other cells. This DPG regulates the combination of oxygen with hemoglobin. When concentrations of DPG are high, as occurs under the anaerobic conditions imposed by altitude or anemia, the oxyhemoglobin dissociation curve is shifted to the right (P50 increases), and the unloading of oxygen is facilitated. In contrast, a reduction in DPG levels, as can occur in stored blood, shifts the dissociation curve to the left. Not all forms of hemoglobin bind DPG equally. Ruminant hemoglobin in general is unresponsive to DPG; elephant hemoglobin binds DPG weakly; and some forms of fetal hemoglobin do not bind DPG.
As Hemoglobin Is Depleted of Oxygen, Its Color Changes from Bright Red to Bluish Red
The change in the color of hemoglobin from bright red to the bluish red is known as cyanosis. It is observed in the mucous membranes of animals when the blood in the underlying capillaries is hypoxic. Cyanosis can result from deficient oxygen uptake in the lungs, but it can also result from reduced blood flow to the peripheral tissues. The latter can occur when animals are in cardiovascular failure.
The color change that occurs as hemoglobin loses its oxygen is the basis of oximetry. Oximeters use differences in light absorption to distinguish oxygenated and deoxygenated hemoglobin. A pulse oximeter is a clinical tool that can be attached to an ear or the lips of anesthetized animals to measure the hemoglobin saturation of arterial blood.
Carbon Monoxide Has 200 Times the Affinity of Oxygen for Hemoglobin
Carbon monoxide (CO) and oxygen bind to the same sites on hemoglobin, but CO is bound much more avidly. As a result of the high affinity of CO for hemoglobin, exposure to CO levels of less than 1% in air can eventually saturate hemoglobin and displace oxygen, leading to death. Fortunately, such low levels of CO must be breathed for some time to deliver sufficient CO to saturate all the blood hemoglobin, so toxic effects are not immediate. CO not only reduces the oxygen content of the blood, but also displaces the oxyhemoglobin dissociation curve to the left. This shift indicates that with the onset of CO poisoning, hemoglobin has a higher affinity for the remaining bound oxygen; thus the release of oxygen into the tissues occurs at a tissue Po2 much lower than normal. Treatment of CO poisoning requires removal of the CO source and administration of oxygen to displace the carbon monoxide from hemoglobin.
Methemoglobinemia Occurs in Certain Toxic States, Notably Nitrite Poisoning
When the normal ferrous iron of hemoglobin is oxidized by nitrites and other toxins to ferric iron, brown-colored methemoglobin is formed. Methemoglobin does not bind oxygen; thus the oxygen capacity of the blood is reduced. Nitrite can be ingested directly from spoiled feeds, but ruminants more often form nitrite in the rumen after ingestion of nitrate-rich feeds such as Sudan grass and mangel tops. An enzyme, methemoglobin reductase, which is present in erythrocytes to reduce the normally small amounts of methemoglobin back to hemoglobin, is inadequate in the presence of excessive oxidation, so therapy must be provided.
CARBON DIOXIDE TRANSPORT
Carbon Dioxide Is Transported in the Blood Both in Solution in Plasma and in Chemical Combination
Unlike oxygen, which is bound only to hemoglobin, carbon dioxide (CO2) is transported in several forms (Figure 48-5). Carbon dioxide is produced in the tissue; therefore tissue Pco2 is higher than the Pco2 of the blood arriving in the capillaries. CO2 diffuses down a concentration gradient from the tissues into the blood. When the blood leaves the tissues, Pco2 has risen from 40 to approximately 46 mm Hg, with exact values depending on the ratio of blood flow to metabolism.
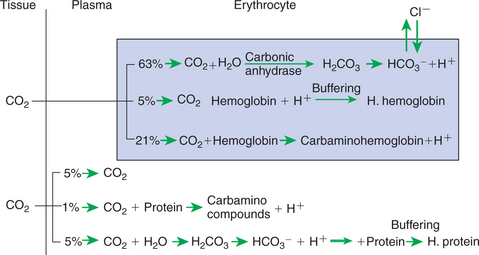
FIGURE 48-5 Forms of carbon dioxide (CO2) transport in the blood. All reactions displayed in this diagram can be reversed when the blood reaches the lung and CO2 diffuses into the alveolus. H2CO3, Carbonic acid; HCO3–, bicarbonate.
Approximately 5% of the CO2 entering the blood is transported in solution. The majority of CO2 diffuses into the erythrocyte, where it undergoes one of two chemical reactions. Most of the CO2 combines with water and forms carbonic acid (H2CO3), which then dissociates into bicarbonate (HCO3−) and hydrogen ion (H+), as follows:

This reaction also occurs in plasma, but in the erythrocyte, the presence of carbonic anhydrase accelerates the hydration of CO2 several hundred–fold. Ionization of H2CO3 occurs rapidly, and H+ and HCO3− accumulate within the erythrocyte. The reversible reaction is kept moving to the right because H+ is buffered by hemoglobin. Most of the HCO3− that is produced in the erythrocyte diffuses out along a concentration gradient into the plasma. Chloride ion (Cl−) diffuses into the erythrocyte to maintain the Gibbs-Donnan equilibrium.
The addition of CO2 to capillary blood is facilitated by the deoxygenation of hemoglobin occurring in the tissues. Deoxyhemoglobin is a weaker acid than oxyhemoglobin and therefore a better buffer. Thus it combines more readily with H+ and facilitates the formation of HCO3– from CO2.
The carbamino compounds are the second form in which CO2 is transported in the blood. Carbamino compounds are formed by coupling of CO2 to the −NH groups of proteins, particularly hemoglobin. Although carbamino compounds account for only 15% to 20% of the total CO2 content of the blood, they are responsible for 20% to 30% of the CO2 exchange between the tissues and the lungs.
When venous blood reaches the lungs, CO2 diffuses into the alveoli from plasma and erythrocytes, thus causing the reactions shown in Figure 48-5 to move to the left. Simultaneously, the oxygenation of hemoglobin releases H+ ions, which combine with HCO3– to form H2CO3 and thus CO2.
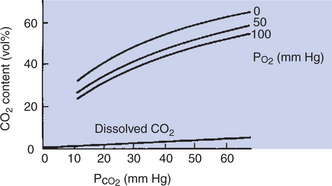
The blood content of carbon dioxide as a function of Pco2 is depicted in the CO2 equilibrium curves shown in Figure 48-6. Curves are shown for oxygenated blood (Po2 = 100 mm Hg), for partially deoxygenated blood (Po2 = 50), and for deoxygenated blood (Po2 = 0). The curves are almost linear and have no plateau in the physiological range; CO2 can be added to the blood as long as the buffering capacity is available. The higher CO2 content of deoxygenated blood resulting from the higher buffering capacity of deoxyhemoglobin is clearly visible.
GAS TRANSPORT DURING EXERCISE
Oxygen Demands of Exercise Are Met by Increases in Blood Flow, in Hemoglobin Levels, and in Oxygen Extraction from Blood
The demands for gas transport in the blood are not constant but vary with metabolism. Strenuous exercise represents the most extreme demand placed on the gas transport mechanisms. In the galloping horse, oxygen consumption can increase 30-fold. Figure 48-7 shows how this extra demand for oxygen is met. Part of the demand is provided by an increase in cardiac output, which causes the amount of blood flowing through the lungs per minute to increase. This allows an increased uptake of oxygen from the lungs. The cardiac output also is redistributed, with an increased fraction of output going to the exercising muscles. The increase in cardiac output and redistribution increases muscle blood flow by 20-fold.
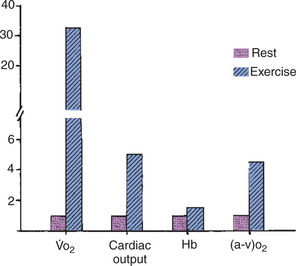
FIGURE 48-7 Oxygen consumption ( o2), cardiac output, hemoglobin level (Hb), and arteriovenous oxygen difference [(a-v)o2] in a horse at rest and during strenuous exercise at a gallop. The 30-fold increase in o2 is accomplished by a fivefold increase in cardiac output, a 50% increase in Hb, and a fourfold increase in (a-v)o2.
The horse also meets the increased oxygen demand with an increase in the number of circulating erythrocytes, and therefore an increased amount of hemoglobin. Contraction of the spleen forces stored erythrocytes into the circulation and can increase the hematocrit from 35% to 50%. This provides almost 50% more binding sites for oxygen, which raises the oxygen capacity of the blood. The usefulness of an increase in hematocrit is limited because it increases blood viscosity, which tends to slow the flow of blood through the capillaries and increase the work of the heart. The increase in muscle blood flow and hematocrit together increase the delivery of oxygen to the muscle. An exercising muscle extracts a larger percentage of the oxygen from the blood than does a muscle at rest. This is accomplished as follows: (1) the diffusion gradient for oxygen is increased by the decrease in muscle Po2, which results from the increase in metabolic rate, and (2) the affinity of hemoglobin for oxygen is decreased by the higher temperature of the exercising muscle and by the lower pH that results from release of carbon dioxide and hydrogen ions from the muscle. As a result of the increased extraction of oxygen, the arteriovenous oxygen content difference is increased.
Muscle itself contains an oxygen-binding pigment, myoglobin, which provides a small store of oxygen. However, myoglobin’s main function is the transfer of oxygen within the muscle cell. Myoglobin, like hemoglobin, is an iron-containing pigment, but unlike hemoglobin, it contains only one heme group. As a result, the dissociation curve is not sigmoid but is a rectangular hyperbola. The affinity of myoglobin for oxygen is high, with 75% saturation at a Po2 of 20 mm Hg, and the steepest slope of the dissociation curve at Po2 equaling 5 mm Hg. As a result of these dissociation characteristics, myoglobin releases oxygen only when intracellular Po2 is low. Myoglobin is more plentiful in slow-twitch aerobic muscle fibers than in fast-twitch fibers, and the amount of myoglobin is increased by exercise training.
Thus, in exercise the increased demand for oxygen is met by increases in blood flow, hematocrit, oxygen extraction from blood, and to a small degree by oxygen release from myoglobin. These mechanisms are available whenever unusual demands for gas exchange arise. In anemia, for example, oxygen capacity is reduced, but oxygen delivery to the tissues can be preserved somewhat by an increase in cardiac output and increased extraction of oxygen from the hemoglobin.
The respiratory system’s role in acid-base balance is discussed in Chapter 52.
CLINICAL CORRELATIONS
Flea Infestation in a Cat
History.
A cat is presented to you because the owner notices that the cat seems extremely weak and recently has been staggering when it walks around the house. The cat’s appetite is good, and besides the weakness, the owner thinks the cat is normal.
Clinical Examination.
Inspection of the animal, which is resting quietly on the examination table, shows that it is in reasonably good condition. The respiratory rate does not appear to be elevated, and from a distance the cat shows no obvious signs of disease. When you place your hands on the cat’s back, you immediately notice a gritty material in the fur. Further examination of the skin shows accumulations of this red-brown material deep within the coat, and you notice many fleas scurrying around when the coat is parted. When you moisten some of the gritty material, it produces a red liquid. The cat’s mucous membranes are almost white, and the examination of the mucous membranes produces sufficient struggling that the cat begins to breathe rapidly. The cat’s pulse rate is extremely elevated, but the lung sounds are normal. On physical examination, all the body systems appear to be normal. You take a blood sample; the packed cell volume (hematocrit) is 10% (normal, 30%-45%).
Comment.
This cat has a severe infestation of fleas. The gritty material in the fur is flea feces, which contains blood products that become red when wet. The infestation is further confirmed by the observation of many fleas in the coat. By their blood-sucking method of feeding, fleas can produce anemia when they are present in large numbers, as with this cat. If the flea infestation develops gradually, the anemia is slow in onset, and the host animal may show few clinical signs until the infestation and anemia become severe. The anemia is confirmed in this case by the paleness of the mucous membranes and by the low hematocrit. The rapid heart rate of the cat is a response to the anemia. To deliver sufficient oxygen to the tissues, the cardiac output needed to be increased by increasing the heart rate. When the cat is stressed by your examination, it shows signs of respiratory distress because there is inadequate oxygen delivery to the tissues; this causes production of lactic acid as a result of anaerobic metabolism. The resultant decrease in pH stimulates the chemoreceptors, causing the signs of respiratory distress.
Treatment.
Your treatment approach to this cat is twofold. First, you administer blood to increase the cat’s hematocrit and provide it with sufficient oxygen-carrying capacity until it can generate new erythrocytes. Second, you treat the flea infestation and instruct the owner on how to remove the fleas from the house.
Several weeks later the owner returns with the cat and notes that she has had no further problems. Occasionally she notes a flea on the cat’s coat and treats the cat immediately with flea medication. She is also diligent about regular vacuuming to remove fleas from the house.
Atrial Fibrillation in a Horse
History.
The owner of a 3-year-old Standardbred gelding is concerned because the horse is no longer able to complete its training program. Up until a week ago, the horse had been running well during its daily bouts of training. In the past 2 days, the horse has been extremely reluctant to exercise and, if pushed to do so, begins to stagger and appears weak in the rear legs.
Clinical Examination.
Inspection of the horse reveals a normal-appearing Standardbred in excellent condition. It is standing in its box stall, eating, and looks alert when you enter the stall. Clinical examination reveals normal-colored mucous membranes, no abnormality of lung sounds, and no abnormalities in the gastrointestinal, urinary, or nervous system. When you take the pulse, you note that it is irregular in both amplitude and rate. Several pulses follow one another rapidly, and then there are prolonged pauses, with no consistent pattern to the irregularity. Auscultation of the heart reveals a similar irregularity in the heart sounds.
You take a blood sample for measurement of the hematocrit, which is normal. You also obtain an electrocardiogram (ECG), which reveals a continuous irregular pattern of multiple P waves with occasional and irregularly occurring QRS complexes.
Comment.
The history, heart rhythm, and ECG findings in this horse are typical of atrial fibrillation. The multiple P waves observed on the ECG are a result of circuitous depolarization of the atria. In atrial fibrillation the atria contract and relax in an uncoordinated manner. The atrioventricular node is activated at intervals that vary considerably from cycle to cycle; thus there is no constant interval between ventricular contractions. The variable time between ventricular contractions allows for variable degrees of ventricular filling and therefore results in uneven stroke volume; consequently, the pulse varies in amplitude as well as frequency.
The irregular ventricular rhythm may be sufficient to maintain cardiac output in the resting animal, but during exercise the cardiac output cannot be maintained. As a result, oxygen delivery to the muscles is inadequate to sustain exercise. This is an example of a failure of oxygen delivery resulting from inadequate blood flow.
Treatment.
Treatment for atrial fibrillation in the horse is the administration of quinidine sulfate, which has a negative inotropic effect on the myocardium and slows atrioventricular conduction time. This allows the reestablishment of normal atrial and ventricular rhythm. The horse’s heart rate will likely return to normal with treatment if there is no underlying cardiac disease. The horse is rested for at least a week, at which time training is reinstituted. Several months later the owner reports that the horse is still doing well.
This horse is a young adult, with no evidence of cardiac disease (e.g., murmur, signs of heart failure). Treating a horse with underlying cardiac disease has associated risks, and the horse may not return to normal heart rhythm. Therefore, in most cases, an echocardiogram is recommended before treatment to determine that the horse has no underlying cardiac disease. If present, any disease should be addressed first. In some horses the underlying disease is more significant, and treatment of fibrillation will not be attempted.
Bartels H. Comparative physiology of oxygen transport in mammals. Lancet. 1964;2:599.
Boron WF. Transport of oxygen and carbon dioxide in the blood. Boron WF, Boulpaep EL. Medical physiology: a cellular and molecular approach, updated edition, Philadelphia, Philadelphia: Saunders, 2005.
Hlastala MP, Berger AJ. Physiology of respiration, ed 2. New York: Oxford University Press, 2001.
Kitchen H, Brett I. Embryonic and fetal hemoglobin in animals. Ann NY Acad Sci. 1974;241:653.
Leff AR, Schumacker PT. Respiratory physiology: basics and applications. Philadelphia: Saunders, 1983.
Lekeux P, Art T. The respiratory system: anatomy, physiology and adaptations to exercise and training. In: Hodgson DR, Rose RJ. The athletic horse. Philadelphia: Saunders, 1994.
Prosser CL. Respiratory functions of blood. Prosser CL, ed. Comparative animal physiology, ed 3, Philadelphia: Saunders, 1973.
PRACTICE QUESTIONS
1. If 1 g of hemoglobin has an oxygen capacity of 1.36 mL of oxygen, what is the oxygen content of blood containing 10 g of hemoglobin when the blood Po2 is 70 mm Hg?
2. An increase in pH of blood will:
3. Which of the following decreases oxygen content but does not alter Pao2 or percentage saturation of hemoglobin?
4. All the following shift the oxyhemoglobin dissociation curve to the right except:
5. Quantitatively, the most important form of carbon dioxide (CO2) transport is:
6. Oxygenation of hemoglobin in the lungs assists with the release of CO2 from the blood because: