CHAPTER 42 Diagnostic Tests for the Urinary System
RENAL EXCRETORY FUNCTION
GLOMERULAR FILTRATION RATE
Blood urea nitrogen (BUN) and creatinine concentrations provide a crude index of the glomerular filtration rate (GFR). However, inasmuch as the creatinine concentration is influenced by fewer extrarenal variables and creatinine is not resorbed by the renal tubules, the serum creatinine concentration is a better index of GFR than is the BUN. Nevertheless, azotemia resulting from impaired renal function is not detectable until approximately three fourths of the nephrons in both kidneys are nonfunctional. This percentage may be even higher in dogs and cats with chronic progressive renal disease because the remaining viable nephrons often undergo compensatory hypertrophy. Therefore renal clearance and measurement of GFR can provide more accurate information about renal excretory function than the serum creatinine and BUN concentrations, especially early in renal disease, before three fourths of the nephrons have been destroyed.
Renal clearance is the rate at which a substance is completely cleared from a certain volume of plasma. Substances used to measure renal clearance must be freely filtered by the glomerulus (not protein-bound) and not affected by tubular resorption or secretion or by metabolism elsewhere in the body. In addition, the substance used must not alter renal function. The renal clearance of inulin is the gold standard method of determining GFR, but it is difficult to measure the inulin concentration in plasma and urine. On the other hand, it is relatively easy to determine the renal clearance of creatinine and therefore more practical. The renal clearance of creatinine can be calculated by multiplying the concentration of creatinine in urine by the rate of urine production and then dividing the product by the serum concentration of creatinine, as follows:

For example, if the urine creatinine concentration is 60 mg/dl, urine production is 3 ml/min, and the serum creatinine concentration is 1.8 mg/dl, 100 ml of plasma is cleared of creatinine per minute. This value is divided by the animal’s body weight in kilograms and expressed in milliliters per minute per kilogram. Note that prerenal and postrenal factors, as well as renal parenchymal lesions, influence plasma clearance.
The GFR can be calculated using the clearance of either endogenous or exogenous creatinine. Endogenous creatinine clearance, however, requires urine collection for a lengthy period (i.e., 24 hours) to minimize errors in the collection, thus necessitating the use of indwelling catheters, repeated urinary catheterization, or the use of metabolism cages for urine collection. Endogenous creatinine clearance can be used in the clinical setting to evaluate renal excretory function if renal dysfunction is suspected, but the serum urea nitrogen and creatinine concentrations are within normal ranges. In early renal disease, a relatively large decline in GFR results in small changes in serum creatinine concentrations within the normal range. Less commonly, endogenous creatinine clearance can be used to better quantify renal excretory function in animals with azotemia because in advanced renal disease relatively large changes in serum creatinine concentrations are accompanied by much smaller decreases in GFR. A serum sample obtained approximately midway through the urine collection period and a well-mixed aliquot from the 24-hour urine sample are used to measure creatinine concentrations. The volume of urine collected is divided by 1440, the number of minutes in 24 hours (Box 42-1). One drawback to this method, however, is the fact that noncreatinine chromogens present in the serum falsely increase serum creatinine concentrations if the standard alkaline picrate method of analysis is used, especially when serum creatinine concentrations are within the normal range or only mildly increased. In fact, noncreatinine chromogens can account for as much as 50% of the total amount of chromagens in animals with serum creatinine concentrations within normal ranges. Because noncreatinine chromogens are not excreted in the urine, the calculated endogenous creatinine clearance can be falsely decreased. Despite this problem, endogenous creatinine clearance has been shown to closely approximate inulin clearance in dogs and cats. Normal values for endogenous creatinine clearance in the dog and cat are 2.8 to 3.7 and 2 to 3 ml/min/kg, respectively.
 BOX 42-1 Calculation of Endogenous Creatinine Clearance, 24-Hour Urine Protein Excretion, and Urine Protein/Creatinine Ratio
Data
24-hour urine volume = 400 ml (4.0 dl)
Urine protein concentration = 650 mg/dl
Urine creatinine concentration = 110 mg/dl
The clearance of exogenous creatinine can be determined over a relatively short period, and because the serum creatinine concentration is considerably increased, the effect of noncreatinine chromogens is largely negated. Measurement of exogenous creatinine clearance is most appropriate in nonazotemic animals. Initially, a constant intravenous infusion of creatinine was used in the test; however, research has shown that a single subcutaneous injection of 100 mg of creatinine per kilogram of body weight (Sigma Chemicals, St. Louis, Missouri) can be used instead. Urine is collected for 20 minutes, starting 40 minutes after the injection, and serum samples are obtained at the start and end of the collection period (the average of the two serum creatinine concentrations is used to calculate creatinine clearance). Because of the short collection period, it is important to rinse the bladder with a sterile saline solution at the start and end of the collection. To increase the accuracy of this technique, two 20-minute clearances can be calculated and averaged. Normal exogenous creatinine clearance values are 3.5 to 4.5 ml/min/kg in dogs and 2.4 to 3.3 ml/min/kg in cats.
Plasma clearance of iohexol, an iodinated radiographic contrast agent, has been shown to reliably estimate GFR in dogs and cats. Because calculation of iohexol clearance does not require urine collection, the procedure is less labor intensive and invasive compared with creatinine clearance. Iohexol plasma clearance can be performed in dogs and cats that are well hydrated and fasted for 12 hours before the study. Iohexol (e.g., Omnipaque 240 mg I/ml, available from GE Healthcare, Inc., Princeton, NJ) is administered intravenously at the dosage of 300 mg iodine/kg body weight. Blood samples are collected at 2, 3, and 4 hours after the intravenous (IV) injection. Serum from each blood sample is harvested (approximated 1.5 ml of serum is needed per sample) and then shipped either chilled or frozen to the university teaching hospital or specialized reference laboratory (e.g., Diagnostic Center for Population and Animal Health, Toxicology Section, Michigan State University).
Renal scintigraphy using technetium 99m–labeled diethylenetriaminepentaacetic acid also allows the GFR to be evaluated and is available at several universities and major referral centers. This is a quick, noninvasive method that does not require urinary catheterization and has the advantage of being able to quantitatively evaluate individual kidney function. Disadvantages of this procedure include its limited availability, exposure of the animal to radioisotopes, the need for radioisotope disposal, and poorer correlation with inulin clearance when compared with plasma clearance techniques such as that used with iohexol.
FRACTIONAL CLEARANCE
The clearance of various solutes in the urine may be compared with the clearance of creatinine in the urine to assess the degree of tubular resorption or secretion. Because the renal clearance of creatinine is relatively constant over time, expressing the renal clearance of a solute as a percentage of the clearance of creatinine gauges the body’s attempt to conserve or excrete the solute. The fractional clearance (FC) of a solute is the quotient of the urine : serum solute ratio divided by the urine : serum creatinine ratio ([UrineS : SerumS]/[UrineCr : SerumCr]). A timed urine collection is not necessary to determine the FC of a solute. Some solutes, including glucose and amino acids, are normally highly conserved, whereas electrolytes such as sodium, chloride, potassium, calcium, and phosphorus are variably conserved. In normal dogs and cats the FCs of sodium, chloride, and calcium are less than 1%; however, the FCs of potassium and phosphorus are more variable and may be as high as 20% and 39%, respectively. Examples of situations in which a knowledge of the FC of electrolytes may be helpful include (1) the diagnosis of primary hyperparathyroidism, in which the FC of phosphorus is increased; (2) the diagnosis of tubular dysfunction, such as Fanconi’s syndrome, in which the FCs of all electrolytes are increased; and (3) the differentiation of prerenal azotemia, in which the FC of sodium is decreased, from acute renal failure, in which the FC of sodium is increased (>2%; see Table 41-3). In many cases, however, the correlation between spot urine sample and 24-hour urine sample FC is poor. In addition, the amount of dietary intake of the electrolyte in question can influence results, and there tends to be large intrapatient and interpatient variation in results. Moreover, the FC may also be breed dependent; for example, FC of most electrolytes is significantly different in Greyhounds than in other dog breeds. For these reasons, the clinical usefulness of FC of electrolytes is limited.
QUANTIFICATION OF PROTEINURIA
If the results of the dipstick or sulfosalicylic acid test for proteinuria (see Chapter 41) indicate the presence of persistent proteinuria and the urine sediment examination findings are normal (i.e., renal proteinuria is suspected), urine protein excretion should be quantified. This helps in evaluating the severity of renal lesions and assessing the response to treatment or the progression of disease. The trichloroacetic acid-N-Ponceau S, Coomassie brilliant blue, or benzethonium chloride tests are the most common methods used to quantify urine protein and are available at referral centers and reference laboratories.
The urine protein : creatinine ratio in canine and feline urine samples has been shown to accurately reflect the quantity of protein excreted in the urine over a 24-hour period. Both urine creatinine and urine protein concentrations are affected by urine volume and urine concentration, but the ratio of the urine protein to urine creatinine is not. This allows quantitation of proteinuria without the need to collect a timed urine sample, and therefore the test has greatly facilitated the diagnosis of kidney disease in small animals. A urine protein : creatinine ratio of less than 0.4 and less than 0.5 is considered normal in cats and dogs, respectively. A complete urinalysis should always be performed before or along with determination of the urine protein : creatinine ratio because hematuria or pyuria may indicate the presence of nonglomerular proteinuria. If there is evidence of inflammation (e.g., pyuria, bacteriuria), the protein concentration should be measured again after successful treatment of the inflammatory disorder. The urine protein : creatinine ratio cannot be used to differentiate between renal proteinuria and proteinuria associated with lower urinary tract inflammation or hemorrhage. The urine protein:creatinine ratio provides a noninvasive way to follow progression of disease or response to treatment. The variation in urine protein : creatinine observed in dogs with stable proteinuria suggests that the ratio should differ by 80%, especially with lower range proteinuria, in order to conclude that a significant change has occurred. In cats the urine protein : creatinine variation within the reference range suggests that the ratio should differ by 90% to conclude that a significant increase or decrease in proteinuria has occurred. Typically, quantitative measurement of urine protein and creatinine (mg/dl) is performed at reference laboratories and teaching hospitals; however, in-house quantitative urine protein : creatinine measurement has recently become available (Idexx VetTest Chemistry Analyzer, IDEXX Laboratories, Westbrook, Maine), and results appear to correlate well with standard quantitative methodologies.
Antigen capture enzyme-linked immunosorbent assays (ELISA) used to detect low levels of albumin in canine and feline urine (microalbuminuria [MA]) are commercially available (E.R.D.-Screen, Heska Corp., Fort Collins, Colorado). MA is usually defined as a urine albumin concentration between 1.0 and 30 mg/dl. These are concentrations too low to be routinely detected by standard dipstick screening tests. It is interesting to note that the presence of MA has been shown to be an accurate predictor of subsequent renal disease in human beings with both systemic hypertension and diabetes mellitus, and it has also been observed in human beings with systemic diseases that are associated with glomerulopathy. Studies in dogs have shown the prevalence of MA in apparently healthy dogs and Soft Coated Wheaten Terriers genetically predisposed to developing glomerular disease to be 19% and 76%, respectively (Jensen et al., 2001; Vaden et al., 2001). In additional studies, development of MA preceded the development of overt albuminuria in dogs with experimentally induced heartworm disease (Grauer et al., 2002) and in dogs with X-linked hereditary nephropathy (Lees et al., 2002). MA testing should be used when conventional screening tests for proteinuria are negative and increased sensitivity is desired (e.g., screening for early kidney disease in young animals that may have heritable kidney disease or screening for acquired chronic kidney disease in older animals). A positive MA test of suspected renal origin should be pursued with a three-step paradigm of (1) monitoring, (2) investigating, and (3) intervening. The initial step of monitoring involves determining if the albuminuria is persistent or transient. It is important to note that the sensitivity of MA assays makes it likely that some positive results will be caused by benign or physiologic proteinuria. In these cases, follow-up assays should be negative, confirming that the MA was transient. Transient MA is likely to be of little or no consequence. On the other hand, persistent proteinuria/albuminuria of renal origin indicates the presence of kidney disease. Persistent proteinuria/albuminuria can be defined as positive test results on ≥2 occasions, ≥2 weeks apart. Because persistent proteinuria/albuminuria can be constant or increase or decrease in magnitude over time, monitoring should use quantitative methods to determine disease trends and/or response to treatment. Quantitative albuminuria assays or the urine protein/creatinine ratio are used to document changes in the magnitude of the albuminuria once its persistence has been confirmed. Changes in the magnitude of proteinuria should always be interpreted in light of the patient’s serum creatinine concentration because albuminuria may decrease in association with progressive renal disease as the number of functional nephrons decrease. Decreasing albuminuria in the face of a stable serum creatinine concentration suggests improvement in renal function, whereas decreasing albuminuria in the face of an increasing serum creatinine suggests disease progression.
Once persistent proteinuria has been documented by monitoring, the appropriate response depends on the magnitude of the proteinuria and the health status of the patient (e.g., the presence or absence of azotemia and/or hypertension). The second step of investigation refers to performing new or additional tests to diagnose an underlying/concurrent infectious, inflammatory, or neoplastic disease process or to more completely define the patient’s renal disease. Examples of such further investigation may include a complete minimum database, urine culture, measurement of blood pressure, serology for immune-mediated or infectious diseases, radiographs/ultrasound, and renal biopsy.
In cases of persistent proteinuria, where an underlying disorder cannot be identified or treated, the need for treatment of the proteinuria depends on its magnitude and the presence or absence of azotemia. In the absence of azotemia, proteinuria resulting in urine protein : creatinine ratios>1.0 to 3.0 should be treated, whereas continued monitoring and patient investigation should be the primary focus in cases with lesser-magnitude proteinuria. Treatment recommendations in these cases usually include decreased dietary protein intake (early renal failure diets), n-3 fatty acid supplementation (early renal failure diets), low-dose aspirin (0.5 mg/kg q24h administered orally), and angiotensin-converting enzyme (ACE) inhibitors (e.g., enalapril, benazepril; 0.5 to 1.0 mg/kg q24h administered orally), although it is difficult to separate the effects of individual treatments when they are used in combination. Treatment for persistent proteinuria in azotemic dogs and cats should be initiated when the urine protein:creatinine ratio is ≥0.5 and 0.4, respectively. Treatment recommendations in this case usually include ACE inhibition and renal failure diets.
Urine and serum protein electrophoresis may help in identifying the source of the proteinuria and in establishing a prognosis. For example, proteinuria associated with hemorrhage into the urinary tract has an electrophoretic pattern very similar to that of serum. Early glomerular damage usually results principally in albuminuria; however, as the glomerular disease progresses, an increasing amount of globulin may be lost as well. Marked hypoalbuminemia and increased concentrations of larger–molecular-weight proteins in the serum indicate the presence of severe glomerular proteinuria and the nephrotic syndrome.
PLASMA AND URINE OSMOLALITY, WATER DEPRIVATION TEST, AND RESPONSE TO EXOGENOUS ANTIDIURETIC HORMONE
Measurement of plasma osmolality may aid in the determination of the primary component of the polydipsia/polyuria (PD/PU) syndrome. Normal plasma osmolality in dogs and cats is 280 to 310 mOsm/kg. Plasma osmolality in animals with primary PD is usually low (275 to 285 mOsm/kg), reflecting the dilutional effect of excessive water consumption. In contrast, animals with a primary PU often have high plasma osmolalities (305 to 315 mOsm/kg) because of their inability to concentrate urine and the resultant dehydration (see Fig. 41-9). However, there can also be considerable overlap in randomly obtained plasma osmolalities between animals with primary polydipsic disorders and those with primary polyuric disorders.
Determination of a urine : plasma osmolality ratio allows a more precise determination of urine concentration than does urine specific gravity alone because specific gravity measures the density of urine rather than the number of particles in solution. For example, moderate-to-marked glucosuria or proteinuria increases urine specific gravity more than the urine osmolality. In response to dehydration, normal dogs and cats should be able to form urine that is five to six times more concentrated than plasma. Plasma and urine osmolality may be determined using either a vapor pressure or freezing point depression osmometer, and measurement is available at a reasonable cost at most veterinary teaching hospitals and reference laboratories.
Water deprivation causes dehydration and plasma hyperosmolality and allows the neurohypophyseal-renal axis to be evaluated. Water deprivation tests are used to differentiate diabetes insipidus from primary PD and should be performed only after other causes of PU and PD have been ruled out on the basis of the findings from physical examination and a minimum database. It should be noted that water deprivation tests are potentially dangerous. They should therefore be performed only under close observation and after water intake has been gradually reduced (see later discussion) because failure to produce concentrated urine (i.e., diabetes insipidus) may result in severe dehydration and potential ischemic renal injury. Increases in plasma osmolality of 1% to 2% above normal levels stimulate the release of antidiuretic hormone (ADH), and normal kidneys should respond to this ADH by producing hypersthenuric urine. The water deprivation test is complete when the animal loses 5% of its body weight as a result of dehydration, becomes azotemic, becomes hyperosmolemic (plasma osmolality ≥320 mOsm/kg), or produces hypersthenuric urine (specific gravity ≥1.030 in dogs or ≥1.035 in cats). It is important to obtain accurate baseline values and ensure that the bladder is emptied each time the urine specific gravity or osmolality is measured so that urine produced between evaluations is not diluted by previously formed urine. Plasma osmolality constitutes a good measure of hydration status during water deprivation, and, in fact, a water deprivation test may not be necessary if it is measured at baseline. The finding of a baseline plasma osmolality of 320 mOsm/kg or greater in a clinically nondehydrated dog or cat with hyposthenuria or isosthenuria indicates a failure of the neurohypophyseal-renal axis. Similarly, a water deprivation test should not be performed in an animal that is clinically dehydrated or azotemic and that has hyposthenuria, isosthenuria, or minimally concentrated urine because these conditions already demonstrate a failure of the neurohypophyseal-renal axis. The time it takes to reach the end-point of a water deprivation test is variable; small dogs and cats may dehydrate within several hours, whereas significant dehydration may not occur in large dogs for 36 to 48 hours. Animals that fail to produce hypersthenuric urine in response to water deprivation have either pituitary or nephrogenic diabetes insipidus.
A pharmacologic dose of ADH may be administered to differentiate pituitary diabetes insipidus (lack of ADH) from nephrogenic diabetes insipidus (no response to ADH). Aqueous ADH (3 to 5 U given intramuscularly) is commonly used for diagnostic testing, although synthetic desmopressin acetate nasal spray, given as drops in the conjunctival sac, or an injectable preparation of desmopressin acetate, given subcutaneously (3 to 5 U), may also be used. The ADH should be administered immediately at the end-point of the water deprivation test, before water is made available, in animals that do not respond to water deprivation. It is important that the bladder be empty immediately before the administration of ADH so that the urine produced in response to ADH is not diluted by previously formed urine. Animals with central diabetes insipidus (CDI) usually respond by producing urine that is hypersthenuric or at least ≥1.025 within 1 to 2 hours. The absence of an increase in urine specific gravity in response to both water deprivation and exogenous ADH administration indicates the presence of nephrogenic diabetes insipidus (NDI).
Renal medullary hypertonicity may be lost after prolonged PU (primary or secondary). Therefore medullary washout may develop in animals with primary PD or CDI, making them appear to have NDI. Water intake may be gradually reduced over 10 to 14 days to correct renal medullary washout before the water deprivation test is performed. In addition to gradually limiting the dog’s or cat’s water intake (10% reduction every other day until the animal is drinking 80 to 90 ml/kg/day), a high-protein diet that is lightly salted (unless the patient is hypertensive) should be fed to the animal to facilitate reestablishment of normal medullary tonicity. Water restriction should be discontinued if the animal becomes overly aggressive in its desire for water or becomes lethargic or weak. The response to water deprivation and, if necessary, the response to exogenous ADH should be evaluated after 10 to 14 days of this gradual water deprivation. The lack of a response to water deprivation and exogenous ADH administration after gradual water reduction suggests that NDI unrelated to medullary washout is the cause of the PD/PU.
BLADDER AND URETHRAL FUNCTION
Several specialized diagnostic tests, including urethral pressure profilometry, cystometry, and uroflowmetry, may help categorize bladder and urethral function in dogs and cats with disorders of micturition. These tests are available at many referral centers. The urethral pressure profile (UPP) assesses the perfusion pressure or minimal distention pressure within the bladder and urethra during the storage phase of micturition. The functional urethral length (the length of the urethra that has a pressure greater than the intravesical pressure) and the functional urethral closure pressure (the greatest urethral pressure minus the intravesical pressure) can be determined on the basis of a UPP. Electromyography may be combined with a UPP to define the portion of urethral resistance contributed to by periurethral striated muscle (external sphincter). The UPP can be used to assess urethral sphincter tone in animals with suspected urethral sphincter incompetence or functional urethral obstruction and urethral spasm. In addition, the UPP can be used to evaluate sphincter response to treatment with α-adrenergic drugs or estrogens. Finally, the UPP should be determined preoperatively to evaluate urethral sphincter function in dogs and cats with ectopic ureters or vaginal strictures because of the increased incidence of sphincter incompetence in animals with these congenital anomalies. A cystometrogram records changes in intravesical pressure during bladder filling and detrusor contraction. It evaluates the detrusor reflex, maximal detrusor contraction pressure, and bladder capacity and compliance in animals with suspected detrusor atony, instability, and decreased capacity or compliance. Uroflowmetry measures urine flow during the voiding phase of micturition and defines the relationship between urine flow and detrusor contraction. The presence of normal, increased, or decreased urethral resistance can be established with uroflowmetry.
BACTERIAL ANTIBIOTIC SENSITIVITY TESTING
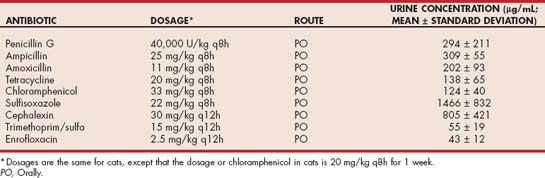
The majority of simple, uncomplicated urinary tract infections in female dogs can be effectively treated with an antibiotic chosen on the basis of urine sediment Gram staining or culture and sensitivity based on the disk-diffusion/Kirby Bauer method. If disk-diffusion sensitivity testing shows that the organism is highly resistant to antibiotics (e.g., susceptible only to aminoglycosides), minimum inhibitory concentration (MIC) sensitivity testing can be helpful because of differences in the serum and urine concentrations of antibiotics. In these cases, in vivo sensitivity may exist even though disk-diffusion sensitivity testing has shown in vitro resistance. For example, the MICs of penicillin for staphylococcal organisms, including penicillinase-producing strains, are approximately 10 μg/ml. The average urine concentration of ampicillin, when given in standard doses orally, exceeds 300 μg/ml, whereas the expected serum concentration is only 1 to 2 μg/ml. The general rule of thumb in interpreting MICs is that if the MIC is 25% or less of the expected mean urine concentration (Table 42-1), the organism should be susceptible. However, MIC sensitivity should not be used in animals with pyelonephritis, prostatitis, or bladder infections with a thickened bladder wall because drug concentrations in these tissues will be closer to serum concentrations than to urine concentrations.
DIAGNOSTIC IMAGING
It is relatively difficult to visualize the entire outline of both kidneys on plain abdominal radiographs; the right kidney is usually more difficult to visualize than the left because of its close association with the caudate lobe of the liver. It is even more difficult to visualize the kidneys in thin or emaciated animals because the contrast provided by abdominal fat is lacking. Plain abdominal radiographs are valuable to evaluate kidney number, location, size, shape, and radiographic density (Table 42-2). Kidney size is best estimated by comparing kidney length with the length of adjacent lumbar vertebrae; the kidneys should be approximately equivalent to 2.5 to 3 times the length of the second lumbar vertebra in cats and 2.5 to 3.5 times the length of the second lumbar vertebra in dogs. Canine kidneys are generally bean shaped, whereas feline kidneys are more spherical. The right kidney is approximately one-half length cranial to the left kidney in both cats and dogs, and the kidneys of cats are more movable than those of dogs. Kidneys have a soft tissue or water density throughout and are more dense than the perirenal fat. Any radiopacity within the kidney is abnormal (Fig. 42-1).
TABLE 42-2 Imaging Procedure and Potential Findings in Cats and Dogs with Urinary Disorders
| PROCEDURE | POTENTIAL FINDINGS |
|---|---|
| Plain abdominal radiography | |
| Renal ultrasonography | |
| Excretory urography | |
| Contrast-enhanced cystography | |
| Bladder ultrasonography | |
| Contrast-enhanced urethrography |
* May be observed in normal dogs.
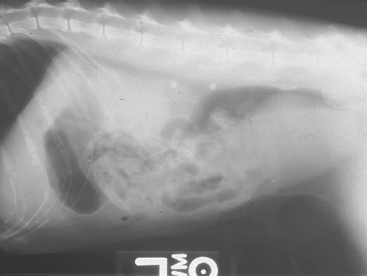
FIG 42-1 Plain film radiographic appearance of bilateral renal calculi in a cat.
(Courtesy Dr. Phillip Steyn, Colorado State University, Fort Collins, Colo.)
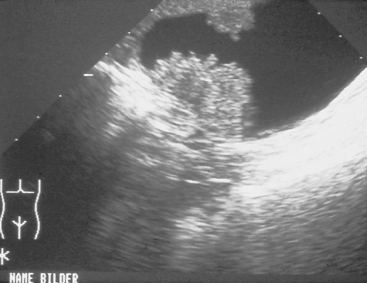
Ultrasonography is used to evaluate renal tissue architecture if kidney abnormalities have been detected by physical examination (e.g., abnormal kidney size or shape), clinicopathologic findings (e.g., azotemia or proteinuria), or survey radiographs (e.g., abnormal kidney size, shape, or opacity or nonvisualization of a kidney). Ultrasonography can provide information about the tissue architecture of the kidneys. Normally, the renal cortex is hypoechoic compared with the spleen, and the renal medulla is hypoechoic compared with the cortex (Fig. 42-2). The renal pelvis and diverticula are relatively hyperechoic. Relatively hypoechoic renal cortices can be observed in patients with acute tubular necrosis, polycystic kidney disease, abscesses, or renal edema associated with acute renal failure. Conversely, relatively hyperechoic renal cortices are associated with chronic kidney disease (CKD), nephrocalcinosis, amyloidosis, feline infectious peritonitis, and calcium oxalate nephrosis secondary to ethylene glycol ingestion. Glomerular and tubulointerstitial disease can show a normal or hyperechoic echotexture depending on chronicity. Renal lymphoma can make the renal cortices appear hypoechoic or hyperechoic (Fig. 42-3). Hydronephrosis and hydroureters are easily and noninvasively diagnosed on the basis of ultrasonographic findings (Fig. 42-4). Resistance to renal blood flow (resistive index), which can be calculated with the use of color flow Doppler imaging, is increased in association with several renal diseases.
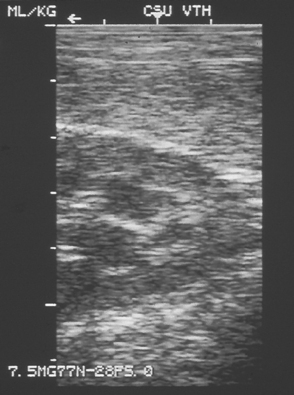
FIG 42-2 Ultrasonographic images of the kidney and spleen in a dog showing the increased echogenicity of the spleen (upper right) compared with the renal cortex.
(Courtesy Dr. Robert Wrigley, Colorado State University, Fort Collins, Colo.)
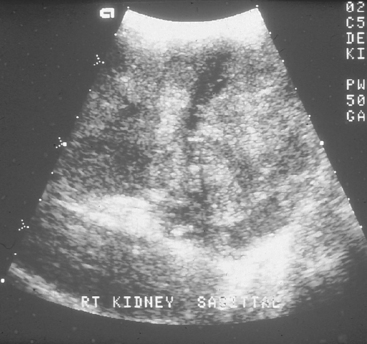
FIG 42-3 Ultrasonographic image of a feline kidney with lymphoma.
(Courtesy Dr. Phillip Steyn, Colorado State University, Fort Collins, Colo.)
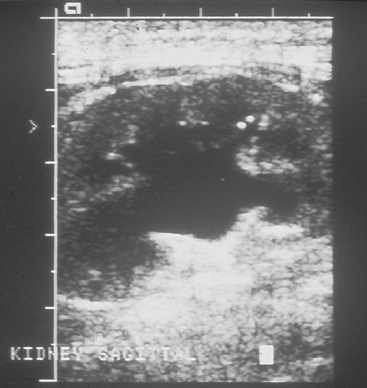
FIG 42-4 Ultrasonographic image of a hydronephrotic kidney.
(Courtesy Dr. Phillip Steyn, Colorado State University, Fort Collins, Colo.)
An intravenous urogram (Box 42-2) can also aid in the evaluation of renal structures, specifically the renal vessels, parenchyma, and pelvis, as well as the ureters (Fig. 42-5). Potential indications for IV urography include kidney abnormalities noted on plain radiographs or ultrasonograms, inability to visualize one or both kidneys on plain radiographs or ultrasonograms, and hematuria of suspected renal origin. In addition, IV urography qualitatively assesses individual kidney excretory function; therefore it should be performed before nephrectomy or nephrotomy if other means of assessing GFR are not available. The utility of IV urography diminishes if azotemia exists, and good renal opacification becomes more difficult as azotemia increases. IV urography should be avoided in dehydrated animals and in those receiving potentially nephrotoxic drugs.
BOX 42-2 Technique for Intravenous Urography
No food for 24 hours; water available, free choice
One or more enemas at least 2 hours before radiography
Assess Hydration Status; Do Not Proceed If Animal Is Dehydrated.
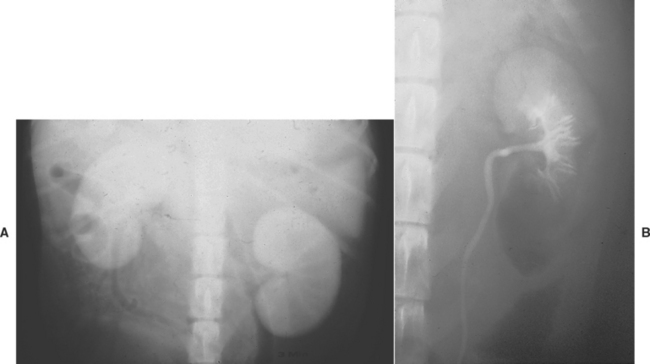
FIG 42-5 Radiographic appearance of normal canine kidneys during (A) the nephrogram stage of an intravenous pyelogram and (B) the pyelogram stage of an intravenous pyelogram.
If the ureters are normal, they cannot be visualized on plain radiographs. Normal ureters appear as radiopaque lines that extend from the kidneys to the trigone region of the bladder on IV urograms (see Fig. 42-5, B). The normal ureteral diameter is 1 to 2 mm, and apparent filling defects are frequently caused by peristaltic contractions that propel urine and contrast material to the bladder. Indications for intravenous urography to evaluate the ureters include suspected obstructive uropathy (Fig. 42-6), trauma (rupture or laceration), calculi, ectopic ureters (Fig. 42-7), neoplasia, and ureterocele.
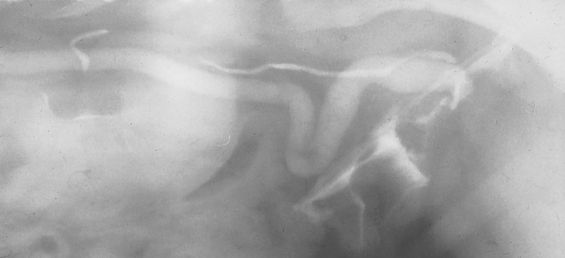
FIG 42-6 Intravenous pyelogram of a dog with a transitional cell carcinoma of the bladder and unilateral hydroureter.
(Courtesy Dr. Phillip Steyn, Colorado State University, Fort Collins, Colo.)
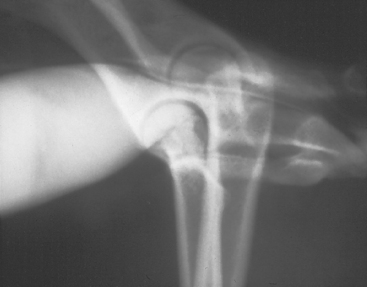
FIG 42-7 Intravenous pyelogram of a dog with a unilateral ectopic ureter.
(Courtesy Dr. Phillip Steyn, Colorado State University, Fort Collins, Colo.)
The size, shape, and position of the urinary bladder can usually be evaluated and any radiopacities detected on plain abdominal radiographs and ultrasonograms (Fig. 42-8). However, retrograde contrast-enhanced radiographic studies are easy to perform and are used to visualize the entire bladder and its relationship to other structures in the posterior abdomen. Negative (air or carbon dioxide) or positive (iodinated contrast medium) contrast material may be used for contrast-enhanced cystography (Fig. 42-9); however, double-contrast studies (bladder is filled with a positive-contrast medium that is removed and replaced with air or carbon dioxide) provide the best information about the bladder mucosal surface (Fig. 42-10). Abnormalities that may be identified by contrast-enhanced cystography include mucosal and mural lesions, luminal filling defects, urachal remnants, diverticuli, vesicoureteral reflux, extraluminal masses, radiolucent calculi, and bladder tears.
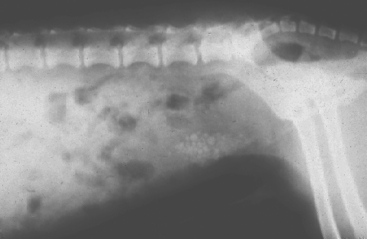
FIG 42-8 Appearance of radiopaque cystouroliths on plain film radiographs of a dog.
(Courtesy Dr. Phillip Steyn, Colorado State University, Fort Collins, Colo.)
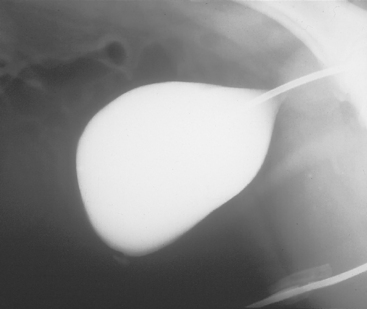
FIG 42-9 Positive contrast–enhanced cystogram in a male dog showing a small urachal remnant.
(Courtesy Dr. Phillip Steyn, Colorado State University, Fort Collins, Colo.)
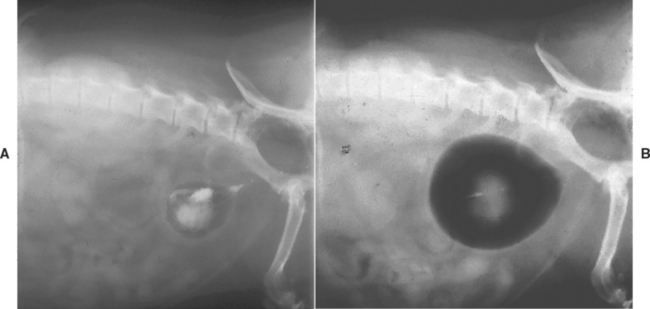
FIG 42-10 Double contrast–enhanced cystograms of a dog showing (A) insufficient distention of the bladder with air, giving an artificial appearance of a thickened bladder wall, and (B) proper distention of the bladder with negative contrast.
Ultrasonography can also be used to evaluate the urinary bladder, in most cases without the sedation and urinary catheterization required for contrast-enhanced cystography. It is particularly useful for differentiating intraluminal masses (e.g., calculi, blood clots, tumors, polyps; Figs. 42-11 and 42-12). The prostate gland and sublumbar lymph nodes are also easily evaluated with ultrasonography. However, it may be less effective than contrast-enhanced cystography in detecting subtle mucosal irregularities, small uroliths, and bladder rupture.
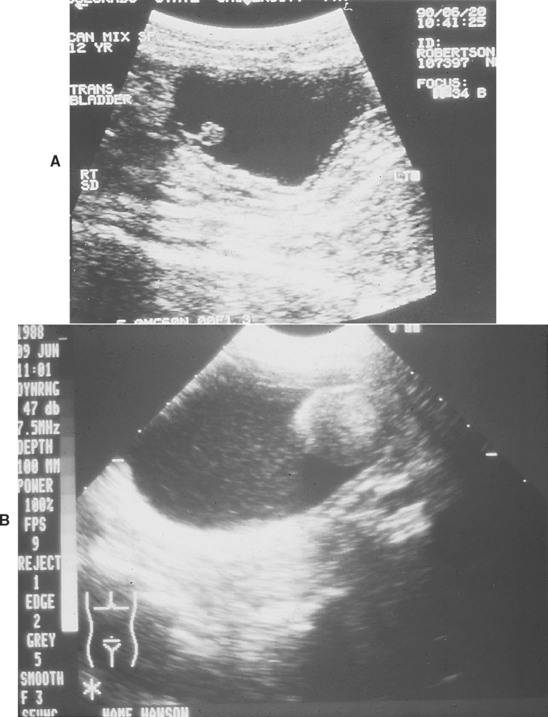
FIG 42-11 A and B, Ultrasonographic images of the bladder of dogs with benign polyps.
(A courtesy Dr. Phillip Steyn, Colorado State University, Fort Collins, Colo.)
Similar to the ureters, the urethra is not routinely visualized on plain radiographs. Contrast-enhanced urethrography is most frequently performed in male dogs and cats to detect or rule out urethral obstruction or rupture (Figs. 42-13 and 42-14). It may be used to identify the presence and location of mucosal and mural lesions, luminal filling defects, strictures, an extramural compression, and urethral rupture or laceration.
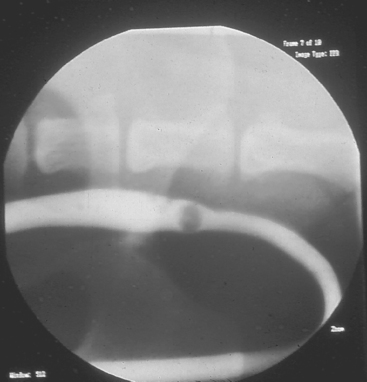
FIG 42-13 Positive contrast–enhanced urethrogram in a dog with an intraluminal urolith.
(Courtesy Dr. Phillip Steyn, Colorado State University, Fort Collins, Colo.)
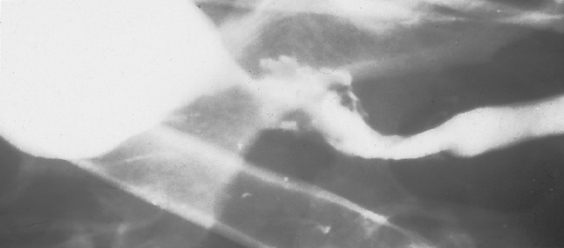
FIG 42-14 Positive contrast-enhanced urethrogram in a dog with an obstructive uropathy associated with prostatic neoplasia.
Computed tomography (CT), both plain and with contrast, and magnetic resonance imaging (MRI) are increasingly used for evaluation of urinary tract pathology at teaching hospitals and other referral centers. The three-dimensional anatomical information provided by CT and MRI can be helpful in surgical planning, especially for detection of tumor invasion into adjacent tissues. Intravenous urography with CT is an excellent imaging technique for detection of ectopic ureters, and GFR can be calculated using contrast-enhanced CT images of the kidneys.
CYSTOSCOPY
Cystoscopy allows relatively noninvasive visualization and biopsy of the urethral and bladder mucosal surface. In some cases, bladder mucosal lesions can be biopsied or resected and uroliths removed or crushed by means of cystoscopy. Finally, cystoscopy can be used to catheterize the ureters to obtain urine samples and perform retrograde pyelography. Cystoscopy is used to evaluate patients with lower urinary tract inflammation, to evaluate potential anatomic abnormalities in animals with recurrent urinary tract infections (e.g., urolithiasis, polyps, urachal remnants) and animals with urine retention or incontinence, to evaluate and obtain a biopsy specimen of bladder or urethral masses, and to differentiate unilateral from bilateral renal hematuria.
RENAL BIOPSY
The biopsy and histopathologic evaluation of renal tissue is a valuable diagnostic and prognostic tool. Renal biopsy should be considered if the diagnosis is in question (e.g., immune complex glomerulonephritis versus amyloidosis in dogs with proteinuria), if treatment may be altered on the basis of results (e.g., confirmation and culture of bacterial pyelonephritis), or if the prognosis may be altered on the basis of results (e.g., evidence of reversible tubular lesions in a dog or cat with acute tubular necrosis). A specific diagnosis is required to implement specific treatment in most animals with renal disease, and a biopsy frequently must be performed for a specific diagnosis to be obtained. In addition, the prognosis for animals with renal disease is most accurate if it is based on three variables: the severity of dysfunction, the response to treatment, and the renal histopathologic findings.
Renal biopsy should be considered only after less invasive tests have been done and the blood clotting ability has been assessed. Absolute or relative contraindications to renal biopsy include a solitary kidney, a coagulopathy, severe systemic hypertension, and renal lesions associated with fluid accumulation (e.g., hydronephrosis, renal cysts and abscesses). In addition, renal biopsy should not be attempted by inexperienced clinicians or in animals that are not adequately restrained.
Renal biopsy specimens can be obtained percutaneously using the keyhole technique or under laparoscopic or ultrasonographic guidance. In many cases the best way to obtain a specimen is at laparotomy, when both kidneys can be visualized, because postbiopsy hemorrhage can then be accurately assessed and treated and an adequate biopsy specimen ensured. The cortical region of the kidney should be biopsied to obtain an adequate number of glomeruli in the specimen and to avoid renal nerves and major vessels in the medullary region. Most animals will have microscopic hematuria for 1 to 3 days after the biopsy procedure, and overt hematuria is not uncommon. In a retrospective study by Vaden (2007) of renal biopsies in 283 dogs and 65 cats, complications were reported in 13.4% and 18.5% of dogs and cats, respectively. The most common complication was severe hemorrhage; hydronephrosis and death were uncommon. Dogs that developed complications after renal biopsy were more likely to have been 4 to <7 years of age and>9 years, to weigh ≤5 kg, and to have serum creatinine concentrations>5 mg/dL. The majority of biopsies from both dogs (87.6%) and cats (86.2%) were considered to be of satisfactory quality. Biopsies from dogs were more likely to be of high quality if they were obtained when the patient was under general anesthesia and more likely to contain only renal cortex if they were obtained by surgery. It was concluded that renal biopsy is a relatively safe procedure, with a low frequency of severe complications.
To prevent artifactual changes, care must be exercised when handling and fixing renal tissue. It is important to consult the histopathology laboratory before performing the biopsy to ensure that appropriate fixatives are used. When possible, immunofluorescent or immunohistochemical techniques and electron microscopy should be used to maximize the information gained from the biopsy specimen. Communication with the laboratory pathologist before biopsy will help determine which fixatives should be used and will maximize the utility of the biopsy sample.
Adams LG. Cystoscopy. In Elliott JA, Grauer GF, editors: BSAVA manual of canine and feline nephrology and urology, ed 2, Gloucester, England: British Small Animal Veterinary Association, 2007.
Dennis R, McConnell. Diagnostic imaging of the urinary tract. In Elliott JA, Grauer GF, editors: BSAVA manual of canine and feline nephrology and urology, ed 2, Gloucester, England: British Small Animal Veterinary Association, 2007.
DiBartola SP. Renal disease: Clinical approach and laboratory evaluation. In Ettinger SJ, Feldman EC, editors: Textbook of veterinary internal medicine, ed 6, St Louis: Elsevier/Saunders, 2005.
Elliott JA, Grauer GF. Proteinuria. In Elliott JA, Grauer GF, editors: BSAVA manual of canine and feline nephrology and urology, ed 2, Gloucester, England: British Small Animal Veterinary Association, 2007.
Fischer JR, Lane IF. Incontinence and urine retention. In Elliott JA, Grauer GF, editors: BSAVA manual of canine and feline nephrology and urology, ed 2, Gloucester, England: British Small Animal Veterinary Association, 2007.
Heiene R, Lefebvre HP. Assessment of renal function. In Elliott JA, Grauer GF, editors: BSAVA manual of canine and feline nephrology and urology, ed 2, Gloucester, England: British Small Animal Veterinary Association, 2007.
Lees GE, et al. Assessment and management of proteinuria in dogs and cats: 2004 ACVIM Forum Consensus Statement (Small Animal). J Vet Intern Med. 2005;19:377.
Nabity MB, et al. Day-to-day variation of the urine protein : creatinine ratio in female dogs with stable glomerular proteinuria caused by X-linked hereditary nephropathy. J Vet Intern Med. 2007;21:425.
Syme HM. Polyuria and polydipsia. In Elliott JA, Grauer GF, editors: BSAVA manual of canine and feline nephrology and urology, ed 2, Gloucester, England: British Small Animal Veterinary Association, 2007.
Vaden SL, et al. Renal biopsy: A retrospective study of methods and complications in 283 dogs and 65 cats (1989-2000). J Vet Intern Med. 2005;19:794.
Vaden SL, Brown CA. Renal biopsy. In Elliott JA, Grauer GF, editors: BSAVA manual of canine and feline nephrology and urology, ed 2, Gloucester, England: British Small Animal Veterinary Association, 2007.
Wamsley H, Alleman R. Complete urinalysis. In Elliott JA, Grauer GF, editors: BSAVA manual of canine and feline nephrology and urology, ed 2, Gloucester, England: British Small Animal Veterinary Association, 2007.