Optical, Thermal, and Electrical Properties
Restorative dental materials are developed by the producer and selected by the dentist on the basis of characteristic physical, chemical, mechanical, and biological properties of the material. No single property can be used as a measure of quality of materials. Often several properties, determined from standardized laboratory and clinical tests, are employed to give a measure of quality. The information gained from an orderly laboratory investigation can assist greatly in the clinical evaluation of the particular product or technique by shortening the time required for clinical testing.
There are times when it is not possible to develop a test that is identical with clinical conditions because of the nature of the material or the equipment involved. In such instances a systematic study is conducted with as practical an approach as possible, and the results are then interpreted on a comparative basis.
Standardization of test practices is essential, however, to control quality and allow for duplication of results by other investigators. When possible, the test specimens should approach the size and shape of the structure employed in practice, with mixing and manipulating procedures comparable with routine clinical conditions.
Although it is important to know the comparative values of properties of different restorative materials, it is also essential to know the quality of the supporting tissue. Whereas many restorations fail clinically because of fracture or deformation, it is not uncommon for a well-constructed restoration to be useless because the supporting tissue fails. Consequently, in designing restorations and interpreting test results, remember that the success of a restoration depends not only on its physical qualities but also on the biophysical or physiological qualities of the supporting tissues.
The physical properties described in this chapter include color and optical properties, thermal properties, and electrical and electrochemical properties. The color and optical properties are color and its measurement, pigmentation, metamerism, fluorescence, opacity, index of refraction, and optical constants. The thermal properties are temperature, heat of fusion, thermal conductivity, specific heat, thermal diffusivity, and coefficient of thermal expansion. The electrical and electrochemical properties are electrical conductivity, dielectric constant, electromotive force, galvanism, corrosion, and zeta-potential. Other, less specific properties are tarnish and discoloration, water sorption, solubility and disintegration, setting time, and shelf life. These properties generally are not concerned with the application of force to a body as mechanical properties are.
OPTICAL PROPERTIES
The perception of the color of an object is the result of a physiological response to a physical stimulus. The sensation is a subjective experience, whereas the beam of light, which is the physical stimulus that produces the sensation, is entirely objective. The perceived color response results from either a reflected or a transmitted beam of white light or a portion of that beam. According to one of Grassmann’s laws, the eye can distinguish differences in only three parameters of color. These parameters are dominant wavelength, luminous reflectance, and excitation purity.
The dominant wavelength (λ) of a color is the wavelength of a monochromatic light that, when mixed in suitable proportions with an achromatic color (gray), will match the color perceived. Light having short wavelengths (400 nm) is violet in color, and light having long wavelengths (700 nm) is red. Between these two wavelengths are those corresponding to blue, green, yellow, and orange light. This attribute of color perception is also known as hue.
Of all the visible colors and shades, there are only three primary colors: red, green, and blue (or violet). Any other color may be produced by the proper combination of these colors. For example, yellow light may be obtained by a correct mixture of green and red lights.
The luminous reflectance of a color permits an object to be classified as equivalent to a member of a series of achromatic objects ranging from black to white for light-diffusing objects and from black to perfectly clear and colorless for transmitting objects. A black standard is assigned a luminous reflectance of 0, whereas a white standard is assigned 100. This attribute of color perception is described as value in one visual system of color measurement.
The excitation purity or saturation of a color describes the degree of its difference from the achromatic color perception most resembling it. Numbers representing excitation purity range from 0 to 1. This attribute of color perception is also known as chroma.
MEASUREMENT OF COLOR
The color of dental restorative materials is most commonly measured in reflected light by instrumental or visual techniques.
Instrumental Technique
Curves of spectral reflectance versus wavelength can be obtained over the visible range (405 to 700 nm) with a recording spectrophotometer and integrating sphere. Typical curves for a resin composite before and after 300 hours of accelerated aging in a weathering chamber are shown in Fig. 3-1. From the reflectance values and tabulated color-matching functions, the tristimulus values (X, Y, Z) can be computed relative to a particular light source. These tristimulus values are related to the amounts of the three primary colors required to give, by additive mixture, a match with the color being considered. Typically, the tristimulus values are computed relative to the Commission Internationale de l’Eclairage (CIE) Source D55, D65, or C. The ratios of each tristimulus value of a color to their sum are called the chromaticity coordinates (x, y, z). Dominant wavelength and excitation purity of a color can be determined by referring its chromaticity coordinates to a chromaticity diagram such as the one shown in Fig. 3-2. The luminous reflectance is equal to the value of the second (Y) of the three tristimulus values.
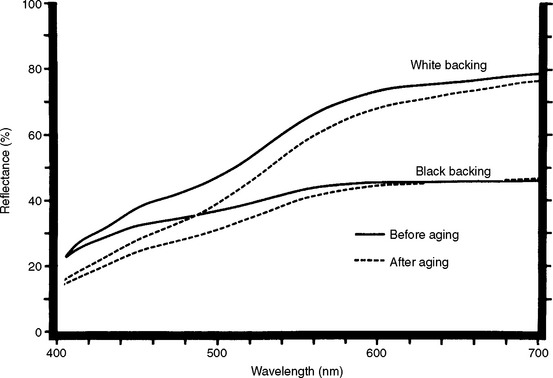
FIGURE 3-1 Curves of spectral reflectance versus wavelength for a resin composite before and after exposure to conditions of accelerated aging. The specimen was exposed continuously for 300 hours to the radiation of a 2500-watt xenon lamp and intermittently sprayed with water. The aging chamber was held at 43° C and 90% relative humidity. Spectral reflectance curves for translucent specimens often are obtained with both black and white backings.
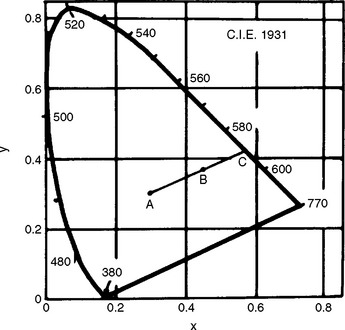
FIGURE 3-2 Chromaticity diagram (x, y) according to the 1931 CIE Standard Observer and coordinate system. Values of dominant wavelength determine the spectrum locus. The excitation purity is the ratio of two lengths (AB/AC) on the chromaticity diagram, where A refers to the standard light source and B refers to the color being considered. The point C, the intersection of line AB with the spectrum locus, is the dominant wavelength.
A diagram of the CIE L*a*b* color space is shown in Fig. 3-3. The L*a*b* color space is characterized by uniform chromaticities. Value (black to white) is denoted as L*, whereas chroma (a*b*) is denoted as red (+ a*), green (−a *), yellow (+b*), and blue (−b *). Ranges of CIE L*a*b* values for bleaching shades of resin composites are listed in Table 3-1.
TABLE 3-1
Ranges of CIE L*a*b* (D55, 10°, CIE 1964) Values for Bleaching Shades of Resin Composites
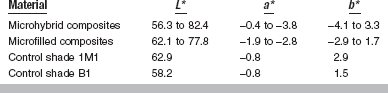
Adapted from Paravina RD, Ontiveros JC, Powers JM: J Esthet Restor Dent 16:117, 2004.
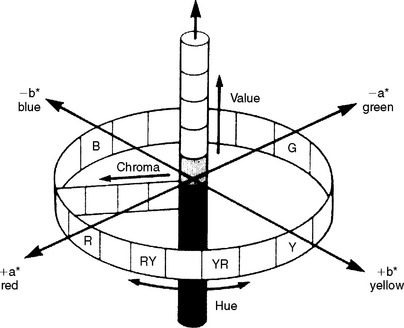
FIGURE 3-3 CIE L*a*b* color arrangement. (From Seghi RR, Johnston WM, O’Brien WJ: J Prosthet Dent 56:35, 1986.)
Differences between two colors can be determined from a color difference formula. One such formula has the form:
where L*, a*, and b* depend on the tristimulus values of the specimen and of a perfectly white object. A value of ΔE * of 1 can be observed visually by half of the observers under standardized conditions. A value of ΔE * of 3.3 is considered perceptible clinically.
Visual Technique
A popular system for the visual determination of color is the Munsell Color System, the parameters of which are represented in three dimensions, as shown in Fig. 3-4. The color considered is compared with a large set of color tabs. Value (lightness) is determined first by the selection of a tab that most nearly corresponds with the lightness or darkness of the color. Value ranges from white (10/) to black (0/). Chroma is determined next with tabs that are close to the measured value but are of increasing saturation of color. Chroma ranges from achromatic or gray (/0) to a highly saturated color (/18). The hue of the color is determined last by matching with color tabs of the value and chroma already determined. Hue is measured on a scale from 2.5 to 10 in increments of 2.5 for each of the 10 color families (red, R; yellow-red, YR; yellow, Y; green-yellow, GY; green, G; blue-green, BG; blue, B; purple-blue, PB; purple, P; red-purple, RP). For example, the color of the attached gingiva of a healthy patient has been measured as 5R 6/4 to indicate a hue of 5R, a value of 6, and a chroma of 4.
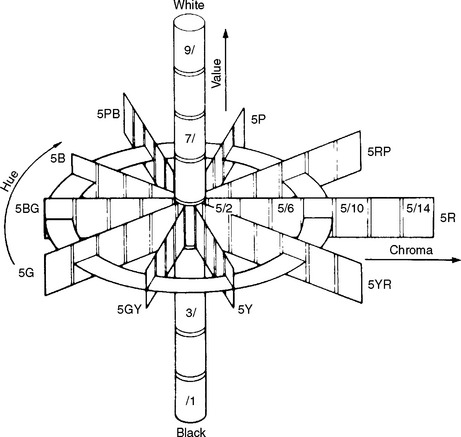
FIGURE 3-4 Munsell scales of hue, value, and chroma in color space. (Adapted from Powers JM, Capp JA, Koran A: J Dent Res 56:112, 1977.)
Two similar colors also can be compared in the Munsell Color System by a color difference formula such as one derived by Nickerson:

where C is the average chroma and ΔH, ΔV, and ΔC are differences in hue, value, and chroma of the two colors. For example, if the color of attached gingiva of a patient with periodontal disease was 2.5R 5/6, the color difference, I, between the diseased tissue and the aforementioned healthy tissue (5R 6/4) would be:

A trained observer can detect a color difference, I, equal to 5.
Surface Finish and Thickness
When white light shines on a solid, some of the light is directly reflected from the surface and remains white light. This light mixes with the light reflected from the body of the material and dilutes the color. As a result, an extremely rough surface appears lighter than a smooth surface of the same material. This problem is associated with unpolished or worn glass ionomer and resin composite restorations. For example, as the resin matrix of a composite wears away, the restoration appears lighter and less chromatic (grayer).
The thickness of a restoration can affect its appearance. For example, as the thickness of a composite restoration placed against a white background increases, the lightness and the excitation purity decrease. The most dramatic change observed is the increase in opacity as the thickness increases.
PIGMENTATION
Esthetic effects are sometimes produced in a restoration by incorporating colored pigments in nonmetallic materials such as resin composites, denture acrylics, silicone maxillofacial materials, and dental ceramics. The color observed when pigments are mixed results from the selective absorption by the pigments and the reflection of certain colors. Mercuric sulfide, or vermilion, is a red pigment because it absorbs all colors except red. The mixing of pigments therefore involves the process of subtracting colors. For example, a green color may be obtained by mixing a pigment such as cadmium sulfide, which absorbs blue and violet, with ultramarine, which absorbs red, orange, and yellow. The only color reflected from such a mixture of pigments is green, which is the color observed.
Inorganic pigments are often preferred to organic dyes because the pigments are more permanent and durable in their color qualities. When the colors are combined with the proper translucency, the restorative materials may be made to match closely the surrounding tooth structure or soft tissue. To match tooth tissue, various shades of yellow and gray are blended into the white base material, and occasionally some blue or green pigments are added. To match the pink soft tissues of the mouth, various blends of red and white are necessary, with occasional need for blue, brown, and black in small quantities. The color and translucency of human tissue shows a wide variation from patient to patient and from one tooth or area of the mouth to another.
METAMERISM
Metameric colors are color stimuli of identical tristimulus values under a particular light source but different spectral energy distributions. The spectral reflectance curves of two such colors would be complicated, with perhaps three or more crossing points. Under some lights such colors would appear to match, but under other lights they would not match.
The quality and intensity of light are factors that must be controlled in matching colors in dental restorations. Because light from incandescent lamps, fluorescent lamps, and the sun differs, the match in color between a pigmented dental material and tooth structure may also vary. Whenever possible, colors should be matched in light corresponding to that of use.
FLUORESCENCE
Fluorescence is the emission of luminous energy by a material when a beam of light is shone on it. The wavelength of the emitted light usually is longer than that of the exciting radiation. Typically, blue or ultraviolet light produces fluorescent light that is in the visible range. Light from most fluorescent substances is emitted in a single, broad, well-shaped curve, the width and peak depending on the fluorescing substance.
Sound human teeth emit fluorescent light when excited by ultraviolet radiation (365 nm), the fluorescence being polychromatic with the greatest intensity in the blue region (450 nm) of the spectrum. Some anterior restorative materials and dental porcelains are formulated with fluorescing agents (rare earths excluding uranium) to reproduce the natural appearance of tooth structure.
OPACITY, TRANSLUCENCY, AND TRANSPARENCY
The color of an object is modified not only by the intensity and shade of the pigment or coloring agent but also by the translucency or opacity of the object. Body tissues vary in the degree of opacity that they exhibit. Most possess a degree of translucency. This is especially true of tooth enamel and the supporting soft tissues surrounding the teeth.
Opacity is a property of materials that prevents the passage of light. When all of the colors of the spectrum from a white light source such as sunlight are reflected from an object with the same intensity as received, the object appears white. When all the spectrum colors are absorbed equally, the object appears black. An opaque material may absorb some of the light and reflect the remainder. If, for example, red, orange, yellow, blue, and violet are absorbed, the material appears green in reflected white light.
Translucency is a property of substances that permits the passage of light but disperses the light, so objects cannot be seen through the material. Some translucent materials used in dentistry are ceramics, resin composites, and denture plastics.
Transparent materials allow the passage of light in such a manner that little distortion takes place and objects may be clearly seen through them. Transparent substances such as glass may be colored if they absorb certain wavelengths and transmit others. For example, if a piece of glass absorbed all wavelengths except red, it would appear red by transmitted light. If a light beam containing no red wavelengths were shone on the glass, it would appear opaque, because the remaining wavelengths would be absorbed.
Measurement of Contrast Ratio
The opacity of a dental material can be determined instrumentally or by visual comparison with opal glass standards. Opacity is represented by a contrast ratio, which is the ratio between the daylight apparent reflectance of a specimen (typically 1-mm thick) when backed by a black standard and the daylight apparent reflectance of the specimen when backed by a white standard having a daylight apparent reflectance of 70% (or sometimes 100%) relative to magnesium oxide. The contrast ratio (C0.70) for a resin composite should lie between the values of 0.55 and 0.70. The spectral reflectance curves of a resin composite backed by black and white standards are shown in Fig. 3-1. The contrast ratio can also be calculated from optical constants, as discussed later.
Measurement of Translucency Parameter
The translucency parameter (TP) of an esthetic dental material is a color difference determined from L*a*b* values of a uniform thickness of the material measured instrumentally against black (B) and white (W) backgrounds.
A proposed classification of the translucency of bleaching shades of resin composites based on TP established a TP range of 5.5 to 7.1 for highly translucent composites, 3.8 to 5.4 for moderately translucent composites, and 2.0 to 3.7 for more opaque composites.
INDEX OF REFRACTION
The index of refraction (ϕ) for any substance is the ratio of the velocity of light in a vacuum (or air) to its velocity in the medium. When light enters a medium, it slows from its speed in air (300,000 km/sec) and may change direction. For example, when a beam of light traveling in air strikes a water surface at an oblique angle, the light rays are bent toward the normal. The normal is a line drawn perpendicular to the water surface at the point where the light contacts the water surface. If the light is traveling through water and contacts a water-air surface at an oblique angle, the beam of light is bent or refracted away from the normal. The index of refraction is a characteristic property of the substance (Table 3-2) and is used extensively for identification. One of the most important applications of refraction is the control of the refractive index of the dispersed and matrix phases in materials such as resin composites and dental ceramics, designed to have the translucent appearance of tooth tissue. A perfect match in the refractive indices results in a transparent solid, whereas large differences result in opaque materials.
OPTICAL CONSTANTS
Esthetic dental materials such as ceramics, resin composites, and human tooth structure are intensely light-scattering or turbid materials. In a turbid material the intensity of incident light is diminished considerably when light passes through the specimen. The optical properties of these materials are described by the Kubelka-Munk equations, which develop relations for monochromatic light between the reflection of an infinitely thick layer of a material and its absorption and scattering coefficients. These equations can be solved algebraically by hyperbolic functions derived by Kubelka.
Secondary optical constants (a and b) can be calculated as follows:

and
where RB is the reflectance of a dark backing (the black standard), RW is reflectance of a light backing (the white standard), R (B) is the light reflectance of a specimen with the dark backing, and R (W) is the light reflectance of the specimen with the light backing.
These equations are used under the assumptions that (1) the material is turbid, dull, and of constant finite thickness; (2) edges are neglected; (3) optical inhomogeneities are much smaller than the thickness of the specimen and are distributed uniformly; and (4) illumination is homogeneous and diffused.
Scattering Coefficient
The scattering coefficient is the fraction of incident light flux lost by reversal of direction in an elementary layer. The scattering coefficient, S, for a unit thickness of a material is defined as follows:

where X is the actual thickness of the specimen, Ar ctgh is an inverse hyperbolic cotangent, and R is the light reflectance of the specimen with the backing of reflectance, Rg.
The scattering coefficient varies with the wavelength of the incident light and the nature of the colorant layer, as shown in Fig. 3-5 for several shades of a resin composite. Composites with larger values of the scattering coefficient are more opaque.
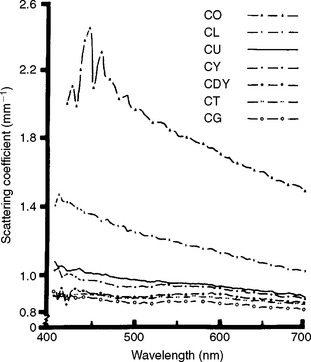
FIGURE 3-5 Scattering coefficient versus wavelength for shades of a composite, C. Shades are O, opaque; L, light; U, universal; Y, yellow; DY, dark yellow; T, translucent; and G, gray. (From Yeh CL, Miyagawa Y, Powers JM: Optical properties of composites of selected shades, J Dent Res 61:797, 1982.)
Absorption Coefficient
The absorption coefficient is the fraction of incident light flux lost by absorption in an elementary layer. The absorption coefficient, K, for a unit thickness of a material is defined as follows:
The absorption coefficient also varies with the wavelength of the incident light and the nature of the colorant layer, as shown in Fig. 3-6 for several shades of a resin composite. Composites with larger values of the absorption coefficient are more opaque and more intensely colored.
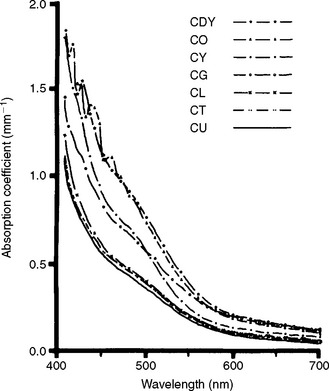
FIGURE 3-6 Absorption coefficient versus wavelength for shades of a composite, C. Shades are DY, dark yellow; O, opaque; Y, yellow; G, gray; L, light; T, translucent; and U, universal. (From Yeh CL, Miyagawa Y, Powers JM: Optical properties of composites of selected shades, J Dent Res 61:797, 1982.)
Light Reflectivity
The light reflectivity, RI, is the light reflectance of a material of infinite thickness, and is defined as follows:

This property also varies with the wavelength of the incident light and the nature of the colorant layer.
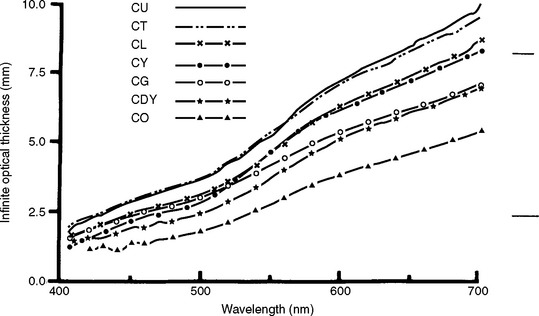
The light reflectivity can be used to calculate a thickness, XI, at which the reflectance of a material with an ideal black background would attain 99.9% of its light reflectivity. The infinite optical thickness, XI, is defined for monochromatic light as follows:

The variation of XI with wavelength is shown in Fig. 3-7 for a resin composite. It is interesting that composites are more opaque to blue than to red light, yet blue light is used to cure light-activated composites.
Contrast Ratio
Once a, b, and S are obtained, the light reflectance (R) for a specimen of any thickness (X) in contact with a backing of any reflectance (Rg) can be calculated by:

An estimate of the opacity of a 1-mm-thick specimen can then be calculated from the contrast ratio (C) as:

where R0 is the computed light reflectance of the specimen with a black backing. If Rg is 0.70, then C0.70 can be calculated (see “Measurement of Contrast Ratio”).
THERMAL PROPERTIES
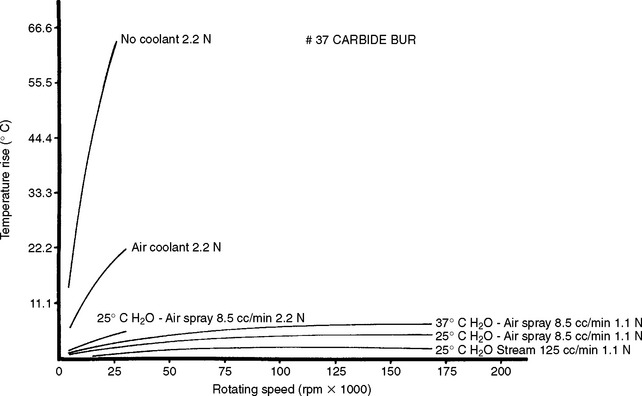
The temperature of a substance can be measured with a thermometer or a thermocouple. An important application of temperature measurement in dentistry is the measurement of heat during the shaping of cavities in teeth. Numerous studies have been made of the effect of speed and force on the rise of temperature in teeth. The increase in temperature during the cutting of tooth structure with various types of steel burs, carbide burs, and rotary diamond instruments also has been investigated. In addition, the rise in temperature in the tooth at various distances from the cutting instrument has been determined. Examples of the effect of the speed of rotation and coolants on the increase in temperature in tooth structure are shown in Fig. 3-8. The temperature was measured by a thermocouple inserted into a small opening that extended into the dentoenamel junction. The tooth was then cut in the direction of the thermocouple and the maximum temperature recorded.
TRANSITION TEMPERATURES
The arrangement of atoms and molecules in materials is influenced by the temperature; as a result, thermal techniques are important in understanding dental materials. These techniques are differential thermal analysis, differential scanning calorimetry, thermogravimetric analysis, thermomechanical analysis, and dynamic mechanical analysis. Differential thermal analysis has been used to locate the temperature of transitions and to study the effect of variables, such as composition and heat treatment, on these transitions. Differential scanning calorimetry can determine the heats of transition and reaction. Thermogravimetric analysis measures the change in weight of materials as a function of temperature and environment and gives information related to the thermal decomposition of materials or their stability in various environments. Thermomechanical analysis measures the dimensional change with or without load as a function of temperature. Changes in the ease of deformation as the temperature increases indicate the presence of transitions. This method can also measure the coefficient of thermal expansion as a function of temperature. Dynamic mechanical analysis measures the changes in modulus of elasticity and loss tangent as a function of temperature. This technique can be used to measure the glass transition temperature of polymers.
Differential thermal analysis (DTA) has been used to study waxes used in the compounding of dental waxes. The DTA curve of a mixture of paraffin and carnauba wax is shown in Fig. 3-9. The thermogram was obtained when the difference in temperature between the wax and a standard was recorded under the same heating conditions in which thermocouples were used. The difference in temperature was recorded as a function of the temperature of the surroundings. A decrease in the value of ΔT indicated an endothermic process in the specimen. The endotherms at 31.5° and 35° C are solid-solid transitions occurring in the paraffin wax as the result of a change of crystal structure. The endotherm at 52° C represents the solid-liquid transition of paraffin wax, whereas the endotherms at 68.7° and 80.2° C result from the melting of carnauba wax. The heat of transition of the two solid-solid transitions is about 8 cal/g, and the melting transition of paraffin and carnauba wax is approximately 39 and 11 cal/g, respectively. These and other thermograms show that 25% carnauba wax added to paraffin wax has no effect on the melting point of paraffin wax but increases the melting range about 28° C.
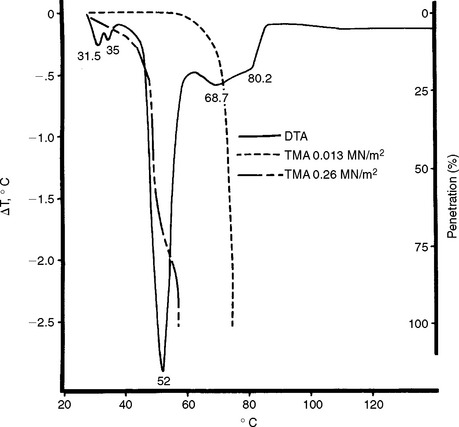
Thermomechanical analysis (TMA) of the carnauba-paraffin wax mixture is also shown in Fig. 3-9. The percent penetration of the wax mixture by a cylindrical probe is shown for two stresses of 0.013 and 0.26 MPa. The penetration of the wax at the lower stress was controlled by the melting transition of the carnauba wax component, whereas the penetration at the higher stress was dominated by the solid-solid and solid-liquid transitions of the paraffin wax components. About 44% penetration, which is related to flow, occurred before the melting point of the paraffin wax was reached.
Other properties correlate with thermograms. The coefficient of thermal expansion of paraffin wax increases from about 300 × 10−6/° C to 1400 × 10−6/° C just before the solid-solid transition, and the flow increases greatly in this temperature range.
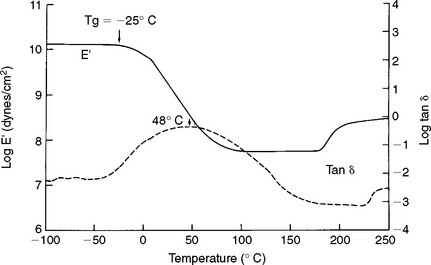
Dynamic mechanical analysis (DMA) of a dimethacrylate copolymer is shown in Fig. 3-10. A thin film of the copolymer was subjected to a sinusoidal tensile strain at a frequency of 11 Hz. As temperature was increased, values of modulus of elasticity (E ¢) and loss tangent (tan δ) were obtained. The glass transition temperature (Tg) was determined from identification of the beginning of a rapid decrease in E ¢ with temperature. The value of Tg identifies the temperature at which a glassy polymer goes to a softer, rubbery state upon heating. A lower value of Tg can result from a lower degree of conversion of double bonds or from saturation by water. As discussed later, the value of the coefficient of thermal expansion of a polymer changes at Tg.
HEAT OF FUSION
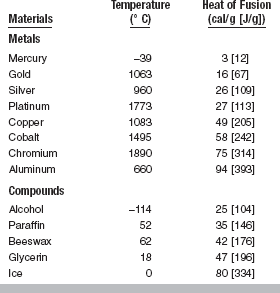
The heat of fusion, L, is the heat in calories, or joules, J, required to convert 1 g of a material from solid to liquid state at the melting temperature. The equation for the calculation of heat of fusion is L = Q/m, where Q is the total heat absorbed and m is the mass of the substance melted. Therefore, in practical applications it is apparent that the larger the mass of material being melted, the more heat required to change the total mass to liquid. The heat of fusion is closely related to the melting or freezing point of the substance, because, when the change in state occurs, it is always necessary to apply additional heat to the mass to cause liquefaction, and as long as the mass remains molten, the heat of fusion is retained by the liquid. When the mass is frozen, or solidified, the heat that was retained in the liquid state is liberated. The difference in energy content is necessary to maintain the kinetic molecular motion, which is characteristic of the liquid state.
The values for heat of fusion of some common substances (given in round numbers) are listed in Table 3-3. It may be seen that the values for heat of fusion of gold and the metals used for dental gold alloys (silver and copper) are below those of many other metals and compounds. This is true also for the specific heat of gold and its alloys.
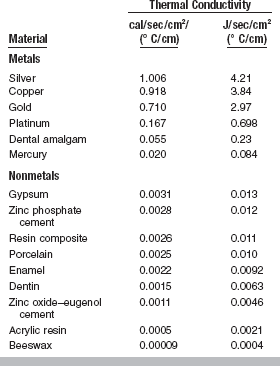
THERMAL CONDUCTIVITY
The thermal conductivity, K, of a substance is the quantity of heat in calories, or joules, per second passing through a body 1-cm thick with a cross-section of 1 cm2 when the temperature difference is 1° C. The units are cal/sec/cm2/(° C/cm). The conductivity of a material changes slightly as the surrounding temperature is altered, but generally the difference resulting from temperature changes is much less than the difference that exists between different types of materials.
Common experience indicates that metals are better heat conductors than nonmetals. Several important applications of thermal conductivity exist in dental materials. For example, a large gold or amalgam filling or crown in proximity to the pulp may cause the patient considerable discomfort when hot or cold foods produce temperature changes; this effect is mitigated when adequate tooth tissue remains or nonmetallic substances are placed between the tooth and filling for insulation. Such filling materials as cements are relatively poor conductors and insulate the pulp area.
The difference in thermal conductivity of denture base materials likewise may cause differences in soft-tissue response. A metal base, a good conductor, causes a prompt tissue response, as shown in Fig. 3-11, whereas an acrylic denture base causes a more delayed response to thermal changes. Dental literature indicates that a good thermal conductor is preferred for denture bases to maintain good health in the supporting tissues by having the heat readily conducted to and from the tissue by the denture base. This concept has not been established on the basis of experimental data.

FIGURE 3-11 Temperature on the oral surface and tissue surface of an acrylic palate and a cobalt-chromium palate while a subject was eating a meal. (Adapted from Wehner PJ: Heat transfer properties of denture base materials, master’s thesis, Ann Arbor, 1959, University of Michigan School of Dentistry.)
A better understanding of the conductivities of various restorative materials is desirable to develop an appropriate degree of insulation for the pulp tissue, comparable with that in the natural tooth, and to produce normal thermal stimulation in the supporting soft tissue under complete dentures. The conductivity of certain dental materials is listed in Table 3-4. Nonmetallic materials appear to be less effective as conductors than metals are, for which reason they serve as good insulators. Dental cements have a thermal conductivity similar to those of dentin and enamel. Note that the thickness of a cement base and its thermal conductivity are important in reducing the thermal transfer to the pulp, and remember that the temperature difference across an insulator depends on the extent of the heating or cooling period and the magnitude of the temperature difference.
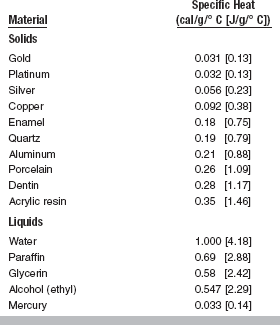
SPECIFIC HEAT
The specific heat, Cp, of a substance is the quantity of heat needed to raise the temperature of 1 g of the substance 1° C. Water is usually chosen as the standard substance and 1 g as the standard mass. The heat required to raise the temperature of 1 g of water from 15° to 16° C is 1 cal, which is used as the basis for the definition of the heat unit. Most substances are more readily heated, gram for gram, than water.
Obviously the total heat required to raise the temperature of a substance 1° C depends on the total mass and the specific heat. For example, 100 g of water requires more calories than 50 g of water to raise the temperature 1° C. Likewise, because of the difference in specific heat of water and alcohol, 100 g of water requires more heat than 100 g of alcohol to raise the temperature the same amount. In general, the specific heat of liquids is higher than those of solids. Some metals have specific heat values of less than 10% that of water.
During the melting and casting process, the specific heat of the metal or alloy is important because of the total amount of heat that must be applied to the mass to raise the temperature to the melting point. Fortunately, the specific heat of gold and the metals used in gold alloys is low, so prolonged heating is unnecessary. The specific heat of both enamel and dentin has been found to be higher than that of metals used for fillings, as shown in Table 3-5.
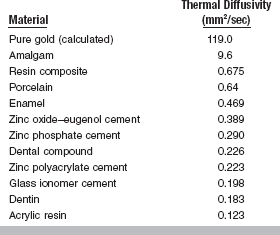
THERMAL DIFFUSIVITY
The thermal diffusivity, Δ, is a measure of transient heat-flow and is defined as the thermal conductivity, K, divided by the product of the specific heat, Cp, times the density, ρ:

The units of thermal diffusivity are mm2/sec.
The thermal diffusivity describes the rate at which a body with a nonuniform temperature approaches equilibrium. For a gold inlay or crown or a dental amalgam, the low specific heat combined with the high thermal conductivity creates a thermal shock more readily than normal tooth structure does. Values of thermal diffusivity of some materials are listed in Table 3-6. These values may vary somewhat with composition of the particular restorative material. For example, the thermal diffusivity of a zinc polyacrylate cement increases from 0.14 to 0.51 mm2/sec as the powder/liquid ratio (by weight) increases from 0.5 to 5.0.
As mentioned in the discussion of thermal conductivity, thickness of the material is important. A parameter governing lining efficiency (Z) is related to thickness (T) and thermal diffusivity (Δ) as follows:
COEFFICIENT OF THERMAL EXPANSION
The change in length (lfinal − loriginal) per unit length of a material for a 1° C change in temperature is called the linear coefficient of thermal expansion, α, and is calculated as follows:

The units are represented by the notation/° C, and because the values are usually small they are expressed in exponential form such as 22 × 10−6/° C. A less common practice is to report the change in parts per million (ppm) and the previous number would be expressed as 22 ppm.
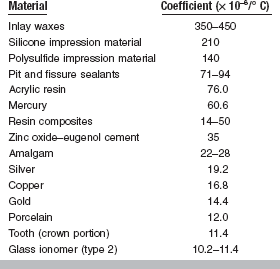
The linear coefficients of thermal expansion for some materials important in restorative dentistry are given in Table 3-7. Although the coefficient is a material constant, it does not remain constant over wide temperature ranges. For example, the linear coefficient of thermal expansion of a dental wax may have an average value of 300 × 10−6/° C up to 40° C, whereas it may have an average value of 500 × 10−6/° C from 40° to 50° C. The coefficient of thermal expansion of a polymer changes as the polymer goes from a glassy state to a softer, rubbery material. This change in the coefficient corresponds to the glass transition temperature (Tg).
Either the linear or volumetric coefficient of thermal expansion may be measured, and for most materials that function as isotropic solids, the volumetric thermal coefficient may be considered to be three times the linear thermal coefficient.
Both linear expansion and volume expansion are important in restorative materials and processes. It is obvious that with a reduction of temperature, or cooling, there is a contraction of the substance that is equal to the expansion that results from heating. Accordingly, tooth structure and restorative materials in the mouth will expand when warmed by hot foods and beverages but will contract when exposed to cold substances. Such expansions and contractions may break the marginal seal of an inlay or other filling in the tooth, particularly if the difference between the coefficient of expansion of the tooth and the restorative material is great. The high coefficient of expansion of pattern waxes is an important factor in the construction of properly fitting restorations. The change in volume as a result of cooling is responsible for the shrinkage spots or surface cracks that often develop in gold alloy castings during solidification. Compensation for the contraction that occurs during the cooling of gold alloys must be made if accurate gold castings are to result. The values in Table 3-7 show that with comparable temperature changes, materials such as acrylic resin and amalgam expand more than tooth tissue, whereas ceramic expands less. The coefficient of inlay pattern wax is exceptionally high when compared with that of other materials.
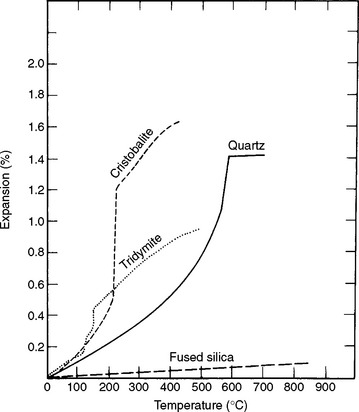
Of particular importance in casting investments is the property of thermal expansion of three crystalline polymorphic forms of silica. As a principal ingredient in dental investments that are to be heated before a metal casting is made, the amount of expansion at various temperatures is critical and important. This quality of silica compounds in relation to use in casting investments was described in 1932. Curves in Fig. 3-12 illustrate the relative percentage of thermal expansion of the four forms of silica at different temperatures below about 800° C. Of the crystalline forms, cristobalite shows the greatest expansion at the lowest temperature and quartz requires a higher temperature to develop an equal amount of expansion as cristobalite. Fused silica has long been recognized as having an exceedingly low thermal expansion.
ELECTRICAL PROPERTIES
ELECTRICAL CONDUCTIVITY AND RESISTIVITY
The ability of a material to conduct an electric current may be stated as either specific conductance or conductivity, or, conversely, as the specific resistance or resistivity. Resistivity is the more common term. The resistance of a homogeneous conductor of uniform cross-section at a constant temperature varies directly with the length and inversely with the cross-sectional area of the specimen, according to the equation

in which R is the resistance in ohms, ρ (rho) is the resistivity, l is the length, and A is the section area. The resistivity depends on the nature of the material. If a unit cube of 1-cm edge length is employed, the l and A are equal to unity, and in this case R = ρ. The resistivity is expressed as ohm-centimeters where R is in ohms, l is in centimeters, and A is in square centimeters.
The change in electrical resistance has been used to study the alteration in internal structure of various alloys as a result of heat treatment. An early investigation of the gold-copper alloy system by electrical conductivity methods revealed a change in internal crystal structure with an accompanying change in conductivity. The correlation of these conductivity studies with related changes in other properties established the fundamental basis of structural changes associated with heat-treatment operations on dental gold alloys.
Values for the resistivity of human tooth structure are shown in Table 3-8. Resistivity is important in the investigation of the pain perception threshold resulting from applied electrical stimuli and of displacement of fluid in teeth caused by ionic movements. The electrical resistance of normal and carious teeth has been observed to differ, with less resistance offered by the carious tissue. Sound enamel is a relatively poor conductor of electricity, whereas dentin is somewhat better (see Table 3-8).
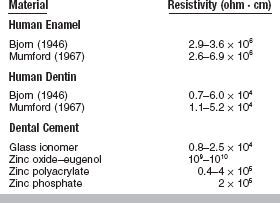
The conductivity of materials used to replace tooth tissue is of concern in restorative dentistry. The effectiveness of insulating cement bases and other nonmetallic restorative materials is not yet established. Several studies have measured the resistivity of dental cements (see Table 3-8). The zinc oxide–eugenol cements have the highest resistivity, followed by the zinc polyacrylate and zinc phosphate cements. The glass ionomer cements are the most conductive of the cements and have values most similar to dentin.
DIELECTRIC CONSTANT
A material that provides electrical insulation is known as a dielectric. The dielectric constant or relative permittivity,  r, compares the permittivity, , of the dielectric to the permittivity, 0, of empty space:

where 0 of a vacuum is 8.854 × 10⁻¹² farad/m. The dielectric constant varies with the temperature, bonding, crystal structure, and structural defects of the dielectric.
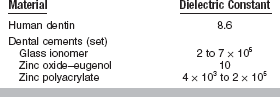
Values of the dielectric constant for human dentin and several dental cements are listed in Table 3-9. The dielectric constant of a dental cement generally decreases as the material hardens. This decrease reflects a change from a paste that is relatively ionic and polar to one that is less so. As shown by the high values of permittivity of the glass ionomer and zinc polyacrylate cements in Table 3-9, these cements have a high ionic content and are quite polar compared with zinc oxide–eugenol cements and human dentin.
Dielectric measurements have been used to study polymer-filler interactions in dental composites with and without silane coupling agents, and the effect of moisture on these interactions. The measurements showed that increasing the filler content restricted the mobility of the main polymer chains and that compatible silanes did not form a separate interphase at the polymer-filler interface. It was also shown that bulk water could exist at the interface if the filler was not silanated. Therefore, correct silanation of fillers used in dental composites is essential for their successful application.
The problem of electrical insulation is made more complex by the presence of galvanic currents in the mouth, resulting from cells formed from metallic restorations. Recent studies indicate that a cement base does not effectively insulate the pulp from the electric current developed in a metallic restoration in the mouth. How much insulation is essential or how to effectively restore the tooth to its original status of equilibrium is currently not known.
ELECTROMOTIVE FORCE
Working with metals and alloys for dental restorations or with instruments that are susceptible to corrosion necessitates some understanding of the relative position of the metal in the electromotive force series. The electromotive series is a listing of electrode potentials of metals according to the order of their decreasing tendency to oxidize in solution. This serves as the basis of comparison of the tendency of metals to oxidize in air. Those metals with a large negative electrode potential are more resistant to tarnish than those with a high positive electrode potential. In general, the metals above copper in the series, such as aluminum, zinc, and nickel, tend to oxidize relatively easily, whereas those below copper, such as silver, platinum, and gold, resist oxidation. A list of oxidation-reduction potentials for some common corrosion reactions in water and in salt water is given in Table 3-10. The values of electrode potential and the order of the series change when measured in a saline solution rather than water. The electrode potentials of some dental alloys measured in artificial saliva at 35° C are listed in Table 3-11.
TABLE 3-10
Oxidation-Reduction Potentials for Corrosion Reactions in Water and Salt Water
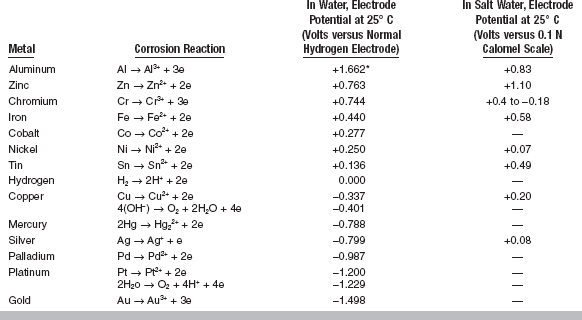
*A positive value indicates a strong tendency for the metal to go into solution. Higher positive values are more anodic, whereas higher negative values are more cathodic.
Modified from Flinn Ra, Trojan PK: Engineering materials and their applications, ed 4, Boston, 1990, Houghton Mifflin.
TABLE 3-11
Galvanic Series of Some Dental Alloys in Artificial Saliva at 35° C
*High positive sign indicates a strong tendency for the metal to go into solution.
Modified from Arvidson K, Johansson EG: Scand J Dent Res 85:485, 1977.
Likewise, it is possible to determine from the electromotive force series that the reduction of the oxides of gold, platinum, and silver to pure metal can be accomplished more readily than with those metals that have a higher electromotive force value.
GALVANISM
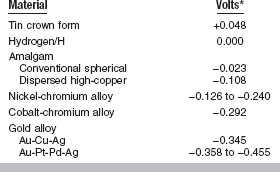
The presence of metallic restorations in the mouth may cause a phenomenon called galvanic action, or galvanism. This results from a difference in potential between dissimilar fillings in opposing or adjacent teeth. These fillings, in conjunction with saliva or bone fluids such as electrolytes, make up an electric cell. When two opposing fillings contact each other, the cell is short-circuited, and if the flow of current occurs through the pulp, the patient experiences pain and the more anodic restoration may corrode. A single filling plus the saliva and bone fluid may also constitute a cell of liquid junction type. As shown in Fig. 3-13, ions capable of conducting electricity can easily migrate through dentin and around the margins of a restoration.
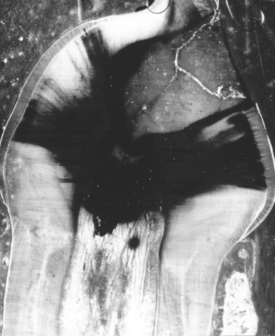
FIGURE 3-13 Autoradiograph of a longitudinal section of a dog’s permanent tooth in which the pulp has been capped with Ca hydroxide. The dark areas in the tooth are evidence that migration of the Ca ions has occurred and that a circuit is possible. (Courtesy Avery JK, University of Michigan School of Dentistry, 1958.)
Studies have indicated that relatively large currents will flow through metallic fillings when they are brought into contact. The current rapidly falls off if the fillings are maintained in contact, probably as a result of polarization of the cell. The magnitude of the voltage, however, is not of primary importance, because indications support the fact that the sensitivity of the patient to the current has a greater influence on whether pain is felt. Although most patients feel pain at a value between 20 and 50 μamp, some may feel pain at 10 μamp, whereas others do not experience it until 110 μamp are developed. This is a possible explanation for the fact that some patients are bothered by galvanic action and others are not, despite similar conditions in the mouth.
The galvanic currents developed from the contact of two metallic restorations depend on their composition and surface area. An alloy of stainless steel develops a higher current density than either gold or cobalt-chromium alloys when in contact with an amalgam restoration. As the size of the cathode (such as a gold alloy) increases relative to that of the anode (such as an amalgam), the current density may increase. The larger cathode likewise can enhance the corrosion of the smaller anode. Current densities associated with non-γ2-containing amalgams appear to be less than those associated with the γ2-containing amalgams.
ELECTROCHEMICAL CORROSION
The corrosion and electrochemical behavior of restorative materials have received new interest with the study of multiphase systems such as gold alloys and amalgam. For example, the corrosion of γ, γ1, and γ2 phases in amalgam has been studied by electrochemical means. Anodic and cathodic polarization measurements indicated no strongly passive behavior of these phases in artificial saliva. The dental amalgam specimens became pitted at the boundaries between the phases or in γ2 phase. Other studies, however, indicate that amalgam alloys exhibit decreasing electrochemical potentials, resulting in noble values when stored in neutral solutions. The addition of copper to amalgam alloys to form copper-tin compounds during hardening has improved the resistance of amalgam to chloride and galvanic corrosion. As shown in Fig. 3-14 the anodic activity of AgSn amalgam is quite different from AgSn + AgCu amalgams. The AgSn + AgCu amalgam remains passive under the testing conditions, whereas the AgSn amalgam does not.
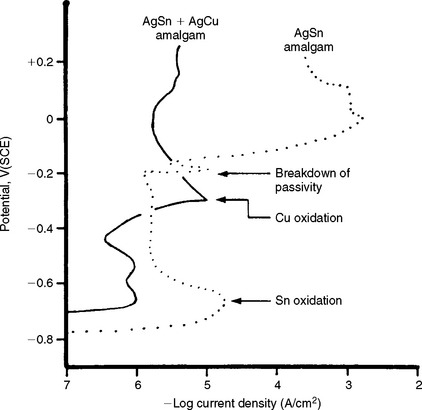
FIGURE 3-14 Anodic polarization curves of two types of amalgam in synthetic saliva. (Adapted from Fairhurst CW, Marek M, Butts MB, Okabe T: J Dent Res 57:725, 1978.)
Studies of corrosion of surgical stainless steel, stainless steel orthodontic brackets, and endodontic silver cones also have been reported. Corrosion of these alloys and others can result in decreased mechanical properties and the formation of corrosion products, which in some instances accumulate in the human organs. As shown previously in Table 3-10, corrosion can be affected by the environment, and certain metals such as cobalt and copper corrode more rapidly in a saline solution containing serum albumin and fibrinogen proteins.
ZETA-POTENTIAL
A charged particle suspended in an electrolytic solution attracts ions of opposite charge to those at its surface. The layer formed by these ions is called the Stern layer. To maintain the electrical balance of the suspending fluid, ions of opposite charge are attracted to the Stern layer. The potential at the surface of that part of the diffuse double layer of ions is called the electrokinetic or zeta-potential.
The zeta-potential, ζ, of a solid as a porous plug can be determined by measuring the streaming potential, E, which is the electric field caused when a liquid is made to flow along a stationary charged surface. The relation is as follows:

where η is viscosity in poises, E is in millivolts, Rp is resistance in ohms of the porous plug, k is in ohm−1cm−1, and P is pressure in cm Hg. R0.1NKCI×k0.1NKCI is a cell constant for 0.1 N KCl. The term is the dielectric constant, which is 78.54 for water at 25° C.
Electrophoresis may be used to increase the stability of colloids, stimulate adsorption of ions, and characterize particle surfaces. Effects of pH, surface-active agents, and enzymes on zeta-potential are important. Zeta-potential may affect the near-surface mechanical properties (such as wear) of a material. The zeta-potentials of some materials are listed in Table 3-12.
TABLE 3-12
Zeta-Potential (ζ) of Some Dental Materials
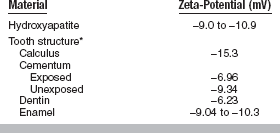
*Measured in Hanks’ balanced salt solution at 30° C.
Adapted from O’Brien WJ, editor: Dental materials and their selection, ed 2, Carol Stream, 1997, Quintessence.
OTHER PROPERTIES
Certain properties often are highly important in the selection and manipulation of materials for use either in the mouth or for laboratory applications. Five such properties are tarnish and discoloration, water sorption, solubility and disintegration, setting time, and shelf life.
TARNISH AND DISCOLORATION
Discoloration of a restorative material from any cause is a very troublesome quality. The tarnish of metal restorations from oxide, sulfide, or any other materials causing a surface reaction is a critical quality of metal restorations in the mouth and of laboratory and clinical instruments. The process of steam sterilization of surgical instruments has long presented a serious problem of tarnish and corrosion. Many nonmetallic materials such as cements and composite restorations have displayed a tendency to discolor in service because colored substances penetrate the materials and continue chemical reactions in the composites.
Various in vitro tests have been proposed to study tarnish, particularly that of crown and bridge and partial denture alloys. Testing generally relies on controlled exposure of the alloy to a solution rich in sulfides, chlorides, and phosphates. Most recently the discoloration of alloys exposed to such solutions has been evaluated by spectrophotometric methods to determine a color-difference parameter discussed earlier in this chapter.
WATER SORPTION
Water sorption of a material represents the amount of water adsorbed on the surface and absorbed into the body of the material during fabrication or while the restoration is in service. Water sorption of denture acrylic, for example, is measured gravimetrically in μg/mm3 after 7 days in water. The tendency of plastic denture base materials to have a high degree of water sorption is the reason this quality was included in American National Standards Institute/American Dental Association (ANSI/ADA) Specification No. 12 for this type of material. Usually a serious warpage and dimensional change in the material are associated with a high percentage of water sorption. The tendency of hydrocolloid impression materials to imbibe water if allowed to remain immersed and then to change dimensions has been a serious problem associated with their use.
SOLUBILITY AND DISINTEGRATION
Solubility and disintegration of crown and bridge cements can be measured gravimetrically by suspension of two disks, 20 mm in diameter and 1.0 mm in thickness, for 24 hours or longer in water at 37° C. The units are μg/mm2. A conductimetric method for studying solubility and disintegration has the advantage of detecting the elution of volatile components and of using a smaller specimen. Care should be taken in predicting in vivo properties from tests in water because abrasion and attack from other chemicals often occur intraorally.
The lack of correlation between in vivo testing of the degradation of cements and the aforementioned test of solubility and disintegration in water has led to the development of other in vitro tests. One test involves placing cement between two, round, plane-parallel glass plates (16 mm in diameter) and exposing this specimen to various acidic media. Changes in the cement are recorded photographically. Observations suggest that degradation may follow a sequence of absorption, disintegration, and solution. Variables such as cement composition, thickness, molarity, and pH of the medium are important. More recently, an acid erosion test has been used for testing cements (see Chapter 20).
SETTING TIME
Setting time characteristics are associated with the reaction rates and affect the practical applications of many materials in restorative dentistry. Materials such as cements, impression materials, dental plaster, stone, and casting investments depend on a critical reaction time and hardening rate for their successful application. From the practical standpoint of manipulation and successful application, the time required for a material to set or harden from a plastic or fluid state may be its most important quality. The setting time does not indicate the completion of the reaction, which may continue for much longer times. The time varies for different materials, depending on the particular application, but duplication of results from one lot to another or from one trade brand of material to another is highly desirable. The influence of manipulative procedures on the setting time of various types of materials is important to the dentist and the assistant.
SHELF LIFE
Shelf life is a term applied to the general deterioration and change in quality of materials during shipment and storage. The temperature, humidity, and time of storage, as well as the bulk of material involved and the type of storage container, are significant factors that vary greatly from one material to another. A material that has exceptionally good properties when first produced may be quite impractical if it deteriorates badly after a few days or weeks. These qualities are discussed in chapters dealing with gypsum materials and impression materials. Some studies of these qualities of various materials have been made in recent years, and through accelerated aging tests, improvements in quality can sometimes be made. Radiographic film, anesthetics, and a few other products carry dates of expiration beyond which the product should not be expected to be serviceable. This practice assures the user that the material is not deteriorated because of age. Most materials that meet the requirements of the American Dental Association specifications carry a date of production as a part of the serial number or as a separate notation.
Asmussen, E. Opacity of glass-ionomer cements. Acta Odontol Scand. 1983;41:155.
Baran, GR, O’Brien, WJ, Tien, T-Y. Colored emission of rare earth ions in a potassium feldspar glass. J Dent Res. 1977;56:1323.
Colorimetry, official recommendations of the International Commission on Illumination (CIE), Publication CIE No 15 (E-1.3.1), 1971.
Hall, JB, Hefferren, JJ, Olsen, NH. Study of fluorescent characteristics of extracted human teeth by use of a clinical fluorometer. J Dent Res. 1970;49:1431.
Johnston, WM, Ma, T, Kienle, BH. Translucency parameter of colorants for maxillofacial prostheses. Int J Prosthodont. 1995;8:79.
Johnston, WM, O’Brien, WJ, Tien, T-Y. The determination of optical absorption and scattering in translucent porcelain. Color Res Appl. 1986;11:125.
Johnston, WM, O’Brien, WJ, Tien, T-Y. Concentration additivity of Kubelka-Munk optical coefficients of porcelain mixtures. Color Res Appl. 1986;11:131.
Jorgenson, MW, Goodkind, RJ. Spectrophotometric study of five porcelain shades relative to the dimensions of color, porcelain thickness, and repeated firings. J Prosthet Dent. 1979;42:96.
Judd, DB. Optical specification of light-scattering materials. J Res Nat Bur Standards. 1937;19:287.
Judd, DB, Wyszecki, G. Color in business, science, and industry, ed 3. New York: John Wiley & Sons, 1975.
Kiat-amnuay, S, Lemon, JC, Powers, JM. Effects of opacifiers on color stability of pigmented maxillofacial silicone A-2186 subjected to artificial aging. J Prosthodont. 2002;11:109.
Koran, A, Powers, JM, Raptis, CN, Yu, R. Reflection spectrophotometry of facial skin. J Dent Res. 1981;60:979.
Kubelka, P. New contributions to the optics of intensely light-scattering materials, Part I. Opt Soc Am J. 1948;38:448.
Kubelka, P, Munk, F. Ein Beitrag zur Optik der Farbanstriche. Z Tech Phys. 1931;12:593.
Lee, Y-K, Lim, B-S, Powers, JM. Color changes of dental resin composites by a salivary enzyme. J Biomed Mater Res. 2004;70B:66.
Miyagawa, Y, Powers, JM. Prediction of color of an esthetic restorative material. J Dent Res. 1983;62:581.
Miyagawa, Y, Powers, JM, O’Brien, WJ. Optical properties of direct restorative materials. J Dent Res. 1981;60:890.
Nickerson, D. The specification of color tolerances. Textile Res. 1936;6:509.
Noie, F, O’Keefe, KL, Powers, JM. Color stability of resin cements after accelerated aging. Int J Prosthodont. 1995;8:51.
O’Brien, WJ, Johnston, WM, Fanian, F. Double-layer color effects in porcelain systems. J Dent Res. 1985;64:940.
O’Brien, WJ, Johnston, WM, Fanian, F, et al. The surface roughness and gloss of composites. J Dent Res. 1984;63:685.
O’Keefe, KL, Powers, JM, Noie, F. Effect of dissolution on color of extrinsic porcelain colorants. Int J Prosthodont. 1993;6:558.
Panzeri, H, Fernandes, LT, Minelli, CJ. Spectral fluorescence of direct anterior restorative materials. Aust Dent J. 1977;22:458.
Paravina, RD, Ontiveros, JC, Powers, JM. Curing-dependent changes in color and translucency parameter of composite bleach shades. J Esthet Restor Dent. 2002;14:158.
Paravina, RD, Ontiveros, JC, Powers, JM. Accelerated aging effects on color and translucency of bleaching-shade composites. J Esthet Restor Dent. 2004;16:117.
Paravina RD, Powers JM, eds. Esthetic color training in dentistry. St. Louis: Elsevier Mosby, 2004.
Powers, JM, Capp, JA, Koran, A. Color of gingival tissues of blacks and whites. J Dent Res. 1977;56:112.
Powers, JM, Koran, A. Color of denture resins. J Dent Res. 1977;56:754.
Powers, JM, Yeh, CL, Miyagawa, Y. Optical properties of composite of selected shades in white light. J Oral Rehabil. 1983;10:319.
Ragain, JC, Johnston, WM. Accuracy of Kubelka-Munk reflectance theory applied to human dentin and enamel. J Dent Res. 2001;80:449.
Ruyter, IE, Nilner, K, Moller, B. Color stability of dental composite resin material for crown and bridge veneers. Dent Mater. 1987;3:246.
Seghi, RR, Johnston, WM, O’Brien, WJ. Spectrophotometric analysis of color differences between porcelain systems. J Prosthet Dent. 1986;56:35.
Specifying color by the Munsell system, D1535–68. ASTM Standards, 1975, Part 20. Philadelphia: American Society for Testing and Materials, 1974. 1975
Sproull, RC. Color matching in dentistry. Part III. Color control. J Prosthet Dent. 1974;31:146.
Van Oort, RP. Skin color and facial prosthetic—a colorimetric study. doctoral dissertation. The Netherlands: Groningen State University, 1982.
Wyszecki, G, Stiles, WS. Color science. New York: John Wiley & Sons, 1967.
Yeh, CL, Miyagawa, Y, Powers, JM. Optical properties of composites of selected shades. J Dent Res. 1982;61:797.
Antonucci, JM, Toth, EE. Extent of polymerization of dental resins by differential scanning calorimetry. J Dent Res. 1983;62:121.
Brady, AP, Lee, H, Orlowski, JA. Thermal conductivity studies of composite dental restorative materials. J Biomed Mater Res. 1974;8:471.
Brauer, GM, Termini, DJ, Burns, CL. Characterization of components of dental materials and components of tooth structure by differential thermal analysis. J Dent Res. 1970;49:100.
Brown, WS, Christiansen, DO, Lloyd, BA. Numerical and experimental evaluation of energy inputs, temperature gradients, and thermal stress during restorative procedures. J Am Dent Assoc. 1978;96:451.
Brown, WS, Dewey, WA, Jacobs, HR. Thermal properties of teeth. J Dent Res. 1970;49:752.
Civjan, S, Barone, JJ, Reinke, PE, et al. Thermal properties of nonmetallic restorative materials. J Dent Res. 1972;51:1030.
Craig, RG, Eick, JD, Peyton, FA. Properties of natural waxes used in dentistry. J Dent Res. 1965;44:1308.
Craig, RG, Peyton, FA. Thermal conductivity of tooth structure, dental cements, and amalgam. J Dent Res. 1961;40:411.
Craig, RG, Powers, JM, Peyton, FA. Differential thermal analysis of commercial and dental waxes. J Dent Res. 1967;46:1090.
Craig, RG, Powers, JM, Peyton, FA. Thermogravimetric analysis of waxes. J Dent Res. 1971;50:450.
Dansgaard, W, Jarby, S. Measurement of nonstationary temperature in small bodies. Odont Tskr. 1958;66:474.
de Vree, JH, Spierings, TA, Plasschaert, AJ. A simulation model for transient thermal analysis of restored teeth. J Dent Res. 1983;62:756.
Fairhurst, CW, Anusavice, KJ, Hashinger, DT, et al. Thermal expansion of dental alloys and porcelains. J Biomed Mater Res. 1980;14:435.
Henschel, CJ. Pain control through heat control. Dent Dig. 1941;47:294. 444
Lisanti, VF, Zander, HA. Thermal conductivity of dentin. J Dent Res. 1950;29:493.
Lloyd, CH. The determination of the specific heats of dental materials by differential thermal analysis. Biomaterials. 1981;2:179.
Lloyd, CH. A differential thermal analysis (DTA) for the heats of reaction and temperature rises produced during the setting of tooth coloured restorative materials. J Oral Rehabil. 1984;11:111.
McCabe, JF, Wilson, HJ. The use of differential scanning calorimetry for the evaluation of dental materials. I. Cements, cavity lining materials and anterior restorative materials. J Oral Rehabil. 1980;7:103.
McCabe, JF, Wilson, HJ. The use of differential scanning calorimetry for the evaluation of dental materials. II. Denture base materials. J Oral Rehabil. 1980;7:235.
McLean, JW. Physical properties influencing the accuracy of silicone and thiokol impression materials. Br Dent J. 1961;110:85.
Murayama, T. Dynamic mechanical analysis of polymeric materials. New York: Elsevier Science, 1978.
Pearson, GJ, Wills, DJ, Braden, M, et al. The relationship between the thermal properties of composite filling materials. J Dent. 1980;8:178.
Peyton, FA. Temperature rise and cutting efficiency of rotating instruments. NY J Dent. 1952;18:439.
Peyton, FA. Effectiveness of water coolants with rotary cutting instruments. J Am Dent Assoc. 1958;56:664.
Peyton, FA, Morrant, GA. High speed and other instruments for cavity preparation. Int Dent J. 1959;9:309.
Peyton, FA, Simeral, WG. The specific heat of tooth structure. Alum Bull U Mich School Dent. 1954;56:33.
Powers, JM, Craig, RG. Penetration of commercial and dental waxes. J Dent Res. 1974;53:402.
Powers, JM, Hostetler, RW, Dennison, JB. Thermal expansion of composite resins and sealants. J Dent Res. 1979;58:584.
Rootare, HM, Powers, JM. Determination of phase transitions in gutta-percha by differential thermal analysis. J Dent Res. 1977;56:1453.
Soderholm, KJ. Influence of silane treatment and filler fraction on thermal expansion of composite resins. J Dent Res. 1984;63:1321.
Souder, WH, Paffenbarger, GC. Physical properties of dental materials National Bureau of Standards Circular No C433. Washington, DC: U.S. Government Printing Office, 1942.
Soyenkoff, BC, Okun, JH. Thermal conductivity measurements of dental tissues with the aid of thermistors. J Am Dent Assoc. 1958;57:23.
Tay, WM, Braden, M. Thermal diffusivity of glass-ionomer cements. J Dent Res. 1987;66:1040.
Walsh, JP, Symmons, HF. A comparison of the heat conduction and mechanical efficiency of diamond instruments, stones, and burs at 3,000 and 60,000 rpm. NZ Dent J. 1949;45:28.
Watts, DC, Smith, R. Thermal diffusivity in finite cylindrical specimens of dental cements. J Dent Res. 1981;60:1972.
Watts, DC, Smith, R. Thermal diffusion in some polyelectrolyte dental cements: the effect of powder/liquid ratio. J Oral Rehabil. 1984;11:285.
Wilson, TW, Turner, DT. Characterization of polydimethacrylates and their composites by dynamic mechanical analysis. J Dent Res. 1987;66:1032.
Electrical and Electrochemical Properties
Arvidson, K, Johansson, EG. Galvanic series of some dental alloys. Scand J Dent Res. 1977;85:485.
Bergman, M, Ginstrup, O, Nilner, K. Potential and polarization measurements in vivo of oral galvanism. Scand J Dent Res. 1978;86:135.
Bjorn, H. Electrical excitation of teeth. Svensk Tandlak T. 39(Suppl), 1946.
Braden, M, Clarke, RL. Dielectric properties of zinc oxide-eugenol type cements. J Dent Res. 1974;53:1263.
Braden, M, Clarke, RL. Dielectric properties of polycarboxylate cements. J Dent Res. 1975;54:7.
Cahoon, JR, Holte, RN. Corrosion fatigue of surgical stainless steel in synthetic physiological solution. J Biomed Mater Res. 1981;15:137.
Clark, GCF, Williams, DF. The effects of proteins on metallic corrosion. J Biomed Mater Res. 1982;16:125.
Fairhurst, CW, Marek, M, Butts, MB, et al. New information on high copper amalgam corrosion. J Dent Res. 1978;57:725.
Gjerdet, NR, Brune, D. Measurements of currents between dissimilar alloys in the oral cavity. Scand J Dent Res. 1977;85:500.
Holland, RI. Galvanic currents between gold and amalgam. Scand J Dent Res. 1980;88:269.
Maijer, R, Smith, DC. Corrosion of orthodontic bracket bases. Am J Orthod. 1982;81:43.
Marek M, Hochman R: The corrosion behavior of dental amalgam phases as a function of tin content, microfilmed paper no. 192, delivered at the Annual Meeting of the International Association for Dental Research, Dental Materials Group, Washington, DC, April 12–15, 1973.
Mohsen, NM, Craig, RG, Filisko, FE. The effects of different additives on the dielectric relaxation and the dynamic mechanical properties of urethane dimethacrylate. J Oral Rehabil. 2000;27:250.
Mumford, JM. Direct-current electrodes for pulp testing. Dent Pract. 1956;6:236.
Mumford JM: Direct-current paths through human teeth, master’s thesis, Ann Arbor, Mich., 1957, University of Michigan School of Dentistry.
Mumford, JM. Electrolytic action in the mouth and its relationship to pain. J Dent Res. 1957;36:632.
Mumford, JM. Resistivity of human enamel and dentin. Arch Oral Biol. 1957;12:925.
Mumford, JM. Path of direct current in electric pulp-testing. Br Dent J. 1959;106:23.
O’Brien, WJ. Electrochemical corrosion of dental gold castings. Dent Abstracts. 1962;7:46.
Phillips, LJ, Schnell, RJ, Phillips, RW. Measurement of the electric conductivity of dental cement. III. Effect of increased contact area and thickness: values for resin, calcium hydroxide, zinc oxide–eugenol. J Dent Res. 1955;34:597.
Phillips, LJ, Schnell, RJ, Phillips, RW. Measurement of the electric conductivity of dental cement. IV. Extracted human teeth; in vivo tests; summary. J Dent Res. 1955;34:839.
Rootare, HM, Powers, JM. Comparison of zeta-potential of synthetic fluorapatite obtained by stepwise and continuous methods of streaming. J Electrochem Soc. 1979;126:1905.
Schreiver, W, Diamond, LE. Electromotive forces and electric currents caused by metallic dental fillings. J Dent Res. 1952;31:205.
Shaw, DJ. Electrophoresis. New York: Academic Press, 1969.
Tay, WM, Braden, M. Dielectric properties of glass ionomer cements. J Dent Res. 1981;60:1311.
Wilson, AD, Kent, BE. Dental silicate cements. V. Electrical conductivity. J Dent Res. 1968;47:463.
Zitter, H, Plenk, H, Jr. The electrochemical behavior of metallic implant materials as an indicator of their biocompatibility. J Biomed Mater Res. 1987;21:881.
German, RM, Wright, DC, Gallant, RF. In vitro tarnish measurements on fixed prosthodontic alloys. J Prosthet Dent. 1982;47:399.
Koran, A, Powers, JM, Lepeak, PJ, et al. Stain resistance of maxillofacial materials. J Dent Res. 1979;58:1455.
Mesu, FP. Degradation of luting cements measured in vitro. J Dent Res. 1982;61:655.
Raptis, CM, Powers, JM, Fan, PL, et al. Staining of composite resins by cigarette smoke. J Oral Rehabil. 1982;9:367.
Solovan, DF, Powers, JM. Effect of denture cleansers on partial denture alloys and resilient liners. J Mich Dent Assoc. 1978;60:135.
Walls, AW, McCabe, JF, Murray, JJ. An erosion test for dental cements. J Dent Res. 1985;64:1100.
Wilson, AD, Merson, SA, Prosser, HJ. A sensitive conductimetric method for measuring the material initially water-leached from dental cements. I. Zinc polycarboxylate cements. J Dent. 1980;8:263.