Mechanical Properties
In the oral environment, restorative materials are exposed to chemical, thermal, and mechanical challenges. These challenges can cause deformation of the material. The science that studies how biological materials interact and deform is called biomechanics. The mechanical properties of a material define how the material responds to thermal and mechanical challenges. Mechanical properties need to be considered collectively, because no single mechanical property can give a true measure of quality or performance. Optimization of one property might compromise the performance in another, so it is essential to understand the principles involved in a variety of mechanical properties to optimize the clinical service of a material. It is also important to consider the intended application of a material. For example, the mechanical requirements of a provisional restorative material are very different from that of a permanent material. Similarly, the properties required of an impression material are necessarily different from a cast and die material. This chapter will introduce concepts of elastic, plastic, and viscoelastic deformation and mechanical quantities including force, stress, strain, strength, toughness, hardness, friction, and wear in terms of performance of materials in the oral environment.
FORCE
Force is generated by one body interacting with another. Forces may be applied through actual contact of the bodies or at a distance (e.g., gravity). The result of an applied force on a body is translation or deformation of the body depending on whether the body is rigid or deformable. If the body remains at rest (i.e., does not move or translate), the force causes the body to deform or change its shape. If the body is free of constraints, an applied force results in movement or translation.
A force is defined by three characteristics: point of application, magnitude, and direction of application. The direction of a force is characteristic of the type of force. The International System of Units (SI) unit of force is the Newton, N.
OCCLUSAL FORCES
One of the most important applications of materials science in dentistry is in the study of forces applied to teeth and dental restorations. Numerous reports in the dental literature describe the measurement of occlusal forces. Maximum forces range from 200 to 3500 N.
Occlusal forces created between adult teeth are greatest in the posterior region closest to the mandibular hinge axis and decrease from the molar region to the incisors. Forces on the first and second molars vary from 400 to 800 N. The average force on the bicuspids, cuspids, and incisors is about 300, 200, and 150 N, respectively. A somewhat nonlinear but definite increase in force from 235 to 494 N occurs in growing children, with an average yearly increase of about 22 N.
FORCES ON RESTORATIONS
Equally important to the study of forces on natural dentition is the measurement of forces and stresses on restorations such as intracoronal restorations, single- and multiple-unit fixed restorations, removable partial dentures, and complete dentures. In an early study of occlusal force, the average occlusal force produced by patients with fixed partial dentures replacing a first molar was 250 N on the restored side and 300 N on the opposite side, where they had natural dentition. For comparison, the average occlusal forces on healthy permanent teeth were 665, 450, and 220 N on molars, bicuspids, and incisors, respectively.
Patients with removable partial dentures generate occlusal forces in the range of 65 to 235 N. For patients with complete dentures, the average force on the molars and bicuspids was about 100 N, whereas the forces on the incisors averaged 40 N. Age and gender variations in the patient populations contribute to the large variation in force values. In general, the occlusal force produced by women is about 90 N less than that applied by men.
These studies and others indicate that the occlusal force on the first molars of patients with fixed partial dentures is about 40% of the force exerted by patients with natural dentition. A further decrease in force is measured in patients with complete or removable partial dentures. Patients who wear such prostheses exert only about 15% of the force applied by persons with natural dentition.
Maximum occlusal force and the response of underlying tissue change with anatomic location, age, occlusal scheme, and placement of a dental prosthesis. Restoration design and material selection needs to consider the location, opposing dentition, and force-generating capacity of the patient. These factors can often be estimated by the success or failure of other restorations in the patient’s mouth. A material or design sufficient to withstand the forces of occlusion in the anterior segment may not be sufficient for the posterior segment.
STRESS
When a force acts on a constrained body, a resistance is developed to this external force application. This internal reaction is equal in intensity and opposite in direction to the applied external force, and is called stress, typically denoted as S or σ. Both the applied force and the internal resistance (stress) are distributed over an area of the body, so the stress in a object is designated as the force per unit area, or stress = force/area. Stress is often difficult to measure directly, so the force and the area to which the force is applied are measured, and stress is calculated from the ratio of force per area. The unit of stress therefore is the unit of force (N) divided by a unit of area, and is commonly expressed in SI units as Pascal (1 Pa = 1 N/m2 = 1 MN/mm2). It is common to report stress in units of megaPascals (MPa), where 1 MPa = 106 Pa.
Because the stress in a structure varies directly with the force and inversely with area, the area over which the force acts is an important consideration. This is particularly true in dental restorations in which the areas over which the forces are applied often are extremely small. For example, the area of contact from clasps on removable partial dentures, orthodontic retainers, or cuspal contact may have cross-sectional areas of only 0.16 to 0.016 cm2.
As a numerical example, a 20-gauge orthodontic wire has a diameter of 0.8 mm and a cross-sectional area of 0.5 mm2. If a 220-N force is applied to a wire of this diameter, the stress developed is equivalent to 220 N/0.5 mm2, or 440 N/mm2 (MPa).
Stress is always normalized to a 1-m2 area, but a dental restoration such as a small occlusal pit restoration may have no more than 4 mm2 of surface area, if it were assumed that the restoration were 2 mm on a side. If a biting force of 440 N is concentrated on this area, the stress developed would be 100 MPa. Therefore, stresses equivalent to several hundreds of MPa occur in many types of restorations. Stresses can be produced in the range of thousands of MPa when the contact area of a cusp or dental explorer is used to apply the force.
TYPES OF STRESS
A force can be directed to a body from any angle or direction, and often several forces are combined to develop complex stresses in a structure. In general, individually applied forces may be axial (tensile or compressive), shear, bending, or torsional. These directional forces are illustrated in a simplified manner in Fig. 4-1. All stresses, however, can be resolved into combinations of two basic types—axial and shear.
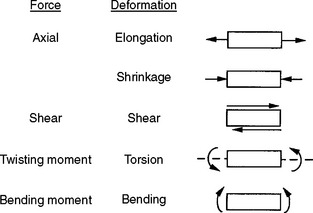
Tension results in a body when it is subjected to two sets of forces directed away from each other in the same straight line or when one end is constrained and the other end subjected to a force directed away from the constraint. Compression results when the body is subjected to two sets of forces directed toward each other in the same straight line or when one surface is constrained and the other is subjected to a force directed toward the constraint. Shear is the result of two sets of forces directed parallel to each other, but not along the same straight line. Torsion results from the twisting of a body, and bending results from an applied bending moment. When tension is applied, the molecules making up the body resist being pulled apart. When compression is applied, they resist being forced more closely together. As a result of a shear stress application, one portion of the body must resist sliding past another. These resistances of a material to deformation represent the basic qualities of elasticity of solid bodies.
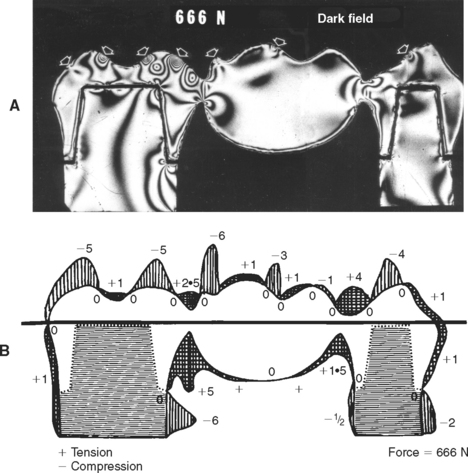
An example of the complexity and varying direction and magnitude of stresses in the oral cavity is shown in Fig. 4-2, in which a photoelastic model of a three-unit fixed partial denture has been loaded in compression by the opposing dentition. The arrows in Fig. 4-2, A, indicate locations of contact that are under compressive stress. Fig. 4-2, B, shows the type of stress at the periphery of the model and illustrates that the occlusal surface of the prosthesis is subjected alternately to areas of compression and tension, whereas the gingival portion of the pontic is under tensile stress. The soldered joints, however, are under both tensile and shear stress.
STRAIN
In the discussion of force, the deformation of a deformable body when a force is applied to it was described. It is important to recognize that each type of stress is capable of producing a corresponding deformation in a body (see Fig. 4-1). The deformation resulting from a tensile or pulling force is an elongation of a body in the axis of applied force, whereas a compressive or pushing force causes compression or shortening of the body in the axis of loading. Strain,  , is described as the change in length (ΔL = L − Lo) per original length (Lo) of the body when it is subjected to a load. The units of measurement (length/length) cancel in the calculation of strain:

Thus, if a load is applied to a specimen with an original length of 2 mm resulting in a new length of 2.02 mm, it has deformed 0.02 mm and the strain is 0.02/2 = 0.01, or 1%. Strain is often reported as a unitless value or as a percentage. Although the length units cancel in the calculation of strain, it is best to include the units in the calculation to specify the scale of the measurement (m/m; mm/mm; μm/μm). The amount of strain will differ with each type of material and with the magnitude of the load applied. Note that regardless of the composition or nature of the material, and regardless of the magnitude and type of load applied to the material, deformation and strain result with each stress application. Strain is an important consideration in dental restorative materials, such as clasps or orthodontic wires, in which a large amount of strain can occur before failure, resulting in a material that can be bent and adjusted without fracturing. Strain is also important in impression materials, where the material needs to deform elastically to enable the impression to be withdrawn from hard tissue undercuts.
STRESS-STRAIN CURVES
If a bar of material is subjected to an applied force, F, the magnitude of the force and the resulting deformation (δ) can be measured. In another bar of the same material, but different dimensions, the force-deformation characteristics change (Fig. 4-3, A). However, if the applied force is normalized by the cross-sectional area A of the bar (stress), and the deformation is normalized by the original length of the bar (strain), the resultant stress-strain curve now becomes independent of the geometry of the bar (Fig. 4-3, B). It is therefore preferred to report the stress-strain relations of a material rather than the force-deformation characteristics. The stress-strain relationship of a dental material is studied by measurement of the load and deformation and then calculation of the corresponding stress and strain.
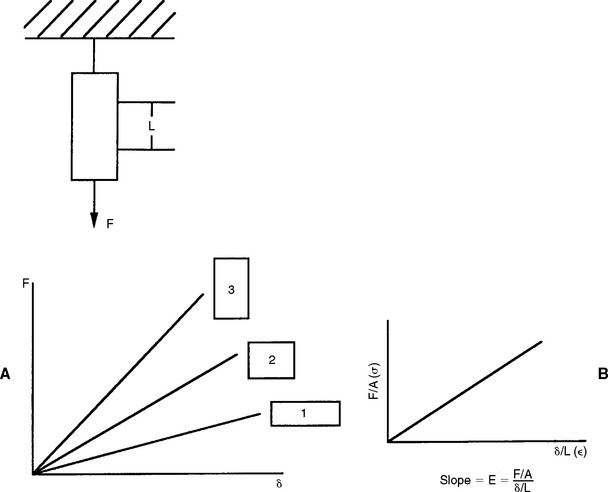
FIGURE 4-3 A, Force-deformation characteristics for the same material but having different dimensions. B, Stress-strain characteristics of the same group of bars. The stress-strain curve is independent of the geometry of the bar.
When testing materials, loads should be applied at a uniform rate and deformation should occur at a uniform rate. A typical machine that permits testing of tension, compression, or shear is shown in Fig. 4-4. In the figure, a rod is clamped between two jaws and the tensile properties are measured by pulling the specimen. The load is measured electronically with a force transducer and the deformation is measured with an extensometer clamped over a given length of the specimen. One obtains a plot of load versus deformation, which can be converted to a plot of stress versus strain (Fig. 4-5) by the simple calculations described previously. By convention, strain is plotted on the x-axis as an independent variable because most tests are operated in strain control, where a constant strain is applied to the specimen and the resulting force is measured.
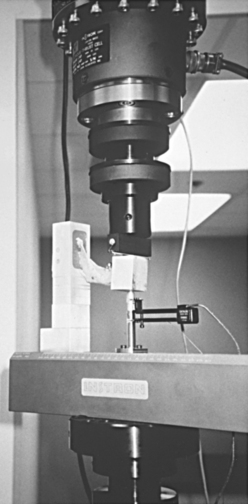
FIGURE 4-4 Servo-hydraulic mechanical testing machine capable of applying axial, shear, bending, and torsional loads to a material.
In the calculation of stress, it is assumed that the cross-sectional area of the specimen remains constant during the test. The resulting stress-strain curve is called an engineering stress-strain curve, and stresses are calculated based on the original cross-sectional area. For many materials, significant changes in the area of the specimen can occur as it is being deformed. A stress-strain curve based on stresses calculated from a changing, or actual, cross-sectional area is called a true stress-strain curve. A true stress-strain curve may be quite different from an engineering stress-strain curve at high loads because significant changes in the cross-sectional area of the specimen may occur, particularly when the specimen is tested in tension. In this example, if the cross-sectional area decreases, the true stress will be higher than the engineering stress. In most mechanical tests, the original cross-sectional area is used for calculating stress because it is often very difficult to measure the cross-sectional area as it changes throughout the experiment. We will use engineering stress in the presentation of stress-strain curves in this chapter.
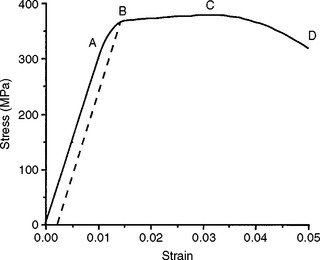
A stress-strain curve for a hypothetical material subjected to increasing tensile stress until failure is shown in Fig. 4-5. As the stress is increased, the strain is increased. In fact, in the initial portion of the curve, from 0 to A, the strain is linearly proportional to the stress, and as the strain is doubled, the amount of stress is also doubled. When a stress that is higher than the value registered at A is achieved, the strain changes are no longer linearly proportional to the stress changes. Hence the value of the stress at A is known as the proportional limit.
PROPORTIONAL AND ELASTIC LIMITS
The proportional limit (S PL or σPL) is defined as the greatest stress that a material will sustain without deviation from the linear proportionality of stress to strain. Below the proportional limit, no permanent deformation occurs in a structure. When the stress is removed, the structure will return to its original dimensions. Within this range of stress application, the material is elastic in nature, and if the material is stressed to some value below the proportional limit, an elastic or reversible strain will occur. The region of the stress-strain curve before the proportional limit is called the elastic region. The application of a stress greater than the proportional limit results in a permanent or irreversible strain in the specimen; the region of the stress-strain curve beyond the proportional limit is called the plastic region. This statement refers to linearly elastic materials where the relationship up to the yield stress is linear. There are exceptions to this general rule, however. Materials described as superelastic exhibit nonlinear elastic behavior, that is, their relationship between stress and strain in the elastic region does not follow a straight line, but removal of the load results in a return to zero strain.
The elastic limit (S EL or σEL) is defined as the maximum stress that a material will withstand without permanent deformation. For linearly elastic materials the proportional limit and elastic limit represent the same stress within the structure, and the terms are often used interchangeably in referring to the stress involved. An exception is when superelastic materials are considered. It is important to remember, however, that the two terms differ in fundamental concept; one deals with the proportionality of strain to stress in the structure, whereas the other describes the elastic behavior of the material. For the same material, values for proportional or elastic limit obtained in tension versus compression will differ.
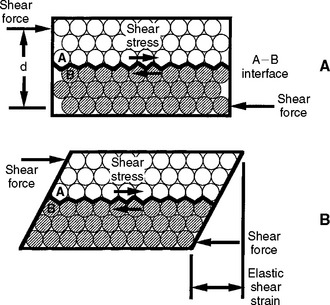
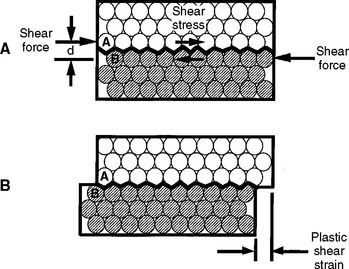
The concepts of elastic and plastic behavior can be illustrated with a simple schematic model of the deformation of atoms in a solid under stress (Fig. 4-6). The atoms are shown in Fig. 4-6, A with no stress applied, and in Fig. 4-6, B, with an applied stress that is below the value of the proportional limit. When the stress shown in B is removed, the atoms return to their positions shown in A. When a stress is applied that is greater than the proportional limit, the atoms can move to a position as shown in Fig. 4-7, B, and on removal of the stress, the atoms remain in this new position. The application of a stress less than the proportional or elastic limit results in a reversible strain, whereas a stress greater than the proportional or elastic limit results in an irreversible or permanent strain in the specimen.
YIELD STRENGTH
It is often difficult to explicitly measure the proportional and elastic limits because the precise point of deviation of the stress-strain curve from linearity is difficult to determine. The yield strength or yield stress or yield point (YS or σY) of a material is a property that can be determined readily and is often used to describe the stress at which the material begins to function in a plastic manner. At this stress, a limited permanent strain has occurred in the material. The yield strength is defined as the stress at which a material exhibits a specified limiting deviation from proportionality of stress to strain. The amount of permanent strain is arbitrarily selected for the material being examined and may be indicated as 0.1%, 0.2%, or 0.5% (0.001, 0.002, 0.005) permanent strain. The amount of permanent strain is referred to as the percent offset. Many specifications use 0.2% as a convention, but this depends on the plastic behavior of the material tested. For stiff materials with small elongation the calculation of yield stress will include greater offsets than those materials with larger elongation or deformation.
The yield stress is determined by selecting the desired offset or strain on the x-axis and drawing a line parallel to the linear region of the stress-strain curve. The point at which the parallel line intersects the stress-strain curve is the yield stress. On the stress-strain curve shown in Fig. 4-5, for example, the yield strength is represented by the value B. This represents a stress of about 360 MPa at a 0.25% offset. This yield stress is slightly higher than that for the proportional limit because it includes a specified amount of deformation. Note that when a structure is permanently deformed, even to a small degree (such as the amount of deformation at the yield strength), it does not return completely to its original dimensions when the stress is removed. For this reason, the elastic limit and yield strength of a material are among its most important properties because they define the transition from elastic to plastic behavior.
Any dental structure that is permanently deformed through the forces of mastication is usually a functional failure to some degree. For example, a fixed partial denture that is permanently deformed through the application of excessive occlusal forces would be shifted out of the proper occlusal relation for which it was originally designed. The prosthesis becomes permanently deformed because a stress equal to or greater than the yield strength was developed. Recall also that malocclusion changes the stresses placed on a restoration; a deformed prosthesis may therefore be subjected to greater stresses than originally intended because the occlusion that was distributed over a larger number of occlusal contacts may now be concentrated on a smaller number of contacts. Under these conditions, fracture does not occur if the material is able to plastically deform. Permanent deformation results, which represents a destructive example of deformation. A constructive example of permanent deformation and stresses in excess of the elastic limit is observed when shaping an orthodontic appliance or adjusting a clasp on a removable partial denture. In these examples, it is necessary to introduce a stress into the structure in excess of the yield strength if the material is to be permanently bent or adapted. Although the clasp is bent and held in that position by permanent deformation, function of the clasp results from deformation of the clasp within the elastic region. For small deformations within the elastic range, the clasp will exhibit elastic recovery and provide retention. This is the basis for function of retainers including clasps, o-rings, and implant screws. Values of yield strength for some partial denture alloys are listed in Table 4-1.
ULTIMATE STRENGTH
In Fig. 4-5, the test specimen is subjected to its greatest stress at point C. The ultimate tensile strength or stress (UTS) is defined as the maximum stress that a material can withstand before failure in tension, whereas the ultimate compressive strength or stress (UCS) is the maximum stress a material can withstand in compression. The ultimate engineering stress is determined by dividing the maximum load in tension (or compression) by the original cross-sectional area of the test specimen. The ultimate tensile strength of the material in Fig. 4-5 is about 380 MPa.
The ultimate strength of an alloy is used in dentistry to give an indication of the size or cross-section required for a given restoration. Note that an alloy that has been stressed to near the ultimate strength will be permanently deformed, so a restoration receiving that amount of stress during function would be useless. Therefore, although data on materials used in dentistry usually specify values for ultimate strength, the use of ultimate strength as a criterion for evaluating the relative merits of various materials should not be overemphasized. The yield strength is often of greater importance than ultimate strength because it is a estimate of when a material will start to deform permanently.
FRACTURE STRENGTH
In Fig. 4-5 the test specimen fractured at point D. The stress at which a brittle material fractures is called the fracture strength or fracture stress (S F or σF). Note that a material does not necessarily fracture at the point at which the maximum stress occurs. After a maximum tensile force is applied to some materials, the specimen begins to elongate excessively, resulting in necking or a reduction of cross-sectional area. The stress calculated from the force and the original cross-sectional area may drop before final fracture occurs because of the reduction in cross-sectional area. Accordingly, the stress at the end of the curve is less than at some intermediate point on the curve. Therefore, in materials that exhibit necking the ultimate and fracture strengths are different. However, for the specific cases of many dental alloys and ceramics subjected to tension, the ultimate and fracture strengths are similar, as is seen later.
ELONGATION
The deformation that results from the application of a tensile force is elongation. Elongation is extremely important because it gives an indication of the workability of an alloy. As may be observed from Fig. 4-5, the elongation of a material during a tensile test can be divided conveniently into two parts: (1) the increase in length of the specimen below the proportional limit (from 0 to A), which is not permanent and is proportional to the stress applied; and (2) the elongation beyond the proportional limit and up to the fracture strength (from A to D), which is permanent. The permanent deformation may be measured with an extensometer while the material is being tested and calculated from the stress-strain curve. Total elongation is commonly expressed as a percentage. The percent elongation is calculated as follows:

The total percent elongation includes both the elastic elongation and the plastic elongation. The plastic elongation is usually the greater of the two, except in materials that are quite brittle or those with very low stiffness. A material that exhibits a 20% total elongation at the time of fracture has increased in length by one fifth of its original length. Such a material, as in many dental gold alloys, has a high value for plastic or permanent elongation and, in general, is a ductile type of alloy, whereas a material with only 1% elongation would possess little permanent elongation and be considered brittle.
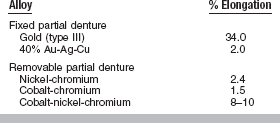
Values of percent elongation of some fixed prosthetic and removable partial denture alloys are compared in Table 4-2. An alloy that has a high value for total elongation can be bent permanently without danger of fracture. Clasps can be adjusted, orthodontic appliances can be prepared, and crowns or inlays can be burnished if they are prepared from alloys with high values for elongation. When selecting alloys for specific clinical purposes, therefore, it is necessary to recognize that because they may be subjected to permanent deformation and adaptation during the construction or assembly of the restoration, it is necessary to have an acceptable amount of elongation. In other restorations in which permanent deformation is not anticipated, it is possible to employ materials with a lower value for elongation. A relationship exists between elongation and yield strength for many materials, including dental gold alloys, where, generally, the higher the yield strength, the less the elongation.
ELASTIC MODULUS
The measure of elasticity of a material is described by the term elastic modulus, also referred to as modulus of elasticity or Young’s modulus, and denoted by the variable E. The elastic modulus represents the stiffness of a material within the elastic range. The elastic modulus can be determined from a stress-strain curve (see Fig. 4-5) by calculating the ratio of stress to strain or the slope of the linear region of the curve. The modulus is calculated from the equation

or

Because strain is unitless, the modulus has the same units as stress and is usually reported in MPa or GPa (1 GPa = 1000 MPa).
The elastic qualities of a material represent a fundamental property of the material. The interatomic or intermolecular forces of the material are responsible for the property of elasticity (see Fig. 4-6). The stronger the basic attraction forces, the greater the values of the elastic modulus and the more rigid or stiff the material. Because this property is related to the attraction forces within the material, it is usually the same when the material is subjected to either tension or compression. The property is generally independent of any heat treatment or mechanical treatment that a metal or alloy has received, but is quite dependent on the composition of the material.
The elastic modulus is determined by the slope of the elastic portion of the stress-strain curve, which is calculated by choosing any two stress and strain coordinates in the elastic or linear range. As an example, for the curve in Fig. 4-5 the slope can be calculated by choosing the following two coordinates:

and


Stress-strain curves for two hypothetical materials, A and B, of different composition are shown in Fig. 4-8. Inspection of the curves shows that for a given stress, A is elastically deformed less than B, with the result that the elastic modulus for A is greater than for B. This difference can be demonstrated numerically, by calculating the elastic moduli for the two materials subjected to the same stress of 300 MPa. At a stress of 300 MPa, material A is strained to 0.010 (1%) and the elastic modulus is
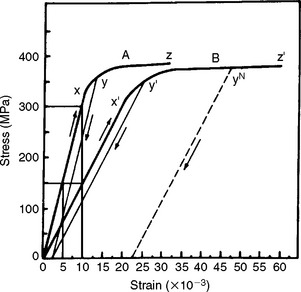

On the other hand, material B is strained to 0.02 (2%), or twice as much as material A for the same stress application. The equation for the elastic modulus for B is

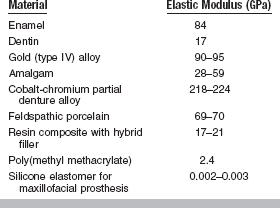
The fact that material A has a steeper slope in the elastic range than material B means that a greater stress application is required to deform material A to a given amount than for material B. From the curves shown in Fig. 4-8, it can be seen that a stress of 300 MPa is required to deform A to the same amount elastically that B is deformed by a stress of 150 MPa. Therefore, A is said to be stiffer or more rigid than B. Conversely, B is more flexible than A. Materials such as elastomers and other polymers have low values for the elastic modulus, whereas many metals and ceramics have much higher values, as shown in Table 4-3.
POISSON’S RATIO
During axial loading in tension or compression there is a simultaneous axial and lateral strain. Under tensile loading, as a material elongates in the direction of load, there is a reduction in cross-section. Under compressive loading, there is an increase in the cross-section. Within the elastic range, the ratio of the lateral to the axial strain is called Poisson’s ratio (V). In tensile loading, the Poisson’s ratio indicates that the reduction in cross-section is proportional to the elongation during the elastic deformation. The reduction in cross-section continues until the material is fractured. Poisson’s ratio is a unitless value because it is the ratio of two strains.
Poisson’s ratios of some dental materials are listed in Table 4-4. Most rigid materials exhibit a Poisson’s ratio of about 0.3. Brittle substances such as hard gold alloys and dental amalgam show little permanent reduction in cross-section during a tensile test. More ductile materials such as soft gold alloys, which are high in gold content, show a high degree of reduction in cross-sectional area and higher Poisson’s ratios.
DUCTILITY AND MALLEABILITY
Two significant properties of metals and alloys are ductility and malleability. These properties cannot always be determined readily from a stress-strain curve. The ductility of a material represents its ability to be drawn into wire in tension. The material is subjected to a permanent deformation while being subjected to these tensile forces. The malleability of a substance represents its ability to be hammered or rolled into thin sheets without fracturing.
A high degree of compression or elongation indicates good malleability and ductility, although some metals show some exception to this rule. The reduction in area in a specimen, together with the elongation at the breaking point, is, however, a good indication of the relative ductility of a metal or alloy.
Ductility is a property that has been related to the workability of a material in the mouth (e.g. burnishability of the margins of a casting). Although ductility is important, the amount of force necessary to cause permanent deformation during the burnishing operation also must be considered. A burnishing index has been used to rank the ease of burnishing alloys and is equal to the ductility (elongation) divided by the yield strength.
The relative malleability and ductility of 10 metals used in dentistry and industry are given in Table 4-5. It is interesting that gold and silver, used extensively in dentistry, are the most malleable and ductile of the metals, but other metals do not follow the same order for both malleability and ductility. In general, metals tend to be ductile, whereas ceramics tend to be brittle.
RESILIENCE
Resilience is the resistance of a material to permanent deformation. It indicates the amount of energy necessary to deform the material to the proportional limit. Resilience is therefore measured by the area under the elastic portion of the stress-strain curve, as illustrated in Fig. 4-9, A. Resilience can be measured by calculating the area of the triangle, (½)bh, outlined by the hypotenuse created from the linear portion of the stress-strain curve and the two legs created by projecting the hypotenuse to the x- and y-axes. The resilience of the material in Fig. 4-5, for example, would be ½ × 0.011 m/m × 330 MN/m2 = 1.82 m MN/m3. The units are mMN/m3 (meter × megaNewtons per cubic meter), which represents energy per unit volume of material.
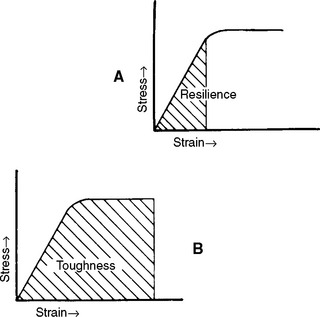
FIGURE 4-9 Stress-strain curves showing A, the area indicating the resilience, and B, the area representing the toughness of a material.
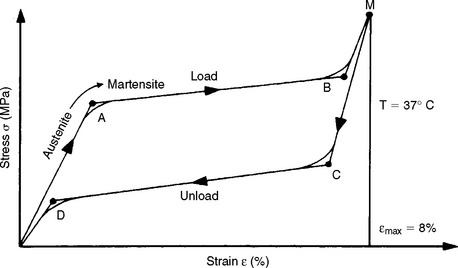
Resilience has particular importance in the evaluation of orthodontic wires. An example is the amount of work expected from a particular spring to move a tooth. There is also interest in the amount of stress and strain at the proportional limit because these factors determine the magnitude of the force that can be applied to the tooth and how far the tooth can move before the spring is no longer effective. For example, Fig. 4-10 illustrates the load-deflection curve for a nickel-titanium (Ni-Ti) orthodontic wire. Note that the loading (activation) portion of the curve is different from the unloading (deactivation) portion. This difference is called hysteresis.
TOUGHNESS
Toughness, which is the resistance of a material to fracture, is an indication of the amount of energy necessary to cause fracture. The area under the elastic and plastic portions of a stress-strain curve, as shown in Fig. 4-9, B, represents the toughness of a material. Toughness is not as easy to calculate as resilience, and the integration is usually done numerically. The units of toughness are the same as the units of resilience—mMN/m3 or mMPa/m. Toughness represents the energy required to stress the material to the point of fracture. Note that a material can be tough by having a combination of high yield and ultimate strength and moderately high strain at rupture, or by having moderately high yield and ultimate strengths and a large strain at rupture.
FRACTURE TOUGHNESS
Recently the concepts of fracture mechanics have been applied to a number of problems in dental materials. Fracture mechanics characterizes the behavior of materials with cracks or flaws. Flaws or cracks may arise naturally in a material or nucleate after a time in service. In either case, any defect generally weakens a material, and as a result, sudden fractures can arise at stresses below the yield stress. Sudden, catastrophic fractures typically occur in brittle materials that do not have the ability to plastically deform and redistribute stresses. The field of fracture mechanics provides an analysis of and design basis against these types of failures.
Two simple examples illustrate the significance of defects on the fracture of materials. It takes considerable force to break a glass bar; however, if a small notch is placed on the surface of the glass bar, less force is needed to cause fracture. If the same experiment is performed on a ductile material, we find that a small surface notch has no effect on the force required to break the bar, and the ductile bar can be bent without fracturing (Fig. 4-11). For a brittle material such as glass, no local plastic deformation is associated with fracture, whereas for a ductile material, plastic deformation, such as the ability to bend, occurs without fracture. The ability to be plastically deformed without fracture, or the amount of energy required for fracture, is the fracture toughness.
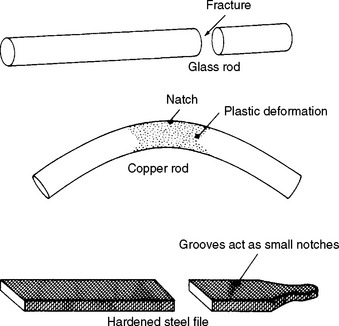
FIGURE 4-11 Schematic of different types of deformation in brittle (glass, steel file) and ductile (copper) materials of the same diameter and having a notch of the same dimensions. (From Flinn RA, Trojan PK: Engineering materials and their applications, Boston, 1981, Houghton Mifflin, p 535.) Houghton Mifflin
In general, the larger a flaw, the lower the stress needed to cause fracture. This is because the stresses, which would normally be supported by material, are now concentrated at the edge of the flaw. The ability of a flaw to cause fracture depends on the fracture toughness of the material. Fracture toughness is a material property and is proportional to the energy consumed in plastic deformation.
A material can be characterized by the energy release rate, G, and the stress intensity factor, K. The energy release rate is a function of the energy involved in crack propagation, whereas the stress intensity factor describes the stresses at the tip of a crack. The stress intensity factor changes with crack length and stress according to

where Y is a function that is dependent on crack size and geometry. A material fractures when the stress intensity reaches a critical value, K c. This value of the stress intensity at fracture is called the fracture toughness. Fracture toughness gives a relative value of a material’s ability to resist crack propagation. The units of K c are units of stress (force/length2) × units of length1/2, or force × length−3/2, and are typically reported as MN m−3/2 or MPa m1/2.
As will be discussed later in this chapter, nano-indentation techniques have recently been introduced as a means of measuring mechanical properties of micron-sized phases in a material. By selectively indenting specific regions of a microstructure, the relative effects of different microstructural constituents may be identified. The spatial variation in properties may also be determined. For example, amalgams show significant differences in fracture toughness as a function of distance from the margin.
Fracture toughness (K Ic) has been measured for a number of important restorative materials, including amalgams, acrylic denture base materials, composites, ceramics, orthodontic brackets, cements, and human enamel and dentin. Typical values for composites, ceramics, enamel, and dentin are indicated in Table 4-6.
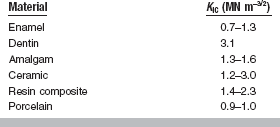
The presence of fillers in polymers substantially increases fracture toughness. The mechanisms of toughening are presumed to be matrix-filler interactions but are not yet established. Similarly, the addition of up to 50 wt% of zirconia to ceramic increases fracture toughness. As with other mechanical properties, aging or storage in a simulated oral environment or at elevated temperatures can decrease fracture toughness, but there is no uniform agreement in the literature. Attempts to correlate fracture toughness with wear resistance have been mixed, and therefore it is not an unequivocal predictor of the wear of restorative materials.
PROPERTIES AND STRESS-STRAIN CURVES
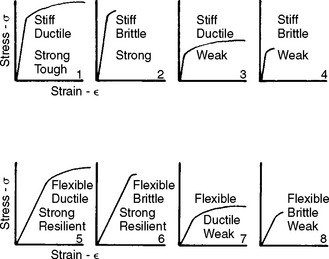
The shape of a stress-strain curve and the magnitudes of the stress and strain allow classification of materials with respect to their general properties. The idealized stress-strain curves in Fig. 4-12 represent materials with various combinations of physical properties. For example, materials 1 to 4 have high stiffness, materials 1, 2, 5, and 6 have high strength, and materials 1, 3, 5, and 7 have high ductility. If the only requirement for an application is stiffness, materials 1 to 4 would all be satisfactory. However, if the requirements were both stiffness and strength, only materials 1 and 2 would now be acceptable. If the requirements were to also include ductility, the choice would be limited to material 1. It is clear that the properties of stiffness, strength, and ductility are independent, and materials may exhibit various combinations of these three properties.
OTHER MECHANICAL PROPERTIES
TENSILE PROPERTIES OF BRITTLE MATERIALS
Many restorative materials, including dental amalgam, cements, ceramics, plaster, and stone, are much weaker in tension than in compression, which may contribute to failure of the material in service. Tests traditionally used for ductile materials can be adapted to brittle materials such as the ones listed previously, but brittle materials must be tested with caution, as any stress concentrations at the grips or anywhere else in the specimen can lead to premature fracture. As a result, there is large variability in tensile data on brittle materials. Although special grips have been used to permit axial tensile loading with a minimum of localized stress concentrations, obtaining uniform results is still difficult, and such testing is relatively slow and time consuming.
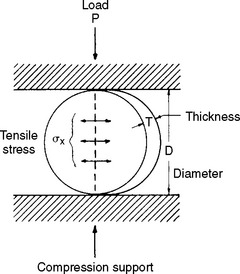
An alternative method of testing brittle materials, in which the ultimate tensile strength of a brittle material is determined through compressive testing, is popular because of its relative simplicity and reproducibility of results. The method is described in the literature as the diametral compression test for tension. In this test, a disk of the brittle material is compressed diametrically in a testing machine until fracture occurs, as shown in Fig. 4-13. The compressive stress applied to the specimen introduces a tensile stress in the material in the plane of the force application of the test machine. The tensile stress (σx) is directly proportional to the load (P) applied in compression through the following formula:
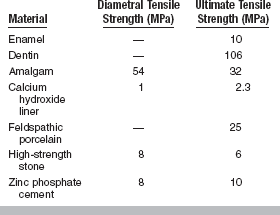
Note that this test is designed for brittle materials. If the specimen deforms significantly before failure or fractures into more than two equal pieces, the data may not be valid. Some materials exhibit different diametral tensile strengths when tested at different rates of loading and are described as being strain-rate sensitive. The diametral tensile test is not valid for these materials. Values of diametral and ultimate tensile strengths for some dental materials are listed in Table 4-7.
COMPRESSIVE PROPERTIES
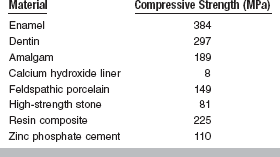
Compressive strength is most useful for comparing materials that are brittle and generally weak in tension. Compressive strength is therefore a useful property for the comparison of dental amalgam, resin composites, and cements and for determining the qualities of other materials such as plaster and investments. Typical values of compressive strength of some restorative dental materials are given in Table 4-8.
Characteristics observed in materials tested in tension are also observed when a material is in compression. For example, a stress-strain curve can be recorded for a material in compression similar to that obtained in tension. Such a curve represents a material that has both elastic and plastic characteristics when subjected to compressive stress, although the plastic region is generally small. Modulus of elasticity, proportional limit, yield strength, and ultimate strength are calculated for compression in the same way as for tension.
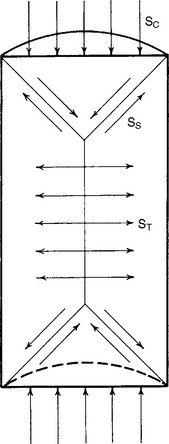
When a structure is subjected to compression, failure of the body may occur as a result of complex stress formations in the body. This is illustrated by a cross-sectional view of a right cylinder subjected to compression, as shown in Fig. 4-14. It is apparent from Fig. 4-14 that the forces of compression applied to each end of the specimen are resolved into forces of shear along a cone-shaped area at each end and, as a result of the action of the two cones on the cylinder, into tensile forces in the central portion of the mass. Because of this resolution of forces in the body, it has become necessary to adopt standard sizes and dimensions to obtain reproducible test results. Fig. 4-14 shows that if a test specimen is too short, the force distributions become more complicated as a result of the cone formations overlapping in the ends of the cylinder. If the specimen is too long, buckling may occur. Therefore, the cylinder should have a length twice that of the diameter for the most satisfactory results.
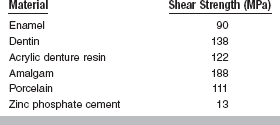
SHEAR STRENGTH
The shear strength is the maximum stress that a material can withstand before failure in a shear mode of loading. It is particularly important in the study of interfaces between two materials, such as ceramic-metal or an implant-tissue interface. One method of testing the shear strength of dental materials is the punch or push-out method, in which an axial load is applied to push one material through another. The shear strength (τ) is calculated by

where F is the compressive force applied to the specimen, d is the diameter of the punch, and h is the thickness of the specimen. Note that the stress distribution caused by this method is not “pure” shear and that results often differ because of differences in specimen dimensions, surface geometry, composition and preparation, and mechanical testing procedure. However, it is a simple test to perform and has been used extensively. Alternatively, shear properties may be determined by subjecting a specimen to torsional loading. Shear strengths of some dental materials are listed in Table 4-9.
BOND STRENGTH
A variety of tests have been developed to measure the bond strength between two materials, such as ceramics or laboratory composites to metal; cements to metal; or polymers, ceramics, resin composites, and adhesives to human enamel and dentin. Most of the tests are designed to place the bond in tension, although a few, especially for ceramics to metals, place the bond in shear. To simulate oral conditions, many of the test specimens are subjected to cycles of varying temperature, ranging from 5° to 55° C, before measuring bond strength. These bond strength values may not simulate the clinical situation because of differences between the geometry of the test specimens and the clinical application. Bond strength values typically overestimate the bond strength obtained in clinical usage and should therefore be viewed with caution. It should also be noted that bond strength tests rarely isolate stresses to pure tension or pure shear. Bond strength performed in tension cannot be directly compared to those done in shear.
FLEXURE
The bending or flexural properties of many materials are as or more important than their tensile or compressive properties. The flexural properties of stainless steel wires, endodontic files and reamers, and hypodermic needles are especially important. For example, ANSI/ADA Specification No. 28 for endodontic files and reamers requires flexure tests.
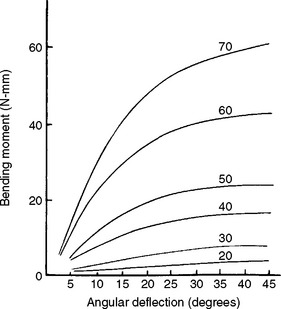
Flexural properties are measured by bending a beam-shaped specimen. In a single cantilever beam configuration, the beam is fixed at one end and a force is applied at a prescribed distance from the fixed end. In a dual cantilever beam configuration, both ends of the beam are fixed and a load is placed on the center of the beam. In a three-point or four-point flexural configuration, the beam is supported on two rollers and a load is applied to the top of the beam. Specimens are subjected to conditions that resemble pure bending, and beam theory is used to analyze the data. As the force is increased and the specimen is bent, corresponding values for the angle of bending and the bending moment (force × distance) are recorded. Graphic plots of the bending moment versus the angle of bending are similar in appearance to stress-strain curves. As an example, a series of plots for various sizes of endodontic reamers is shown in Fig. 4-15. An instrument will be permanently bent if the bending angle exceeds the value at the end of the linear portion of the curve. The larger instruments are stiffer, as shown by the initial steeper slope. The initial linear portion of the curve is shorter for the larger instruments and thus the deviation from linearity occurred at lower angular bends.
The maximum bending stress σ in a wire is

where M is the bending moment, y is the distance from the neutral axis (plane of the specimen which is stress free) to the outer surface of specimen, and I is the moment of inertia, which indicates the distribution of forces relative to the specimen geometry.
The maximum angle of bending, θmax, of a wire fixed at one end may be determined by the following formula:

where l is the distance from the point of force application to the fixed end, and E is the modulus. For round wires with l/d ∼ 15 and l = 25 mm, the elastic modulus in bending (also called modulus of stiffness) approximates the elastic modulus in tension. The equation is
where l is the span length of the wire, d is the diameter of the wire, and M/θ is the slope of a plot of bending moment versus angular deflection in radians. The use of cantilever beam theory to calculate E results in values about two thirds those determined in tension.
FLEXURAL STRENGTH
The flexural strength of a material is obtained when one loads a simple beam, simply supported (not fixed) at each end, with a load applied in the middle (Figs. 4-16 and 4-17). Such a test is called a three-point bending (3PB) test and the maximum stress measured in the test is called flexural strength. The flexural strengths for several dental materials are shown in Table 4-10. The flexural strength test is especially useful in comparing denture base materials in which a stress of this type is applied to a specimen of denture acrylic with masticatory loads. This test determines not only the strength of the material indicated, but also the amount of distortion expected. The flexural strength test is a part of ANSI/ADA Specification No. 12 (ISO 1567) for denture base resins. The flexural strength and accompanying deformation are important also in long fixed partial denture spans in which the occlusal stress may be severe.
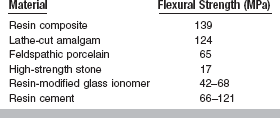
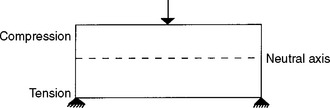
FIGURE 4-16 Schematic of a three-point bending (transverse strength, flexural strength, modulus of rupture) test.
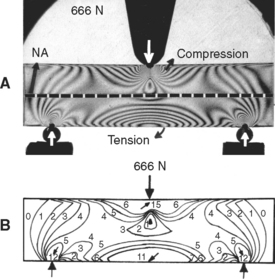
FIGURE 4-17 Photo-elastic analysis of flexural strength test. A, Photo-elastic model with isochromatic fringes. B, Drawing to illustrate isochromatic fringe order.
The stresses and deflections in three-point bending can be determined as specific cases of the more general formulae presented in the last section. A beam having a rectangular cross-section of width, b, and height, d, has a moment of inertia of
For a load, P, applied in the center, the bending moment is

Substituting these relations for I and M into the general equation θ = My/I, the equation for the maximum stress developed in a rectangular beam loaded in the center of the span becomes

or
The resulting deformation or displacement in such a beam or bridge can be calculated from

or
The significance of the length, thickness, and width of the restoration in relation to the strength and deformation is evident from these formulae. Both the length and the thickness of the span are critical, because the deformation varies as the cube of these two dimensions.
As a numerical example, consider a simple beam, such as the one shown in Fig. 4-16, with a rectangular cross-section of 6.4 mm in thickness and 25.4 mm in height and a concentrated load of 666 N applied in the center. The total length of the beam is 102 mm, and the distance between supports is 89 mm. Because this is a static situation (i.e., the beam does not move), the reactant forces at the supports in this symmetrical loading are 333 N each. The solution for this beam may be calculated as follows:

The moment of inertia is determined by

Thus at the lower surface of the beam, y = 12.7 mm and

or 21.5 MPa. The lower surface of the beam is under a tensile stress of 21.5 MPa, and the upper surface is under a compressive stress of 21.5 MPa. The maximum deflection is

Four-point bending is often preferred to three-point bending when measuring flexural modulus and flexural strength. If an easily deformed material is tested with inadequately rounded loading and support elements, the elements can cause localized deformation. This is undesirable because the beam theory used to calculate deflection assumes uniform beam deformation without localized stresses and constraints. A four-point bend fixture uses two loading elements instead of the one used in a three-point bend fixture. The two loading elements apply a more uniform load to the beam that prevents V-shaped buckling of the beam in the midline when a single loading element is used.
PERMANENT BENDING
During fabrication, many dental restorations are subjected to permanent bending. The adjustment of removable partial denture clasps and the shaping of orthodontic appliances are two examples of such bending operations. Bends are also often introduced into hypodermic needles or endodontic files in service. Comparisons of wires and needles of different compositions and diameters subjected to repeated 90-degree bends are often made. The number of bends a specimen will withstand is influenced by its composition and dimensions, as well as its treatment in fabrication. Such tests are important because this information is not readily related to standard mechanical test data such as tensile properties or hardness. Severe tensile and compressive stresses can be introduced into a material subjected to permanent bending. It is partly for this reason that tensile and compressive test data for a material are so important.
TORSION
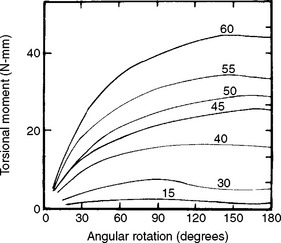
Another mode of loading important to dentistry is torsion or twisting. For example, when an endodontic file is clamped at the tip and the handle is rotated, the instrument is subjected to torsion. Because most endodontic files and reamers are rotated in the root canal during endodontic treatment, their properties in torsion are of particular interest. ANSI/ADA Specification No. 28 for endodontic files and reamers describes a test to measure resistance to fracture by twisting with a torque meter. Torsion results in a shear stress and a rotation of the specimen. In these types of applications, we are interested in the relation between torsional moment (M t = shear force × distance) and angular rotation π. A series of graphs in which the torsional moment was measured as a function of angular rotation are shown in Fig. 4-18. In this example, the instruments were twisted clockwise, which results in an untwisting of the instrument. As was the case with bending, the curves appear similar to stress-strain curves, with an initial linear portion followed by a nonlinear portion. The instruments should be used clinically so that they are not subjected to permanent angular rotation; thus the degrees of rotation should be limited to values within the linear portion of the torsional moment-angular rotation curves. The larger instruments are stiffer in torsion than the smaller ones, but their linear portion is less. The irregular shape of the curves at high angular rotation results from the untwisting of the instruments.
The resultant shear stress in a wire of radius r may be calculated from
where I z is the polar moment of inertia. The angular rotation Φ may be calculated from
where L is the length of the shaft, and G is the shear modulus.
FATIGUE STRENGTH
Based on the previous discussions, a structure that has been subjected to a stress below the yield stress and subsequently relieved of this stress should return to its original form without any change in its internal structure or properties. It has been found that a few such applications of stress do not appreciably affect a material. However, when this stress is repeated a great number of times, the strength of the material may be drastically reduced and ultimately cause failure. Fatigue is defined as a progressive fracture under repeated loading. Fatigue tests are performed by subjecting a specimen to alternating stress applications below the yield strength until fracture occurs. Tensile, compressive, shear, bending, and torsional fatigue tests can all be performed.
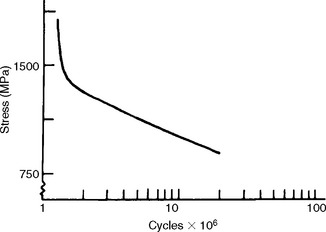
The fatigue strength is the stress at which a material fails under repeated loading. Failure under repeated or cyclic loading is therefore dependent on the magnitude of the load and the number of loading repetitions. Fatigue data are often represented by an S-N curve, a curve depicting the stress (or strain) at which a material will fail as a function of the number of loading cycles. An example of such a curve is shown in Fig. 4-19. From this curve we see that when the stress is sufficiently high, the specimen will fracture at a relatively low number of cycles. As the stress is reduced, the number of cycles required to cause failure increases. Therefore, when specifying fatigue strength, the number of cycles must also be specified. For some materials, a stress at which the specimen can be loaded an infinite number of times without failing is eventually approached. This stress is called the endurance limit.
The determination of fatigue properties is of considerable importance for dental restorations subjected to alternating forces during mastication. Stress applications during mastication may approach 300,000 flexures per year, whereas the greater stress generated by removing and inserting clasp retained removable partial dentures from the mouth probably amounts to less than 1500 per year. Because dental materials can be subjected to moderate stresses repeated a large number of times, it is important in the design of a restoration to know what stress it can withstand for a predetermined number of cycles. Restorations should be designed so the clinical cyclic stresses are below the fatigue limit. Many gold cast alloys, for example, can withstand from 1 million to 25 million flexures without fracture when a stress below the yield stress is applied.
Fatigue fractures develop from small cracks and propagate through the grains of a material. In general, the causes of cyclic failure in a material are inhomogeneities and flaws of the material. These imperfections lead first to the development of microcracks, which coalesce and ultimately lead to a macroscopic crack and failure. Areas of stress concentration, such as surface defects and notches, are particularly dangerous and can lead to catastrophic failure.
Fatigue properties do not always relate closely to other mechanical properties. Some parameters that influence fatigue are grain size and shape, composition, texture, surface chemistry and roughness, material history (i.e., fabrication and heat treatment), and environment. For example, in dental appliances made of resin the internal stresses developed during the molding and processing tend to subject the structure to fatigue failure.
Note that the environment to which a material is subjected is a critical factor in determining fatigue properties. Any environmental agent that can degrade a material will reduce fatigue strength. Therefore elevated temperatures, humidity, aqueous media, biological substances, and pH deviations away from neutral can all reduce fatigue properties. As a result, fatigue data, which are typically presented based on tests in laboratory air at room temperature, are not always relevant to the service conditions in the oral cavity. The higher temperature, humidity, saline environment with proteins, and fluctuating pH all tend to reduce fatigue strength from its level in the laboratory.
VISCOELASTICITY
In the previous discussions of the relationship between stress and strain, the effect of load application rate was not considered. In many metals and brittle materials, the effect is rather small. However, the rate of loading is important in many materials, particularly polymers and biological tissues. The mechanical properties of many dental materials, such as alginate, elastomeric impression materials, waxes, amalgam, polymers, bone, dentin, oral mucosa, and periodontal ligaments, are dependent on how fast they are stressed. For these materials, increasing the loading (strain) rate produces a different stress-strain curve with higher rates giving higher values for the elastic modulus, proportional limit, and ultimate strength. Materials that have mechanical properties independent of loading rate are termed elastic. Materials that have mechanical properties dependent on loading rate are termed viscoelastic. In other words, these materials have characteristics of an elastic solid and a viscous fluid. The properties of an elastic solid were previously discussed in detail. Before viscoelastic materials and properties are presented, fluid behavior and viscosity are reviewed.
FLUID BEHAVIOR AND VISCOSITY
In addition to the many solid dental materials that exhibit some fluid characteristics, many dental materials, such as cements and impression materials, are in the fluid state when formed. Therefore (viscous) fluid phenomena are important. Viscosity (η) is the resistance of a fluid to flow and is equal to the shear stress divided by the shear strain rate, or
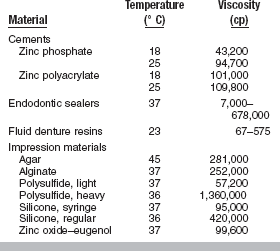
When a cement or impression material sets, the viscosity increases, making it less viscous and more solid-like. The units of viscosity are poise, p (1 p = 0.1 Pa s = 0.1 N s/m2), but often data are reported in centipoise, cp (100 cp = 1 p). Some typical values of viscosity for dental materials are listed in Table 4-11. As a basis for comparison, the viscosity of water at 20° C is 1 cp.
Rearranging the equation for viscosity, we see that fluid behavior can be described in terms of stress and strain, just like elastic solids.
In the case of an elastic solid, stress (σ) is proportional to strain (), with the constant of proportionality being the modulus of elasticity (E). The foregoing equation indicates an analogous situation for a viscous fluid, where the (shear) stress is proportional to the strain rate and the constant of proportionality is the viscosity. The stress is therefore time dependent because it is a function of the strain rate, or rate of loading. To better comprehend the concept of strain rate dependence, consider two limiting cases—rapid and slow deformation. A material pulled extremely fast (dt → 0) results in an infinitely high stress, whereas a material pulled infinitesimally slow results in a stress of zero.
The behavior of elastic solids and viscous fluids can be understood from simple mechanical models. An elastic solid can be viewed as a spring (Fig. 4-20). When the spring is stretched by a force, F, it displaces a distance, x. The applied force and resultant displacement are proportional, and the constant of proportionality is the spring constant, k. Therefore

Note that this relation is equivalent to

Also note that the model of an elastic element does not involve time. The spring acts instantaneously when stretched. In other words, an elastic solid is independent of loading rate.
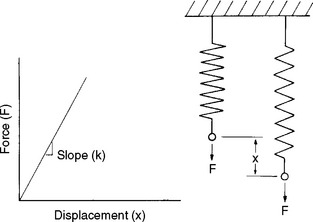
FIGURE 4-20 Force versus displacement of a spring, which can be used to model the elastic response of a solid. (From Park JB: Biomaterials science and engineering, New York, 1984, Plenum Press, p 26.) Plenum Press
A viscous fluid can be viewed as a dashpot, or a shock absorber with a damping fluid (Fig. 4-21). When the fluid-filled cylinder is pulled, the rate of strain (d /dt) is proportional to the stress (τ) and the constant of proportionality is the viscosity of the fluid (η).
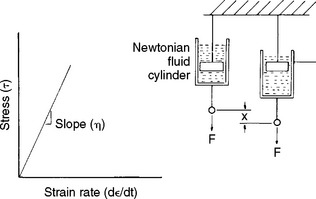
FIGURE 4-21 Stress versus strain rate for a dashpot, which can be used to model the response of a viscous fluid. (From Park JB: Biomaterials science and engineering, New York, 1984, Plenum Press, p 26.) Plenum Press
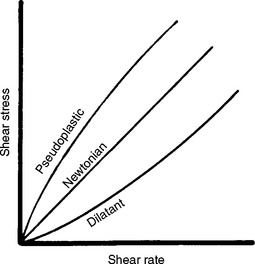
Although the viscosity of a fluid is proportional to the shear rate, the proportionality differs for different fluids. Fluids may be classified as Newtonian, pseudoplastic, or dilatant depending on how their viscosity varies with shear rate, as shown in Fig. 4-22. The viscosity of a Newtonian fluid is constant and independent of shear rate. Certain dental cements and impression materials are Newtonian. The viscosity of a pseudoplastic fluid decreases with increasing shear rate. Several endodontic cements are pseudoplastic, as are monophase elastomeric impression materials. When subjected to low shear rates during spatulation or while an impression is made in a tray, these impression materials have a high viscosity and possess “body” in the tray. These materials, however, can also be used in a syringe, because at the higher shear rates encountered as they pass through the syringe tip, the viscosity decreases by as much as tenfold. This characteristic is sometimes referred to as “thixotropy,” although thixotropy actually describes the change in viscosity of a material with time. The viscosity of a dilatant fluid increases with increasing shear rate. Examples of dilatant fluids in dentistry include the fluid denture base resins.
VISCOSITY AND TIME AND TEMPERATURE
Two additional factors that influence the viscosity of a material are time and temperature. The viscosity of a nonsetting liquid is typically independent of time and decreases with increasing temperature. Most dental materials, however, begin to set after the components have been mixed, and their viscosity increases with time, as evidenced by most dental cements and impression materials. A notable exception is zinc oxide–eugenol cement that requires moisture to set. On the mixing pad, these cements maintain a constant viscosity that is described clinically as a long working time. Once placed in the mouth, however, the zinc oxide–eugenol cements show rapid increases in viscosity because exposure to heat and humidity accelerates the setting reaction.
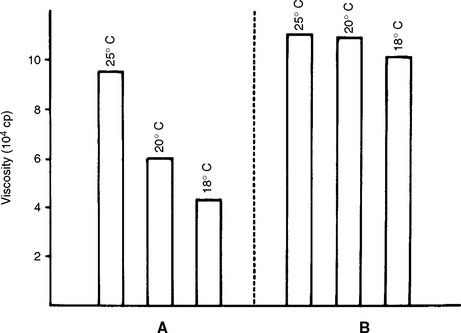
In general, for a material that sets, viscosity increases with increasing temperature. However, the effect of heat on the viscosity of a material that sets depends on the nature of the setting reaction. For example, the initial viscosities of a zinc phosphate cement (material A) and a zinc polycarboxylate cement (material B) are compared at three temperatures in Fig. 4-23. The setting reaction of A is highly exothermic, and mixing at reduced temperatures results in a lower viscosity than when mixed at higher temperatures. The setting reaction of B is less affected by temperature. Clinically, additional working time is achieved for these cements by the use of cool-slab mixing techniques.
VISCOELASTIC MATERIALS
For viscoelastic materials, altering the strain rate alters the stress-strain properties. The tear strength of alginate impression material, for example, is increased about four times when the rate of loading is increased from 2.5 to 25 cm/min. Another example of strain-rate dependence is the elastic modulus of dental amalgam, which is 21 GPa at slow rates of loading and 62 GPa at high rates of loading. A viscoelastic material therefore may have widely different mechanical properties depending on the rate of load application, and for these materials it is particularly important to specify the loading rate with the test results.
Materials that have properties dependent on the strain rate are better characterized by relating stress or strain as a function of time. Two properties of importance to viscoelastic materials are stress relaxation and creep. Stress relaxation is the reduction in stress in a material subjected to constant strain, whereas creep is the increase in strain in a material under constant stress.
As an example of stress relaxation, consider how the load-time curves at constant deformation are important in the evaluation of orthodontic elastic bands. The decrease in load (or force) with time for latex and plastic (alastic) bands of the same size at a constant extension of 95 mm is shown in Fig. 4-24. The initial force was much greater with the plastic band, but the decrease in force with time was much less for the latex band. Therefore, plastic bands are useful for applying high forces, although the force decreases rapidly with time, whereas latex bands apply lower forces, but the force decreases slowly with time in the mouth; latex bands are therefore useful for applying more sustained loads.
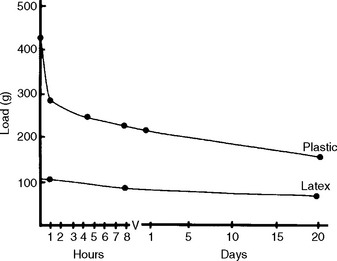
FIGURE 4-24 Decrease in load of latex rubber and plastic bands as a function of time at a constant extension of 95 mm. (From Craig RG, editor: Dental materials: a problem-oriented approach, St Louis, 1978, Mosby-Year Book.)
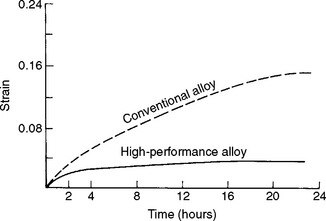
The importance of creep can be seen by interpretation of the data in Fig. 4-25, which shows creep curves for low- and high-copper amalgam. For a given load at a given time, the low-copper amalgam has a greater strain. The implications and clinical importance of this are that the greater creep in the low-copper amalgam makes it more susceptible to strain accumulation and fracture, and also marginal breakdown, which can lead to secondary decay. Note that low-copper amalgam is no longer commonly used in dentistry.
MECHANICAL MODELS OF VISCOELASTICITY
Because a viscoelastic material may be viewed as a material exhibiting characteristics of both a solid and a fluid, we may also understand the behavior of a viscoelastic material in terms of combinations of the simple mechanical models of a spring and dashpot, introduced previously. Strain as a function of time for the various combinations is shown in Fig. 4-26. When a constant load is applied (at time t 0) to a spring (an ideal elastic element), an instantaneous strain occurs and the strain remains constant with time; when the load is removed (at time t 1), the strain instantaneously decreases to zero. When a constant load is applied to an ideal viscous element, the strain increases linearly with time, and when the load is removed, no further increase or decrease in strain is observed. The elastic element reacts instantaneously (changes strain) to a change in load, and the viscous element reacts after a finite time.
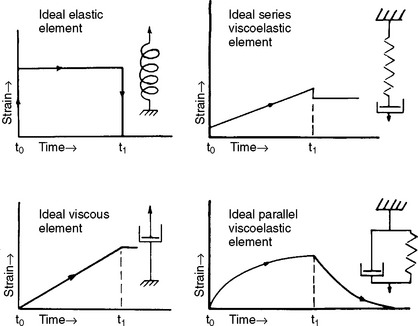
FIGURE 4-26 Strain-time relationship of combinations of springs and viscous elements. A constant load is applied at time t 0 and removed at time t 1.
The relative time-course of spring and dashpot reactions is observed when the two ideal elements are combined. When a spring and viscous element are in series (a Maxwell model) and a fixed load is applied, a rapid increase in strain occurs and is followed by a linear increase in strain with time. The resultant strain, often referred to as the viscoelastic strain, represents a combination of elastic and viscous responses. The rapid increase in strain represents the elastic portion of the strain (i.e., response of the elastic spring), whereas the linear increase represents the viscous portion of the strain (i.e., response of the viscous component). When the load is removed an instantaneous recovery of the elastic strain occurs, but the viscous strain remains.
A constant load applied to a spring and viscous element in parallel (a Kelvin or Voigt model) causes a nonlinear increase in strain with time as a result of the viscous element and reaches a constant value as a result of the spring. On removal of the load, the spring acts to decrease the strain to zero. However, the strain does not instantaneously diminish to zero because of the action of the dashpot. Note that real materials exhibit more complex behavior than these simple models predict, and modeling the strain-time properties requires a combination of the elements described. Impression materials, such as alginate, polysulfide, and silicone, have been modeled by a Maxwell model in series with a Kelvin model.
An example of the importance of viscoelasticity lies with impression materials. Because these materials are viscoelastic, they do not immediately lose their strain when a load is removed. Therefore on removal from the mouth, these materials remain stressed, and thus time is required for the material to recover before a die can be poured.
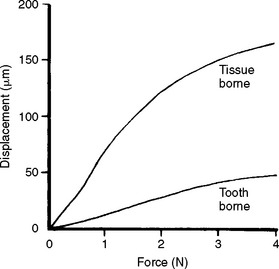
The viscoelasticity of the oral tissues also has important clinical implications. The palatal mucosa has little resistance to loading compared with the periodontal ligament. Thus, denture baseplates supported by palatal mucosa show substantially more displacement as a function of load than those supported by teeth (Fig. 4-27). The creep of the palatal mucosa under load is sustained and recovery is prolonged and variable because the mechanism of deformation and recovery is controlled by physiological and physical factors. Making an impression of the mucosal tissues in their resting state therefore requires that the tissues be allowed to recover free of the denture for several hours. Teeth, on the other hand, will recover from load within minutes. Recording the mucosal tissues under load will result in recoil of these tissues, initially displacing the denture base and artificial teeth to a position superior to the natural teeth. However, the tissues will return to their displaced state on loading of the denture.
CREEP COMPLIANCE
A creep curve yields insight into the relative elastic, viscous, and inelastic response of a viscoelastic material; such curves can be interpreted in terms of the molecular structure of the associated materials, which have structures that function as elastic, viscous, and inelastic elements. On removal of a load, a creep recovery curve can be obtained (Fig. 4-28). In such a curve, after the load is removed there is an instantaneous drop in strain and slower strain decay to some steady-state strain value, which may be nonzero. The instantaneous drop in strain represents the recovery of elastic strain. The slower recovery represents the inelastic strain, and the remaining, permanent strain represents the viscous strain. A family of creep curves can be determined by using different loads. A more useful way of presenting these data is by calculating the creep compliance. Creep compliance (J t) is defined as strain divided by stress at a given time. Once a creep curve is obtained, a corresponding creep compliance curve can be calculated. The creep compliance curve shown in Fig. 4-29 is characterized by the equation
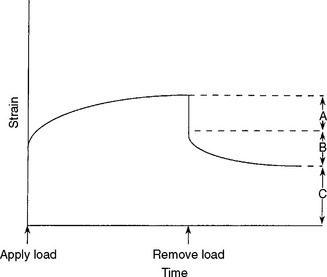
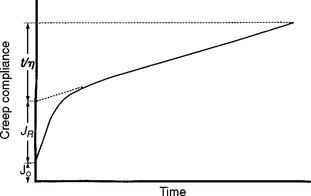
FIGURE 4-29 Creep compliance versus time for a viscoelastic material. (Adapted from Duran RL, Powers JM, Craig RG: J Dent Res 58:1801, 1979.)
where J 0 is the instantaneous elastic compliance, J R is the retarded elastic (inelastic) compliance, and t/η represents the viscous response at time t for a viscosity η. The strain associated with J 0 and J R is completely recoverable after the load is removed; however, the strain associated with J R is not recovered immediately but requires some finite time. The strain associated with t/η is not recovered and represents a permanent deformation. If a single creep compliance curve is calculated from a family of creep curves determined at different loads, the material is said to be linearly viscoelastic. Then the viscoelastic qualities can be described concisely by a single curve.
The creep compliance curve therefore permits an estimate of the relative amount of elastic, inelastic, and viscous behavior of a material. J 0 indicates the flexibility and initial recovery after deformation, J R the amount of delayed recovery that can be expected, and t/η the magnitude of permanent deformation to be expected. Creep compliance curves for elastomeric impression materials are shown in Chapter 12, Fig. 12-20.
DYNAMIC MECHANICAL PROPERTIES
Although static properties can often be related to the function of a material under dynamic conditions, there are limitations to using static properties to estimate the properties of materials subjected to dynamic loading. Static testing refers to continuous application of force at slow rates of loading, whereas dynamic testing involves cyclic loading or loading at high rates (commonly referred to as impact). Dynamic methods, including a forced oscillation technique used to determine dynamic modulus and a torsion pendulum used for impact testing, have been used to study viscoelastic materials such as dental polymers. Ultrasonic techniques have been used to determine elastic constants of viscoelastic materials such as dental amalgam and dentin. Impact testing has been applied primarily to brittle dental materials.
DYNAMIC MODULUS
The dynamic modulus (E D) is defined as the ratio of stress to strain for small cyclical deformations at a given frequency and at a particular point on the stress-strain curve. When measured in a dynamic oscillation instrument, the dynamic modulus is computed by
where m is the mass of the vibrating yoke, q is the height divided by twice the area of the cylindrical specimen, and p is the angular frequency of the vibrations.
In conjunction with the dynamic modulus, values of internal friction and dynamic resilience can be determined. For example, cyclical stretching or compression of an elastomer results in irreversibly lost energy that manifests itself as heat. The internal friction of an elastomer is comparable with the viscosity of a liquid. The value of internal friction is necessary to calculate the dynamic resilience, which is the ratio of energy lost to energy expended.
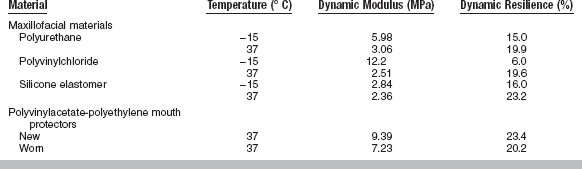
The dynamic modulus and dynamic resilience of some dental elastomers are listed in Table 4-12. These properties are affected by temperature (−15° to 37° C) for some maxillofacial elastomers, such as plasticized polyvinylchloride and polyurethane, but not so much for silicones. As shown in Table 4-12, the dynamic modulus decreases and the dynamic resilience increases as the temperature increases. As a tangible example, the dynamic resilience of a polymer used for an athletic mouth protector is a measure of the ability of the material to absorb energy from a blow and thereby protect the oral structure. Once the mouth protector has been worn, however, deterioration in properties is observed.
TABLE 4-12
Values of Dynamic Modulus and Dynamic Resilience as a Function of Temperature for Some Dental Elastomers
In general, elastic modulus calculated from dynamic testing is higher than when calculated by static testing. For viscoelastic materials, a complex modulus can be calculated that includes an elastic component called storage modulus and a viscous component called loss modulus.
IMPACT STRENGTH
A material may have reasonably high static strength values, such as compressive, tensile, and shear strengths, and even reasonable elongation, but may fail when loaded under impact. Materials such as fused glasses, cements, amalgam, and some plastics have low resistance to breakage when a load is applied by an impact. Such a sudden blow might correspond to the energy of impact resulting from an accident to a person wearing a restoration or from dropping the restoration on a floor.
The impact resistance of materials is determined from the total energy absorbed before fracture when struck by a sudden blow. Often a bar of material is supported as a beam and struck either at one end or in the middle with a weighted pendulum. A test specimen in an impact instrument is shown in Fig. 4-30. The energy absorbed by the blow can be determined by measuring the reduction in swing of the pendulum compared with the swing with no specimen present. The values are usually reported in joules, J (1 J = 1 Nm), for a specimen of a specific shape. Some substances offer relatively little resistance to the shock, whereas others of different composition may not fracture under the same impact. For example, the Charpy impact strength of unnotched specimens of denture resins ranges from 0.26 J for a conventional denture acrylic to 0.58 J for a rubber-modified acrylic resin.
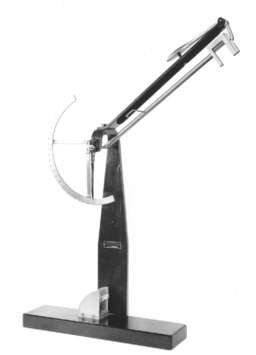
TEAR STRENGTH AND TEAR ENERGY
Tear strength is a measure of the resistance of a material to tearing forces. Tear strength is an important property of dental polymers used in thin sections, such as flexible impression materials in interproximal areas, maxillofacial materials, and soft liners for dentures. Specimens are usually crescent-shaped and notched. The tear strength of the notched specimen is calculated when the maximum load is divided by the thickness of the specimen, and the unit of tear strength is N/m.
Because of the viscoelastic nature of the materials tested, tear strength depends on the rate of loading. More rapid loading rates result in higher values of tear strength. Clinically, the rapid (or snap) removal of an alginate impression is recommended to maximize the tear strength and also to minimize permanent deformation. Typical values of tear strength are listed in Table 4-13 for some dental materials. The table indicates that the polysulfide impression materials have superior values of tear strength compared with agar and alginate hydrocolloids.
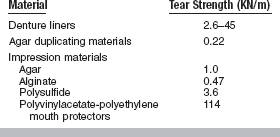
The tear energy (T) is a measure of the energy per unit area of newly torn surface and is determined from the load (F) required to propagate a tear in a trouser-shaped specimen by
where t is the specimen thickness and λ is an extension ratio. Typical values of tear energy determined for some dental impression materials and maxillofacial materials are listed in Table 4-14.
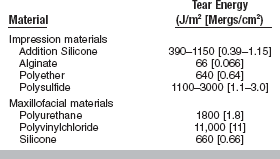
MECHANICAL PROPERTIES OF COMPOSITES
Many materials used in dentistry are not homogeneous solids but consist of two or more essentially insoluble phases. There may be one continuous phase and one or more dispersed phases, or there may be two or more continuous phases, with each of these phases containing one or more dispersed phases. These materials are called composites. A composite can be generally defined as a combination of two or more different materials still present as separate entities in the final material. Although composites take advantage of selected properties of each material, the physical and mechanical properties of the composites are different from those of the separate phases. The trend in the development of materials for various applications is toward composites rather than completely new classes of materials. There can be metal, ceramic, and polymer-based composites. Important examples of dental composites include posterior resin composite used as direct esthetic restorative materials. Such composites are made from an organic polymer matrix (usually a diacrylate) filled with an inorganic phase, such as borosilicate or strontium glass, lithium or barium, aluminum silicate, or colloidal silica.
Factors that affect the properties of composites include (1) the state of matter of the second (dispersed) phase; (2) the geometry of the second phase; (3) the orientation of the second phase; (4) the composition of the dispersed and continuous phases; (5) the ratio of the phases; and (6) bonding of the phases. Examples of properties that can be changed (improved if the composites are judiciously developed) are (1) modulus, (2) strength, (3) fracture toughness, (4) wear resistance, (5) thermal expansion, and (6) chemical and corrosion resistance.
For a simple example of how adding a second phase affects properties, consider a series of continuous parallel glass fibers oriented in the same direction in a plastic matrix. If a tensile load is applied to the specimen in the direction of the fibers, the elastic modulus of the composite E c is

where E c and E m and V f and V m represent the elastic modulus and volume fraction of the fiber and matrix. If, on the other hand, the tensile load is applied in the direction transverse to the fibers, the composite elastic modulus would be

If the volume fraction of fibers is zero (i.e., the material is strictly a polymer), the modulus is that of the polymer, and if the volume fraction is 100%, the material is a glass and has the modulus of glass. Thus, the moduli of the polymer and glass serve as lower and upper bounds on the composite modulus. Furthermore, from the preceding two equations, known as the Voigt and Reuss bounds of the rule of mixtures, we see that in addition to the ratio of the two phases, the orientation of the second phase also plays an important role in the composite properties.
As a further illustration of the factors that affect the properties of a composite, consider the filled resins used in dentistry. For many of these dental composites, a random arrangement of the dispersed phase is used, even though a random orientation results in about a sixfold lower strength compared to an oriented dispersed phase. However, the resultant lower strength due to random second phase orientation can be counteracted in several ways. The use of a fine (e.g., <1 μm) dispersed phase increases strength. Also, the selection of the shape of the dispersed particles is important, with rods and plates being more effective than spheres in improving the strength. The principal factors needed are (1) a high-strength dispersed phase; (2) a more ductile matrix phase; (3) fine dispersed particles at the optimum volume fraction; and (4) adhesion between the dispersed and matrix phases. The last requirement is usually accomplished by treating the dispersed phase with an organosilane. Silanes, often called coupling agents, react with the glass or water adsorbed on the glass and form a bond with the resin.
SURFACE MECHANICAL PROPERTIES
In our discussion so far, we have introduced and discussed mechanical properties that are mainly dependent on the bulk characteristics of a material. In this section, mechanical properties that are more a function of the surface condition of a material are presented. In particular, the concepts of hardness, friction, and wear are summarized.
HARDNESS
Hardness may be broadly defined as the resistance to permanent surface indentation or penetration. Formulating a more rigorous definition of hardness is difficult because any test method will, at a microscopic level, involve complex surface morphologies and stresses in the test material, thereby involving a variety of qualities in any single hardness test. Despite this condition, the most common concept of hard and soft substances is their relative resistance to indentation. Hardness is therefore a measure of the resistance to plastic deformation and is measured as a force per unit area of indentation (Fig. 4-31).
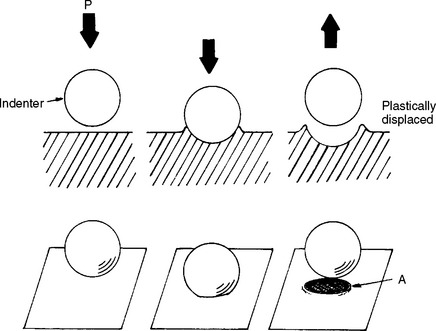
FIGURE 4-31 Schematic representation of a hardness test. A, Area of plastic deformation; P, normal load. (From Park JB: Biomaterials science and engineering, New York, 1984, Plenum Press, p 18).
Based on this definition of hardness, it is clear why this property is so important to dentistry. Hardness is indicative of the ease of finishing of a structure and its resistance to in-service scratching. Finishing or polishing a structure is important for esthetic purposes and, as discussed previously, scratches can compromise fatigue strength and lead to premature failure.
Some of the most common methods of testing the hardness of restorative materials are the Brinell, Knoop, Vickers, Rockwell, Barcol, and Shore A hardness tests. Each of these tests differs slightly from the others, and each presents certain advantages and disadvantages. They have a common quality, however, in that each depends on the penetration of some small, symmetrically shaped indenter into the surface of the material being tested. The various hardness tests differ in the indenter material, geometry, and load. The indenter may be made of steel, tungsten carbide or diamond, and be shaped as a sphere, cone, pyramid, or needle. Loads typically range from 0.5 N to 30 kN. The choice of a hardness test depends on the material of interest, the expected hardness range, and the desired degree of localization.
The general procedure for testing hardness, independent of the specific test, is as follows. A standardized force or weight is applied to the penetrating point. Applying such a force to the indenter produces a symmetrically shaped indentation, which can be measured under a microscope for depth, area, or width of the indentation produced. The indentation dimensions are then related to tabulated hardness values. With a fixed load applied to a standardized indenter, the dimensions of the indentation vary inversely with the resistance to penetration of the material tested. Thus, lighter loads are needed for softer materials.
Brinell Hardness Test
The Brinell hardness test is among the oldest methods used to test metals and alloys used in dentistry. The method depends on the resistance to the penetration of a small steel or tungsten carbide ball, typically 1.6 mm in diameter, when subjected to a load of 123 N. In testing the Brinell hardness of a material, the penetrator remains in contact with the specimen tested for a fixed time of 30 seconds, after which it is removed and the indentation diameter is carefully measured. A diagram showing the principle of Brinell hardness testing, together with a microscopic view of the indentations into a gold alloy, is shown in Fig. 4-32. The resulting hardness value, known as the Brinell hardness number (BHN), is computed as a ratio of the load applied to the area of the indentation produced. The formula for computing the BHN is as follows:

In this formula L is the load in kgf, D is the diameter of the ball in mm, and d is the diameter of the indentation in mm. The smaller the area of indentation, the harder the material and the larger the BHN value. Tables of Brinell hardness values have been developed from this formula for indentations of different diameters. Because the Brinell hardness test yields a relatively large indentation area, this test is good for determining average hardness values and poor for determining very localized values. The Brinell hardnesses of some dental casting alloys and condensed gold are listed in Table 4-15.
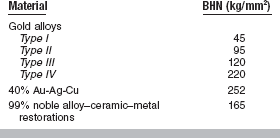
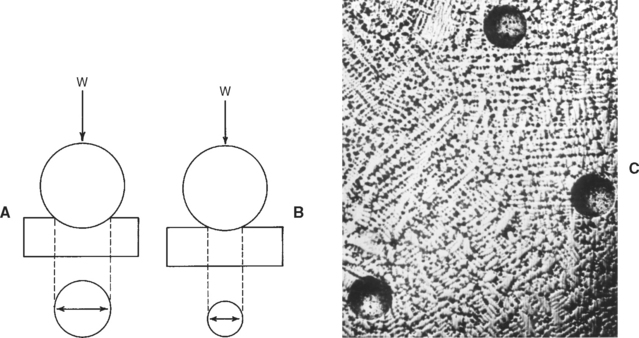
Knoop Hardness Test
The Knoop hardness test was developed to fulfill the needs of a micro-indentation test method. This test method is suitable for thin plastic or metal sheets or brittle materials where the applied load does not exceed 3.6 kgf (35 N). A load is applied to a carefully prepared diamond indenting tool with a pyramid shape, and the lengths of the diagonals of the resulting indentation in the material are measured. The shape of the indenter and the resulting indentation are illustrated in Fig. 4-33, A. The Knoop hardness number (KHN) is the ratio of the load applied to the area of the indentation calculated from the following formula:
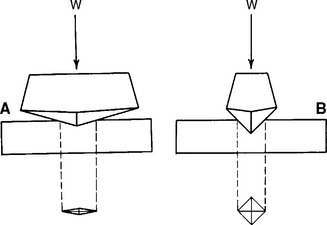
FIGURE 4-33 A, Principle of the Knoop hardness measurement; B, the diamond pyramid (Vickers) indentation test.
In this equation L is the load applied in kgf, l is the length of the long diagonal of the indentation in mm, and Cp is a constant relating l to the projected area of the indentation. The units for KHN are also kg/mm2. Similar to the Brinell method, higher values for KHN represent harder materials.
The Knoop method is designed so varying loads may be applied to the indenting instrument. The resulting indentation area, therefore, varies according to the load applied and the nature of the material tested. The advantage of this method is that materials with a great range of hardness can be tested simply by varying the test load. Because very light load applications produce extremely delicate micro-indentations, this method of testing can be employed to examine materials that vary in hardness over an area of interest. For example, the Knoop method has been used extensively in testing the hardness of both enamel and dentin in extracted teeth and in determining the hardness of metals and alloys that have isolated hard and soft phases throughout the material. The chief disadvantages of the method are the need for a highly polished and flat test specimen and the time required to complete the test operation, which is considerably greater than that required for some other, less precisely controlled methods. The KHN values of some dental materials are listed in Table 4-16.
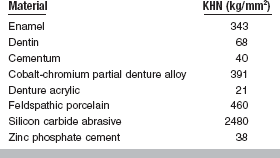
Vickers Hardness Test
The Vickers hardness test uses a square-based diamond indenter with a 136-degree point angle. This method is suitable for testing the surface hardness of materials and can be used for a very broad range of hardness. It has been used to a limited degree to test the hardness of restorative dental materials. The method is similar in principle to the Knoop and Brinell tests, except that a 136-degree diamond pyramid-shaped indenter is forced into the material with a definite load application. The indenter produces a square indentation, the diagonals of which are measured as shown in Fig. 4-33, B. Vickers hardness is calculated by dividing the load by the area of the pyramidal impression. Equipment for Knoop hardness testing has been adapted to use the 136-degree indenter. Loads are varied from 1 to 120 kg (10–1200 N), depending on the hardness of the tested material. The Vickers test is especially useful in measuring the hardness of small areas and for very hard materials.
Rockwell Hardness Test
The Rockwell hardness test was developed as a rapid method for hardness determinations. A ball or metal cone indenter is normally used, and the depth of the indentation is measured with a sensitive dial micrometer. The indenter balls or cones are of several different diameters, as well as different load applications (60 to 150 kg [588 to 1470 N]), with each combination described as a special Rockwell scale, Rockwell A-G, denoted RA, RB, etc.
The superficial Rockwell method has been used to test plastics used in dentistry. This method uses a relatively light (30 kgf [294 N]) load and a large-diameter (12.7 mm) ball in comparison with the standard Rockwell methods. The test is made by first applying a preload (minor load) of 3 kg (29.4 N). A major load of 30 kgf (294 N) then is applied to the specimen for 10 minutes before a reading is taken. Because dental plastics are viscoelastic, recovery of the indentation occurs once the major load has been removed. The percent recovery can be determined on the same specimen by the following equation:

where A is the depth of the indentation caused by application of the major load for 10 minutes, and B is the depth of the indentation after the major load has been removed for 10 minutes. Values of indentation depth and percent recovery for some dental plastics are listed in Table 4-17. The advantages of the Rockwell hardness test are that hardness is read directly and it is good for testing viscoelastic materials. The disadvantages are that a preload is needed, greater time is required, and the indentation may disappear immediately on removal of the load.
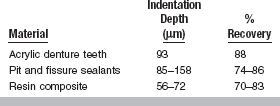
Barcol Hardness Test
Barcol hardness is one method used to study the depth of cure of resin composites. The Barcol indenter is a spring-loaded needle with a diameter of 1 mm that is pressed against the surface to be tested. If no penetration of the needle into the surface occurs, the scale reads 100. The reading on the scale decreases as the indenter penetrates the surface. Depth of cure of a resin composite is tested by preparing specimens varying in thickness from 0.5 to 6.0 mm or more in increments of 0.5 mm. Then the top surface of a specimen is activated by a light-curing unit. The Barcol hardness of the top surface is compared with that of the bottom surface. The depth of cure is defined as the maximum thickness at which the Barcol reading of the bottom surface does not change by more than 10% of the reading of the top surface. Research has shown that a 10% decrease in Barcol hardness of a resin composite results in a 20% decrease in the flexural strength.
Shore A Hardness Test
The hardness measurements described previously cannot be used to determine the hardness of elastomers, because the indentation disappears after the removal of the load. An instrument called a Shore A Durometer is used in the rubber industry to determine the relative hardness of elastomers, where hardness is measured in terms of material elasticity. The instrument consists of a blunt-pointed indenter 0.8 mm in diameter that tapers to a cylinder 1.6 mm. The indenter is attached by a lever to a scale that is graduated from 0 to 100 units. If the indenter completely penetrates the specimen, a reading of 0 is obtained, and if no penetration occurs, a reading of 100 units results. Because elastomers are viscoelastic, an accurate reading is difficult to obtain because the indenter continues to penetrate the elastomer as a function of time. The usual method is to press down firmly and quickly on the indenter and record the maximum reading as the Shore A hardness. The test has been used to evaluate soft denture liners, mouth protectors, and maxillofacial elastomers, values of which are listed in Table 4-18.
NANO-INDENTATION
Traditional indentation tests use loads as high as several kilograms and result in indentations as large as 100 μm. Although valuable for screening materials and determining relative values among different materials, these tests are subject to limitations. Many materials have microstructural constituents or, in the case of microfilled composites, filler phases substantially smaller than the dimensions of the indenter. To accurately measure the properties of these microphases, it is necessary to be able to create indentations of a smaller size scale and to spatially control the location of the indentations. In this regard, special indentation techniques have recently been introduced. These techniques, commonly referred to as nano-indentation, are able to apply loads in the range of 0.1 to 5000 mgf, resulting in indentations approximately 1 μm in size. In addition, indentation depth is continuously monitored, obviating the need to image the indentation to compute mechanical properties. Although most commonly used to measure hardness of micron-sized phases, the technique is also useful for measuring modulus. For brittle materials, yield strength and fracture toughness may be determined.
The nano-hardness, dynamic hardness, and elastic moduli values of human enamel and dentin are listed in Table 4-19, along with the nano-hardness and elastic modulus for the region of the dentin-enamel junction. The nano-hardness of dentin of 71 kg/mm2 (696 MPa) agrees well with the Knoop value of 68 kg/mm2 (666 MPa) reported in Table 4-16; however, the nano-hardness of 457 kg/mm2 (4.48 GPa) for enamel is considerably higher than the Knoop value of 343 kg/mm2 (3.36 GPa). This difference may result from the much smaller indentation used in the nano-indentation test in relation to the size of the enamel rods. The dynamic hardness values are lower than those for the corresponding nano-hardness because they are calculated from the maximum displacement, whereas the nano-hardness values are calculated from the permanent deformation. The elastic moduli of 87.7 and 24.0 GPa for enamel and dentin by nano-indentation are in reasonable agreement with the values from compressive test specimens of 84.1 and 18.3 GPa, respectively. Of special interest is the elastic modulus of 53.2 GPa for the region of the dentin-enamel junction, which is intermediate to the values for enamel and dentin. The nano-indentation test is especially useful in studying this small region, which was not possible with compressive or tensile tests.
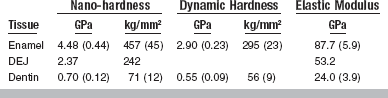
FRICTION
Friction is the resistance to motion of one material body over another. If an attempt is made to move one body over the surface of another, a restraining force to resist motion is produced (Fig. 4-34). This restraining force is the (static) frictional force and results from the molecules of the two objects bonding where their surfaces are in close contact. The frictional force, F s, is proportional to the normal force (F nt) between the surfaces and the (static) coefficient of friction (μs):

The coefficient of friction varies between 0 and 1 and is a function of the two materials in contact, their composition, surface finish, and lubrication. Similar materials have a greater coefficient of friction, and if a lubricating medium exists at the interface, the coefficient of friction is reduced.
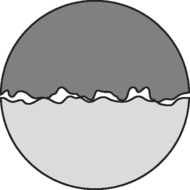
FIGURE 4-34 Microscopic area of contact between two objects. The frictional force, which resists motion, is proportional to the normal force and the coefficient of friction.
The conditions for motion are for the applied force to be greater than F s. Once motion occurs, molecular bonds are made and broken, and microscopic pieces break off from the surfaces. With motion, a sliding or kinetic friction is produced, and the force of kinetic friction opposes the motion.

Frictional behavior therefore arises from surfaces that, because of micro-roughness, have a small real contact area (see Fig. 4-34). These small surface areas result in high contact stresses, which lead to local yielding. The resistance to shear failure of the junctions results in the frictional force. When static friction is overcome and relative motion takes place, it is accompanied by the modification of the interface through kinetic friction and wear.
An example of the importance of friction in dentistry lies in the concept of sliding mechanics used in orthodontics. A known and controlled frictional force is required when an orthodontic wire is passed through a bracket designed for translation. Combinations of different materials result in different frictional forces. Friction is also an important consideration when dissimilar materials contact and slide against each other in the oral cavity such as in protrusive or working excursions of the mandible.
WEAR
Wear is a loss of material resulting from removal and relocation of materials through the contact of two or more materials. When two solid materials are in contact, they touch only at the tips of their highest asperities (see Fig. 4-35). Wear is usually undesirable, but under controlled conditions during finishing and polishing procedures, controlled wear is highly desired.
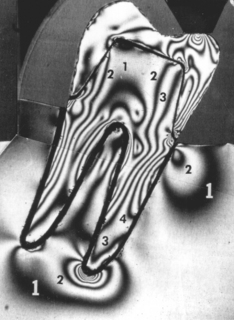
FIGURE 4-35 Stress analysis in a photoelastic model of a molar with a full crown under a concentrated force of 266 N.
Several factors make wear of biomaterials unique. Most important, wear can produce biologically active particles, which can excite an inflammatory response. The wear process can also produce shape changes that can affect function. For example, wear in the oral cavity is characterized by the loss of the original anatomical form of the material. Wear of tooth structure and restorative materials may result from mechanical, physiological, or pathological conditions. Normal mastication may cause attrition of tooth structure or materials, particularly in populations that consume unprocessed foods. Bruxism is an example of a pathological form of wear in which opposing surfaces slide against each other. If improperly performed, tooth brushing with a dentifrice may cause an abrasive form of wear.
Wear is a function of a number of material and environmental factors, including the nature of wearing surfaces (i.e., inhomogeneity, crystal orientation, phases, and inclusions present); the microscopic contact; interaction between sliding surfaces (i.e., elevated stress, temperature, and flow at contact points, leading to localized yielding, melting, and hardening); lubrication; and different material combinations. In general, wear is a function of opposing materials and the interface between them. The presence of a lubricating film, such as saliva, separates surfaces during relative motion and reduces frictional forces and wear.
In general, there are four types of wear: (1) adhesive wear; (2) corrosive wear; (3) surface fatigue wear; and (4) abrasive wear. Adhesive wear is characterized by the formation and disruption of microjunctions. The volume of wear debris, V, is determined by
where x is the total sliding distance, k is the wear coefficient, F nt is the perpendicular force, and p is the surface hardness (of the softer material).
Abrasive wear involves a soft surface in contact with a harder surface. In this type of wear, particles are pulled off one surface and adhere to the other during sliding. There can be two types of abrasive wear: two- and three-body abrasion (wear). This type of wear can be minimized if surfaces are smooth and hard and if particles are kept off the surfaces. Corrosive wear is secondary to physical removal of a protective layer and is therefore related to the chemical activity of the wear surfaces. The sliding action of the surfaces removes any surface barriers and causes accelerated corrosion. In surface fatigue wear, stresses are produced by asperities or free particles, leading to the formation of surface or subsurface cracks. Particles break off under cyclic loading and sliding.
In general, metals are susceptible to adhesive, corrosive and three-body wear, whereas polymers are susceptible to abrasive and fatigue wear.
Wear has been studied by (1) service or clinical testing, (2) simulated service measurements, (3) model systems using various wear machines, (4) measurements of related mechanical properties such as hardness, and (5) examination of the amount and type of surface failure from a single or low number of sliding strokes.
Two-body abrasion tests have been used to rank the wear resistance of restorative materials. As shown in Table 4-20, the resistance of composite resins to abrasion depends on the nature of the filler particles (glass or quartz) and on silanation of the filler. Three-body abrasion tests are often used to compare the abrasion resistance of tooth structure with that of dentifrices and prophylaxis materials. Enamel is about 5 to 20 times more resistant to abrasion than dentin. Cementum is the least resistant to abrasion. Measurements of enamel loss during a 30-second prophylaxis have shown that fluoride is removed from the enamel surface and have allowed estimation of the removal of enamel to be 0.6 to 4 μm, depending on the abrasive.
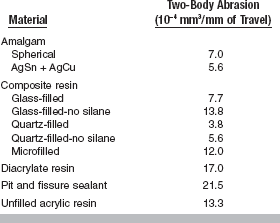
Unfortunately, a 1:1 ratio between wear observed clinically and that measured in the laboratory seldom exists. Thus, most tests strive to rank materials in an order that is seen clinically. Traditional wear tests measure the volume of material lost but do not reveal mechanisms of wear, whereas a single-pass sliding technique may characterize modes of surface failure. In general, wear data do not correlate well with other mechanical property data, making it more difficult to infer wear properties from other, simpler, laboratory tests.
In the study and evaluation of wear, note that multiple processes occur simultaneously, and materials, mechanics, and environment have combined effects on wear. Most important is the fate of the wear particles. Are these particles dissolved or distributed? If they are distributed, is their migration local or systemic, and what biological consequences can arise?
STRESS ANALYSIS AND DESIGN OF DENTAL STRUCTURES
The mechanical properties of dental restoration materials must be able to withstand the stresses and strains caused by the repetitive forces of mastication. The design of dental restorations is particularly important if the best advantage of a material is to be taken. The necessary designs are those that do not result in stresses or strains that exceed the strength properties of a material under clinical conditions.
Stresses in dental structures have been studied by such techniques as brittle coatings analysis, strain gauges, holography, two- and three-dimensional photoelasticity, finite element analysis, and other numerical methods. Stress analysis studies of inlays, crowns, bases supporting restorations, fixed bridges, complete dentures, partial dentures, endodontic posts, and implants have been reported, as well as studies of teeth, bone, and oral soft tissues. The stress analysis literature is too extensive and beyond the scope of this text to review. Only brief summaries of two-dimensional photoelasticity and finite element analysis, and the advantages and disadvantages of both, are provided.
TWO-DIMENSIONAL PHOTOELASTICITY
The procedure for two-dimensional models is to prepare a transparent plastic or other isotropic model of the restoration or appliance. The material becomes anisotropic (its properties exhibit a directional dependence) when stressed, so the behavior of light is affected by the direction it takes. As a result of the applied stress, the plastic model exhibits double refraction because of its anisotropic structure. The light from a source passes through a polarizer, which transmits light waves parallel to the polarizing axis, known as plane polarized light. The plane polarized light is converted to circularly polarized light by a quarter-wave plate, and this polarized beam is split into two components traveling along the directions of principal stress in the model. Depending on the state of stress in the model, the two beams travel at different rates. After the light emerges from the model, it passes through a second quarter-wave plate, which is crossed with respect to the first, and an analyzer that is usually perpendicular to the polarizer. The interference pattern may be recorded photographically as shown in Fig. 4-35, which is an isochromatic fringe pattern. These isochromatic fringes, or dark lines, represent locations where the difference in the principal stresses is a constant. The magnitude of the stress can be determined by identifying the order of the isochromatic fringes. Some of the fringe orders (numbers) are indicated on Fig. 4-36. The fringe order multiplied by a constant and divided by the thickness of the model gives the value of the differences in the principal stresses. Areas in the model where the fringes are close together are under higher stress gradients than areas where there are fewer fringes, and areas containing fringes of higher order are under higher stress than those having fringes of lower order.
The advantages of using photoelasticity are that it can quantify stresses throughout a threedimensional structure and determine stress gradients. However, a birefringent material is needed and the technique is more difficult with complex geometries.
FINITE ELEMENT ANALYSIS
The finite element method or analysis (FEM or FEA) is a numerical method and offers considerable advantages over photoelasticity. The method is useful for analyzing complex geometries, and it can determine stresses and strains throughout a three-dimensional component. In this method, a finite number of discrete structural elements are interconnected at a finite number of points or nodes. These finite elements are formed when the original structure is divided into a number of appropriately shaped sections, where each element is assigned the mechanical properties of the material to be simulated. The information needed to calculate the stresses and displacements in a finite element model is (1) the node and element description, (2) the elastic moduli and Poisson’s ratio for the materials associated with each element, (3) the type of boundary constraints, (4) the description of the forces applied to the external nodes, and (5) a description of the mechanical behavior of the material, such as linearly elastic, nonlinearly elastic, viscoelastic, isotropic, anisotropic, orthotropic. Note that finite element methods are purely numerical and are based on many limiting assumptions. Finite element analysis is used in the design of physical experiments, including specimen size and fixture design. It is also useful for interrogating results from physical experiments. FEA simulations can reduce the number of physical experiments and optimize design by predicting results and performance. There are a number of finite element programs available that run on low-cost computer systems. When doing a finite element analysis, it is important to understand the materials being evaluated and how to assess the simulation data. It is a powerful tool, but one that can be easily abused if the concepts are not fully understood and if the numerical model is not validated through physical experiments or other methods.
SUMMARY
The physical properties of oral restorations must adequately withstand the stresses of mastication. Several methods may be used to ensure proper performance of a restoration. With a constant force, the stress is inversely proportional to the contact area; therefore, stresses may be reduced by increasing the area over which the force is distributed. In areas of high stress, materials having high elastic moduli and strength properties should be used if possible. If a weaker material has desirable properties, such as esthetic qualities, one may minimize the stress by increasing the bulk of the material when possible or ensuring proper occlusion on the restoration.
As an example, consider liners used under amalgam restorations. Occlusal forces on the amalgam restoration create tensile stresses in the amalgam adjacent to the liner. The tensile strength of amalgam is low, and if the liner has a low elastic modulus, it allows deflection of the amalgam adjacent to the liner resulting in tensile stresses that are sufficient to initiate fracture of the amalgam. If liners are used under an amalgam, they should be applied in thin layers to prevent deformation of the amalgam restoration.
Restorations and appliances should be designed so the resulting forces of mastication are distributed as uniformly as possible. Also, sharp line angles, nonuniform areas, and notched, scratched, or pitted surfaces should be avoided to minimize stress concentrations. For example, in the construction of a complete maxillary denture, the midline notch between the central incisors should be rounded and polished to prevent localized stress concentration. This area is under repetitive stress during mastication as a result of the transverse flexure of the denture.
The maximum tensile stress in a metal partial-denture circumferential clasp is near the midpoint of the inside surface. Because brittle materials are generally weak in tension, this is a likely area of failure when a force is applied to the tip of the clasp. Other factors, such as the uniformity of the taper of the clasp, porosity in the clasp, or notches and scratches on the surface of the metal, may alter the stress pattern. If a thin or porous area exists between the junction and the tip of the clasp, failure may occur at this site rather than at the midpoint. Notched or scratched areas are especially subject to fracture from fatigue or impact. Because a partial denture clasp is flexed a great number of times at values well below the yield point, failure by fatigue is particularly significant.
The dentist is often concerned not so much with the fracture of an appliance as with the deflection that occurs when a force is applied. This is the case with a fixed partial denture, which may be cast as a single unit or may consist of soldered units. As discussed earlier in this chapter, the deflection of a beam, or in this case a fixed partial denture, supported on each end with a concentrated load in the center depends directly on the cube of the beam length and indirectly on the cube of the beam thickness. Doubling the length of the beam, therefore, increases the deflection by eight times. This also indicates that decreasing the thickness of the beam by one half increases the deflection by eight times. If too much bulk is required to develop the stiffness desired, changing to a material with a higher elastic modulus would be beneficial. If repeated failures occur, consider increasing the occlusogingival dimension of the proximal connectors, balancing the occlusion over a larger surface area, and narrowing the occlusal table.
These isolated examples of applied knowledge of biting forces and stresses in dental structures indicate why an understanding of this subject is necessary to the practicing dentist.
In summary, three interrelated factors are important in the long-term function of dental restorative materials: (1) material choice, (2) component geometry (e.g., to minimize stress concentrations), and (3) component design (e.g., to distribute stresses as uniformly as possible). It should be noted that failures can and do occur. In such instances, a failure analysis should be performed by answering several questions: (1) Why did it fail? (2) How did it fail? (3) Did the material or design fail? and (4) How can this failure be prevented in the future? Lastly, remember that dental material behavior is dependent on interrelated physical, chemical, optical, mechanical, thermal, electrical, and biological properties, and improvement of one specific property often leads to a reduction in another property.
SPECIFICATIONS FOR RESTORATIVE MATERIALS
The properties described in this and other chapters serve as the basis for a series of specifications that have been developed for restorative materials, instruments, and equipment. One group is the American National Standards Institute/American Dental Association Standards Committee on Dental Products. Standards developed and approved by this committee are reviewed by the Council on Scientific Affairs of the ADA, which has responsibility for adopting specifications. Presently, 68 specifications have been adopted. A larger group called Federal Specifications and Standards is designed to regulate requirements of federal government service agencies for the purchase and use of materials. Specifications of this type have been available for the past half-century, and additional specifications continue to be added in each group. A series of similar specifications is available for products in Australia, Japan, and several other countries. In 1963, a program for international specifications was established that combined the efforts of the Fédération Dentaire Internationale and the International Organization for Standardization. The practice of using physical test controls through methods of applied specifications is well established and will likely continue. Both the dental student and the practitioner must not only recognize that specifications for certain materials are available, but learn to some extent the qualities that are controlled by each specification. Through the specifications the quality of each product is maintained and improved.
AMERICAN DENTAL ASSOCIATION SPECIFICATIONS
The first of the American Dental Association Specifications was for amalgam alloy, formulated and reported in 1930. Since that time other specifications have been or are being formulated, as indicated in Table 4-21.
TABLE 4-21
List of American National Standards/American Dental Association (ANSI/ADA) and ISO Specifications for Dental Materials, Instruments, and Equipment
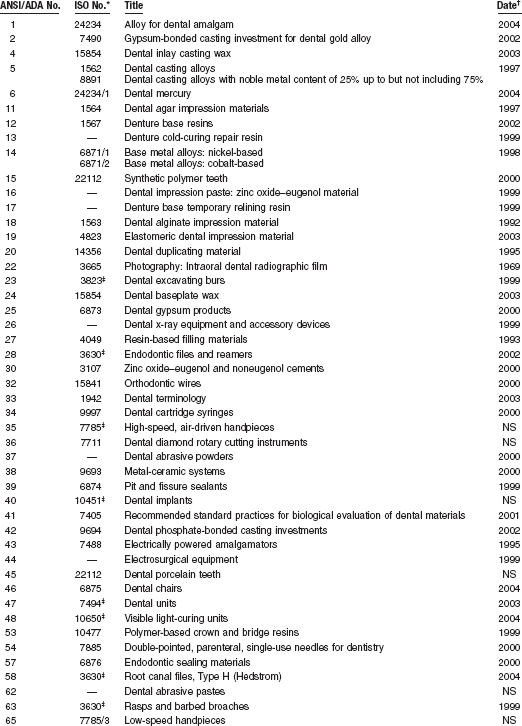
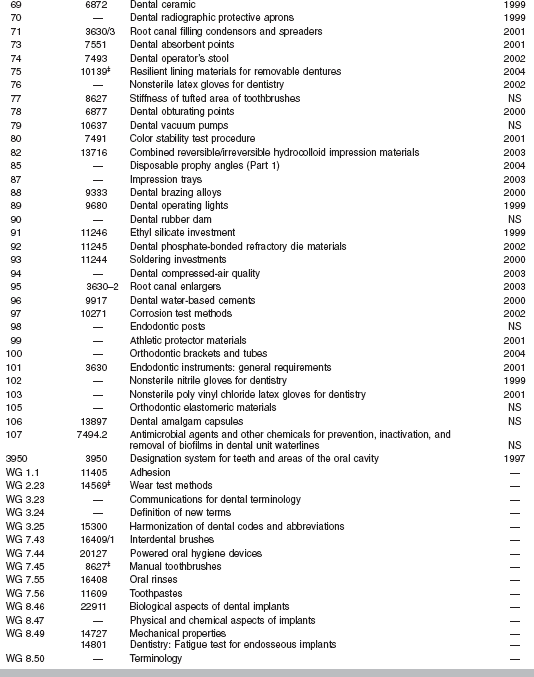
Note: Missing ANSI/ADA specifications are obsolete.
*ISO number represents equivalent or similar specification or draft.
†Date of latest revision or reaffirmation of ANSI/ADA specification; NS, new standard under development.
‡Several ISO equivalent standards exist.
Copies of the specifications and worksheets to assist in the recording of the required data are available from the Council on Scientific Affairs of the American Dental Association in Chicago. The website of the Council lists the trade names and manufacturers of accepted dental products. This publication can also be obtained from the American Dental Association.
An examination of each specification reveals a general pattern of standardization common to each material.
1. These features include an item on the scope and classification of the material, which defines the application and general nature of each material.
2. Each specification includes information on other applicable specifications.
3. The requirements of each material consider such factors as uniformity, color, or general working characteristics of the material, as well as the general limitations of test values.
4. The methods of sampling, inspection, and testing procedures include details of specimen preparation and physical tests to be performed.
5. Each specification includes information on preparation for delivery, with instructions concerning packaging, instructions for use, and marking with lot numbers and the date of manufacture.
6. Each specification includes notes that provide additional information on intended uses, and references to the literature or other special items.
The important features of each of these specifications are described appropriately in later chapters.
AMERICAN DENTAL ASSOCIATION ACCEPTANCE PROGRAM
The American Dental Association, through the Council on Scientific Affairs, maintains an acceptance program for consumer products, such as denture adherents, dental floss, and toothbrushes.
INDEX OF FEDERAL SPECIFICATIONS AND STANDARDS
The Index of Federal Specifications and Standards includes specifications for a number of restorative dental materials not described elsewhere. These specifications are used primarily by the federal services to maintain some quality control of dental products and are valuable for suppliers of these materials. In a few instances, reference is made to specific federal specifications and standards in later chapters.
With an average occlusal force of 565 N on the first or second molar, how is it possible for a patient to fracture a gold alloy fixed partial denture (FPD) in service when the alloy has a tensile strength of 690 MPa?
The stress produced by the occlusal force is a function of the cross-section of the FPD and the size of the contact area over which the force is applied. When the contact area from the opposing tooth is very small and located near a portion of the FPD having a small cross-section, bending produces tensile stresses that can exceed the tensile strength of the gold alloy. For example, in problem 1, relating the occlusal force of 565 N to the tensile strength of 690 MPa indicates that a minimum area of 0.82 mm2 is necessary in this FPD:

Why is the yield strength of a restorative material such an important property?
The yield strength defines the stress at the point at which the material changes from elastic to plastic behavior. In the elastic range, stresses and strains return to zero after biting forces are removed, whereas in the plastic range some permanent deformation results on removal of the force. Significant permanent deformation may result in a functional failure of a restoration even though fracture does not occur.
Why is the elongation value for a casting alloy not always an indication of the burnishability of the margins of the casting?
Although the elongation of an alloy gives an indication of its ductility, or ability to be drawn into a wire without fracturing, to burnish a margin of a casting, sufficient force must be applied to exceed the yield strength. Therefore, alloys with high yield strengths are difficult to burnish even though they have high values for elongation.
Why does a mesial-occlusal-distal (MOD) amalgam fail in tension when compressive biting forces are applied from the opposing teeth?
The compressive load produces bending of the MOD amalgam, which results in compressive stress on the occlusal surface and tensile stresses at the base of the restoration. Amalgam is a brittle solid with much lower tensile than compressive strength, and therefore fails first at the base of the restoration, with the crack progressing to the occlusal surface of the amalgam.
Because the modulus of nickel-chromium alloys is about twice that of gold alloys, why is it not correct to reduce the thickness by half and have the same deflection in bending?
How is it possible to use a single elastomeric impression material and yet have the correct viscosity for use in the syringe and the tray?
Correct compounding of the polymer and filler produces a material that has the quality described as shear thinning. Such a material decreases in viscosity at high shear rates, such as during spatulation or syringing, and has a higher viscosity at low shear rates, as when it is placed and used as a tray material.
After an orthodontic elastic band is extended and placed, the force applied decreases with time more than expected for the distance the tooth moves. Why?
Latex rubber bands behave elastically and viscoelastically. It is principally the viscous deformation that is not recoverable that accounts for the greater than expected decrease in force as the band shortens from the movement of the tooth. This effect is even more pronounced when plastic rather than latex bands are used.
If dental manufacturers showed you the compliance versus time curve for their elastomeric impression material and pointed out that it had a high elastic compliance, moderate viscoelastic compliance, and a very low viscous compliance, how would you characterize the product?
If you wished to measure the surface hardness of a material that had small isolated areas of widely varying hardnesses, which hardness test would be most appropriate and why?
Diamond pyramid hardness. Only the Knoop and diamond pyramid are appropriate for surface hardness and a wide range of hardness. The selection of the diamond pyramid over the Knoop test is based on the information that there were isolated areas of different hardness and the diamond pyramid indentation can be placed in smaller areas. Choose nano-indentation for the study of micro-phases.
WEBSITESE
Academy of Dental Materials: www.academydentalmaterials.org
American Dental Association: dental materials, instruments, and equipment standards and guides:
http://www.ada.org/prof/resources/positions/standards/denmat.asp#ansi
Biomaterials Database (University of Michigan): www.lib.umich.edu/dentlib/Dental_tables/
Efunda, Engineering Fundamentals: efunda.com
Houston Biomaterials Research Center: www.db.uth.tmc.edu/biomaterials
International/American Association for Dental Research: www.iadr.org
National ESCA and Surface Analysis Center for Biomedical Problems: www.nb.engr.washington.edu
Society for Biomaterials: www.biomaterials.org
Surfaces in Biomaterials Foundation: www.surfaces.org
Black, GV. An investigation of the physical characters of the human teeth in relation to their diseases, and to practical dental operations, together with the physical characters of filling materials. Dent Cosmos. 1895;37:469.
Burstone, CJ, Baldwin, JJ, Lawless, DT. The application of continuous forces in orthodontics. Angle Orthod. 1961;31:1.
Dechow, PC, Carlson, DS. A method of bite force measurement in primates. J Biomech. 1983;16:797.
Koolstra, JH, van Euden, TMGJ. Application and validation of a three-dimensional mathematical model of the human masticatory system in vivo. J Biomech. 1992;25:175.
Korioth, TW, Versluis, A. Modeling the mechanical behavior of the jaws and their related structures by finite element (FE) analysis. Crit Rev Oral Biol Med. 1997;8:90.
Kuhlberg, AJ, Priebe, D. Testing force systems and biomechanics—measured tooth movements from differential moment closing loops. Angle Orthod. 2003;73:270.
Magne, P, Versluis, A, Douglas, WH. Rationalization of incisor shape: experimental-numerical analysis. J Prosthet Dent. 1999;81:345.
Plesh, O, Bishop, B, McCall, WD, Jr. Kinematics of jaw movements during chewing at different frequencies. J Biomech. 1993;26:243.
Southard, TE, Southard, KA, Stiles, RN. Factors influencing the anterior component of occlusal force. J Biomech. 1990;23:1199.
Stress Analysis and Design of Dental Structures
Brunski, JB. Biomechanical factors affecting the bone-dental implant interface. Clin Mater. 1992;10:153.
Craig, RG, Farah, JW. Stress analysis and design of single restorations and fixed bridges. Oral Sci Rev. 1977;10:45.
Farah, JW, Craig, RG. Distribution of stresses in porcelain-fused-to-metal and porcelain jacket crowns. J Dent Res. 1975;54:255.
Farah, JW, Powers, JM, Dennison, JB, et al. Effects of cement bases on the stresses and deflections in composite restorations. J Dent Res. 1976;55:115.
Hart, RT, Hennebel, VV, Thonpreda, N, et al. Modeling the biomechanics of the mandible: a three-dimensional finite element study. J Biomech. 1992;25:261.
Hylander, WL. Mandibular function in galago crassicaudatus and macaca fascicularis: an in vivo approach to stress analysis of the mandible. J Morph. 1979;159:253.
Kohn, DH. Overview of factors important in implant design. J Oral Implantol. 1992;18:204.
Ko, CC, Kohn, DH, Hollister, SJ. Micromechanics of implant/tissue interfaces. J Oral Implantol. 1992;18:220.
Korioth, TWP, Hannam, AG. Deformation of the human mandible during simulated tooth clenching. J Dent Res. 1994;73:56.
Meredith, N. A review of nondestructive test methods and their application to measure the stability and osseointegration of bone anchored endosseous implants. Crit Rev Biomed Eng. 1998;26:275.
Sakaguchi, RL, Borgersen, SE. Nonlinear finite element contact analysis of dental implant components. Int J Oral Maxillofac Implants. 1993;8:655.
Sakaguchi, RL, Borgersen, SE. Nonlinear contact analysis of preload in dental implant screws. Int J Oral Maxillofac Implants. 1995;10:295.
Sakaguchi, RL, Brust, EW, Cross, M, et al. Independent movement of cusps during occlusal loading. Dent Mater. 1991;7:186.
Sakaguchi, RL, Cross, M, Douglas, WH. A simple model of crack propagation in dental restorations. Dent Mater. 1992;8:131.
Tantbirojn, D, Versluis, A, Pintado, MR, et al. Tooth deformation patterns in molars after composite restoration. Dent Mater. 2004;20:535.
Bronzino JD, ed. The biomechanical engineering handbook. Boca Raton: CRC Press, 1995.
Dowling, NE. Mechanical behavior of materials, ed 2. Englewood Cliffs, NJ: Prentice-Hall, 1999.
Flinn, RA, Trojan, PK. Engineering materials and their applications, ed 4. New York: Wiley, 1995.
Fung, YC. Biomechanics, mechanical properties of living tissues, ed 2. New York: Springer-Verlag, 1993.
Fung, YC. Biomechanics, motion, flow, stress, and growth. New York: Springer-Verlag, 1990.
Hayashi K, Kamiya A, Ono K, eds. Biomechanics, functional adaptation and remodeling. Tokyo: Springer-Verlag, 1996.
Park, JB, Lakes, RS. Biomaterials: an introduction. New York: Plenum Press, 1992.
von Recum AF, ed. Handbook of biomaterials evaluation: scientific, technical, and clinical testing of implant materials. Philadelphia: Taylor and Francis, 1999.
Baran, GR, McCool, JI, Paul, D, et al. Weibull models of fracture strengths and fatigue behavior of dental resins in flexure and shear. J Biomed Mater Res. 1998;43:226.
de Groot, R, Van Elst, HC, Peters, MCRB. Fracture mechanics parameters for failure prediction of composite resins. J Dent Res. 1988;67:919.
Dhuru, VB, Lloyd, CH. The fracture toughness of repaired composite. J Oral Rehabil. 1986;13:413.
El Mowafy, OM, Watts, DC. Fracture toughness of human dentin. J Dent Res. 1986;65:677.
Ferracane, JL, Antonio, RC, Matsumoto, H. Variables affecting the fracture toughness of dental composites. J Dent Res. 1987;66:1140.
Fujishima, A, Ferracane, JL. Comparison of four modes of fracture toughness testing for dental composites. Dent Mater. 1996;12:38.
Hassan, R, Vaidyanathan, TK, Schulman, A. Fracture toughness determination of dental amalgams through microindentation. J Biomed Mater Res. 1986;20:135.
Lloyd, CH. The fracture toughness of dental composites. II. The environmental and temperature dependence of the stress intensification factor (KIC). J Oral Rehabil. 1982;9:133.
Lloyd, CH. The fracture toughness of dental composites. III. The effect of environment upon the stress intensification factor (KIC) after extended storage. J Oral Rehabil. 1984;11:393.
Lloyd, CH, Adamson, M. The fracture toughness (KIC) of amalgam. J Oral Rehabil. 1985;12:59.
Lloyd, CH, Iannetta, RV. The fracture toughness of dental composites. I. The development of strength and fracture toughness. J Oral Rehabil. 1982;9:55.
Mecholsky, JJ, Jr. Fracture mechanics principles. Dent Mater. 1995;11:111.
Mueller, HJ. Fracture toughness and fractography of dental cements, lining, build-up, and filling materials. Scanning Microsc. 1990;4:297.
Pilliar, RM, Smith, DC, Maric, B. Fracture toughness of dental composites determined using the short-rod fracture toughness test. J Dent Res. 1986;65:1308.
Roberts, JC, Powers, JM, Craig, RG. Fracture toughness of composite and unfilled restorative resins. J Dent Res. 1977;56:748.
Roberts, JC, Powers, JM, Craig, RG. Fracture toughness and critical strain energy release rate of dental amalgam. J Mater Sci. 1978;13:965.
Rosenstiel, SF, Porter, SS. Apparent fracture toughness of metal ceramic restorations with different manipulative variables. J Prosthet Dent. 1989;61:185.
Rosenstiel, SF, Porter, SS. Apparent fracture toughness of all-ceramic crown systems. J Prosthet Dent. 1989;62:529.
Scherrer, SS, Denry, IL, Wiskott, HW. Comparison of three fracture toughness testing techniques using a dental glass and a dental ceramic. Dent Mater. 1998;14:246.
Taira, M, Nomura, Y, Wakasa, K, et al. Studies on fracture toughness of dental ceramics. J Oral Rehabil. 1990;17:551.
Uctasli, S, Harrington, E, Wilson, HJ. The fracture resistance of dental materials. J Oral Rehabil. 1995;22:877.
Black, J. “Push-out” tests. J Biomed Mater Res. 1989;23:1243.
Johnston, WM, O’Brien, WJ. The shear strength of dental porcelain. J Dent Res. 1980;59:1409.
Drummond, JL, Sakaguchi, RL, Racean, DC, et al. Testing mode and surface treatment effects on dentin bonding. J Biomed Mater Res. 1996;32:533.
Asgharnia, MK, Brantley, WA. Comparison of bending and torsion tests for orthodontic wires. Am J Orthod. 1986;89:228.
Brantley, WA, Augat, WS, Myers, CL, et al. Bending deformation studies of orthodontic wires. J Dent Res. 1978;57:609.
Dolan, DW, Craig, RG. Bending and torsion of endodontic files with rhombus cross sections. J Endod. 1982;8:260.
Combe, EC, Moser, JB. The rheological characteristics of elastomeric impression materials. J Dent Res. 1978;57:221.
Herfort, TW, Gerberich, WW, Macosko, CW, et al. Viscosity of elastomeric impression materials. J Prosthet Dent. 1977;38:396.
Koran, A, Powers, JM, Craig, RG. Apparent viscosity of materials used for making edentulous impressions. J Am Dent Assoc. 1977;95:75.
Vermilyea, SG, Powers, JM, Craig, RG. Rotational viscometry of a zinc phosphate and a zinc polyacrylate cement. J Dent Res. 1977;56:762.
Vermilyea, SG, Powers, JM, Koran, A. The rheological properties of fluid denture-base resins. J Dent Res. 1978;57:227.
Cook, WD. Permanent set and stress relaxation in elastomeric impression materials. J Biomed Mater Res. 1981;15:449.
Duran, RL, Powers, JM, Craig, RG. Viscoelastic and dynamic properties of soft liners and tissue conditioners. J Dent Res. 1979;58:1801.
Ferracane, JL, Moser, JB, Greener, EH. Rheology of composite restoratives. J Dent Res. 1981;60:1678.
Goldberg, AJ. Viscoelastic properties of silicone, polysulfide, and polyether impression materials. J Dent Res. 1974;53:1033.
Lee, JK, Choi, JY, Lim, BS, et al. Change of properties during storage of a UDMA/TEGDMA dental resin. J Biomed Mater Res B Appl Biomater. 2004;68:216.
Morris, HF, Asgar, K, Tillitson, EW. Stress-relaxation testing. Part I: A new approach to the testing of removable partial denture alloys, wrought wires, and clasp behavior. J Prosthet Dent. 1981;46:133.
Park, JB, Lakes, RS. Biomaterials: An introduction. New York: Plenum Press, 1992.
Ruyter, IE, Espevik, S. Compressive creep of denture base polymers. Acta Odont Scand. 1980;38:169.
Tolley, LG, Craig, RG. Viscoelastic properties of elastomeric impression materials: polysulphide, silicone and polyether rubbers. J Oral Rehabil. 1978;5:121.
Wills, DJ, Manderson, RD. Biomechanical aspects of the support of partial dentures. J Dent. 1977;5:310.
Xu, HHK, Liao, H, Eichmiller, FC. Indentation creep behavior of a direct-filling silver alternative to amalgam. J Dent Res. 1998;77:1991.
, Impact resistance of plastics and electrical insulating material, D 256–92. ASTM Standards 1993, 8.01.. American Society for Testing and Materials: Philadelphia, 1993.
Koran, A, Craig, RG. Dynamic mechanical properties of maxillofacial materials. J Dent Res. 1975;54:1216.
Sakaguchi, RL, Shah, NC, Lim, BS, et al. Dynamic mechanical analysis of storage modulus development in light-activated polymer matrix composites. Dent Mater. 2002;18:197.
Properties of Composite Materials
Bayne, SC, Thompson, JY, Swift, EJ, Jr., et al. A characterization of first-generation flowable composites. J Am Dent Assoc. 1998;129:567.
Braem, MJA, Davidson, CL, Lambrechts, P, et al. In vitro flexural fatigue limits of dental composites. J Biomed Mater Res. 1994;28:1397.
Braem, M, Van Doren, VE, Lambrechts, P, et al. Determination of Young’s modulus of dental composites: a phenomenological model. J Mater Sci. 1987;22:2037.
Choi, KK, Condon, JR, Ferracane, JL. The effects of adhesive thickness on polymerization contraction stress of composite. J Dent Res. 2000;79:812.
Condon, JR, Ferracane, JL. Reduction of composite contraction stress through non-bonded microfiller particles. Dent Mater. 1998;14:256.
Ferracane, JL. Current trends in dental composites. Crit Rev Oral Biol Med. 1995;6:302.
Ferracane, JL, Berge, HX, Condon, JR. In vitro aging of dental composites in water—effect of degree of conversion, filler volume, and filler/matrix coupling. J Biomed Mater Res. 1998;42:465.
Ferracane, JL, Condon, JR. In vitro evaluation of the marginal degradation of dental composites under simulated occlusal loading. Dent Mater. 1999;15:262.
Goldberg, AJ, Burstone, CJ, Hadjinikolaou, I, et al. Screening of matrices and fibers for reinforced thermoplastics intended for dental applications. J Biomed Mater Res. 1994;28:167.
McCabe, JF, Wang, Y, Braem, M. Surface contact fatigue and flexural fatigue of dental restorative materials. J Biomed Mater Res. 2000;50:375.
Peutzfeldt, A. Resin composites in dentistry: the monomer systems. Eur J Oral Sci. 1997;105:97.
Sakaguchi, RL, Ferracane, JL. Stress transfer from polymerization shrinkage of a chemical-cured composite bonded to a pre-cast composite substrate. Dent Mater. 1998;14:106.
Sakaguchi, RL, Wiltbank, BD, Murchison, CF. Contraction force rate of polymer composites is linearly correlated with irradiance. Dent Mater. 2004;20:402.
Sakaguchi, RL, Wiltbank, BD, Murchison, CF. Prediction of composite elastic modulus and polymerization shrinkage by computational micromechanics. Dent Mater. 2004;20:397.
Sakaguchi, RL, Wiltbank, BD, Shah, NC. Critical configuration analysis of four methods for measuring polymerization shrinkage strain of composites. Dent Mater. 2004;20:388.
Urabe, I, Nakajima, M, Sano, H, et al. Physical properties of the dentin-enamel junction region. Am J Dent. 2000;13:129.
Van der Varst, PGT, Brekelmans, WAM, De Vree, JHP, et al. Mechanical performance of a dental composite: probabilistic failure prediction. J Dent Res. 1993;72:1249.
Herfort, TW, Gerberich, WW, Macosko, CW, et al. Tear strength of elastomeric impression materials. J Prosthet Dent. 1978;39:59.
MacPherson, GW, Craig, RG, Peyton, FA. Mechanical properties of hydrocolloid and rubber impression materials. J Dent Res. 1967;46:714.
, Strength of conventional vulcanized rubber and thermoplastic elastomers, D 624–91. ASTM Standards 1994, 9.01.. American Society for Testing and Materials: Philadelphia, 1994.
Webber, RL, Ryge, G. The determination of tear energy of extensible materials of dental interest. J Biomed Mater Res. 1968;2:231.
Abe, Y, Sato, Y, Akagawa, Y, Ohkawa, S. An in vitro study of high-strength resin posterior denture tooth wear. Int J Prosthodont. 1997;10:28.
Barbakow, F, Lutz, F, Imfeld, T. A review of methods to determine the relative abrasion of dentifrices and prophylaxis pastes. Quint Int. 1987;18:23.
Condon, JR, Ferracane, JL. Factors effecting dental composite wear in vitro. J Biomed Mater Res. 1997;38:303.
Condon, JR, Ferracane, JL. In vitro wear of composite with varied cure, filler level, and filler treatment. J Dent Res. 1997;76:1405.
DeBellis, A. Fundamentals of Rockwell hardness testing. In Hardness Testing Reprints WD-673. Bridgeport, Conn: Wilson Instrument Division; 1967.
DeLong, R, Douglas, WH, Sakaguchi, RL, et al. The wear of dental porcelain in an artificial mouth. Dent Mater. 1986;2:214.
DeLong, R, Sakaguchi, RL, Douglas, WH, et al. The wear of dental amalgam in an artificial mouth: a clinical correlation. Dent Mater. 1985;1:238.
Doerner, MF, Nix, WD. A method for interpreting the data from depth-sensing indentation measurements. J Mater Res. 1986;1:601.
Douglas, WH, Sakaguchi, RL, DeLong, R. Frictional effects between natural teeth in an artificial mouth. Dent Mater. 1985;1:115.
Draughn, RA, Harrison, A. Relationship between abrasive wear and microstructure of composite resins. J Prosthet Dent. 1978;40:220.
Ferracane, JL, Mitchem, JC, Condon, JR, Todd, R. Wear and marginal breakdown of composites with various degrees of cure. J Dent Res. 1997;76:1508.
Hu, X, Harrington, E, Marquis, PM, et al. The influence of cyclic loading on the wear of a dental composite. Biomaterials. 1999;20:907.
Hu, X, Marquis, PM, Shortall, AC. Two-body in vitro wear study of some current dental composites and amalgams. J Prosthet Dent. 1999;82:214.
Knibbs, PJ. Methods of clinical evaluation of dental restorative materials. J Oral Rehabil. 1997;24:109.
Koczorowski, R, Wloch, S. Evaluation of wear of selected prosthetic materials in contact with enamel and dentin. J Prosthet Dent. 1999;81:453.
Lysaght, VE. How to make and interpret hardness tests on plastics. In Hardness Testing Reprints WD-673. Bridgeport, Conn: Wilson Instrument Division; 1967.
Lysaght, VE. Indentation hardness testing. New York: Reinhold, 1949.
Lysaght, VE, DeBellis, A. Microhardness testing. In Hardness Testing Reprints WD-673. Bridgeport, Conn: Wilson Instrument Division; 1967.
Powers, JM, Craig, RG. Wear of dental tissues and restorative materials. In Proceedings of National Symposium on Wear and Corrosion June 4–6, 1979. Washington, DC: American Chemical Society; 1979.
Powers, JM, Fan, PL, Craig, RG, Wear of dental restorative resins. Gebelein, CG, Koblitz, FF, eds. Biomedical and dental applications of polymers: Polymer science and technology, 14. New York: Plenum Press, 1981.
Roberts, JC, Powers, JM, Craig, RG. Wear of dental amalgam. J Biomed Mater Res. 1977;11:513.
Teoh, SH, Ong, LF, Yap, AU, et al. Bruxing-type dental wear simulator for ranking of dental restorative materials. J Biomed Mater Res. 1998;43:175.
Tirtha, R, Fan, PL, Dennison, JB, et al. In vitro depth of cure of photo-activated composites. J Dent Res. 1982;61:1184.
Turssi, C, Purquerio, B, Serra, M. Wear of dental resin composites: insights into underlying processes and assessment methods. A review. J Biomed Mater Res B Appl Biomater. 2003;65B:280.
Wu, W, McKinney, JE. Influence of chemicals on wear of dental composites. J Dent Res. 1982;61:1180.
Yap, AU, Ong, LF, Teoh, SH, et al. Comparative wear ranking of dental restoratives with the BIOMAT wear simulator. J Oral Rehabil. 1999;26:228.
Van Meerbeek, B, Willems, G, Celis, JP, et al. Assessment by nano-indentation of the hardness and elasticity of resin-dentin bonding area. J Dent Res. 1993;72:1434.
Willems, G, Celis, JP, Lambrechts, P, et al. Hardness and young’s modulus determined by nanoindentation technique of filler particles of dental restorative materials compared with human enamel. J Biomed Mater Res. 1993;27:747.
Xu, HHK, Smith, DT, Jahanmir, S, et al. Indentation damage and mechanical properties of human enamel and dentin. J Dent Res. 1998;77:472.
Council on Scientific Affairs. Clinical products in dentistry; a desktop reference. Chicago: American Dental Association, 1996.
United States General Services Administration. Index of Federal Specifications and Standards. Washington, DC: Superintendent of Documents, U.S. Government Printing Office, 1994.
Academy of Dental Materials: www.academydentalmaterials.org
American Dental Association: dental materials, instruments, and equipment standards and guides: http://www.ada.org/prof/resources/positions/standards/denmat.asp#ansi
Biomaterials Database (University of Michigan): www.lib.umich.edu/dentlib/Dental_tables/
Efunda, Engineering Fundamentals: efunda.com
Houston Biomaterials Research Center: www.db.uth.tmc.edu/biomaterials
International/American Association for Dental Research: www.iadr.org
National ESCA and Surface Analysis Center for Biomedical Problems: www.nb.engr.washington.edu
Society for Biomaterials: www.biomaterials.org
Surfaces in Biomaterials Foundation: www.surfaces.org