A summary of the respiratory examination and extending the respiratory examination
TEXT BOX 12.1 The respiratory examination: a suggested method
Sitting up (if not acutely ill)
Sputum mug contents (blood, pus etc)
Rate and depth of respiration, and breathing pattern at rest
Accessory muscles of respiration
Wasting, weakness—finger abduction and adduction (lung cancer involving the brachial plexus)
Wrist tenderness (hypertrophic pulmonary osteoarthropathy)
Pulse (tachycardia, pulsus paradoxus)
Flapping tremor (CO2 narcosis)
Eyes—Horner’s syndrome (apical lung cancer), anaemia
Voice—hoarseness (recurrent laryngeal nerve palsy)
Facial plethora—smoker, SVC obstruction
Prominent veins (determine direction of flow)
Tidal percussion (diaphragm paralysis)
Radiotherapy marks, other signs as noted above
Pemberton’s sign (SVC obstruction)
7. Cardiovascular system (lying at 45°)
Jugular venous pressure (SVC obstruction etc)
Evidence of malignancy or pleural effusion: examine the breasts, abdomen, rectum, lymph nodes etc
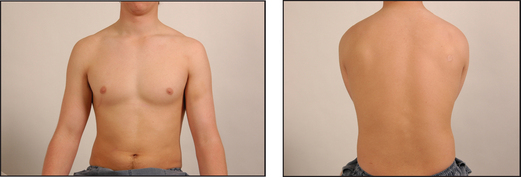
Ask the patient to undress to the waist (provide women with a gown) and to sit over the side of the bed. In the clinic or surgery the examination can often be performed with the patient sitting on a chair. While standing back to make your usual inspection (does the patient appear breathless while walking into the room or undressing?), ask if sputum is available for inspection. Purulent sputum always indicates respiratory infection, and a large volume of purulent sputum is an important clue to bronchiectasis. Haemoptysis is also an important sign. Look for dyspnoea at rest and count the respiratory rate. Note any paradoxical inward motion of the abdomen during inspiration (diaphragmatic paralysis). Look for use of the accessory muscles of respiration, and any intercostal in-drawing of the lower ribs anteriorly (a sign of emphysema). General cachexia should also be noted.
Pick up the patient’s hands. Look for clubbing, peripheral cyanosis, tar staining and anaemia. Note any wasting of the small muscles of the hands and weakness of finger abduction (lung cancer involving the brachial plexus). Palpate the wrists for tenderness (hypertrophic pulmonary osteoarthropathy). While holding the patient’s hand, palpate the radial pulse for obvious pulsus paradoxus. Take the blood pressure if indicated.
Go on to the face. Look closely at the eyes for constriction of one of the pupils and for ptosis (Horner’s syndrome from an apical lung cancer). Inspect the tongue for central cyanosis.
Palpate the position of the trachea. This is an important sign, so spend time on it. If the trachea is displaced, you must concentrate on the upper lobes for physical signs. Also look and feel for a tracheal tug, which indicates severe airflow obstruction, and feel for the use of the accessory muscles. Now ask the patient to speak (hoarseness) and then cough, and note whether this is a loose cough, a dry cough or a bovine cough. Next measure the forced expiratory time (FET).a Tell the patient to take a maximal inspiration and blow out as rapidly and forcefully as possible while you listen. Note audible wheeze and prolongation of the time beyond 3 seconds as evidence of chronic obstructive pulmonary disease.1
The next step is to examine the chest. You may wish to examine the front first, or go to the back to start. The advantage of the latter is that there are often more signs there, unless the trachea is obviously displaced.
Inspect the back. Look for kyphoscoliosis. Do not miss ankylosing spondylitis, which causes decreased chest expansion and upper lobe fibrosis. Look for thoracotomy scars and prominent veins. Also note any skin changes from radiotherapy.
Palpate first from behind for the cervical nodes. Then examine for expansion—first upper lobe expansion, which is best seen by looking over the patient’s shoulders at clavicular movement during moderate respiration. The affected side will show a delay or decreased movement. Then examine lower lobe expansion by palpation. Note asymmetry and reduction of movement.
Now ask the patient to bring his or her elbows together in the front to move the scapulae out of the way. Examine for vocal fremitus and then percuss the back of the chest.
Auscultate the chest. Note breath sounds (whether normal or bronchial) and their intensity (normal or reduced). Listen for adventitious sounds (crackles and wheezes). Finally examine for vocal resonance. If a localised abnormality is found, try to determine the abnormal lobe and segment.
Return to the front of the chest. Inspect again for chest deformity, distended veins, radiotherapy changes and scars. Palpate the supraclavicular nodes carefully. Then proceed with percussion and auscultation as before. Listen high up in the axillae too. Before leaving the chest feel the axillary nodes and examine the breasts (see Chapter 36).
Lay the patient down at 45° and measure the jugular venous pressure. Then examine the praecordium and lower limbs for signs of cor pulmonale. Finally examine the liver and take the temperature.
Remember that most respiratory examinations are ‘targeted’. Not every part of the examination is necessary for every patient.
aThere is good correlation between clinicians for the results of this test: κ value 0.7. It is most accurate if performed with a stopwatch.
Extending the respiratory physical examination
BEDSIDE ASSESSMENT OF LUNG FUNCTION
Forced expiratory time
Physical examination can be complemented with an estimate of the forced expiratory time (FET).1 Measure the time taken by the patient to exhale forcefully and completely through the open mouth after taking a maximum inspiration. It may be necessary to demonstrate this to the patient. The normal forced expiratory time is 3 seconds or less. Note any audible wheeze or cough. An increased FET indicates airways obstruction. The combination of a significant smoking history and an FET of 9 seconds or more is predictive of COPD (positive LR 9.6).2 A peak flow meter or spirometer, however, will provide a more accurate measurement of lung function.
Peak flow meter
A peak flow meter is a simple gauge that is used to measure the maximum flow rate of expired air. Again the patient is asked to take a full breath in, but rather than a prolonged expiration, a rapid forced maximal expiratory puff is made through the mouth.b The value obtained (the peak expiratory flow [PEF]) depends largely on airways diameter. Normal values are approximately 600 litres per minute for young men and 400 litres per minute for young women. The value depends on age, sex and height, so tables of normal values should be consulted. Airways obstruction, such as that caused by asthma or COPD, results in a reduced and variable PEF. It is a simple way of assessing and following patients with airways obstruction, but is rather effort-dependent. The PEF is most useful when used for serial estimates of lung function.
Spirometry
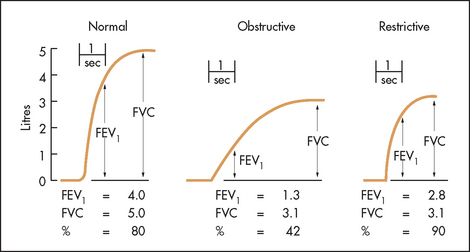
The spirometer records graphically or numerically the forced expiratory volume and the forced vital capacity (see Figure 12.2). The forced expiratory volume (FEV) is the volume of air expelled from the lungs after maximum inspiration using maximum forced effort, and is measured in a given time.c Usually this is 1 second (FEV1). The forced vital capacity (FVC) is the total volume of air expelled from the lungs after maximum inspiratory effort followed by maximum forced expiration. The FVC is often nearly the same as the vital capacity, but in airways obstruction it may be less because of premature airways closure. It is usual to record the best of three attempts and to calculate the FEV1/FVC ratio as a percentage. In healthy youth, the normal value is 80%, but this may decline to as little as 60% in old age. Normal values also vary with sex, age, height and race.
Reversibility of a reduced FEV1/FVC after the use of bronchodilators is an important test for distinguishing asthma from COPD.
Obstructive ventilatory defect
When the FEV1/FVC ratio is reduced (<0.7) this is referred to as an obstructive defect. Both values tend to be reduced, but the FEV1 is disproportionately low. The causes are loss of elastic recoil or airways narrowing, as in asthma or COPD.
Restrictive ventilatory defect
When the FEV1/FVC ratio is normal or higher than normal, but both values are reduced, the pattern is described as a restrictive defect. This occurs in parenchymal lung disease, such as ILD, sarcoidosis or when lung expansion is reduced by pneumonia o chest wall abnormalities.
Flow volume curve
As a part of spirometric assessment, the flow volume curve may be measured using a portable electronic device. This measures expiratory and inspiratory flow as a function of exhaled volume rather than against time. It is a simple and reproducible test easily performed in the respiratory laboratory or at the bedside. The FVC, FEV1 and various flow measurements (e.g. peak flow) can be calculated from the curve (see Figure 12.3).
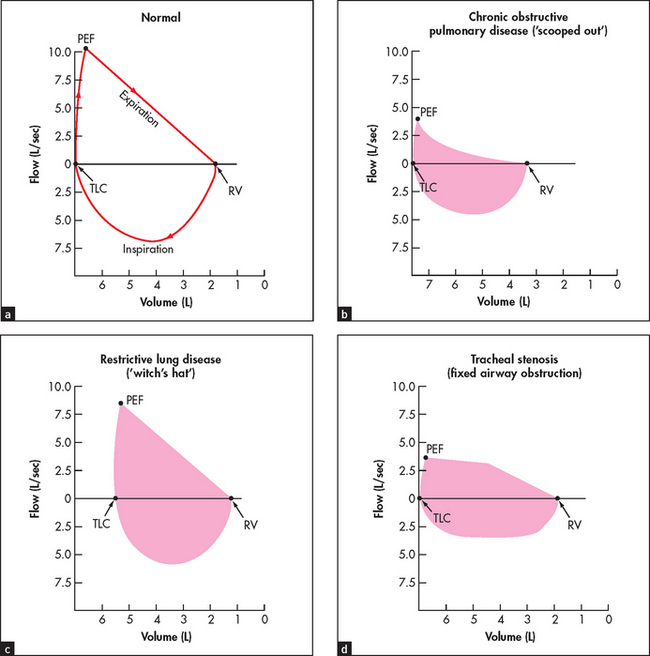
Figure 12.3 Flow volume curves Look at the shape of the loop in each case ((a) to (d)). A normal flow volume curve is convex and symmetrical. In chronic obstructive lung disease (COPD), all flow routes are reduced and there is prolonged expiration (creating a ‘scooped out’ shape). In restrictive lung disease (e.g. pulmonary fibrosis), the loop is narrow but the shape normal (like a witch’s hat). In fixed airway obstruction (e.g. tracheal stenosis), the loops look flattened as both expiration and inspiration are limited. PEF = peak expiratory flow; TLC = total lung capacity; RV = residual volume.
Pulse oximetry
Continuous measurement of a patient’s arterial blood oxygen saturation (SpO2) is now possible with readily available oximetry devices. These simple devices can be used as an extension of the physical examination, especially for patients who appear to be in respiratory distress. A fall in the reading may indicate a deteriorating respiratory problem such as exhaustion in a patient with severe asthma. This measurement is helpful for any patient who appears in respiratory distress or who has become cyanosed or drowsy.
The probe is attached to the patient’s finger or earlobe. False readings may occur if there is poor tissue perfusion because of cold or shock or if the finger nails are coated with coloured nail polish. A low haemoglobin may cause a deceptively low reading. As with the results of any test it is important to ensure that the result is consistent with the clinical findings. A low SpO2 picked up in a patient who looks and feels perfectly well is likely to be a false reading. Generally, a reading of ≥95% is satisfactory. A reading of <90% is very abnormal and indicates respiratory failure or another critical illness (e.g. septic shock or a large pulmonary embolism).
THE CHEST X-RAY AND CT SCAN IN RESPIRATORY MEDICINE
The radiological appearance of a normal lung, with the lung segments labelled, is shown in Figure 12.4.
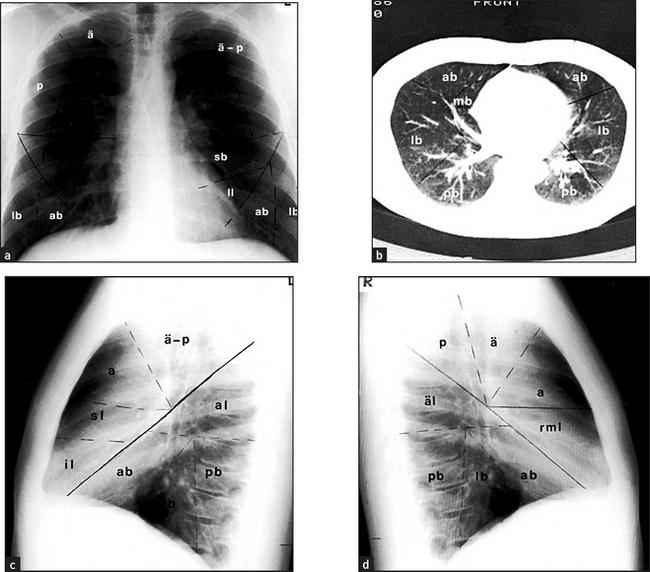
Figure 12.4 Lung segments (a) Posteroanterior view. (b) CT scan through lung bases. (c) Left lateral view. (d) Right lateral view. Right upper lobe: ä = apical segment; a = anterior segment, p = posterior segment. Left upper lobe: ä – p = apico-posterior segment, s = anterior segment, sl = superior lingular segment, il = inferior lingular segment. Right middle lobe (rml): m = medial segment, l = lateral segment. Right lower lobe: äl = apical segment, mb = medial basal segment, lb = lateral basal segment, ab = anterior basal segment, pb = posterior basal segment. Left lower lobe: äl = apical segment, lb = lateral basal segment, ab = anterior basal segment, pb = posterior basal segment.
The radiological changes of consolidation, pleural effusion, pneumothorax and hydropneumothorax are shown in Figures 12.5–12.8, respectively.
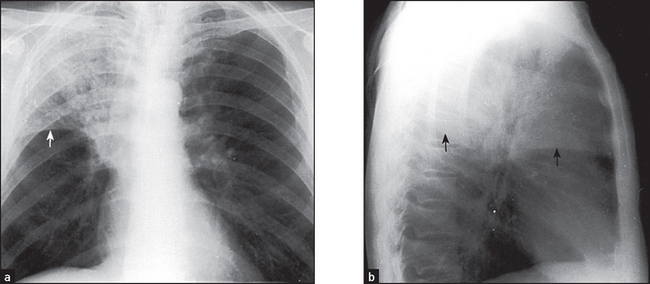
Figure 12.5 (a) and (b) Right upper lobe consolidation The right upper lobe is opacified and is limited inferiorly by the horizontal fissure (arrows). There must be some collapse as well, as the fissure shows some elevation. These changes could be due to a bacterial lobar pneumonia per se, but a central bronchostenotic lesion should be considered. If the pneumonia persists, a bronchoscopy is indicated to search for a central carcinoma.
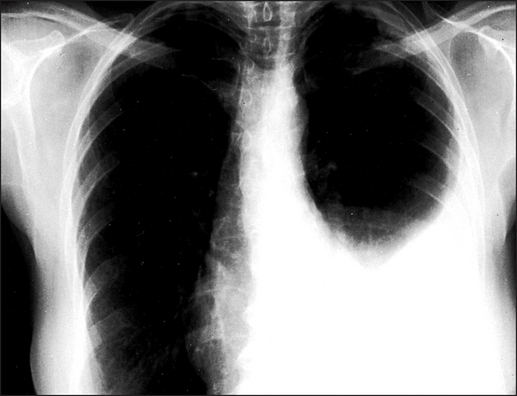
Figure 12.6 Pleural effusion The upper margin of the effusion is curved (‘meniscus sign’). The left hemidiaphragm is not seen because there is no adjacent aerated lung for contrast. The heart shows some deviation to the right. It is unlikely that this is caused by an effusion of this size. It is probably related to the lower thoracic scoliosis.
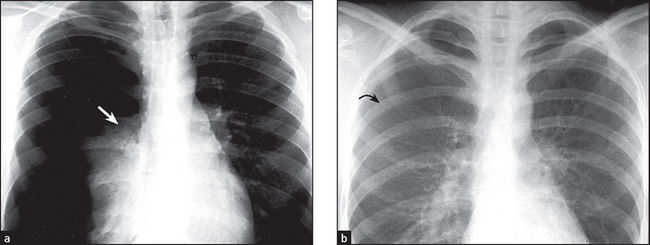
Figure 12.7 Pneumothorax (a) There is a massive right pneumothorax with collapsed lung seen against the hilum (arrow). There is increased translucency because of the absence of vascular shadows. (b) Different patient with a smaller pneumothorax. Small pneumothoraces are easier to see on an expiratory film as the pneumothorax volume remains constant, surrounding the partly deflated lung. The visceral pleural surface is marked (arrow).
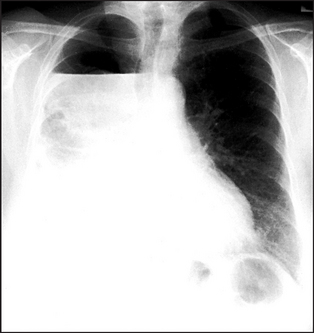
Figure 12.8 Hydropneumothorax An air–fluid level is seen in the upper portion of the right hemithorax. When air and fluid are present in the pleural space, the fluid no longer forms a meniscus at its upper margin. Some aerated lung is seen deep to the fluid.
A pulmonary mass is obvious in Figure 12.9, while multiple metastases are seen in Figure 12.10. Primary tuberculosis is shown in Figure 12.11, and Figure 12.12 illustrates the features of emphysema.
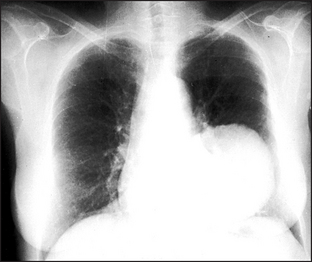
Figure 12.9 A pulmonary mass There is a large solitary mass lesion in the left lower zone. The differential diagnosis is primary or secondary neoplasm, hydatid cyst or large abscess. No air–fluid level is seen within it to indicate cavitation.
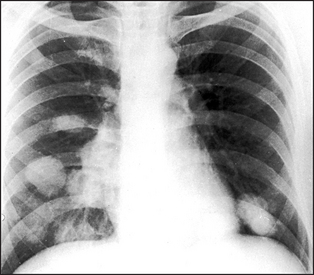
Figure 12.10 Pulmonary metastases Multiple rounded opacities are seen in both lung fields, mainly at the left base and around the right hilum. The most likely cause is multiple pulmonary metastases. Other rare possibilities are hydatid cysts, large sarcoid nodules or large rheumatoid nodules. Multiple abscesses are extremely unlikely in the absence of cavitation.
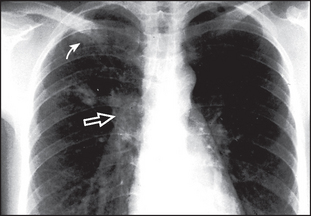
Figure 12.11 Primary tuberculosis Two small rounded areas of shadowing are seen in the right upper zone (solid arrow). The right hilum is enlarged by the enlarged draining lymph nodes (open arrow). This combination of focal shadowing and enlarged lymph nodes is the primary (Ghon) complex of tuberculosis. With healing, calcification may occur in the parenchymal and nodal lesions. In contrast, in tuberculosis reactivation or reinfection, cavitation may occur and there is no lymphadenopathy.
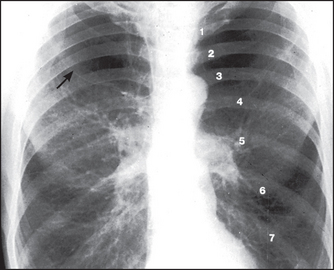
Figure 12.12 Emphysema The lungs are overinflated with low, flat hemidiaphragms. The level of the hemidiaphragms is well below the anterior aspects of the sixth ribs. The diaphragm normally projects over the sixth rib anteriorly and the tenth intercostal space posteriorly. Count the ribs anteriorly (1–6). There is increased translucency of both upper zones with loss of the vascular markings due to bulla formation (arrow). This increased translucency is not due to overexposure. The hila are prominent because of the enlarged central pulmonary arteries. In contrast, the smaller peripheral pulmonary arteries (the lung markings) are decreased in size and number. This is due to actual destruction, displacement around bullae and decreased perfusion through emphysematous areas.
CHEST X-RAY CHECKLIST
A irway (midline, no obvious deformities, no paratracheal masses).
B ones and soft tissue (no fractures, subcutaneous emphysema, median sternotomy wires, metal clips following lung resection or coronary artery bypass grafting).
C ardiac size, silhouette and retrocardiac density normal.
D iaphragms (right above left by 1–3 centimetres, costophrenic angles sharp, diaphragmatic contrast with lung sharp).
E qual volume (count ribs, look for mediastinal shift).
F ine detail (pleura and lung parenchyma).
G astric bubble (above the air bubble one shouldn’t see an opacity of any more than 0.5 centimetres width).
H ilum (left normally above right by up to 3 centimetres, no larger than a thumb), hardware (especially in the intensive care unit: endotracheal tube, central venous catheters, pacemaker).
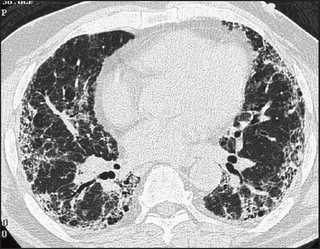
High-resolution CT scans give more detailed information about the lungs but expose the patient to hundreds of times more radiation. They are particularly useful for diagnosing interstitial lung disease, pulmonary haemorrhage (see Figure 12.13) and bronchiectasis (see Figure 12.14). Primary and secondary lung tumours are best imaged with CT and tuberculous involvement of the lungs can be quantified (see Figure 12.15).
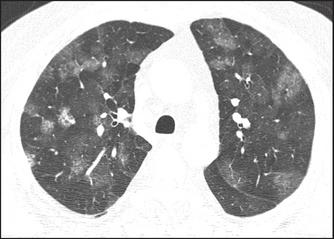
Figure 12.13 Pulmonary haemorrhage (From Hansell D. Imaging of diseases of the chest, 5th edn. Mosby, 2009.)
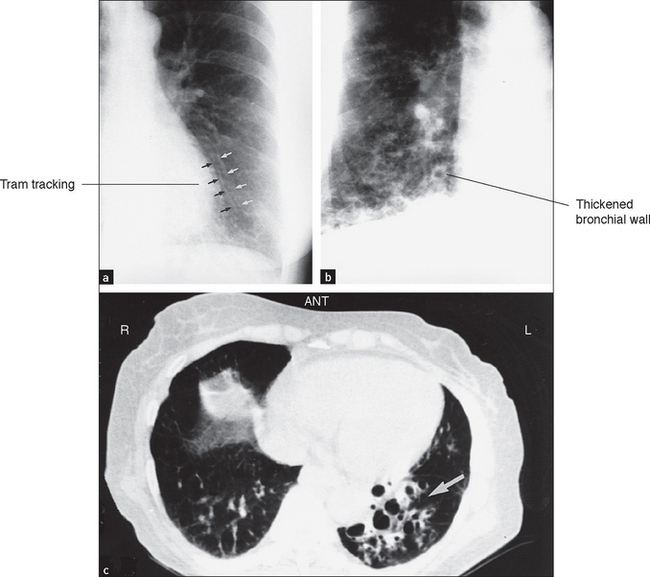
Figure 12.14 (a) to (c) Bronchiestasis (From Mettler FA. Essentials of radiology, 2nd edn. Saunders 2005.)
References
1. Schapira, RM, Schapira, MM, et al. The value of the forced expiratory time in the physical diagnosis of obstructive airways disease. JAMA. 1993; 270:731–736. [In patients with chronic obstructive airways who have a low pretest probability, an appropriate low-end cut-off is required (e.g. 3 seconds).].
2. McGee, S. Evidence-based physical diagnosis, 3rd edn. St Louis: Saunders, 2012.