7 The Arterial System
1. Explain how the pulsatile blood flow in the large arteries is converted into a steady flow in the capillaries.
2. Discuss arterial compliance and its relation to stroke volume and pulse pressure.
3. Explain the factors that determine the mean, systolic, and diastolic arterial pressures and the arterial pulse pressure.
4. Describe the common procedure for measuring the arterial blood pressure in humans.
The Hydraulic Filter Converts Pulsatile Flow to Steady Flow
The principal functions of the systemic and pulmonary arterial systems are to distribute blood to the capillary beds throughout the body. The arterioles, which are the terminal components of the arterial system, regulate the distribution of flow to the various capillary beds. In the region between the heart and the arterioles, the aorta and pulmonary artery, and their major branches constitute a system of conduits of considerable volume and distensibility. This system of elastic conduits and high-resistance terminals constitutes a hydraulic filter that is analogous to the resistance-capacitance filters of electrical circuits.
Hydraulic filtering converts the intermittent output of the heart to a steady flow through the capillaries. This important function of the large elastic arteries has been likened to the Windkessels of antique fire engines. The Windkessel in such a fire engine contains a large volume of trapped air. The compressibility of the air trapped in the Windkessel converts the intermittent inflow of water to a steady outflow of water at the nozzle of the fire hose.
The analogous function of the large elastic arteries is illustrated in Figure 7-1. The heart is an intermittent pump. The cardiac stroke volume is discharged into the arterial system during systole. The duration of the discharge usually occupies about one third of the cardiac cycle. In fact, as shown in Figure 4-13, most of the stroke volume is pumped during the rapid ejection phase. This phase constitutes about half of systole. Part of the energy of cardiac contraction is dissipated as forward capillary flow during systole. The remaining energy in the distensible arteries is stored as potential energy (Figure 7-1A and B). During diastole, the elastic recoil of the arterial walls converts this potential energy into capillary blood flow. If the arterial walls had been rigid, capillary flow would have ceased during diastole.
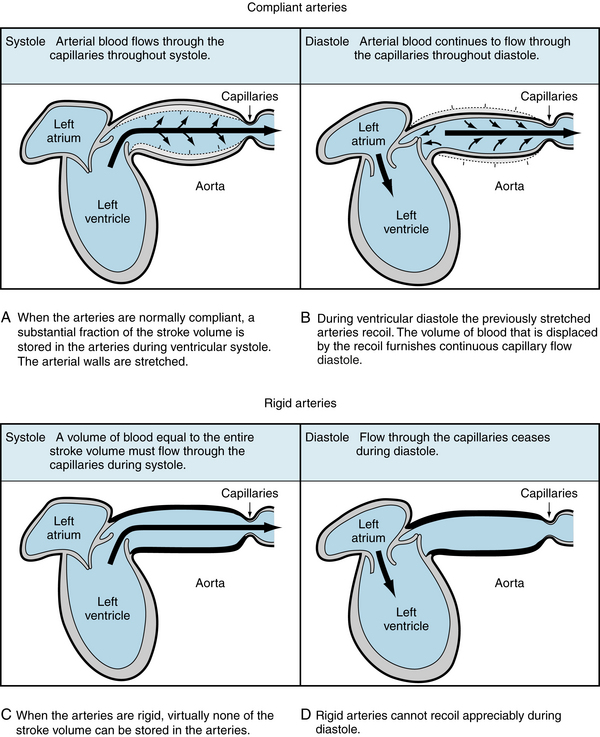
FIGURE 7-1 A to D, When the arteries are normally compliant, blood flows through the capillaries throughout the cardiac cycle. When the arteries are rigid, blood flows through the capillaries during systole, but flow ceases during diastole.
Hydraulic filtering minimizes the cardiac workload. More work is required to pump a given flow intermittently than steadily; the steadier the flow, the less is the excess work. A simple example illustrates this point.
Consider first that a fluid flows at the steady rate of 100 mL per second (s) through a hydraulic system that has a resistance of 1 mm Hg/mL/s. This combination of flow and resistance would result in a constant pressure of 100 mm Hg, as shown in Figure 7-2A. Neglecting any inertial effect, hydraulic work, W, may be defined as:
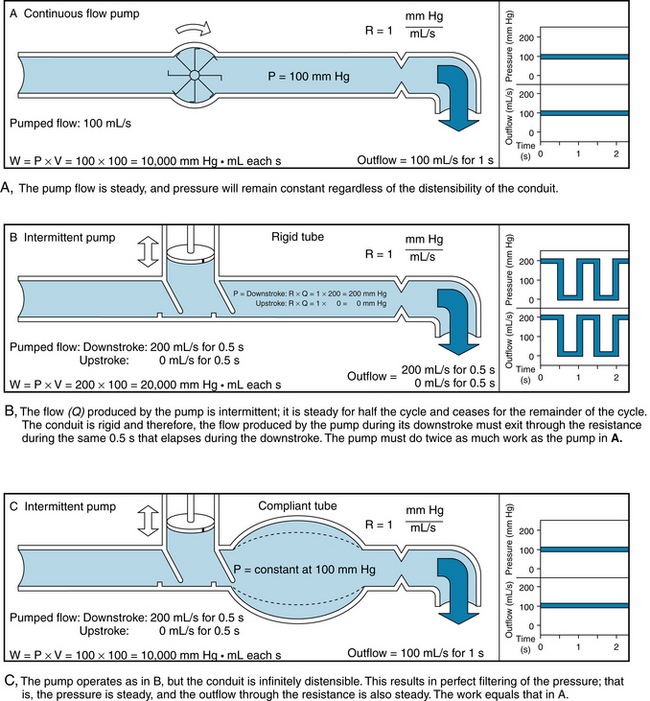
FIGURE 7-2 A to C, The relationships between pressure and flow for three hydraulic systems. In each the overall flow is 100 mL/s and the resistance is 1 mm Hg/mL/s.
 (1)
(1)that is, each small increment of volume, dV, pumped is multiplied by the pressure, P, that exists at that time. The products are integrated over the time interval, t2 – t1, to yield the total work. When flow is steady,
 (2)
(2)In the example in Figure 7-2A, the work done in pumping the fluid for 1 s would be 10,000 mm Hg mL (or 1.33 × 10⁷ dyne-cm). Next, consider an intermittent pump that generates a constant flow of fluid for 0.5 s, and then pumps nothing during the next 0.5 s. Hence, flow is generated at the rate of 200 mL/s for 0.5 s, as shown in Figure 7-2B and C. In panel B, the conduit is rigid, and the fluid is incompressible. However, the system has the same resistance to flow as in panel A. During the pumping phase of the cycle (systole), the flow of 200 mL/s through a resistance of 1 mm Hg/mL/s would produce a pressure of 200 mm Hg. During the filling phase (diastole) of the pump, the pressure in this rigid system would be 0 mm Hg. The work done during systole would be 20,000 mm Hg mL. This value is twice that required in the example shown in Figure 7-2A.
If the system were very distensible, hydraulic filtering would be very effective and the pressure would remain virtually constant throughout the entire cycle (Figure 7-2C). Of the 100 mL of fluid pumped during the 0.5 s of systole, only 50 mL would be emitted through the high-resistance outflow end of the system during systole. The remaining 50 mL would be stored by the distensible conduit during systole, and it would flow out during diastole. Hence the pressure would be virtually constant at 100 mm Hg throughout the cycle. The fluid pumped during systole would be ejected at only half the pressure that prevailed in Figure 7-2B. Therefore, the work would be only half as great. If filtering were nearly perfect, as in Figure 7-2C, the work would be identical to that for steady flow (Figure 7-2A).
Naturally, the filtering accomplished by the systemic and pulmonic arterial systems is intermediate between the examples in Figures 7-2B and C. The additional work imposed by the intermittent pumping, in excess of that for steady flow, is about 35% for the right ventricle and about 10% for the left ventricle. These fractions change, however, with variations in heart rate, peripheral resistance, and arterial distensibility.
The greater cardiac energy requirement imposed by a rigid arterial system is illustrated in Figure 7-3. In a group of anesthetized dogs, the cardiac output pumped by the left ventricle was allowed to flow either through the natural route (the aorta) or through a stiff plastic tube to the peripheral arteries. The total peripheral resistance (TPR) values were virtually identical, regardless of which pathway was selected. The data (see Figure 7-3) from a representative animal show that, for any given stroke volume, the myocardial oxygen consumption ( ) was substantially greater when the blood was diverted through the plastic tubing than when it flowed through the aorta. This increase in indicates that the left ventricle had to expend more energy to pump blood through a less compliant conduit than through a more compliant conduit.
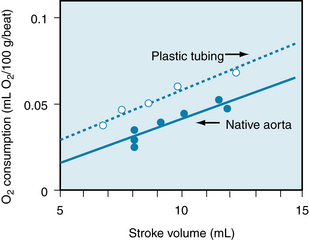
FIGURE 7-3 The relationship between myocardial oxygen consumption (mL/100 g/beat) and stroke volume (mL) in an anesthetized dog whose cardiac output could be pumped by the left ventricle either through the aorta or through a stiff plastic tube to the peripheral arteries.
(Modified from Kelly RP, Tunin R, Kass DA: Effect of reduced aortic compliance on cardiac efficiency and contractile function of in situ canine left ventricle. Circ Res 71:490, 1992.)
Arterial Elasticity Compensates For the Intermittent Flow Delivered by the Heart
The elastic properties of the arterial wall are determined by the composition and mechanical properties of the vessel. Two important constituents of the arterial wall are elastic fibers, composed of elastin and microfibrils, and collagen. Elastin is elaborated by endothelial cells and is found in the tunica intima, whereas collagen is derived from myofibroblasts and located in the tunica adventitia.
The elastic properties of the arterial wall may be appreciated by considering first the static pressure-volume relationship for the aorta. To derive the curves shown in Figure 7-4, aortas were obtained at autopsy from individuals in different age groups. All branches of each aorta were ligated and successive volumes of liquid were injected into this closed elastic system. After each increment of volume, the internal pressure was measured. In Figure 7-4, the curve that relates pressure to volume in the youngest age group (curve a) is sigmoidal. Although the curve is nearly linear, the slope decreases at the upper and lower ends. At any point on the curve, the slope (dV/dP) represents the aortic compliance. Thus, in young individuals the aortic compliance is least at very high at low pressures and greatest at intermediate pressures. This sequence of compliance changes resembles the familiar compliance changes encountered in inflating a balloon. The greatest difficulty in introducing air into the balloon is experienced at the beginning of inflation and again at near-maximal volume, just before the balloon ruptures. At intermediate volumes, the balloon is relatively easy to inflate; that is, it is more compliant.
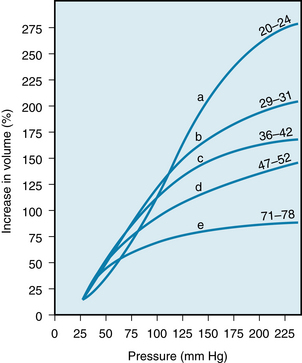
FIGURE 7-4 Pressure-volume relationships for aortas obtained at autopsy from humans in different age groups (ages in years denoted by the numbers at the right end of each of the curves).
(Redrawn from Hallock P, Benson IC: Studies on the elastic properties of human isolated aorta. J Clin Invest 16:595, 1937.)
Figure 7-4 reveals that the pressure-volume curves derived from subjects in different age groups are displaced downwards, and the slopes diminish as a function of advancing age. Thus, for any pressure above about 80 mm Hg, the aortic compliance decreases with age. This manifestation of greater rigidity (arteriosclerosis) is caused by progressive changes in the collagen and elastin contents of the arterial walls.
The previously described effects of the subject’s age on the elastic characteristics of the arterial system were derived from aortas removed at autopsy (see Figure 7-4). Such age-related changes have been confirmed in living subjects by ultrasound imaging techniques. These studies disclosed that the increase in the diameter of the aorta produced by each cardiac contraction is much less in elderly persons than in young persons (Figure 7-5). The effects of aging on the elastic modulus of the aorta in healthy subjects are shown in Figure 7-6. The elastic modulus, Ep, is defined as:
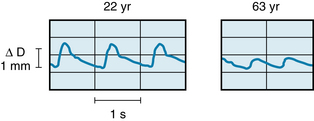
FIGURE 7-5 The pulsatile changes in diameter (ΔD), measured ultrasonically, in a 22-year-old man and a 63-year-old man.
(Modified from Imura T, Yamamoto K, Kanamori K, et al: Non-invasive ultrasonic measurement of the elastic properties of the human abdominal aorta. Cardiovasc Res 20:208, 1986.)
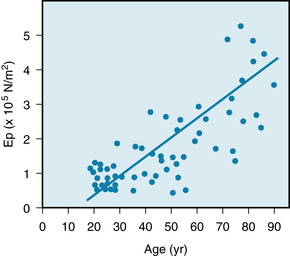
FIGURE 7-6 The effects of age on the elastic modulus (Ep) of the abdominal aorta in a group of 61 human subjects.
(Modified from Imura T, Yamamoto K, Kanamori K, et al: Non-invasive ultrasonic measurement of the elastic properties of the human abdominal aorta. Cardiovasc Res 20:208, 1986.)
 (3)
(3)where ΔP is the aortic pulse pressure, (Figure 7-7), D is the mean aortic diameter during the cardiac cycle, and ΔD is the maximal change in aortic diameter during the cardiac cycle.
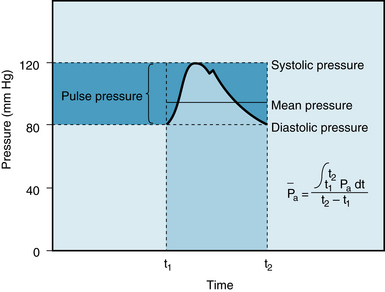
FIGURE 7-7 Arterial systolic, diastolic, pulse, and mean pressures. The mean arterial pressure ( ) represents the area under the arterial pressure curve (colored area) divided by the cardiac cycle duration (t2 – t1).
The fractional change in diameter (ΔD/D) of the aorta during the cardiac cycle reflects its change in volume (ΔV) as the left ventricle ejects its stroke volume into the aorta each systole. Thus Ep is inversely related to compliance, which is the ratio of ΔV to ΔP. Consequently, the increase in elastic modulus with aging (see Figure 7-6) and the decrease in compliance with aging (see Figure 7-4) both reflect the stiffening (arteriosclerosis) of the arterial walls as individuals age.
The Arterial Blood Pressure is Determined by Physical and Physiological Factors
The determinants of the pressure within the arterial system of intact subjects cannot be evaluated precisely. Nevertheless, arterial blood pressure is routinely measured in patients, and it provides a useful clue to cardiovascular status. We therefore take a simplified approach to explain the principal determinants of arterial blood pressure. To accomplish this, the determinants of the mean arterial pressure, defined in the next section, are analyzed first. Systolic and diastolic arterial pressures are then considered as the upper and lower limits of the periodic oscillations about this mean pressure.
The determinants of the arterial blood pressure may be subdivided arbitrarily into “physical” and “physiological” factors (Figure 7-8). The arterial system is assumed to be a static, elastic system. The only two “physical” factors are considered to be the blood volume within the arterial system and the elastic characteristics (compliance) of the system. The following “physiological” factors will be considered: namely, (1) the cardiac output, which equals heart rate × stroke volume, and (2) the peripheral resistance. Such physiological factors operate through one or both of the physical factors.
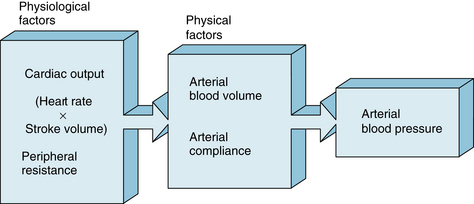
FIGURE 7-8 Arterial blood pressure is determined directly by two major physical factors, the arterial blood volume and the arterial compliance. These physical factors are affected in turn by certain physiological factors, primarily the heart rate, stroke volume, cardiac output (heart rate × stroke volume), and peripheral resistance.
Mean Arterial Pressure
The mean arterial pressure is the pressure in the large arteries, averaged over time. The mean pressure may be obtained from an arterial pressure tracing, by measuring the area under the pressure curve. This area is divided by the time interval involved, as shown in Figure 7-7. The mean arterial pressure,  , can usually be determined satisfactorily from the measured values of the systolic (Ps) and diastolic (Pd) pressures, by means of the following empirical formula:
 (4)
(4)The mean arterial pressure depends mainly on the mean blood volume in the arterial system and on the arterial compliance (see Figure 7-8). The arterial volume, Va, in turn depends (1) on the rate of inflow, Qh, from the heart into the arteries (cardiac output), and (2) on the rate of outflow, Qr, from the arteries through the resistance vessels. This constitutes the peripheral runoff. Expressed mathematically,
 (5)
(5)This equation is an expression of the law of conservation of mass. The equation states that the change in arterial blood volume per unit time (dVa/dt) represents the difference between the rate (Qh) at which blood is pumped into the arterial system by the heart, and the rate (Qr) at which the blood leaves the arterial system through the resistance vessels.
If the arterial inflow exceeds the outflow, the arterial volume increases, the arterial walls are stretched, and the arterial pressure rises. The converse happens when the arterial outflow exceeds the inflow. When the inflow equals the outflow, the arterial pressure remains constant.
Cardiac Output
The change in pressure in response to an alteration of cardiac output can be appreciated better by considering some simple examples. Under control conditions, let cardiac output be 5 L/min and let mean arterial pressure () be 100 mm Hg (Figure 7-9A). From the definition of total peripheral resistance,
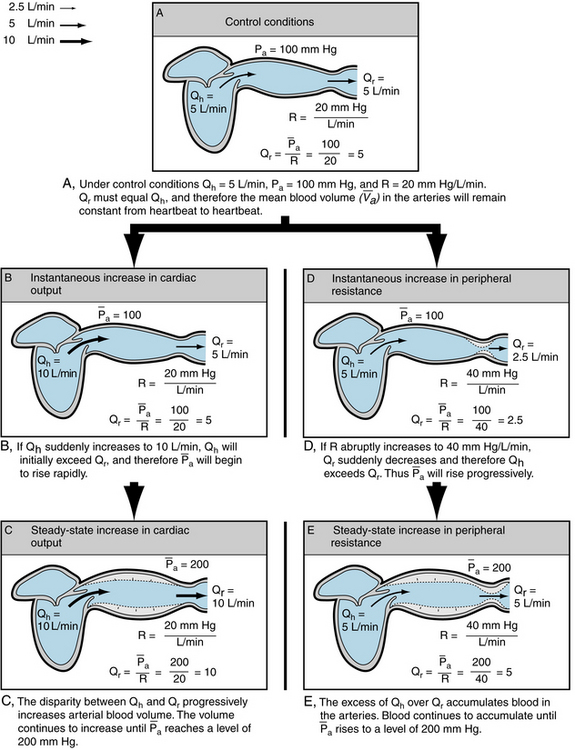
FIGURE 7-9 The relationship of mean arterial blood pressure () to cardiac output (Qh), peripheral runoff (Qr), and peripheral resistance (R) under control conditions (A), in response to an increase in cardiac output (B and C), and in response to an increase in peripheral resistance (D and E).
 (6)
(6)where Pra is right atrial pressure. If  (mean right atrial pressure) is negligible compared with ,
 (7)
(7)Therefore in the example, R is 100/5, or 20 mm Hg/L/min.
Now let cardiac output, Qh, suddenly increase to 10 L/min (Figure 7-9B). will remain unchanged. Because the outflow, Qr, from the arteries depends on and R, Qr will also remain unchanged. Therefore Qh, now 10 L/min, will exceed Qr, still only 5 L/min. This will increase the mean arterial blood volume ( ). From equation 5, when Qh > Qr, d /dt > 0; that is, volume is increasing.
Because depends on the mean arterial blood volume, and on the arterial compliance, Ca, an increase in will raise the . By definition,
 (8)
(8)Therefore,
 (9)
(9)and
 (10)
(10)From equation 5,
 (11)
(11)Hence will rise when Qh > Qr, it will fall when Qh < Qr, and it will remain constant when Qh = Qr.
In this example, Qh suddenly increased to 10 L/min, and continued to rise as long as Qh exceeded Qr. Equation 7 shows that Qr will not attain a value of 10 L/min until reaches a level of 200 mm Hg. Thereafter, R will remain constant at 20 mm Hg/L/min. Hence, as approaches 200, Qr will approach the value of Qh, and will rise very slowly. When Qh begins to rise, however, Qh exceeds Qr, and therefore will rise sharply. The pressure-time tracing in Figure 7-10 indicates that, regardless of the value of Ca, the slope gradually diminishes as pressure rises, and thus the final value is approached asymptomatically.
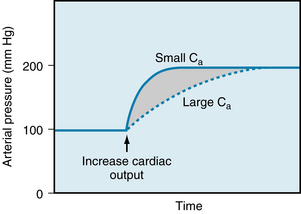
FIGURE 7-10 When cardiac output is suddenly increased, the arterial compliance (Ca) determines the rate at which the mean arterial pressure will attain its new, elevated value but will not determine the magnitude of the new pressure.
Furthermore, the height to which will rise does not depend on the elastic characteristics of the arterial walls. must rise to a level such that the peripheral runoff will equal the cardiac output; that is, Qr = Qh. Equation 6 shows that Qr depends only on the pressure gradient and the resistance to flow. Hence Ca determines only the rate at which the new equilibrium value of Pa will be approached, as illustrated in Figure 7-10. When Ca is small (as in rigid vessels), a relatively slight increment in Va would increase greatly. This increment in is caused by a transient excess of Qh over Qr. Hence attains its new equilibrium level quickly. Conversely, when Ca is large, considerable volumes can be accommodated with relatively small pressure changes. Therefore the new equilibrium value of is reached at a slower rate.
Peripheral Resistance
Similar reasoning may now be applied to explain the changes in that accompany alterations in peripheral resistance. Let the control conditions be identical to those of the preceding example, that is, Qh = 5, Pa = 100, and R = 20 (see Figure 7-9A). Then, let R suddenly be increased to 40 (see Figure 7-9D). would not change appreciably. When = 100 and R = 40, Qr would equal /R, which would then equal 2.5 L/min. Thus, the peripheral runoff would be only 2.5 L/min, even though cardiac output equals 5 L/min. If Qh remains constant at 5 L/min, Qh would exceed Qr and would increase; and therefore would rise. will continue to rise until it reaches 200 mm Hg (see Figure 7-9, E). At this pressure level, Qr = 200/40 = 5 L/min, which equals Qh. will remain at this new, elevated level, as long as Qh and R do not change.
It is evident, therefore, that the level of the mean arterial pressure depends on cardiac output and peripheral resistance. This dependency applies regardless of whether the change in cardiac output is accomplished by an alteration of heart rate or of stroke volume. Any change in heart rate that is balanced by a concomitant, oppositely directed change in stroke volume, will not alter Qh. Hence will not be affected.
Pulse Pressure
Let us assume (see Figure 7-8) that the arterial pressure, Pa, at any moment depends on the two physical factors, namely (1) the arterial blood volume, Va, and (2) the arterial compliance, Ca. Hence, the arterial pulse pressure (that is, the difference between systolic and diastolic pressures) is principally a function of the stroke volume and the arterial compliance.
Stroke Volume
The effect of a change in stroke volume on pulse pressure may be analyzed when Ca remains virtually constant. Ca is constant over any linear region of the pressure-volume curve (see Figure 7-11). Volume is plotted along the vertical axis, and pressure is plotted along the horizontal axis; the slope, dV/dP, equals the compliance, Ca.
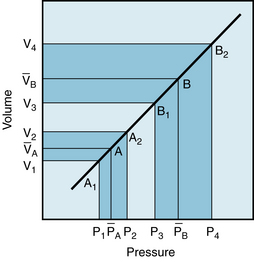
FIGURE 7-11 Effect of a change in stroke volume on pulse pressure in a system in which arterial compliance is constant over the range of pressures and volumes involved. A larger volume increment (V4 – V3 as compared with V2 – V1) results in a greater mean pressure ( as compared with (
 ) and a greater pulse pressure (P4 – P3 as compared with P2 – P1).
In an individual with such a linear Pa:Va curve, the arterial pressure would oscillate about a mean value ( in Figure 7-11). This value depends entirely on cardiac output and peripheral resistance, as explained above. The mean pressure reflects a specific mean arterial blood volume, . The coordinates, and , define point A on the graph. During diastole, peripheral runoff from the arterial system occurs in the absence of the ventricular ejection of blood. Furthermore, Pa and Va diminish to the minimal values, P1 and V1, just before the next ventricular ejection. P1 defines the diastolic pressure.
During the rapid ejection phase of systole, the volume of blood introduced into the arterial system exceeds the volume that exits through the arterioles. Arterial pressure and volume therefore rise from point A1 toward point A2 in Figure 7-11. The maximal arterial volume, V2, is reached at the end of the rapid ejection phase (see Figure 4-13); this volume corresponds to the peak pressure, P2, which is the systolic pressure.
The pulse pressure is the difference between the systolic and diastolic pressures (P2 – P1 in Figure 7-11), and it corresponds to some arterial volume increment, V2 – V1This increment equals the volume of blood discharged by the left ventricle during the rapid ejection phase, minus the volume that has run off to the periphery during this same phase of the cardiac cycle. When a healthy heart beats at a normal frequency, the volume increment during the rapid ejection phase is a large fraction (about 80%) of the stroke volume. It is this increment that raises the arterial volume rapidly from V1 to V2 . Consequently, the arterial pressure will rise from the diastolic to the systolic level (P1 to P2 in Figure 7-11). During the remainder of the cardiac cycle, peripheral runoff will exceed cardiac ejection. During diastole, the heart ejects no blood. Consequently, the arterial blood volume decrement will cause volumes and pressures to fall from point A2 back to point A1 in Figure 7-11.
If stroke volume is suddenly doubled while heart rate and peripheral resistance remain constant, the mean arterial pressure will be doubled, to point B, in Figure 7-11. Thus the arterial pressure will now oscillate with each heartbeat about this new value of the mean arterial pressure. A normal, vigorous heart will eject this greater stroke volume during a fraction of the cardiac cycle. This fraction approximately equals the fraction that prevailed at the lower stroke volume. Therefore the arterial volume increment, V4 – V3, will be a large fraction of the new stroke volume. Hence, the increment will be about twice as great as the previous volume increment (V2 – V1). If the Pa:Va curve were linear, the greater volume increment would be reflected by a pulse pressure (P4 – P3) that was approximately twice as great as the original pulse pressure (P2 – P1). Inspection of Figure 7-11 reveals that when both mean and pulse pressures rise, the increment in systolic pressure (from P2 to P4) exceeds the rise in diastolic pressure (from P1 to P3). Thus an increase in stroke volume raises systolic pressure more than it raises diastolic pressure.
CLINICAL BOX
The arterial pulse pressure affords valuable clues about a person’s stroke volume, provided that the arterial compliance is essentially normal. Patients who have severe congestive heart failure, or who have had a severe hemorrhage, are likely to have very small arterial pulse pressures, because their stroke volumes are abnormally small. Conversely, individuals with large stroke volumes, as in aortic regurgitation, are likely to have increased arterial pulse pressures. For example, well-trained athletes at rest tend to have low heart rates. The prolonged ventricular filling times in these subjects induce the ventricles to pump a large quantity of blood per heartbeat, and thus their pulse pressures are large.
Arterial Compliance
To assess how arterial compliance affects pulse pressure, the relative effects of a given volume increment (V2 – V1 in Figure 7-12) in a young person (curve A) and in an elderly person (curve B) are compared. Let cardiac output and TPR be the same in both people; therefore will be the same in both subjects. Figure 7-12 shows that the same volume increment (V2 – V1) will cause a greater pulse pressure (P4 – P1) in the less distensible arteries of the elderly individual than in the more compliant arteries of the young person (P3 – P2). Hence, the workload on the left ventricle of the elderly person would exceed that on the workload of the young person, even if the stroke volumes, TPR values, and mean arterial pressures were equivalent.
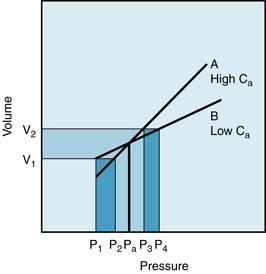
FIGURE 7-12 For a given volume increment (V2 – V1), a reduced arterial compliance (curve B as compared with curve A) results in an increased pulse pressure (P4 – P1 as compared with P3 – P2).
Figure 7-13 displays the effects of changes in arterial compliance and in peripheral resistance, Rp, on the arterial pressure in an isolated cat heart preparation. As the compliance was reduced from 43 to 14 to 3.6 units, the pulse pressure increased significantly. Changes of pulse pressure are greater when compliance changes at constant Rp than when Rp changes at constant compliance. In this preparation, the stroke volume decreased as the arterial compliance was diminished. This relationship accounts for the failure of the mean arterial pressure to remain constant at the different levels of arterial compliance. The effects of changes in peripheral resistance in this same preparation are described in the next section.
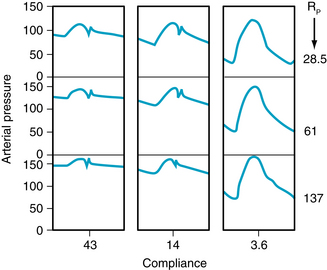
FIGURE 7-13 The changes in aortic pressure induced by changes in arterial compliance and peripheral resistance (Rp) in an isolated cat heart preparation. Note that at a constant Rp of 28.5 units, reducing compliance from 43 to 3.6 units increases systolic and decreases diastolic pressures, resulting in a widened pulse pressure. When compliance is kept constant at 14 units, increasing Rp from 28.5 to 137 units increases systolic and diastolic pressures.
(Modified from Elzinga G, Westerhof N: Pressure and flow generated by the left ventricle against different impedances. Circ Res 32:178, 1973.)
Total Peripheral Resistance and Arterial Diastolic Pressure
It is often claimed that an increase in TPR affects the diastolic arterial pressure more than it does the systolic arterial pressure. The validity of such an assertion deserves close scrutiny. First, let TPR be increased in an individual with a linear Pa:Va curve, as depicted in Figure 7-14A. If the subject’s heart rate and stroke volume remain constant, an increase in TPR will increase the proportionately (from P2 to P5). If the volume increments (V2 – V1 and V4 – V3) are equal at both levels of TPR, the pulse pressures (P3 – P1 and P6 – P4) will also be equal. Hence systolic (P6) and diastolic (P4) pressures will have been elevated by exactly the same amounts from their respective control levels (P3 and P1).
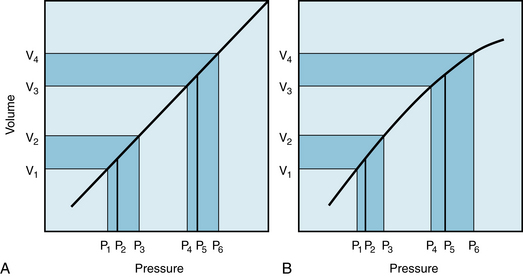
FIGURE 7-14 Effect of a change in total peripheral resistance (volume increment remaining constant) on pulse pressure when the pressure-volume curve for the arterial system is rectilinear (A) or curvilinear (B).
The combination of an increased resistance and diminished arterial compliance on arterial blood pressure are represented in Figure 7-13 by a shift in direction from the top leftmost panel to the bottom rightmost panel. Both the mean pressure and the pulse pressure would be increased significantly. These results also coincide with the changes predicted by .
CLINICAL BOX
Chronic hypertension is characterized by a persistent elevation of TPR. It occurs more commonly in older than in younger persons. The Pa:Va curve for a hypertensive patient would therefore resemble that shown in Figure 7-14B. In this figure, the slope of the Pa:Va curve diminishes as pressure and volume are increased. Hence, Ca is less at higher than at lower pressures. If cardiac output remains constant, an increase in TPR would increase Pa proportionately (from P2 to P5). For equivalent increases in TPR, the pressure elevation from P2 to P5 would be the same in panel A as in panel B (see Figure 7-10). If the volume increment (V4 − V3 in Figure 7-14B) at elevated TPR were equal to the control increment (V2 −V1), the pulse pressure (P6 − P4) in the hypertension range would greatly exceed that (P3 − P1) at normal pressure levels. In other words, a given volume increment produces a greater pressure increment (i.e., pulse pressure) when the arteries are more rigid than when they are more compliant. Hence the rise in systolic pressure (P6 − P3) will exceed the increase in diastolic pressure (P4 − P1). These hypothetical changes in arterial pressure closely resemble those actually observed in hypertensive patients. Diastolic pressure is indeed elevated in such persons, but usually not more than 10 to 40 mm Hg above the average normal level (about 80 mm Hg). Conversely, systolic pressures are often found to be elevated by 50 to 150 mm Hg above the average normal level (about 120 mm Hg). Thus, an increase in peripheral resistance will usually raise systolic pressure more than it will raise the diastolic pressure.
The Pressure Curves Change in Arteries at Different Distances from the Heart
The radial stretch of the ascending aorta brought about by left ventricular ejection initiates a pressure wave that is propagated down the aorta and its branches. The pressure wave travels much faster (~4-12 m/s) than does the blood itself. It is this pressure wave that one perceives by palpating a peripheral artery (for example, in the wrist).
The velocity of the pressure wave varies inversely with the vascular compliance. Accurate measurement of the transmission velocity has provided valuable information about the elastic characteristics of the arterial tree. In general, transmission velocity increases with age. This finding confirms the observation that the arteries become less compliant with advancing age (see Figures 7-4 and 7-6). Furthermore, the pulse wave velocity increases progressively as the pulse wave travels from the ascending aorta toward the periphery. This indicates that vascular compliance is less in the more distal than in the more proximal portions of the arterial system. In addition, there is greater overlap between the forward and reflected pulse waves because of the increasing resistance of the vessels as their diameter decreases.
The arterial pressure contour becomes distorted as the wave is transmitted down the arterial system. The changes in configuration of the pulse with distance are shown in Figure 7-15. Aside from the lengthening delay in the onset of the initial pressure rise, three major changes occur in the arterial pulse contour as the pressure wave travels distally. First, the high-frequency components of the pulse, such as the incisura (the notch that appears at the end of ventricular ejection), are damped out and soon disappear. Second, the systolic portions of the pressure wave become narrow and elevated. In Figure 7-15, the systolic pressure at the level of the knee was 39 mm Hg greater than that recorded in the aortic arch. Third, a hump may appear on the diastolic portion of the pressure wave. These changes in contour are pronounced in young individuals, but they diminish with age. In elderly patients, the pulse wave may be transmitted virtually unchanged from the ascending aorta to the periphery.
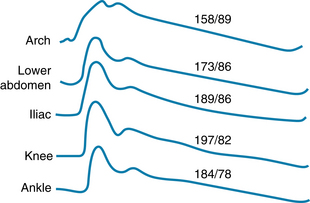
FIGURE 7-15 Arterial pressure (mm Hg) curves recorded from various sites in an anesthetized dog.
(From Remington JW, O’Brien LJ: Construction of aortic flow pulse from pressure pulse. Am J Physiol 218:437, 1970.)
An illustration of all these features as recorded in the human arterial tree is shown in Figure 7-16. In the 24-year-old subject, the arterial pulse propagates slowly and displays changes in the pulse pressure amplitude and contour, as seen in the canine model in Figure 7-15. By contrast, the pulse pressure wave in the 68-year-old subject travels more rapidly than in the younger subject. Also, the pulse pressure wave is relatively unchanged as the pulse travels because there is less wave reflection.
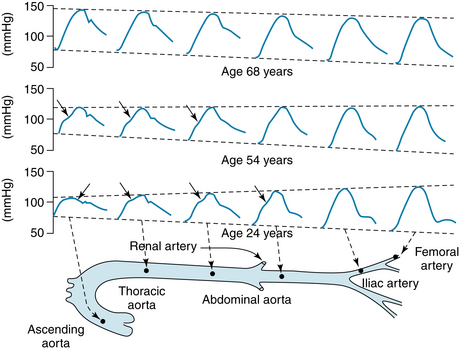
FIGURE 7-16 Pulse pressures recorded from different sites in the arterial trees of humans at different ages.
(Reproduced by permission of Hodder Education from Nichols WW, O’Rourke M, editors: McDonald’s blood flow in arteries: theoretical, experimental and clinical principles, ed 5, London, 2005, Arnold.)
The damping of the high-frequency components of the arterial pulse is caused largely by the viscoelastic properties of the arterial walls. The mechanisms for the peaking of the pressure wave are complex. Several factors contribute to these changes, including reflection, tapering of the arteries, resonance, and pulse wave velocity. The augmentation index, the ratio of the reflected wave to the pulse pressure, is a relative measure of arterial stiffness. Thus, as arterial compliance decreases with age, the reflected wave superimposes on the pulse pressure at an earlier time. Eventually, as seen in Figure 7-16, the location of the reflected wave is evident as an increased central pulse pressure in the 68 year-old subject rather than as an inflection detected at various times during the pulse pressure recording in the 24 year- old subject.
CLINICAL BOX
The ankle-brachial index (ABI) is the ratio of systolic blood pressures at the ankle (dorsalis pedis artery) to that in the brachial artery. The ABI, which is obtained by simple measurements, serves as an indicator of peripheral artery disease. More recently, the ABI has been proposed as a predictor of risk for cardiovascular and cerebrovascular pathology. For example, subjects with a normal ABI ratio of 1.1 to 1.4 had a lower incidence of either coronary or cerebrovascular events than did subjects having a ratio of ≤0.9. Another result of such measurements indicates that as the rate of ABI increases with time, the incidence of cardiovascular morbidity and mortality also increases.
Blood Pressure is Measured by a Sphygmomanometer in Human Patients
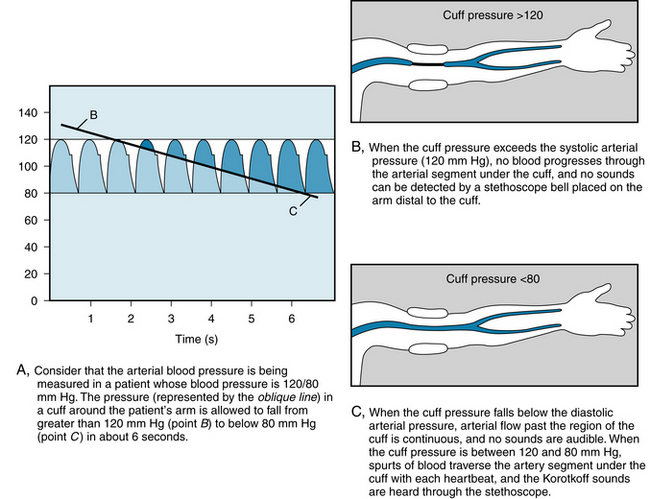
In hospital intensive care units, arterial blood pressure can be measured directly by introducing a needle or catheter into a peripheral artery. Ordinarily, however, the blood pressure is estimated indirectly, by means of a sphygmomanometer. This instrument consists of an inextensible cuff that contains an inflatable bag. The cuff is wrapped around an extremity, usually the arm, so that the inflatable bag lies between the cuff and the skin, directly over the artery to be compressed. The artery is occluded by inflating the bag, by means of a rubber squeeze bulb, to a pressure in excess of the arterial systolic pressure. The pressure in the bag is measured by means of a mercury, or an aneroid, manometer. Pressure is released from the bag, at a rate of 2 or 3 mm Hg per heartbeat, by means of a needle valve in the inflating bulb (see Figure 7-17).
When blood pressure is determined from an arm, the systolic pressure may be estimated by palpating the radial artery at the wrist (palpatory method). When pressure in the bag exceeds the systolic level, no pulse is perceived. As the pressure falls just below the systolic level (see Figure 7-17A), a spurt of blood passes through the brachial artery under the cuff during the peak of systole, and a slight pulse is felt at the wrist.
The auscultatory method is a more sensitive, and therefore a more precise, method for measuring systolic pressure; it also permits estimation of the diastolic pressure. The practitioner listens with a stethoscope applied to the skin of the antecubital space, over the brachial artery. While the pressure in the bag exceeds the systolic pressure, the brachial artery is occluded, and no sounds are heard (see Figure 7-17B). When the inflation pressure falls just below the systolic level (120 mm Hg in Figure 7-17A), small spurts of blood escape through the cuff and slight tapping sounds (called Korotkoff sounds) are heard with each heartbeat. The pressure at which the first sound is detected represents the systolic pressure. It usually corresponds closely with the directly measured systolic pressure.
As inflation pressure continues to fall, more blood escapes under the cuff per heartbeat, and the sounds become louder. As the inflation pressure approaches the diastolic level, the Korotkoff sounds become muffled. As the inflation pressure falls just below the diastolic level (80 mm Hg in Figure 7-17A), the sounds disappear; this point identifies the diastolic pressure. The origin of the Korotkoff sounds is related to the spurts of blood that pass under the cuff and that meet a static column of blood; the impact and turbulence generate audible vibrations. Once the inflation pressure is less than the diastolic pressure, flow is continuous in the brachial artery, and the sounds are no longer heard (see Figure 7-17C).
Summary
 The arteries not only serve to conduct blood from the heart to the capillaries but also store some of the ejected blood during each cardiac systole. Therefore blood can continue to flow through the capillaries during cardiac diastole.
The compliance of the arteries diminishes with age.
The less compliant the arteries, the more work the heart must do to pump a given cardiac output.
The mean arterial pressure varies directly with the cardiac output and total peripheral resistance.
The arterial pulse pressure varies directly with the stroke volume, but inversely with the arterial compliance.
The contour of the systemic arterial pressure wave is distorted as it travels from the ascending aorta to the periphery. The high-frequency components of the wave are damped, the systolic components are narrowed and elevated, and a hump may appear in the diastolic component of the wave.
When blood pressure is measured by a sphygmomanometer in humans, systolic pressure is manifested by the occurrence of a tapping sound that originates in the artery distal to the cuff as the cuff pressure falls below peak arterial pressure. The diminished cuff pressure permits spurts of blood to pass through the compressed artery. Diastolic pressure is manifested by the disappearance of the sound as the cuff pressure falls below the minimal arterial pressure, permitting flow through the artery to become continuous.
Espinola-Klein, Rupprecht Hans J., Bickel C., et al. Different calculations of ankle-brachial index and their impact on cardiovascular risk prediction. Circ. 2008;118:961.
Folkow B., Svanborg A. Physiology of cardiovascular aging. Physiol Rev. 1993;73:725.
Lakatta E.G., Wang J., Najjar S.S. Arterial aging and subclinical arterial disease are fundamentally intertwined at macroscopic and molecular levels. Med Clin N Amer. 2009;93:583.
London G.M., Pannier B. Arterial functions: how to interpret the complex physiology. Nephrol Dial Transplant. 2010;25:3815.
Nichols W.W. Clinical measurement of arterial stiffness obtained from noninvasive pressure waveforms. Am J Hypertens. 2005;18:3S.
Nichols W.W., Edwards D.G. Arterial elastance and wave reflection augmentation of systolic blood pressure: deleterious effects and implications for therapy. J Cardiovasc Pharmacol Ther. 2001;6:5.
O’Rourke M. Mechanical principles in arterial disease. Hypertension. 1995;26:2.
Perloff D., Grim C., Flack J., et al. Human blood pressure determination by sphygmomanometry. Circ. 1993;88:2460.
Stergiopulos N., Meister J.J., Westerhof N. Evaluation of methods for estimation of total arterial compliance. Am J Physiol. 1995;268:H1540.
Wagenseil J.E., Mecham R.P. Vascular extracellular matrix and arterial mechanics. Physiol Rev. 2009;89:957.
CASE 7-1
History
A 33-year-old man complained about chest pain on exertion. He was referred to a cardiologist, who carried out a number of studies, including right- and left-sided cardiac catheterization (for hemodynamic information) and coronary angiography (to image the status of the coronary arteries). Among the data that were obtained during these studies were the findings that the patient’s pulmonary artery and aortic pressures, in mm Hg, were as follows:
| Pressures | Pulmonary Artery | Aorta |
|---|---|---|
| Systolic | 30 | 120 |
| Diastolic | 15 | 80 |
| Pulse | 15 | 40 |
| Mean | 20 | 93 |
The hemodynamic and angiographic studies disclosed no serious abnormalities. The patient’s physicians recommended certain changes in lifestyle and diet, and the patient continued to do well for about 20 years. At this time, the physician found that the patient’s systemic arterial blood pressure was 190 mm Hg systolic/100 mm Hg diastolic, and the mean arterial pressure was estimated to be 130 mm Hg. These and other findings led his physicians to the diagnosis of essential hypertension.
Questions
1. At the time of the initial examination, the patient’s mean aortic pressure (93 mm Hg) was so much higher than the mean pulmonary arterial pressure (20 mm Hg) because:
2. When the patient became hypertensive, his arterial pulse pressure (90 mm Hg) became much greater than his pre-hypertension pulse pressure (40 mm Hg) because: