4 The Cardiac Pump
1. Learn how the microscopic and gross anatomy of the heart enables it to pump blood through the systemic and pulmonary circulations.
2. Indicate how electrical excitation of the heart is coupled to its contractions.
3. Elucidate the main factors that determine cardiac contractile force.
4. Describe and explain the pressure changes in the heart chambers and great vessels during a complete cardiac cycle.
5. Relate ATP metabolism to oxidation of fatty acids and carbohydrates.
6. Learn how O2 consumption links cardiac substrate metabolism with ventricular function.
The heart exhibits a wide range of activity and functional capacity, and performs a tremendous amount of work over the lifetime of an individual. The heart can function independently of extracardiac stimuli, but its performance is strongly influenced by humoral and neural factors. Because all myocardial muscle cells are activated to contract on each beat, the strength of the heart’s contraction is determined ultimately by the strength of contraction of all the individual myocardial cells. The strength of contraction of each cell is determined in turn by excitation-contraction coupling processes within it and by its (sarcomere) length, which is determined by the physical forces acting on the cell, both prior to contraction (preload) and during contraction (afterload). In this chapter we consider some of the basic intrinsic mechanisms (viz. those in myocardial cells and arising in the heart itself) that affect cardiac activity; the effects of extracardiac factors are discussed in subsequent chapters.
The Gross and Microscopic Structures of the Heart are Uniquely Designed for Optimal Function
The Myocardial Cell
Several important morphological and functional differences exist between myocardial cells (Figures 4-1 to 4-4) and skeletal muscle cells. However, the contractile elements within the two types of cells are quite similar; each skeletal and cardiac muscle cell is made up of sarcomeres (from Z line to Z line) that contain thick filaments composed of myosin (in the A band) and thin filaments containing actin. The thin filaments extend from the point where they are anchored to the Z line (through the I band) to interdigitate with the thick filaments. Shortening occurs by the sliding filament mechanism as in the case of skeletal muscle. Actin filaments slide along adjacent myosin filaments by cycling of the intervening cross-bridges, thereby bringing the Z lines closer together.
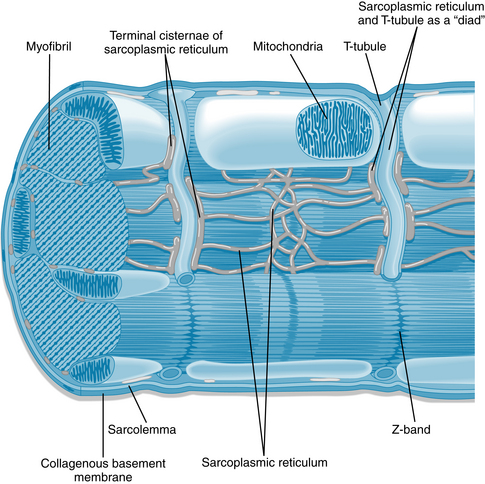
FIGURE 4-1 Diagram of a cardiac sarcomere illustrating the relationships among components of the cardiac myocyte.
(Redrawn from Fawcett D, McNutt NS: The ultrastructure of the cat myocardium. I. Ventricular papillary muscle. J Cell Biol 42:1, 1969.)
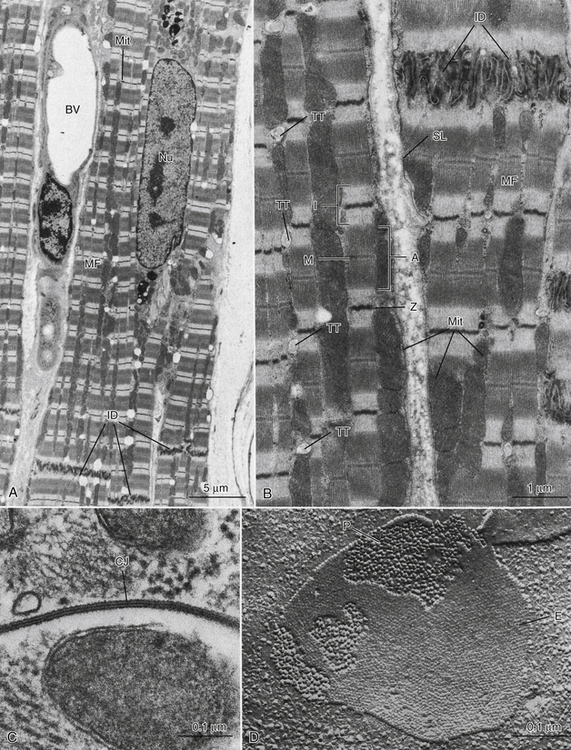
FIGURE 4-2 A, Low-magnification electron micrograph of a monkey heart (ventricle). Typical features of myocardial cells include the elongated nucleus (Nu), striated myofibrils (MF) with columns of mitochondria (Mit) between the myofibrils, and intercellular junctions (intercalated disks, ID). A blood vessel (BV) is located between two myocardial cells. B, Medium-magnification electron micrograph of monkey ventricular cells showing details of ultrastructure. The sarcolemma (SL) is the boundary of the muscle cells and is thrown into multiple folds where the cells meet at the ID region. The prominent MFs show distinct banding patterns, including the A band (A), dark Z lines (Z), I band regions (I), and M lines (M) at the center of each sarcomere unit. Mitochondria (Mit) occur either in rows between MFs or in masses just underneath the sarcolemma. Regularly spaced transverse tubules (TT) appear at the Z line levels of the myofibrils. C, High-magnification electron micrograph of a specialized intercellular junction between two myocardial cells of the mouse. Called a gap junction (GJ) or nexus, this attachment consists of very close apposition of the sarcolemmal membranes of the two cells and appears in thin section to consist of seven layers. D, Freeze-fracture replica of mouse myocardial gap junction, showing distinct arrays of characteristic intramembranous particles. Large particles (P) belong to the inner half of the sarcolemma of one myocardial cell, whereas the “pitted” membrane face (E) is formed by the outer half of the sarcolemma of the cell above.
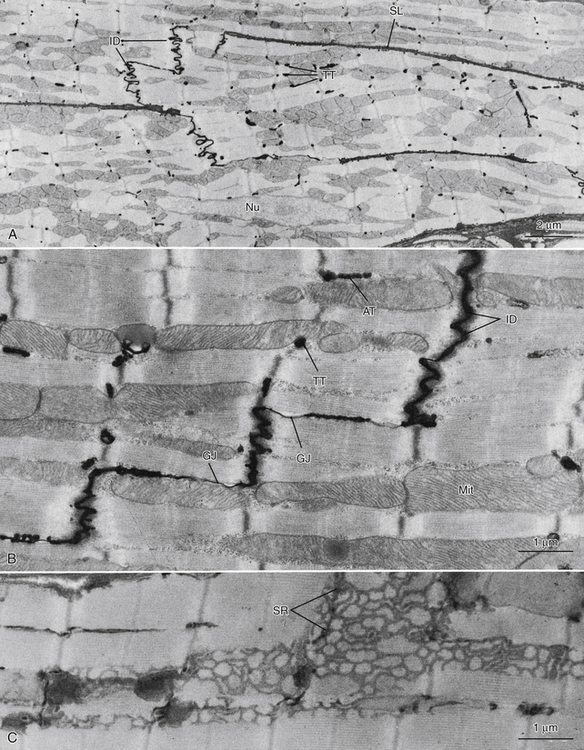
FIGURE 4-3 A, Low-magnification electron micrograph of the right ventricular wall of a mouse heart. Tissue was fixed in a phosphate-buffered glutaraldehyde solution and postfixed in ferrocyanide-reduced osmium tetroxide. This procedure has resulted in the deposition of electron-opaque precipitate in the extracellular space, thus outlining the sarcolemmal borders (SL) of the muscle cells and delineating the intercalated disks (ID) and transverse tubules (TT). Nu, Nucleus of the myocardial cell. B, Mouse cardiac muscle in longitudinal section, treated as in A. The path of the extracellular space is traced through the ID region, and sarcolemmal invaginations that are oriented transverse to the cell axis (TT) or parallel to it (axial tubules, AT) are clearly identified. Gap junctions (GJ) are associated with the ID. Mitochondria are large and elongated and lie between the myofibrils. C, Mouse cardiac muscle. Tissue treated with ferrocyanide-reduced osmium tetroxide to identify the internal membrane system (sarcoplasmic reticulum, SR). Specific staining of the SR reveals its architecture as a complex network of small-diameter tubules that are closely associated with the myofibrils and mitochondria.
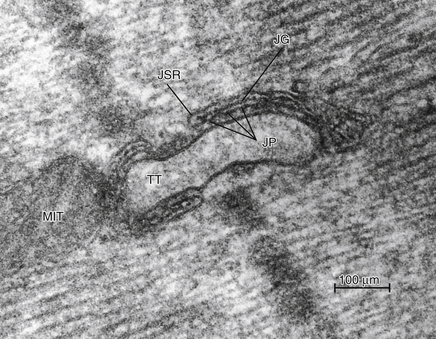
FIGURE 4-4 An electron micrograph of mammalian myocardium that shows a cross-section of a transverse tubule (TT) adjacent to junctional sarcoplasmic reticulum (JSR). Junctional processes (JP) extend from the JSR into the cell cytoplasm. The JPs are proteins that make up the calcium release channels from the SR and are also called ryanodine receptors because they bind the insecticide ryanodine. MIT, Mitochondrion; JG, junctional gap.
(Courtesy Joachim R. Sommer.)
A striking difference between cardiac and skeletal muscle is the semblance of a syncytium in cardiac muscle with branching interconnecting fibers. The myocardium is not a true anatomic syncytium, because laterally the myocardial fibers are separated from adjacent fibers by their respective sarcolemmas, and the end of each fiber is separated from its neighbor by dense structures, called intercalated disks (IDs), that are continuous with the sarcolemma (see Figures 4-2 and 4-3). Nevertheless, cardiac muscle functions as a syncytium, because a wave of depolarization followed by contraction of the entire myocardium (an all-or-none response) occurs when a suprathreshold stimulus is applied to any one site.
As the wave of excitation approaches the end of a cardiac cell, the spread of excitation to the next cell depends on the electrical conductance of the boundary between the two cells. Gap junctions (nexi) with high conductances are present in the intercalated disks between adjacent cells (Figure 4-2C and D). These gap junctions, which mediate conduction of the cardiac impulse from one cell to the next, are made up of connexons, hexagonal structures that connect the cytosol of adjacent cells. Each connexon consists of six polypeptides surrounding a core channel approximately 1.6 to 2.0 nm wide, which serves as a low-resistance pathway for cell-to-cell conduction.
Cardiac impulses progress more rapidly in a direction parallel to (isotropic) the long axes of the constituent fibers than in a direction perpendicular to (anisotropic) the long axes of those fibers. Gap junctions exist in the borders between myocardial fibers that are in contact with each other longitudinally; they are very sparse in the lateral borders between myocardial fibers.
Cardiac and fast skeletal muscle fibers differ in the number of mitochondria in the two tissues. Fast skeletal muscle, which is called on for relatively short periods of repetitive or sustained contractions and which can metabolize anaerobically and build up a substantial O2 debt, has relatively few mitochondria in its fibers. In contrast, cardiac muscle, which contracts repetitively for a lifetime and requires a continuous supply of O2, is very rich in mitochondria (see Figures 4-1 to 4-3). Rapid oxidation of substrates with the synthesis of adenosine triphosphate (ATP) can keep pace with the myocardial energy requirements because of the large numbers of mitochondria containing the respiratory enzymes necessary for oxidative phosphorylation (see later in this chapter).
To provide adequate O2 and substrate for its metabolism, the myocardium is endowed with a rich capillary supply, about one capillary per fiber. Thus, diffusion distances are short, and O2, CO2, substrates, and waste material can move rapidly between the myocardial cell and capillary. With respect to exchange of substances between the capillary blood and the myocardial cells, electron micrographs of myocardium show deep invaginations of the sarcolemma into the fiber at the Z lines (see Figure 4-3). These sarcolemmal invaginations constitute the transverse-tubular, or T-tubular, system. The T-tubule lumina are continuous with the bulk interstitial fluid; T-tubules play a key role in excitation-contraction coupling.
In mammalian ventricular cells, adjacent T-tubules are interconnected by longitudinally running or axial tubules that form an extensively interconnected lattice of “intracellular” tubules (see Figure 4-3). This T-tubular system is open to the interstitial fluid, is lined with a basement membrane continuous with that of the surface sarcolemma, and contains micropinocytotic vesicles. Thus, in ventricular cells the myofibrils and mitochondria have ready access to a space continuous with the interstitial fluid. The T-tubular system is absent or poorly developed in atrial myocytes and Purkinje cells of mammalian hearts.
A network of sarcoplasmic reticulum (SR) (Figure 4-3C) consisting of small-diameter sarcotubules is also present surrounding myofibrils; these sarcotubules are believed to be “closed” because colloidal tracer particles (2 to 10 nm in diameter) do not enter them. They do not contain basement membrane. Flattened elements of the SR are often found in close proximity to the T-tubular system as well as to the surface sarcolemma, forming “dyads” (Figure 4-4).
Structure of the Heart: Atria, Ventricles, and Valves
The mammalian heart is a four-chambered structure, consisting of two pumps in series; a “right heart,” consisting of right atrium and right ventricle, that pumps venous blood to the pulmonary circulation, and a “left heart,” consisting of left atrium and left ventricle, that pumps oxygenated blood into the systemic circulation at relatively high pressure (Figures 4-5 and 4-6). The atria are thin-walled, low-pressure chambers that function more as large reservoir conduits of blood for their respective ventricles than as important pumps for the forward propulsion of blood. The ventricles are formed by a continuum of muscle fibers that originates from the fibrous skeleton at the base of the heart (chiefly around the aortic orifice). These fibers sweep toward the apex at the epicardial surface and also pass toward the endocardium as they gradually undergo a 180-degree change in direction (Figure 4-7) to lie parallel to the epicardial fibers and form the endocardium and papillary muscles (see Figure 4-5). At the apex of the heart the fibers twist and turn inward to form papillary muscles. At the base and around the valve orifices (see Figure 4-6), the fibers form a thick, powerful muscle that not only decreases ventricular circumference for ejection of blood but also narrows the atrioventricular (AV) valve orifices as an aid to valve closure.
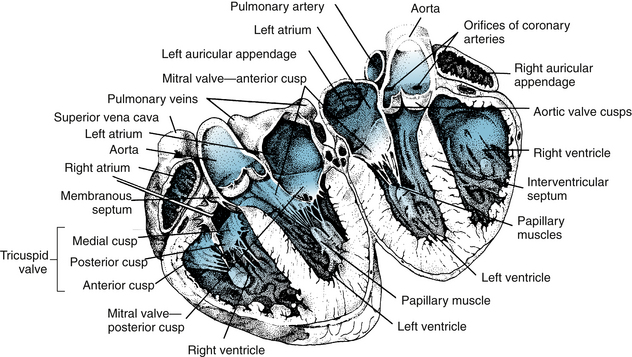
FIGURE 4-5 Drawing of a heart split perpendicular to the interventricular septum illustrates the anatomical relationships of the leaflets of the atrioventricular and aortic valves.
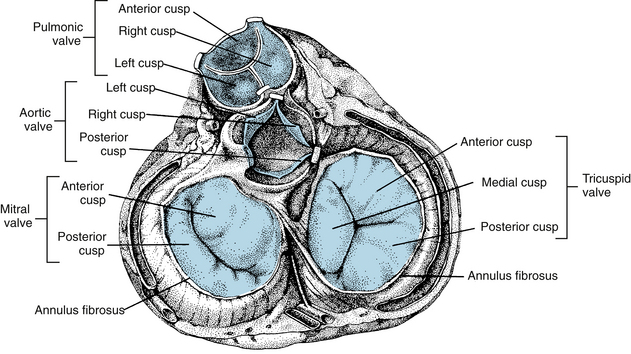
FIGURE 4-6 Four cardiac valves as viewed from the base of the heart. Note how the leaflets overlap in the closed valves.
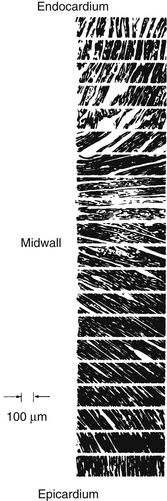
FIGURE 4-7 Sequence of photomicrographs showing fiber angles in successive sections taken from the middle of the free wall of the left ventricle from a heart in systole. The sections are parallel to the epicardial plane. The fiber angle is 90 degrees at the endocardium, running through 0 degrees at the midwall to −90 degrees at the epicardium.
(From Streeter DD Jr, Spotnitz HM, Patel DP, et al: Fiber orientation in the canine left ventricle during diastole and systole. Circ Res 24:339, 1969.)
Ventricular ejection is accomplished by a reduction in circumference and by a decrease in the longitudinal axis with descent of the base of the heart. The earlier contraction of the apical part of the ventricles, coupled with approximation of the ventricular walls, propels the blood toward the outflow tracts. The right ventricle, which develops a mean pressure about one seventh of that developed by the left ventricle, is considerably thinner than the left. The cardiac valves consist of thin flaps of flexible, tough, endothelium-covered fibrous tissue firmly attached at the bases to the fibrous valve rings. Movements of the valve leaflets are essentially passive, and the orientation of the cardiac valve is responsible for unidirectional flow of blood through the heart. There are two types of valves in the heart—the AV valves and the semilunar valves (see Figures 4-5 and 4-6).
Atrioventricular Valves
The valve between the right atrium and right ventricle is made up of three cusps (tricuspid valve), whereas the valve between the left atrium and left ventricle has two cusps (mitral valve). The total area of the cusps of each AV valve is approximately twice that of their respective AV orifices, so that there is considerable overlap of the leaflets in the closed position (see Figures 4-5 and 4-6). Attached to the free edges of these valves are fine, strong ligaments (chordae tendineae), which arise from the powerful papillary muscles of the respective ventricles and prevent eversion of the valves during ventricular systole.
Semilunar Valves
The valves between the right ventricle and the pulmonary artery and between the left ventricle and the aorta consist of three cuplike cusps attached to the valve rings (see Figures 4-5 and 4-6). At the end of the reduced ejection phase of ventricular systole, there is a brief reversal of blood flow toward the ventricles (shown as a negative flow in the phasic aortic flow curve in Figure 4-13) that snaps the cusps together and prevents regurgitation of blood into the ventricles. During ventricular systole the cusps do not lie back against the walls of the pulmonary artery and aorta but float in the bloodstream approximately midway between the vessel walls and their closed position. Behind the semilunar valves are small outpocketings of the pulmonary artery and aorta (sinuses of Valsalva), where eddy currents develop that tend to keep the valve cusps away from the vessel walls. The orifices of the right and left coronary arteries are behind the right and the left cusps, respectively, of the aortic valve. Were it not for the presence of the sinuses of Valsalva and the eddy currents developed therein, the coronary ostia could be blocked by the valve cusps.
The Pericardium Is an Epithelized Fibrous Sac That Invests the Heart
The pericardium consists of a visceral layer that adheres to the epicardium and a parietal layer that is separated from the visceral layer by a thin layer of fluid. This fluid provides lubrication for the continuous movement of the enclosed heart. The pericardium strongly resists a large, rapid increase in cardiac size because its distensibility is small. The pericardium plays a role in preventing sudden overdistention of the chambers of the heart because of this characteristic. However, with congenital absence of the pericardium or after its surgical removal, cardiac function is within physiological limits. Nevertheless, with the pericardium intact, an increase in diastolic pressure in one ventricle increases the pressure and decreases the compliance of the other ventricle.
CLINICAL BOX
If the heart becomes greatly distended with blood during diastole and becomes spherical, as may occur in cardiac failure, it is less efficient; more energy is required (greater wall tension) for the distended heart to eject the same volume of blood per beat than for the normal undilated heart. This is an example of Laplace’s law (Chapter 8), which states that the tension (T, force/unit length) in the wall of a vessel equals the transmural pressure difference (pressure across the wall, or distending pressure, ΔP) times the radius (r) of the vessel. The Laplace relationship can be applied to the distended and spherical heart if correction is made for wall thickness. The equation is

where T is wall stress (force/area), ΔP is transmural pressure difference, r is radius, and w is wall thickness.
The Force of Cardiac Contraction is Determined by Excitation-Contraction Coupling and the Initial Sarcomere Length of the Myocardial Cells
Excitation-Contraction Coupling Is Mediated by Calcium
Contraction of the heart is triggered by the spread of electrical excitation throughout the syncytium of muscle cells. Ultimately, the strength of contraction of each cardiac cell is determined by the chemical processes linking or “coupling” this excitation to acto-myosin cross-bridge cycling, a process known as “excitation-contraction coupling” (Figure 4-8). The excitation-contraction coupling processes are major determinants of the ability of the heart to contract, and thus of its contractility. For normal excitation-contraction coupling, the heart requires optimal concentrations of Na+, K+, and Ca++. In the absence of Na+, the heart is not excitable and will not beat because the action potential depends on extracellular Na+. In contrast, the resting membrane potential is independent of the Na+ gradient across the membrane (see Figure 2-7). Under normal conditions, the extracellular K+ concentration is about 4 mM. A moderate reduction in extracellular K+ has little effect on myocardial excitation and contraction, but it flattens the T wave of the electrocardiogram. A severe reduction in extracellular K+ produces weakness, paralysis, and cardiac arrest. Large increases in extracellular K+ produce dysrhythmias, depolarization, loss of excitability of the myocardial cells, and cardiac arrest in diastole. Ca++ is essential for cardiac contraction; removal of Ca++ from the extracellular fluid results in decreased contractile force and eventual arrest in diastole. Conversely, an increase in extracellular Ca++ enhances contractile force, and very high Ca++ concentrations induce cardiac arrest in systole (rigor). The free intracellular Ca++ concentration is responsible for the contractile state of the myocardium.
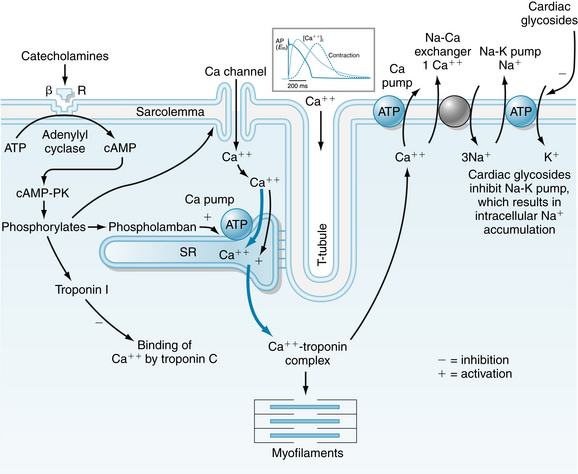
FIGURE 4-8 Schematic diagram of the movement of calcium in excitation-contraction coupling in cardiac muscle. The influx of Ca++ from the interstitial fluid during excitation triggers the release of Ca++ from the sarcoplasmic reticulum (SR). The free cytosolic Ca++ activates contraction of the myofilaments (systole). Relaxation (diastole) occurs as a result of uptake of Ca++ by the SR, by extrusion of intracellular Ca++ by Na+-Ca++ exchange, and to a limited degree by the Ca pump. ATP, adenosine triphosphate; βR, β-adrenergic receptor; cAMP, cyclic adenosine monophosphate; cAMP-PK, cAMP-dependent protein kinase; DHPR, dihydropyridine receptor; RyR, ryanodine receptor.
(Redrawn from Bers DM: Cardiac excitation-contraction coupling. Nature 415:198, 2002.)
Initially, a wave of excitation spreads rapidly along the myocardial sarcolemma from cell to cell via gap junctions. Excitation also spreads to the cell interior via the T-tubules, which invaginate the cardiac fibers at the Z lines. Electrical stimulation at the Z line or the application of Ca++ to the Z lines in the skinned (sarcolemma removed) cardiac fiber elicits a localized contraction of adjacent myofibrils. During the plateau (phase 2) of the action potential, Ca++ permeability of the sarcolemma increases. Ca++ enters the cell through voltage-dependent L-type Ca++ channels in the sarcolemma and in the T-tubules (see Figure 4-8). The Ca++ channel protein is called the dihydropyridine receptor because it has high affinity for this group of Ca++ channel antagonists. Opening of the Ca++ channels is facilitated by phosphorylation of the channel proteins by a cyclic adenosine monophosphate (cAMP)–dependent protein kinase. The primary source of extracellular Ca++ is the interstitial fluid (1 mM Ca++). Some Ca++ also may be bound to the sarcolemma and to the glycocalyx, a mucopolysaccharide that covers the sarcolemma. The amount of Ca++ that enters the cell from the extracellular space is not sufficient to induce contraction of the myofibrils, but it serves as a trigger (trigger Ca++) to release Ca++ from the intracellular Ca++ stores in the SR (see Figure 4-3). The Ca++ leaves the SR through calcium release channels, which are called ryanodine receptors because the channel protein, also called foot protein or junctional processes of the SR, binds ryanodine avidly. During this process, called Ca++-induced Ca++ release, the cytosolic free Ca++ increases from a resting level of about 0.1 µM to levels of 1 µM to 10 µM, and the Ca++ binds to the protein troponin C. The Ca++-troponin complex interacts with tropomyosin to unblock active sites between the actin and myosin filaments, allowing cross-bridge cycling and hence contraction of the myofibrils (systole).
Mechanisms that raise systolic Ca++ increase the developed force, and those that lower Ca++ decrease the developed force. For example, catecholamines increase Ca++ entry into the cell by phosphorylation of the Ca++ channels via a cAMP-dependent protein kinase. Interestingly, when catecholamines enhance myocardial contractile force, they also elicit a limiting action by decreasing the sensitivity of the contractile machinery to Ca++ by phosphorylation of troponin I (see Figure 4-8). An increase in systolic Ca++ is also achieved by increasing extracellular Ca++ or decreasing the Na+ gradient across the sarcolemma.
The sodium gradient can be reduced by increasing intracellular Na+ or decreasing extracellular Na+. Cardiac glycosides increase intracellular Na+ by inhibiting the Na-K pump, which results in an accumulation of Na+ in the cells. The elevated cytosolic Na+ reverses the Na+-Ca++ exchanger so that less Ca++ is removed from the cell. This Ca++ is stored in the SR. A lowered extracellular Na+ results in a reduction in Na+ entry into the cell and hence less exchange of Na+ for Ca++ (see Figure 4-8).
Developed tension is diminished by a reduction in extracellular Ca++, by an increase in the Na+ gradient across the sarcolemma, or by administration of Ca++ blockers that prevent Ca++ from entering the myocardial cell (see Figure 2-15).
CLINICAL BOX
A patient in heart failure with a dilated heart, low cardiac output, fluid retention, high venous pressure, an enlarged liver, and peripheral edema may be treated with a diuretic and drugs that block the neurohumoral axis (sympathetic nervous and renin-angiotensin systems). The diuretic decreases extracellular fluid volume, thereby lessening the volume load (preload) on the heart and reducing venous pressure, liver congestion, and edema. Drugs that block the production (angiotensin-converting enzyme inhibitors) or action (angiotensin receptor antagonists) of angiotensin II reduce afterload, and drugs that block β-adrenergic receptors reduce heart rate and energy expenditure. Drugs that block angiotensin II or β-adrenergic receptors also interfere with the structural remodeling (hypertrophy) of the heart that occurs in patients with heart failure. In some instances, digoxin, a digitalis glycoside that inhibits the Na-K pump, is used. Indirectly, digoxin increases cardiomyocyte intracellular calcium stores via Na+-Ca++ exchange, thereby enhancing contractile force.
At the end of systole, the Ca++ influx ceases and the sarcoplasmic reticulum is no longer stimulated to release Ca++. In fact, the SR avidly takes up Ca++ by means of an ATP-energized Ca++ pump that is regulated by phospholamban. When phospholamban is phosphorylated by cAMP-dependent protein kinase (see Figure 4-8), its inhibition of the Ca++ pump is relieved. Phosphorylation of troponin I inhibits the Ca++ binding of troponin C, permitting tropomyosin to again block the sites for interaction between the actin and myosin filaments, and relaxation (diastole) occurs (see Figure 4-8).
Cardiac contraction and relaxation are both accelerated by catecholamines and adenylyl cyclase activation. The resulting increase in cAMP activates cAMP-dependent protein kinase, which phosphorylates the Ca++ channel in the sarcolemma. This allows a greater influx of Ca++ into the cell and thereby increases contraction. However, it also accelerates relaxation by phosphorylating phospholamban, which enhances Ca++ uptake by the SR and by phosphorylating troponin I, which inhibits the Ca++ binding of troponinC. Thus the phosphorylations by cAMP-dependent protein kinase serve to increase both the speed of contraction and the speed of relaxation.
The Ca++ that enters the cell to initiate contraction must be removed during diastole. The removal is primarily accomplished by the exchange of 3 Na+ for 1 Ca++ (see Figure 4-8). Ca++ is also removed from the cell by a pump that utilizes ATP to transport Ca++ across the sarcolemma (see Figure 4-8).
Mechanics of Cardiac Muscle
The strength of contraction of individual myocardial cells is determined not only by the state of the excitation-contraction coupling processes but also by the initial length of the sarcomeres (see Figure 4-1), which determines the extent that actin-myosin cross-bridges can form and cycle (thus generating force and/or shortening). This length dependence of contraction can be observed in individual cardiac cells, in bundles of cells (as in ventricular strips or papillary muscles), and in the intact ventricles of the whole heart in the living organism. In the whole heart, the length dependence of cardiac contraction is manifest as the Frank-Starling law of the heart, which is a major determinant of cardiac output. In the heart, the blood’s pressure constitutes both a load on the heart that determines the length of the cardiac cells prior to each heart beat (the preload), and a load on the heart experienced as it ejects blood into its outflow tracts after it is electrically activated to contract (the afterload). The preload and afterload experienced by the heart in the intact circulation are determined by systemic factors, such as total peripheral resistance and blood volume, as explained further in this chapter and in Chapter 10.
Preload Determines the Strength of Cardiac Contraction
For an isolated strip of ventricular cardiac muscle or an isolated papillary muscle in an experimental situation (Figure 4-9), preload is the force (load) on the muscle prior (or pre-) to its being activated to contract. The preload applies tension to the muscle and stretches it passively to a new length. In the heart, preload is the stress exerted on the ventricle during diastole and can be represented by the Laplace equation for a thick-walled sphere. Thus muscle can be characterized by a passive length-tension relationship, obtained by measuring length at different preloads. Preload also determines the strength of an active, isometric contraction that begins from a particular length. The muscle may be forced to contract isometrically by the addition of a very large afterload that the muscle will not be able to lift (Figure 4-9). (The further lengthening of the muscle that would be caused by the afterload is prevented with a physical stop.) Then, upon electrical stimulation, the muscle contracts isometrically (i.e., without shortening) and develops the maximum active force of which it is capable, from that initial length. Increasing preload always stretches the muscle further, causing both increased initial length (Figure 4-10A) and, up to a point, greater active force development. The total tension within the muscle at the peak of the contraction is the sum of the passive tension and active tension (Figure 4-10, B). When contractility is increased, as by norepinephrine (see Figure 4-8), the active tension and total tension are greatly increased (Figure 4-10C). The passive tension is largely unaffected when contractility increases, and thus the increase in total tension is due entirely to greater active tension. Conversely, a reduction in contractility, as might be caused by pharmacologic block of L-type Ca++ channels, results in reduced total tension, largely accounted for by decreased active tension development. The fact that active tension generated by cardiac muscle rises steeply with increasing initial muscle length is critical to the performance of the heart, allowing the heart to contract more strongly if it is stretched by a greater volume of blood prior to contraction.
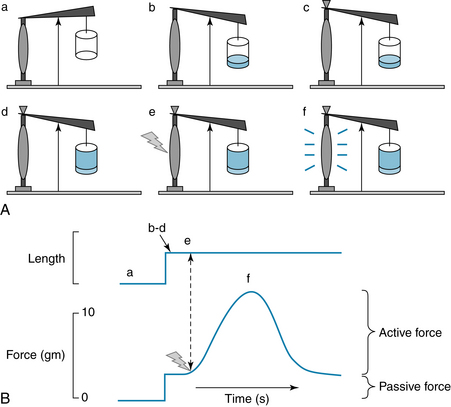
FIGURE 4-9 A simple experiment to determine the effect of preload on the strength of isometric cardiac muscle contraction. A, a: A strip of cardiac muscle, such as an isolated ventricular papillary muscle is attached to a lever and a fixed point. b: The other end of the lever is loaded, stretching the muscle. This load is the preload. c: A stop is placed against the lever, such that no further lengthening of the muscle can occur. d: Another weight is added (the afterload). Because of the stop, the muscle is not lengthened by this load. Only after it would begin to contract would this load exist on the muscle (hence the term afterload). In this case, the afterload is chosen to be so large that the muscle will not be able to lift it, and will therefore be forced to contract isometrically. e: The muscle is stimulated electrically to contract. f: The muscle contracts, generating force, but does not shorten. The contraction is isometric. B, The length of the muscle and the tension developed throughout the experiment in A are shown. The preload is a passive force that lengthens the muscle. When the muscle contracts, active tension is developed, but shortening cannot occur.
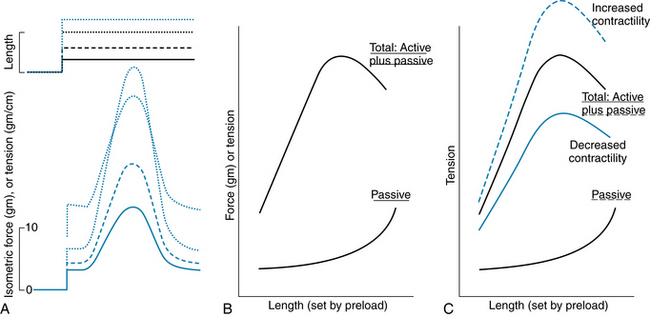
FIGURE 4-10 The effect of preload on passive tension in a strip of cardiac muscle and on the active tension it develops. A, Recordings of muscle length and isometric tension, from experiments like those shown in Figure 4-9. Dashed and dotted lines show the response of the muscle to different preloads; increasing preload results in greater passive tension and greater active tension, until very high preloads, at which point peak active tension begins to decrease from that elicited by smaller preloads. B, Graph of results from experiments like those shown in A. The curve labeled “Passive” represents the passive force in the muscle produced by the preload, and the passive force is plotted as a function of the length of the muscle. Preload sets the initial muscle length, before it is stimulated to contract and produce active tension. The curve labeled “Total: Active plus Passive” represents the peak tension in the muscle during active contraction, as a function of its initial length. C, Increasing contractility, as produced by norepinephrine, causes increased active and total tension at any given initial muscle length. Decreased contractility, as might be caused by pharmacologic block of cardiac voltage–dependent Ca++ channels (see Figure 4-8) causes reduced active and total tension. Passive tension is largely unaffected.
The detailed relationship between sarcomere length and tension (passive and active) has also been examined (Figure 4-11). Cardiac sarcomere length has been determined with electron microscopy in papillary muscles and intact ventricles rapidly fixed during systole (contracted) or diastole (relaxed). The developed force is maximal when cardiac muscle begins its contractions at initial sarcomere length of 2.2 µm. At this length, there is optimal overlap of thick and thin filaments, and a maximal number of possible cross-bridge attachments. Although skeletal and cardiac muscles show somewhat similar length-tension relationships (see Figure 4-11), the two types of muscle are distinctly different with respect to the normal operating range of sarcomere lengths. Cardiac muscle does not normally operate at very short (<1.8 µm) or very long (>2.2 µm) sarcomere lengths. Furthermore, the ascending limb of the cardiac muscle length-tension relation is very steep over the range of 1.8 µm to 2.0 µm, and this steepness cannot be accounted for entirely by more effective myofilament overlap, as it is in skeletal muscle. The active length-tension relation of skeletal muscle (see Figure 4-11) is obtained with constant levels of contractile activation, produced by tetanic stimulation, over the whole range of sarcomere lengths. Cardiac muscle, however, cannot be tetanized, and in cardiac muscle the level of contractile activation increases significantly over the range of 1.8 µm to 2.0 µm sarcomere length, thus accounting for the steep rise in active force. One mechanism, not present to the same extent in skeletal muscle, is that stretch of cardiac cells enhances the affinity of troponin C for Ca++, thus resulting in the binding of a greater amount of Ca++ to troponin C and the formation of a greater number of cross-bridges. The mechanism responsible for this greater affinity of troponin C for Ca++ remains to be determined. One concept is that the thick and thin filaments are brought closer to each other as the diameter of the muscle fiber narrows during stretch, because the cell maintains constant volume. The protein, titin, may help in this process, in that it forms a scaffold to which actin and myosin filaments bind. Finally—another feature different from that of skeletal muscle—the amount of Ca++ released from the SR in cardiac muscle increases with increasing sarcomere length. This is a time-dependent phenomenon, developing slowly over many beats, after the sarcomere length has been increased. Thus, three cellular mechanisms contribute to the length dependence of cardiac muscle contraction from 1.8 µm to 2.2 µm: (1) changes in myofilament overlap, similar to those in skeletal muscle; (2) increased activation as a result of greater chemical affinity of troponin C for Ca++; and (3) increased activation as a result of greater release of Ca++ from the sarcoplasmic reticulum.
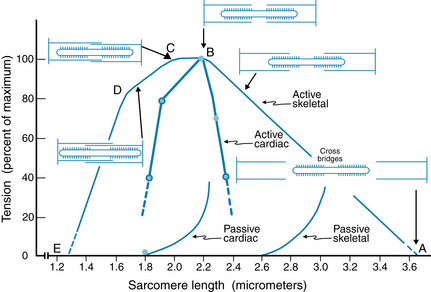
FIGURE 4-11 Sarcomere length-tension relations for cardiac and skeletal muscle. Active tension (total tension − passive tension) is plotted as a function of initial sarcomere length. The diagrams of the myofilaments show the extent of overlap between thick and thin filaments at five specific sarcomere lengths in skeletal muscle. In skeletal muscle, maximum tension occurs at sarcomere lengths between 2.0 and 2.2 µm (between points B and C). Tension decreases between 2.2 and 3.65 µm of sarcomere length (between points A and B) because there is a decrease in the overlap between thick and thin filaments (between points C and D). In cardiac muscle, active tension falls steeply with sarcomere lengths greater or less than 2.2 µm. The increase in passive tension occurs at much shorter sarcomere lengths in cardiac muscle than in skeletal muscle.
(Redrawn from Gordon AM, Huxley AF, Julian FJ: Tension development in highly stretched vertebrate muscle fibres. J Physiol 184:143, 1966; and Braunwald E, Ross J Jr: Mechanisms of contraction of the normal and failing heart, Boston, 1976, Little Brown.)
Developed force of cardiac muscle is less than the maximal value when the sarcomeres are stretched beyond the optimal length, because the myofilaments overlap less and hence reduce cross-bridge cycling. At very short sarcomere lengths, the thin filaments overlap each other in the central region of the sarcomere. This ‘double overlap’ of the thin filaments diminishes contractile force.
In summary, the passive and active length-tension relations of cardiac muscle (see Figure 4-10B) arise from the mechanisms discussed above and, in the whole heart, are reflected in the relationship between volume of the heart and its actively developed pressure, as discussed later.
Afterload Determines the Velocity of Cardiac Muscle Shortening
A strip of cardiac muscle, and the intact heart, also experiences an additional load (force) against which it must contract, after it is activated (Figure 4-12). This load, known as afterload, determines the velocity with which the muscle can shorten. In the intact heart, this situation represents left ventricular ejection into the aorta. During ejection, the afterload is represented by the impedance due to aortic and intraventricular pressures, which are virtually equal to each other. Thus, the afterload is the stress applied to the ventricle during ejection of blood.
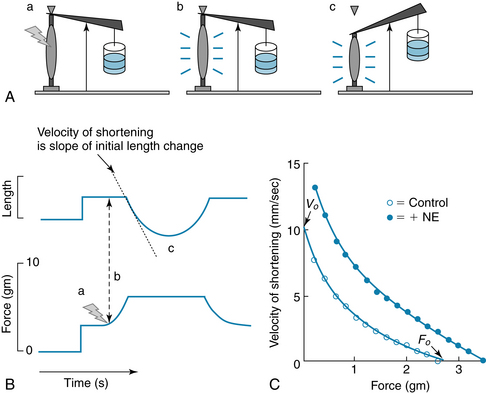
FIGURE 4-12 The velocity of shortening of cardiac muscle depends on the afterload. Velocity of shortening is increased by norepinephrine (NE). A and B, Experiment to measure the effect of afterload on shortening velocity. a: A preload, stop, and small afterload are added. b: The muscle is stimulated to contract. It contracts isometrically at first, until it generates enough force to lift the afterload. c: When the muscle generates sufficient force to lift the afterload, muscle shortening can occur. The velocity of shortening is the slope of the initial length change. C, Force-velocity (F/V) curve. Velocity of shortening decreases monotonically as the afterload is increased, up to a level, F0, that the muscle cannot lift. The velocity of shortening is increased at all forces by increasing contractility, as through the action of norepinephrine (NE).
Experimentally, the effects of afterload may be examined in experiments (see Figure 4-12) similar to those for preload. If the afterload is such that the muscle can generate enough force to lift the load, then the muscle contracts isometrically until it generates enough force to lift the afterload, after which it can begin to shorten. The velocity of shortening is maximal (V0) for no afterload and decreases monotonically to zero when the force (load) is too great for the muscle to lift at all (i.e., an isometric contraction). Norepinephrine increases the velocity of shortening at every level of afterload.
The Sequential Contraction and Relaxation of the Atria and Ventricles Constitute the Cardiac Cycle
The sequence of electrical changes, pressures, and mechanical events within the heart and great vessels leading to and away from the heart during each beat is known as the cardiac cycle. Knowledge of the cardiac cycle is critical to understanding the physiologic regulation of cardiac output and for the clinician, for whom it is necessary in assessing cardiac function. During unchanging physiologic conditions, the events of the cardiac cycle are the same on each beat, but the cycle is often represented as beginning midway through diastole, as in Figure 4-13. In general, the cardiac cycle consists of a period of cardiac muscle relaxation, known as diastole, and a period of contraction, known as systole. Contraction of the ventricles is referred to as ventricular systole. The cardiac output (CO) is equal to the product of heart rate (HR) and stroke volume (SV), which is the output of the left ventricle on each stroke, or cycle. The SV of the left ventricle, which is ejected into the aorta during the ejection phase of the cardiac cycle, is simply the difference between the end-diastolic volume (EDV) and the end-systolic volume (ESV). Stroke volume into the aorta is determined by strength and velocity of the left ventricular contraction. Thus, myocardial contractility (i.e., excitation-contraction coupling processes), preload (sarcomere length), and afterload are important determinants of stroke volume, because these factors determine the strength and velocity of the myocardial contraction.
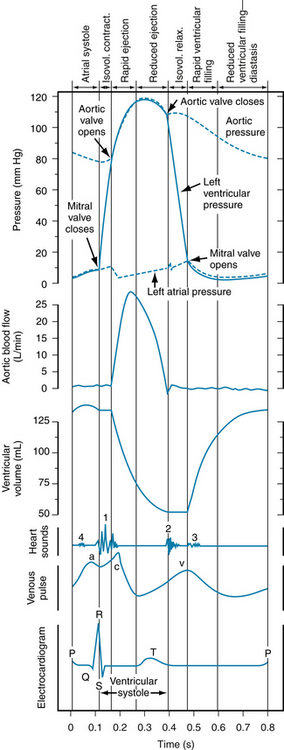
FIGURE 4-13 Left atrial, aortic, and left ventricular pressure pulses correlated in time with aortic flow, ventricular volume, heart sounds, venous pulse, and the electrocardiogram for a complete cardiac cycle in a human subject. Isovol., isovolemic; relax., relaxation.
Ventricular Systole
Isovolumic Contraction
The onset of ventricular contraction coincides with the peak of the R wave of the electrocardiogram and the initial vibration of the first heart sound. It is indicated on the ventricular pressure curve as the earliest rise in ventricular pressure after atrial contraction. The phase between the start of ventricular systole and the opening of the semilunar valves (when ventricular pressure rises abruptly) is termed isovolumic contraction because ventricular volume is constant during this brief period (see Figure 4-13).
The increment in ventricular pressure during isovolumic contraction is transmitted across the closed valves. Isovolumic contraction has also been referred to as “isometric contraction.” However, some fibers shorten and others lengthen, as evidenced by changes in ventricular shape; it is, therefore, not a true isometric contraction.
Ejection
Opening of the semilunar valves marks the onset of the ejection phase, which may be subdivided into an earlier, shorter phase (rapid ejection) and a later, longer phase (reduced ejection). The rapid ejection phase is distinguished from the reduced ejection phase by (1) the sharp rise in ventricular and aortic pressures that terminate at the peak ventricular and aortic pressures; (2) a more abrupt decrease in ventricular volume; and (3) a greater aortic blood flow (see Figure 4-13). The sharp decrease in the left atrial pressure curve at the onset of ejection results from the descent of the base of the heart and stretch of the atria. During the reduced ejection period, blood flow from the aorta to the periphery exceeds ventricular output, and therefore aortic pressure declines. Throughout ventricular systole, the blood returning to the atria produces a progressive increase in atrial pressure. Note that during approximately the first third of the ejection period, left ventricular pressure slightly exceeds aortic pressure and flow accelerates (continues to increase), whereas during the last two thirds of ventricular ejection, the reverse holds true. This reversal of the ventricular-aortic pressure gradient in the presence of continued flow of blood from the left ventricle to the aorta (caused by the momentum of the forward blood flow) is the result of the storage of potential energy in the stretched arterial walls, which produces a deceleration of blood flow into the aorta (see Chapter 7). The peak of the flow curve coincides in time with the point at which the left ventricular pressure curve intersects the aortic pressure curve during ejection. Thereafter, flow decelerates (continues to decrease) because the pressure gradient has been reversed.
With right ventricular ejection, there is shortening of the free wall of the right ventricle (descent of the tricuspid valve ring) and lateral compression of the chamber. However, with left ventricular ejection, there is very little shortening of the base-to-apex axis, and ejection is accomplished chiefly by compression of the left ventricular chamber.
The effect of ventricular systole on left ventricular diameter is shown in an echocardiogram in Figure 4-14. During ventricular systole, the septum and the free wall of the left ventricle become thicker and move closer to each other.
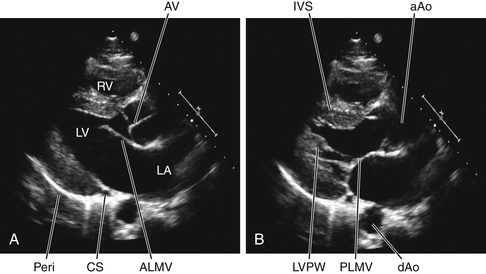
FIGURE 4-14 Two-dimensional echocardiographic images of a normal human heart (young adult male) taken from the parasternal long-axis view. A, During diastole, the left atrium (LA) communicates freely with the cavity of the left ventricle (LV). The anterior leaflet (ALMV) and the posterior leaflet (PLMV, shown in B) of the mitral valve (MV) are open; the leaflets of the aortic valve (AV) are closed. B, During systole, the left ventricular (LV) interventricular septum (IVS), and posterolateral wall (LVPW) wall thicken; the LV cavity diminishes in volume. The LV cavity is open to the ascending aorta (aAo); the AV is open and the MV is closed. Also evident in the echocardiograms are the descending aorta (dAo), the coronary sinus (CS), the right ventricle cavity (RV), and the RV free wall. The pericardium (Peri) is evident as a very bright structure; a reverberation artifact is present.
(Courtesy of Dr. Peter Schulman.).
The venous pulse curve shown in Figure 4-13 has been taken from a jugular vein. The a wave is caused by atrial contraction, the c wave by the impact of the adjacent common carotid artery and to some extent by transmission of a pressure wave produced by the abrupt closure of the tricuspid valve in early ventricular systole, and the v wave by the pressure of blood returning from the peripheral vessels and the abrupt opening of the tricuspid valve. Note that except for the c wave, the venous pulse closely follows the atrial pressure curve.
At the end of ejection, a volume of blood approximately equal to that ejected during systole remains in the ventricular cavities. This residual volume (end-systolic volume) is fairly constant in normal hearts but is smaller with increased heart rate or reduced outflow resistance and larger when the opposite conditions prevail.
In addition to serving as a small adjustable blood reservoir, the residual volume to a limited degree can permit transient disparities between the outputs of the two ventricles.
CLINICAL BOX
In heart failure, the preload can be increased substantially because of the poor ventricular ejection and an increased blood volume caused by fluid retention. In essential hypertension, the high peripheral resistance augments the afterload by decreasing the peripheral runoff of the blood from the arterial system.
Ventricular Diastole
Isovolumic Relaxation
Aortic valve closure produces the incisura on the descending limb of the aortic pressure curve and the second heart sound (with some vibrations evident on the atrial pressure curve) and marks the end of ventricular systole. The phase between the closure of the semilunar valves and the opening of the AV valves, termed isovolumic relaxation, is characterized by a precipitous fall in ventricular pressure without a change in ventricular volume.
Rapid Filling Phase
The major part of the ventricular filling occurs immediately on opening of the AV valves, when the blood that had returned to the atria during the previous ventricular systole is abruptly released into the relaxing ventricles. This period of ventricular filling is called the rapid filling phase. In Figure 4-13 the onset of the rapid filling phase is indicated by the decrease in left ventricular pressure below left atrial pressure, resulting in the opening of the mitral valve. The rapid flow of blood from atria to relaxing ventricles produces a decrease in atrial and ventricular pressures and a sharp increase in ventricular volume.
Diastasis
The rapid filling phase is followed by a phase of slow filling called diastasis. During diastasis, blood returning from the periphery flows into the right ventricle and blood from the lungs into the left ventricle. This small, slow addition to ventricular filling is indicated by a gradual rise in atrial, ventricular, and venous pressures and in ventricular volume (see Figure 4-13).
Atrial Systole
The onset of atrial systole occurs soon after the beginning of the P wave of the electrocardiogram (atrial depolarization), and the transfer of blood from atrium to ventricle made by the peristalsis-like wave of atrial contraction completes the period of ventricular filling. Atrial systole is responsible for the small increases in atrial, ventricular, and venous (a wave) pressures as well as in ventricular volume shown in Figure 4-13. Throughout ventricular diastole, atrial pressure barely exceeds ventricular pressure, indicating a low-resistance pathway across the open AV valves during ventricular filling.
Atrial contraction can force blood in both directions because there are no valves at the junctions of the venae cavae and right atrium or at the junctions of the pulmonary veins and left atrium. Actually, little blood is pumped back into the venous tributaries during the brief atrial contraction, mainly because of the inertia of the inflowing blood.
Atrial contraction is not essential for ventricular filling, as can be observed in atrial fibrillation or complete heart block. However, its contribution is governed to a great extent by the heart rate and the structure of the AV valves. At slow heart rates, filling practically ceases toward the end of diastasis, and atrial contraction contributes little additional filling. During tachycardia, diastasis is abbreviated, and the atrial contribution can become substantial, especially if it occurs immediately after the rapid filling phase, when the AV pressure gradient is maximal. Should tachycardia become so great as to encroach on the rapid filling phase, atrial contraction becomes very important in rapidly propelling blood to fill the ventricle during this brief period of the cardiac cycle. Of course, if the period of ventricular relaxation is so brief that filling is seriously impaired, even atrial contraction cannot prevent inadequate ventricular filling. The consequent reduction in cardiac output may result in syncope. Obviously, if atrial contraction occurs simultaneously with ventricular contraction, no atrial contribution to ventricular filling can occur.
Echocardiography Reveals Movement of the Ventricular Walls and of the Valves
Echocardiography consists of sending short pulses of high-frequency sound waves (ultrasound) through the chest tissues and the heart and recording the echoes reflected from the various structures. The timing and pattern of the reflected waves provide such information as the diameter of the heart, the ventricular wall thickness, and the magnitude and direction of the movements of various components of the heart. In Figure 4-14 the echocardiograph depicts the left heart in diastole (see Figure 4-14A) and in systole (see Figure 4-14B). During diastole, the mitral valve leaflets are open, allowing the cavity of the left atrium to be continuous with the cavity of the left ventricle. The anterior leaflet of the mitral valve is directed toward the interventricular septum, and the posterior leaflet is positioned along the inferolateral wall of the left ventricle. The open mitral valve is a funnel for the transfer of blood from atrium to ventricle. The aortic valve is closed. During systole, the aortic valve is open and the mitral valve is closed (see Figure 4-14B). The left ventricular wall and the interventricular septum are thickened as the ventricle contracts to eject blood into the aorta. The cavity of the left ventricle is diminished in volume.
The Two Major Heart Sounds Are Produced Mainly by Closure of the Cardiac Valves
Four sounds are usually produced by the heart, but only two are ordinarily audible through a stethoscope. With electronic amplification, the less intense sounds can be detected and recorded graphically as a phonocardiogram. This means of registering heart sounds that may be inaudible to the human ear helps to delineate the precise timing of the heart sounds relative to other events in the cardiac cycle.
A normal phonocardiogram taken simultaneously with an electrocardiogram is illustrated in Figure 4-15. The first heart sound is initiated at the onset of ventricular systole and consists of a series of vibrations of mixed, unrelated, low frequencies (a noise). It is the loudest and longest of the heart sounds, has a crescendo-decrescendo quality, and is heard best over the apical region of the heart. The tricuspid valve sounds are heard best in the fifth intercostal space just to the left of the sternum; the mitral sounds are heard best in the fifth intercostal space at the cardiac apex.
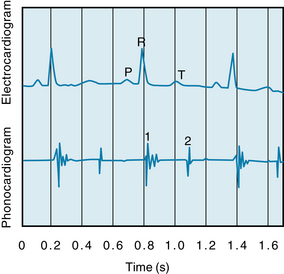
FIGURE 4-15 Phonocardiogram illustrating the first (1) and second (2) heart sounds and their relationship to the P, R, and T waves of the electrocardiogram.
The first heart sound is chiefly caused by oscillation of blood in the ventricular chambers and vibration of the chamber walls. The vibrations are engendered in part by the abrupt rise of ventricular pressure with acceleration of blood back toward the atria, but primarily by sudden tension and recoil of the AV valves and adjacent structures with deceleration of the blood resulting from closure of the AV valves. The vibrations of the ventricles and the contained blood are transmitted through surrounding tissues and reach the chest wall, where they may be heard or recorded. The intensity of the first sound is a function of the force of ventricular contraction and of the distance between the valve leaflets. The first sound is loudest when the leaflets are farthest apart, as occurs when the interval between atrial and ventricular systoles is prolonged (AV valve leaflets float apart) or when ventricular systole immediately follows atrial systole.
The second heart sound, which occurs with closure of the semilunar valves, is composed of higher-frequency vibrations (higher pitch), is of shorter duration and lower intensity, and has a more snapping quality than the first heart sound. The second sound is caused by abrupt closure of the semilunar valves, which initiates oscillations of the columns of blood and the tensed vessel walls by the stretch and recoil of the closed valve. The second sound caused by closure of the pulmonic valve is heard best in the second thoracic interspace just to the left of the sternum, whereas that caused by closure of the aortic valve is heard best in the same intercostal space but to the right of the sternum. Conditions that bring about a more rapid closure of the semilunar valves, such as rises in pulmonary artery or aortic pressure (e.g., pulmonary or systemic hypertension), increase the intensity of the second heart sound. In adults the aortic valve sound is usually louder than the pulmonic, but in cases of pulmonary hypertension the reverse is often true.
Note that the first sound, which starts just beyond the peak of the R wave, is composed of irregular waves and is of greater intensity and duration than the second sound, which appears at the end of the T wave. The third and fourth heart sounds do not appear on this record.
The third heart sound, which is sometimes heard in children with thin chest walls or in patients with left ventricular failure, consists of a few low-intensity, low-frequency vibrations heard best in the region of the apex. It occurs in early diastole and is believed to be the result of vibrations of the ventricular walls caused by abrupt cessation of ventricular distention and deceleration of blood entering the ventricles.
CLINICAL BOX
In overloaded hearts, as in congestive heart failure, when the ventricular volume is very large and the ventricular walls are stretched to the point at which distensibility abruptly decreases, a third heart sound may be heard. A third heart sound in patients with heart disease is usually a grave sign.
A fourth, or atrial, sound, consisting of a few low-frequency oscillations, is occasionally heard in normal individuals. It is caused by oscillation of blood and cardiac chambers created by atrial contraction.
Differences in the time of vibration of the two AV valves or two semilunar valves can sometimes be detected with the stethoscope because the onset and termination of right and left ventricular systoles are not precisely synchronous. Such asynchrony of valve vibrations, which may sometimes indicate abnormal cardiac function, is manifested as a split sound over the apex of the heart for the AV valves and over the base of the heart for the semilunar valves.
CLINICAL BOX
Mitral insufficiency and mitral stenosis produce, respectively, systolic and diastolic murmurs heard best at the cardiac apex, whereas aortic insufficiency and aortic stenosis produce, respectively, diastolic and systolic murmurs heard best in the second intercostal space just to the right of the sternum. The heart sounds may also be altered by deformities of the valves. Murmurs may be produced, and the character of a murmur serves as an important guide in the diagnosis of valvular disease. When the third and fourth (atrial) sounds are accentuated, as occurs in certain abnormal conditions, triplets of sounds may occur, resembling the sound of a galloping horse. These gallop rhythms are essentially of two types: presystolic gallop caused by accentuation of the atrial sound, and protodiastolic gallop caused by accentuation of the third heart sound.
The Pressure-Volume Relationships in the Intact Heart
Examination of the relationship between pressure and volume in the heart during each cardiac cycle is useful, because this relationship reflects the properties and conditions of the myocardial cells, and also because this relationship provides a hemodynamic characterization of the heart. The effects of changes in preload, afterload, and cardiac contractility on stroke volume are readily revealed, in terms of the resulting changes in stroke volume. Pressure-volume relationships (Figures 4-16 and 4-17) can be recorded in humans and can be useful for evaluating cardiac function and other cardiovascular parameters. The relationship between left ventricular pressure and left ventricular volume throughout one entire cardiac cycle is known as the left ventricular pressure-volume loop (P-V loop; Figure 4-17), because the graph forms a complete loop, representing one complete cardiac cycle, which (typically) ends at the same pressures and volumes at which it began. Often, a theoretical passive pressure-volume relationship (labeled “Diastole” in Figure 4-16) and an active pressure-volume relationship (labeled “Systole” in Figure 4-16) are plotted on the same graph. These relationships reflect the passive and active length-tension relationships of strips of cardiac muscle (see Figure 4-10B), as they would be reflected in the whole heart. During each cardiac cycle, the heart operates within the limits imposed by these relationships
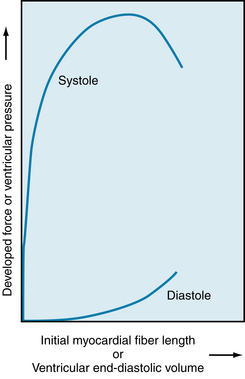
FIGURE 4-16 Relationship of myocardial resting fiber length (sarcomere length) or end-diastolic volume to developed force or peak systolic ventricular pressure during ventricular contraction in the intact dog heart.
(Redrawn from Patterson SW, Piper H, Starling EH: The regulation of the heart beat. J Physiol 48:465, 1914.)
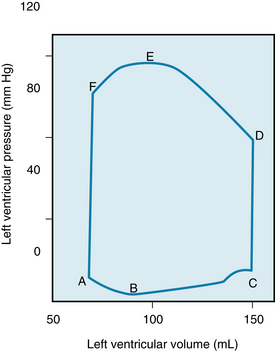
FIGURE 4-17 Pressure-volume loop of the left ventricle for a single cardiac cycle (A through F). See text for explanation.
Passive or Diastolic Pressure-Volume Relationship
The passive length-tension relationship of isolated cardiac muscle determines the relationship between pressure and volume in the intact heart (see Figure 4-16) during diastole. For example, during diastole in the left ventricle, the pressure in the left ventricle increases, stretching the left ventricle (and thus increasing sarcomere length). The resulting relationship between pressure and volume reflects the length-tension relationship of the left ventricular cells. Thus, in general, the fiber length-force relationship for the papillary muscle also holds true for fibers in the intact heart. This relationship may be expressed graphically, as in Figure 4-16, by substitution of ventricular systolic pressure for force and of end-diastolic ventricular volume for myocardial resting fiber (and hence sarcomere) length. The lower curve in Figure 4-16 represents the pressure increment produced by each volume increment when the heart is in diastole.
Note that the pressure-volume curve in diastole is initially quite flat (compliant), indicating that large increases in volume can be accommodated with only small rises in pressure. Importantly, systolic pressure development is considerable at the lower filling pressures. However, the ventricle becomes much less distensible with greater filling, as evidenced by the sharp rise of the diastolic curve at large intraventricular volumes. In the normal intact heart, peak force may be attained at a filling pressure of 12 mm Hg. At this intraventricular diastolic pressure, which is about the upper limit observed in the normal heart, the sarcomere length is 2.2 µm. In the isolated heart, however, developed force peaks at filling pressures as high as 30 mm Hg; at even higher diastolic pressures (>50 mm Hg), the sarcomere length is no greater than 2.6 µm. This resistance to stretch of the myocardium at high filling pressures probably resides in the noncontractile constituents of the tissue (connective tissue) and serves as a safety factor protecting against overloading of the heart in diastole. Usually, ventricular diastolic pressure is about 0 to 7 mm Hg, and the average diastolic sarcomere length is about 2.2 µm. Thus the normal heart operates on the ascending portion of the Frank-Starling curve.
CLINICAL BOX
An increase in myocardial contractility, as produced by catecholamines or by digitalis in a patient with a depressed heart, may decrease residual volume and increase stroke volume and ejection fraction. With a severely hypodynamic and dilated heart, as in heart failure, the residual volume can become many times greater than the stroke volume.
Active or End-Systolic Pressure-Volume Relationship
The upper curve in Figure 4-16 represents the theoretical peak pressure that could be developed by the ventricle during systole at each degree of filling. It arises from the Frank-Starling relationship of initial myocardial fiber length (or initial volume) to peak isovolumic force (or pressure) development by the ventricle, as illustrated previously in Figure 4-10. Experimentally, such a relationship could be obtained by closing off the aorta, and thereby forcing the left ventricle of an isolated heart to contract isovolumically. In this case, the ventricle would develop the maximum pressure of which it was capable, given its initial volume.
Pressure and Volume during the Cardiac Cycle: The P-V Loop
The changes in left ventricular pressure and volume throughout the cardiac cycle are shown in Figure 4-17 as a loop that lies between the passive or diastolic pressure-volume relationship and the theoretical end-systolic pressure-volume relationship. The element of time is not considered in this pressure-volume loop. Diastolic filling starts at A and terminates at C, when the mitral valve closes. With isovolumic contraction (C to D), there is a steep rise in pressure and no change in ventricular volume. At D, the aortic valve opens, and during the first phase of ejection (rapid ejection, D to E), the large reduction in volume is associated with a continued but less steep increase in ventricular pressure than the increase that occurred during isovolumic contraction. This volume reduction is followed by reduced ejection (E to F) and a small decrease in ventricular pressure. The aortic valve closes at F, and this event is followed by isovolumic relaxation (F to A), characterized by a sharp drop in pressure and no change in volume. The mitral valve opens at A to complete one cardiac cycle.
Preload and Afterload during the Cardiac Cycle
For the intact left ventricle, the preload is experienced at the end of diastole, when ventricular filling is complete. Thus, preload and end-diastolic volume are closely related. To be specific, the left-ventricular end-diastolic pressure is considered the preload of the left ventricle (point C on the P-V loop, Figure 4-17).
At lower end-diastolic volumes, increments in filling pressure during diastole elicit a greater systolic pressure during the subsequent contraction. Systolic pressure increases until a maximal systolic pressure is reached at the optimal preload (see Figure 4-16). If diastolic filling continues beyond this point, no further rise in developed pressure occurs. At very high filling pressures, peak pressure development in systole is reduced. Afterload of the left ventricle is represented by the aortic pressure and left ventricular pressure during the ejection phase of the cardiac cycle. The afterload of the left ventricle is first experienced when the aortic valve opens. At this time, the left ventricle has generated enough pressure to force the aortic valve open and end the isovolumic contraction phase. The cardiac fibers may then shorten, and ejection begins. This is exactly analogous to the case with isolated strips of muscle, when the muscle generates enough force to lift the afterload, ending its isometric contraction phase and beginning to shorten. The load on the left ventricle during ejection is not constant however. The afterload of the left ventricle changes during ejection (D to F, Figure 4-17). Increased afterload will decrease the velocity with which the left ventricle can contract or shorten. In summary, preload of the left ventricle will affect the initial cardiac sarcomere length and thus the strength of the subsequent left ventricular contraction. Afterload will affect the velocity of the subsequent contraction. The amount of blood the left ventricle can eject, the stroke volume, will thus be affected by both preload and afterload.
Preload and afterload depend on certain characteristics of the vascular system and the behavior of the heart. With respect to the vasculature, the degree of venomotor tone and level of peripheral resistance influence preload and afterload. With respect to the heart, a change in rate or stroke volume can also alter preload and afterload. Hence cardiac and vascular factors interact to affect preload and afterload (see Chapter 10 for a full explanation).
Contractility
Contractility represents the performance of the heart at a given preload and afterload, and it depends on the state of the excitation-contraction coupling processes within the cells (see Figure 4-8). Contractility can be augmented by certain drugs, such as norepinephrine and digitalis, and by an increase in contraction frequency (tachycardia). The increase in contractility (positive inotropic effect) produced by any of these interventions is reflected by incremental increases in developed force and velocity of contraction. A reasonable index of myocardial contractility in the contracting heart can be obtained from the contour of ventricular pressure curves (Figure 4-18). These curves show the pressure in the left ventricle during one cardiac cycle.
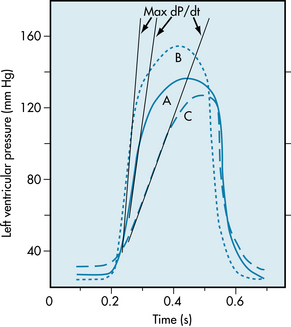
FIGURE 4-18 Left ventricular pressure curves with tangents drawn to the steepest portions of the ascending limbs to indicate maximal (Max) dP/dt values. A, Control; B, hyperdynamic heart, as with norepinephrine administration; C, hypodynamic heart, as in cardiac failure.
CLINICAL BOX
In certain disease states, the AV valves may be markedly narrowed (stenotic). Under such conditions, atrial contraction plays a much more important role in ventricular filling than it does in the normal heart.
A hypodynamic heart is characterized by an elevated end-diastolic pressure, a slowly rising ventricular pressure, and a somewhat reduced ejection phase (curve C, Figure 4-18). A hyperdynamic heart (such as a heart stimulated by norepinephrine) shows reduced end-diastolic pressure, fast-rising ventricular pressure, and a brief ejection phase (curve B, Figure 4-18). The slope of the ascending limb of the ventricular pressure curve indicates the maximal rate of force development by the ventricle (maximal rate of pressure change with time, maximal dP/dt, as illustrated by the tangents to the steepest portion of the ascending limbs of the ventricular pressure curves in Figure 4-18). The slope is maximal during the isovolumic phase of systole. At any given degree of ventricular filling, the slope provides an index of the initial contraction velocity, and hence of contractility.
CLINICAL BOX
In the clinical determination of cardiac output, O2 consumption is computed from measurements of the volume and O2 content of expired air over a given interval of time. Because the O2 concentration of peripheral arterial blood is essentially identical to that in the pulmonary veins, [O2]pv is determined by measurement of a sample of peripheral arterial blood withdrawn by needle puncture. Pulmonary arterial blood actually represents mixed systemic venous blood. Samples for O2 analysis are obtained from the pulmonary artery or right ventricle through a catheter.
Similarly, the contractile state of the myocardium can be obtained from the maximum velocity of blood flow in the ascending aorta during the cardiac cycle (i.e., the initial slope of the aortic flow curve; see Figure 4-13). Also, the ejection fraction, the ratio of the volume of blood ejected from the left ventricle per beat (stroke volume) to the volume of blood in the left ventricle at the end of diastole (end-diastolic volume), is widely used clinically as an index of contractility. Other measurements (or combinations of measurements) that reflect the magnitude or velocity of the ventricular contraction have been used to assess the contractile state of the cardiac muscle.
The Fick Principle is used to Determine Cardiac Output
In 1870 the German physiologist Adolph Fick contrived the first method for measuring cardiac output in intact animals and people. The basis for this method, called the Fick principle, is simply an application of the law of conservation of mass. It is derived from the fact that the quantity of O2 delivered to the pulmonary capillaries via the pulmonary artery plus the quantity of O2 that enters the pulmonary capillaries from the alveoli must equal the quantity of O2 that is carried away by the pulmonary veins.
This principle is depicted schematically in Figure 4-19. The rate, q1, of O2 delivery to the lungs equals the O2 concentration in the pulmonary arterial blood, [O2]pa, times the pulmonary arterial blood flow, Q, which equals the cardiac output; that is,
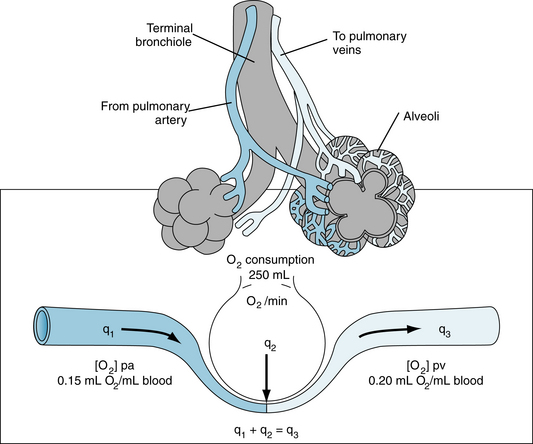
FIGURE 4-19 Schema illustrates the Fick principle for measuring cardiac output. The change in color from pulmonary artery (pa) to pulmonary vein (pv) represents the change in color of the blood as venous blood becomes fully oxygenated. q1, q2, q3, rates of O2 delivery.
 (1)
(1)Let q2 be the net rate of O2 uptake by the pulmonary capillaries from the alveoli. At equilibrium, q2 equals the O2 consumption of the body. The rate, q3, at which O2 is carried away by the pulmonary venous blood, [O2]pv, is multiplied by the total pulmonary venous flow, which is virtually equal to the pulmonary arterial blood flow, Q; that is,
 (2)
(2) (3)
(3) (4)
(4) (5)
(5)Equation 5 is the statement of Fick’s principle.
An example of calculation of cardiac output in a normal, resting adult is illustrated in Figure 4-19. With an O2 consumption of 250 mL/min, an arterial (pulmonary venous) O2 content of 0.20 mL O2/mL blood, and a mixed venous (pulmonary arterial) O2 content of 0.15 mL O2/mL blood, the cardiac output would equal 250 ÷ (0.20 −0.15) = 5000 mL/min.
The Fick principle is also used for estimating the O2 consumption of organs in situ, when blood flow and the O2 contents of the arterial and venous blood can be determined. Algebraic rearrangement reveals that O2 consumption equals the blood flow times the arteriovenous O2 concentration difference. For example, if the blood flow through one kidney is 700 mL/min, arterial O2 content is 0.20 mL O2/mL blood, and renal venous O2 content is 0.18 mL O2/mL blood, the rate of O2 consumption by that kidney must be 700 (0.20 − 0.18) = 14 mL O2/min.
The Indicator Dilution Technique is a Useful Method for Measuring Cardiac Output
The indicator dilution technique for measuring cardiac output is also based on the law of conservation of mass and is illustrated by the model in Figure 4-20. Let a liquid flow through a tube at a rate of Q mL/s, and let q mg of dye be injected as a bolus into the stream at point A. Let mixing occur at some point downstream. If a small sample of liquid is continually withdrawn from point B farther downstream and passed through a densitometer, a curve of the dye concentration, c, may be recorded as a function of time, t, as shown in the lower half of Figure 4-20.
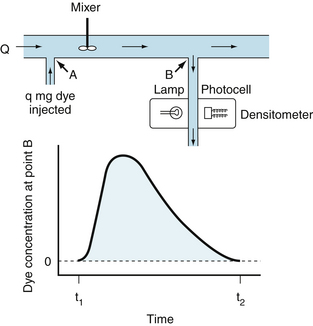
FIGURE 4-20 Indicator dilution technique for measuring cardiac output. In this model (upper section), in which there is no recirculation, q mg of dye is injected instantaneously at point A into a stream flowing at Q mL/min. A mixed sample of the fluid flowing past point B is withdrawn at a constant rate through a densitometer. The resulting dye concentration curve at point B has the configuration shown in the lower section of the figure.
If no dye is lost between points A and B, the amount of dye, q, passing point B between times t1 and t2 will be
 (6)
(6)where  is the mean concentration of dye. The value of may be computed by dividing the area of the dye concentration by the duration (t2 − t1) of that curve; that is
 (7)
(7)Substituting this value of into equation 6 and solving for Q yields
 (8)
(8)Thus flow may be measured by dividing the amount of indicator injected upstream by the area under the downstream concentration curve.
This technique had been widely used to estimate cardiac output in humans. A measured quantity of some indicator (a dye or isotope that remains within the circulation) is injected rapidly into a large central vein or into the right side of the heart through a catheter. Arterial blood is continuously drawn through a detector (densitometer or isotope rate counter), and a curve of indicator concentration is recorded as a function of time.
The most popular indicator dilution technique is thermodilution. The indicator is cold saline. The temperature and volume of the saline are measured accurately before injection. A flexible catheter is introduced into a peripheral vein and advanced so that the tip lies in the pulmonary artery. A small thermistor at the catheter tip records the changes in temperature. The opening in the catheter lies a few inches proximal to the tip. When the tip is in the pulmonary artery, the opening lies in or near the right atrium. The cold saline is injected rapidly into the right atrium through the catheter. The resultant change in temperature downstream is recorded by the thermistor in the pulmonary artery.
The thermodilution technique has the following advantages: (1) an arterial puncture is not necessary; (2) the small volumes of saline used in each determination are innocuous, allowing repeated determinations to be made; and (3) recirculation is negligible. Temperature equilibration takes place as the cooled blood flows through the pulmonary and systemic capillary beds, before it flows by the thermistor in the pulmonary artery the second time.
Metabolism of ATP and its Relation to Mechanical Function
The chemical energy that fuels cardiac contractile work and relaxation is derived from ATP hydrolysis (Figure 4-21). The healthy heart has a relatively constant level of ATP (~5 µmol/g wet weight) despite an extremely high rate of ATP hydrolysis (≈0.3 µmol g−1 second−1). The tissue content of ATP is low relative to the rate of breakdown and production, with a complete turnover of the myocardial ATP content approximately every 12 seconds (s) in the heart at rest. The hydrolysis of ATP provides energy for contractile work (actin-myosin interaction and cell shortening), pumping Ca++ back into the sarcoplasmic reticulum at the end of systole, and maintaining normal ion gradients (low Na+ and high K+ in the cell).
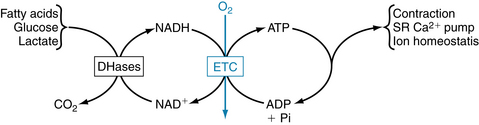
FIGURE 4-21 Linkages between cardiac cell functions, adenosine triphosphate (ATP) hydrolysis, oxidative phosphorylation, and NADH (reduced form of nicotinamide adenosine dinucleotide) generation by dehydrogenases (DHases) in metabolism. ADP, adenosine diphosphate; ETC, electron transport chain; NAD+, nicotinamide adenosine dinucleotide; SR, sarcoplasmic reticulum.
Approximately two thirds of the ATP hydrolyzed by the heart is used to fuel contractile work, with the remaining third used for ion pumps and “housekeeping” functions like synthesis of proteins and nucleic acids. The sarcoplasmic reticulum Ca++-ATPase is the primary ion pump consuming ATP. This process occurs during the end of systole, when cytosolic Ca++ is rapidly sequestered into the sarcoplasmic reticulum to initiate diastolic relaxation (see Figure 4-8). In the healthy heart the rate of ATP hydrolysis (breakdown) is exquisitely matched to the rate of ATP resynthesis. There is no significant change in the concentrations of ATP or ADP even with the onset of heavy exercise. The primary means for ATP resynthesis is via oxidative phosphorylation in mitochondria (>98%) with a small amount from glycolysis (<2%). Oxidative phosphorylation requires O2 and dihydrogen (H2). The O2 is delivered to the myocardium and consumed in the mitochondria at complex IV to make H2O, whereas the H2 is from the metabolism of carbon fuels (mainly fatty acids, glucose, and lactate) and the generation of NADH (reduced form of nicotinamide adenine dinucleotide) and FADH2 (reduced form of flavin adenine dinucleotide). ATP is formed from ADP and inorganic phosphate when H+ is consumed by complex V (Figure 4-22). Importantly, the rates of ATP formation and breakdown depend on an adequate delivery of O2 to the myocardium, which is a function of myocardial blood flow and oxygenation of arterial blood. An increase in ATP breakdown in the myocardium, such as occurs when heart rate, systolic blood pressure, and contractility are increased (as during exercise), requires an increase in O2 delivery to the myocardium so that the mitochondria can generate sufficient ATP by oxidative phosphorylation to meet the demand for ATP. Thus, the rate of myocardial O2 consumption is tightly linked to the work rate (or power) of the myocardium.
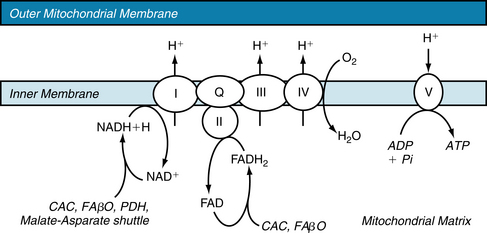
FIGURE 4-22 The electron transport chain. ADP, adenosine diphosphate; ATP, adenosine triphosphate; CAC, citric acid cycle; FAβO, fatty acid β-oxidation; FAD, flavin adenine dinucleotide; FADH2, reduced form of FAD; I through IV, Complexes I through IV; NAD+, nicotinamide adenosine dinucleotide; NADH, reduced form of NAD; PDH, pyruvate dehydrogenase; Pi, inorganic phosphate; Q, ubiquinone; V, Complex V, or ATP Synthase.
There is also ATP resynthesis from the breakdown of creatine phosphate by the creatine phosphokinase (CPK) reaction:

This is a very fast reaction that acts to “buffer” the ATP concentration when the rate of ATP hydrolysis is suddenly increased, as with the onset of exercise, or when there is an abrupt decrease in oxidative phosphorylation, such as occurs with myocardial ischemia.
There is a stoichiometric link among the rate of oxidation of carbon fuels, NADH and FADH2 reduction, flux through the electron transport chain, O2 consumption, oxidative phosphorylation, ATP hydrolysis, actin-myosin interaction, and external contractile power produced by the heart (Figures 4-21 and 4-23). Thus an increase in contractile power results in a concomitant increase in all of the components in the system. The ATP concentration in the heart remains constant, even when the heart is stressed. Cardiac muscle has the highest mitochondrial content of any cell type (≈30% of cell volume is occupied by mitochondria). The citric acid or Krebs cycle provides reducing equivalents (NADH and FADH2) for oxidative phosphorylation, resulting in the condensation of ADP and inorganic phosphate to regenerate ATP. The citric acid cycle is fueled by acetyl–coenzyme A (CoA) formed primarily from oxidation of pyruvate and fatty acids. Cardiomyocytes oxidize fatty acids derived from both the plasma and the breakdown of intracellular triacylglycerol stores, whereas pyruvate is derived from either lactate dehydrogenase or glycolysis. The rates of these metabolic pathways are tightly coupled to the rate of contractile work, and conversely, contractile work is coupled to the supply of O2 and the rate of oxidative phosphorylation. After an overnight fast, fatty acids are the major oxidative fuel for the heart (60%-100% of the O2 consumption), with a lesser contribution from lactate and glucose (0%-20% from each). The regulation of myocardial metabolism is complex in that it is linked to arterial substrate and hormone levels, coronary flow, inotropic state, and the nutritional status of the tissue.
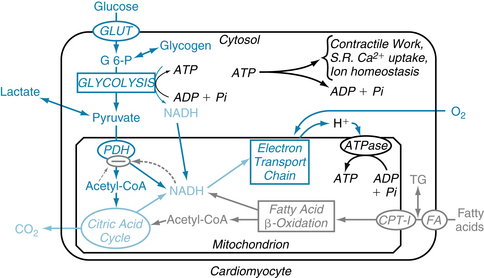
FIGURE 4-23 Regulation of the oxidation of glucose and lactate by pyruvate dehydrogenase (PDH). The activity of PDH is inhibited by product inhibition from acetyl-CoA (coenzyme A) and NADH (reduced form of nicotinamide adenosine dinucleotide) (dashed arrows). Also, PDH activity is inhibited when phosphorylated by PDH kinase and activated when dephosphorylated by PDH phosphatase. ADP, adenosine diphosphate; ATP, adenosine triphosphate; CPT-I, carnitine palmitoyltransferase; G-6-P, glucose-6-phosphate; GLUT, glucose transporter; Pi, inorganic phosphate; S.R., sarcoplasmic reticulum.
Fatty Acid Metabolism
The heart readily extracts free fatty acids from the plasma and either oxidizes it or converts it to triglyceride stores. The rate of uptake of free fatty acids depends mainly on their concentration in the plasma and the concentration of the fatty acid transporter (FAT) in the plasma membrane. Thus fatty acid uptake is increased when fatty acid levels are increased, as with fasting or diabetes and decreased when they are low, such as following ingestion of a meal.
Esterified fatty acids are transferred across the mitochondrial membrane into the mitochondrial matrix by the carnitine–fatty acyl transport system (see Figure 4-24). The first one in the sequence, carnitine palmitoyltransferase I (CPT I), catalyzes the formation of long-chain acylcarnitine from long-chain acyl-CoA in the compartment between the inner and outer mitochondrial membranes. The second enzyme, carnitine:acylcarnitine translocase, transports long-chain acylcarnitine across the inner mitochondrial membrane, whereas the last one in the sequence, CPT II, regenerates long-chain acyl-CoA in the mitochondrial matrix. Of the three enzymes involved in the transmitochondrial membrane transport, CPT I serves the key regulatory role. CPT I transfers the fatty acid moiety from acyl-CoA to carnitine to form long-chain acylcarnitine, which is then transported to the mitochondrion. CPT I activity is inhibited by malonyl-CoA. Once in the mitochondrial matrix, long-chain acyl-CoA passes through the β-oxidation to produce acetyl-CoA.
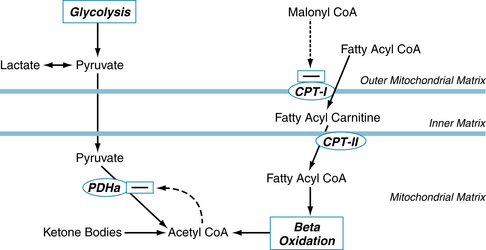
FIGURE 4-24 The pathways and regulatory points of myocardial substrate metabolism. Regulation of fatty acid oxidation, and fatty acid inhibition of flux through PDHa. CoA, coenzyme A; CPT, carnitine palmitoyltransferase; PDH, pyruvate dehydrogenase; PDHa, active dephosphorylated PDH.
Acetyl-CoA can also be formed from the oxidation of ketone bodies (acetoacetate and β-hydroxybutyrate), which are taken up by the myocardium from the plasma (see Figure 4-24). Normally the heart does not use a significant number of ketone bodies as a fuel simply because their plasma concentration is very low. In poorly controlled diabetes or during starvation, the concentration of ketone bodies increases dramatically and they become a significant source of fuel for the heart.
Carbohydrate Metabolism
Regulation of Glucose Uptake
The three primary sources of carbohydrate substrate for the myocardium are extracellular glucose, glycogen stores, and extracellular lactate. The uptake of extracellular glucose is regulated by the transmembrane glucose gradient and the concentration and activity of glucose transporters in the plasma membrane. Two isoforms of the glucose transporter (GLUT) family have been identified in the myocardium, GLUT 1 and GLUT 4; the two are located both in the sarcolemmal membrane and in intracellular microsomal vesicles. GLUT 4 is the predominant isoform in the heart. Insulin and ischemia result in a translocation of GLUT 4 and GLUT 1 from the intracellular site into the plasma membrane, resulting in an increase in the membrane capacitance for glucose transport. The transmembrane glucose gradient is determined by the interstitial glucose and intracellular free glucose concentrations. The interstitial glucose level is a function of the arterial glucose concentration and blood flow; thus interstitial glucose levels and the transmembrane glucose gradient are decreased during ischemia and are increased by hyperglycemia. Upon entering the cell, free glucose is rapidly phosphorylated by hexokinase to form glucose-6-phosphate (G-6-P), which is impermeable to the cell membrane.
Regulation of Glycolysis
Given a constant supply of G-6-P, the primary regulators of glycolytic rate are the activity of phosphofructokinase (PFK), and the ability to form NADH (Figure 4-25). Nicotinamide adenine dinucleotide (NAD+) is reduced to NADH by the conversion of glyceraldehyde 3-phosphate (GAP) to 3-phosphoglycerol phosphate by the enzyme GAP dehydrogenase (GAP-DH). Cytosolic NADH can be converted back to NAD+ through the conversion of pyruvate to lactate by lactate dehydrogenase (LDH), or the reducing equivalents can be shuttled into the mitochondria via the malate-aspartate shuttle. The rate of glycolysis in the myocardium is increased during exercise; however, the NADH and pyruvate are oxidized in mitochondria to CO2, H2O, and NAD+. Glycolysis is also increased when myocardial blood flow is below normal, a condition called myocardial ischemia. In this situation, mitochondrial oxidation of pyruvate and NADH is insufficient, and they are converted to lactate and NAD+ in the cytosol.
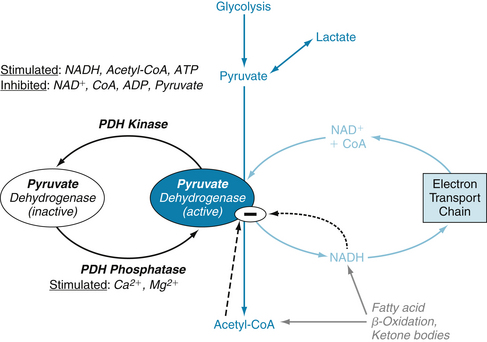
FIGURE 4-25 Regulation of the oxidation of glucose and lactate by pyruvate dehydrogenase (PDH). The activity of PDH is inhibited by product inhibition from acetyl-CoA (coenzyme A) and NADH (reduced form of nicotinamide adenosine dinucleotide), and by phosphorylation by PDH kinase and dephosphorylation by PDH phosphatase. Inhibition of myocardial fatty acid oxidation reduces inhibition on PDH and thus increases pyruvate oxidation. ADP, adenosine diphosphate; ATP, adenosine triphosphate; NAD+, nicotinamide adenosine dinucleotide.
Regulation of Pyruvate and Lactate Oxidation
Lactate is a major source of pyruvate formation under well-perfused conditions in vivo. Under some conditions, lactate uptake can exceed glycolysis as a source of pyruvate. Lactate that is extracted by the heart is rapidly oxidized by lactate dehydrogenase, decarboxylated by pyruvate dehydrogenase (PDH) and oxidized to CO2 in the citric acid cycle (see Figure 4-23).
Pyruvate decarboxylation is the key irreversible step in carbohydrate oxidation and is catalyzed by PDH (see Figure 4-25). PDH is a multienzyme complex located in the mitochondrial matrix. The activity of PDH is regulated by a variety of mechanisms; in particular, it is inactivated when phosphorylated by a specific PDH kinase and is activated when dephosphorylated by a specific PDH phosphatase (see Figure 4-25). The rate of pyruvate oxidation depends on the degree of phosphorylation of PDH and also on the mitochondrial concentrations of its substrates, and products as these control flux through the active dephosphorylated form of the enzyme. The activity of PDH phosphatase is increased by Ca++ and Mg++, whereas PDH kinase is inhibited by pyruvate and ADP and activated by increases in acetyl-CoA/CoA and NADH/NAD+ (see Figure 4-25). Pyruvate oxidation and the activity of PDH in the heart are decreased by elevated rates of fatty acid oxidation caused by increased plasma levels of free fatty acid, and are enhanced by suppression of free fatty acid oxidation induced by a decrease in plasma free fatty acid levels or by inhibition of CPT I. Positive inotropic agents increase the amount of active enzyme by a Ca++-dependent activation of PDH phosphatase, whereas PDH kinase activity is increased and the enzyme is more inactivated when carbohydrate reserves are low as in starvation or diabetes.
Interrelation Between Fatty Acid and Carbohydrate Metabolism
High rates of fatty acid oxidation feed back to inhibit uptake of glucose and lactate. In humans, there is a strong negative correlation between the concentration of free fatty acids in the arterial plasma and the extraction of glucose and lactate by the heart. Fatty acid oxidation inhibits the oxidation of lactate and glucose by a variety of mechanisms. The phenomenon of fatty acid inhibition of glucose uptake and oxidation is called the glucose–fatty acid cycle. First, high rates of fatty acid oxidation result in an increase in citrate content in the mitochondria, which then leads to an higher citrate content in the cytosol and inhibition of PFK activity and decreased rate of glycolysis. High rates of fatty acid oxidation also inhibit PDH activity. Raised mitochondrial levels of acetyl-CoA and NADH activate PDH kinase that then phosphorylates and inhibits PDH (see Figure 4-25). Also, it has been shown in isolated heart mitochondria that elevated rates of fatty acid oxidation inhibit flux through PDH for any given PDH phosphorylation state. Pharmacologic inhibition of CPT I inhibits fatty acyl-CoA transport into the mitochondria and its subsequent oxidation to acetyl-CoA and results in greater pyruvate oxidation by lowering acetyl-CoA levels and relieving tonic inhibition of PDH.
Effects of Plasma Substrate and Insulin Levels
Under most conditions, plasma free fatty acid levels are a primary regulator of myocardial glucose and lactate oxidation. High plasma free fatty acid levels (>0.8 mM) inhibit both the uptake and oxidation of glucose and lactate in human myocardium, whereas pharmacologic lowering of plasma free fatty acid levels (<0.3 mM) results in an increase in myocardial glucose and lactate uptake. This increase is primarily related to the release of product inhibition on PDH and glycolysis as free fatty acid concentration decreases in the perfusate. Arterial lactate concentration is not a key regulator of lactate uptake and oxidation under normal resting conditions in humans, when levels are rather constant at about 0.6 to 1.2 mM. However, during and after exercise, arterial lactate levels increase and arterial lactate concentration becomes the major regulator of lactate oxidation. Plasma glucose concentration is not a major regulator of glucose uptake and oxidation under well-perfused conditions, in which plasma insulin and free fatty acid are held constant.
Plasma insulin levels regulate directly myocardial carbohydrate metabolism by stimulating glucose transport into cardiomyocytes and indirectly by inhibiting lipolysis in adipocytes and thus lowering plasma free fatty acid levels. The direct action of insulin on glucose uptake occurs by increasing the incorporation of GLUT 4 and GLUT 1 into the sarcolemmal membrane. Insulin also results in stimulation of hexokinase and glycogen synthetase activities, resulting in increased glucose phosphorylation and glycogen synthesis; the mechanism for this effect in the heart is unclear but could be at least partially due to the increase in glucose and G-6-P that occurs secondary to insulin-stimulated glucose transport. In addition to these direct effects, insulin indirectly increases flux through glycolysis and PDH by decreasing plasma free fatty acid levels and thereby releasing fatty acid inhibition, causing an increase in glucose and lactate uptake and oxidation.
What is the significance of insulin in terms of substrate use in the human heart? With fasting, insulin levels are reduced, resulting in less insulin inhibition of fatty acid release from adipocytes, an increase in plasma free fatty acid concentration (>0.8 mM), a high rate of fatty acid oxidation by the heart, and inhibition of glucose and lactate uptake and oxidation by the heart. In contrast, after a meal, insulin levels increase dramatically and the free fatty acid levels fall, resulting in greater glucose and lactate uptake and oxidation by the heart. Diabetes is similar to fasting in that there are frequently periods of low insulin and high fatty acid concentrations in the plasma and low rates of glucose and lactate uptake and oxidation.
Cardiac O2 Consumption and the Link between Ventricular Function and Cardiac Metabolism
The rates of ATP hydrolysis and synthesis under nonischemic conditions are coupled to the mechanical power output of the left ventricle (see Figure 4-21). The rate of citric acid cycle flux and O2 consumption by the myocardium ( O2) varies proportionately with ventricular power output because almost all of the ATP synthesis occurs by oxidative phosphorylation. The O2 is the amount of O2 consumed by the myocardium each minute and is the difference between the amount of O2 that flows into the myocardium and the amount that flows out.
Estimation of cardiac work is important in clinical practice because cardiac work determines the O2 needs of the heart. Cardiac work has external and internal components. External mechanical work, W, (force times distance) is that done by the heart on moving the blood within it and can be written as
 (9)
(9)The first term on the right side of Equation 9 is P-V work; that is, each small increment of volume that is pumped, dV, is multiplied by the associated pressure, P, and the products, PdV, are integrated over the duration of the stroke volume, t2 − t1. The second term is kinetic work due to the speed at which the blood moves, where ρ is the density of blood and v is its velocity. At resting levels of cardiac output, the kinetic energy component is less than 5% in the left ventricle. However, at high cardiac outputs, as in strenuous exercise, the kinetic energy component can account for up to 50% of total cardiac work in the right ventricle. This follows because work in the right ventricle is about 15% of that in the left ventricle inasmuch as the pulmonary vascular resistance is much less than systemic vascular resistance.
The internal work of the heart can be written as
 (10)
(10)where α is proportionality constant that converts Tdt into units of work, that converts Tdt into units of energy. T is tension, and dt is time. Clinically, O2 and left ventricular power are difficult to measure; however, they are both closely related to the rate-pressure product, which is the heart rate times the systolic arterial blood pressure, Psys. Such measurements are important because internal work is a large determinant of myocardial O2 need.
The magnitude and duration of the left ventricular pressure and wall tension, as well as heart rate and contractility, are related to left ventricular O2 consumption (O2). An alternative approach to evaluate cardiac work and its relation to has been developed. With this method, P-V loops (see Figure 4-17) are examined under conditions with varied preload and afterload; contractility is maintained constant. Integration of the area subtended by the end-systolic and end-diastolic P-V relations and by the systolic component of the P-V loop trajectory (Figure 4-26A, shaded area) yields a product, the P-V area (mm Hg × mL). This includes the external work (EW) and potential energy (PE) underlying cardiac function and represents the total mechanical energy of the ventricle. The relation between O2 consumption and the P-V area is measured experimentally under varied preload and afterload conditions. When O2 consumption (O2, mL O2/beat/g left ventricle) is plotted against the P-V area (mm Hg × mL/g left ventricle), as shown in Figure 4-26B, a positive linear relation is obtained. The intercept of the O2-P-V area relation is the O2 for unloaded contractions. The area below the intercept (P-V area–independent O2) comprises the basal metabolic O2 consumption and the O2 consumed for excitation-contraction coupling. The area above the intercept gives the P-V area–dependent O2; this is the O2 consumed by the contractile proteins during cross-bridge cycling. The inverse of the slope gives the thermodynamic efficiency of the utilization of O2 for the total mechanical energy of contraction. In the human heart, this amounts to 0.35 or 35%. The efficiency of O2 utilization does not change with agents that increase contractility, but the O2 consumed for excitation-contraction coupling increases. Thus, during exercise, the slope does not change but the linear relation is shifted upward, an indication of the extra O2 needed to sustain the increased cardiac output.
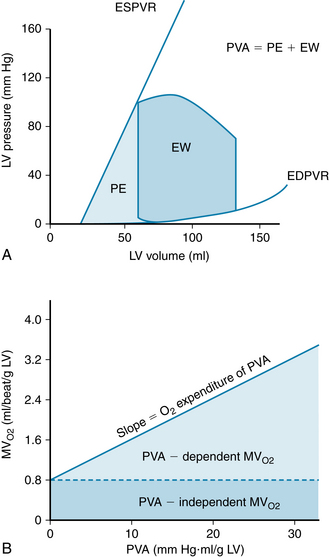
FIGURE 4-26 A, Pressure-volume loop from left ventricle (LV) with areas corresponding to external work (EW) and mechanical potential energy (PE) integrated and summed to yield pressure-volume area (PVA). The end-systolic pressure-volume relation (ESPVR) is an index of contractility; EDPVR is the end-diastolic pressure-volume relation. B, Plot of myocardial O2 consumption (MVO2; mL/beat per gram LV) as a function of the PVA (mm Hg • mL per gram LV). The linear regression slope gives the O2 consumption dependent on PVA. The area below the intercept with the ordinate indicates the O2 consumption that is independent of PVA.
(Redrawn from Suga H: Ventricular energetics. Physiol Rev 70:247, 1990).
Simultaneously halving the aortic pressure and doubling the cardiac output, or vice versa, results in the same value for cardiac work. However, the O2 requirements are greater for any given amount of cardiac work when a major proportion of the work is pressure work, as opposed to volume work. An increase in cardiac output at a constant aortic pressure (volume work) is accomplished with only a small increase in left ventricular O2, whereas increased arterial pressure at constant cardiac output (pressure work) is accompanied by a large increase in O2.
At rest, the O2 of the two ventricles is about 9 mL O2/100 g/min. The healthy human heart can increase the O2, coronary blood flow, and left ventricular external power approximately fourfold to fivefold over resting conditions to maximal exercise (see also Chapter 13). In other words, in the absence of coronary artery disease, there is a “reserve” of approximately 400% in the capacity of the myocardium to increase its blood flow, rates of citric acid cycle flux, oxidative phosphorylation, O2, and rate of external power generation. The power generation by the left ventricle is the product of the heart rate and the area contained within the PV loop. This “loop area” is the amount of external work generated by the left ventricle by a single heart beat.
Physical exercise requires a greater cardiac output to deliver O2 to the working skeletal muscles. This is accomplished by increasing both heart rate and stroke volume (see Chapter 13; Figure 13-3). An increase in the amount of cardiac work is generated with each heartbeat, as illustrated in Figure 4-27. Physical exercise causes an increase in myocardial contractility, preload, and afterload; thus the LV P-V loop area increases because of a greater end-diastolic volume, a greater peak systolic pressure, and a decrease in end-systolic volume. The power generation (power = work/time) of the left ventricle increases because of the greater loop area and heart rate.
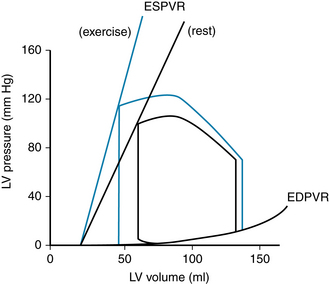
FIGURE 4-27 Pressure-volume loop indicating the pressure-volume area (PVA) of the left ventricle (LV) at rest (area bounded by black lines) and during exercise (area bounded by blue lines). The end-systolic pressure-volume relation (ESPVR) slope is increased because contractility is greater. The increased area during exercise shows the increased PVA or work done by the left ventricle; this necessitates an increased O2 consumption. EDPVR, end-diastolic pressure-volume relation.
(Redrawn from Suga H: Ventricular energetics. Physiol Rev 70:247, 1990).
Summary
 Although the myocardium is made up of individual cells with discrete membrane boundaries, the cardiac myocytes that constitute the ventricles contract almost in unison, as do those of the atria. The myocardium functions as a syncytium with an all-or-none response to excitation. Cell-to-cell conduction occurs through gap junctions that connect the cytoplasm of adjacent cells.
An increase in myocardial fiber length, as occurs with an augmented ventricular filling during diastole (preload), produces a more forceful ventricular contraction. This relation between initial fiber length and strength of contraction is known as the Frank-Starling law of the heart.
On excitation, voltage-gated Ca++ channels open to admit extracellular Ca++ into the cell. This Ca++ influx triggers the release of Ca++ from the sarcoplasmic reticulum. The elevated intracellular Ca++ promotes cross-bridge cycling between thick and thin filaments that causes contraction of the cell.
Relaxation is accomplished via restoration of the resting cytosolic Ca++ level by pumping it back into the sarcoplasmic reticulum and by exchanging it for extracellular Na+ across the sarcolemma.
Velocity and force (afterload) of contraction are functions of the intracellular concentration of free Ca++. Afterload and velocity are inversely related, so that with no load, velocity is maximal. In an isometric contraction, in which no external shortening occurs, total load is maximal and velocity is zero.
In ventricular contraction, the preload is the stress (pressure) in the ventricle, prior to contraction, that stretches the myocardial cells. The afterload is the aortic pressure against which the left ventricle ejects the blood.
Contractility is an expression of cardiac performance at a given preload and afterload. Contractility is increased mainly by interventions that raise intracellular Ca++ and is decreased by interventions that lower intracellular Ca++.
Simultaneous recording of left atrial, left ventricular, and aortic pressures, ventricular volume; heart sounds, and the electrocardiogram graphically portray the sequence of related electrical and cardiodynamic events throughout a cardiac cycle. The first heart sound is caused mainly by abrupt closure of the AV valves; the second heart sound is caused by abrupt closure of the semilunar valves.
Cardiac output can be determined, according to the Fick principle, by measuring the O2 consumption of the body,  O2, and the O2 content of arterial, [O2]a, and mixed venous, [O2]v, blood. Cardiac output = O2/([O2]a − [O2]v). It can also be measured by dye dilution or thermodilution techniques. The greater the cardiac output, the greater is the dilution of the injected dye or cold saline by the arterial blood.
The total mechanical energy of the left ventricle can be obtained from the sum of the area inscribed by the P-V loop and the potential energy derived from the systolic component of the P-V loop trajectory. When O2 is plotted against the P-V area, a linear relation is obtained. The P-V area–independent O2 is a measure of the O2 used for excitation-contraction coupling and for basal metabolism. The P-V area–dependent O2 is the O2 consumed during cross-bridge cycling.
Bers D.M. Excitation-Contraction Coupling and Cardiac Contractile Force, ed 2. Boston: Kluwer Academic, 2001.
Blaustein M.P., Lederer W.J. Sodium/calcium exchange: Its physiological implications. Physiol Rev. 1999;79:763.
de Tombe P.P. Cardiac myofilaments: Mechanics and regulation. J Biomech. 2003;36:721.
Gibbs C.L. Cardiac energetics: sense and nonsense. Clin Exp Pharmacol Physiol. 2003;30:598.
Gibbs C.L., Loiselle D.S. Cardiac basal metabolism. Jap J Physiol. 2001;51:399.
Katz A.M. Physiology of the Heart, ed 5. Philadelphia: Wolters Kluwer/Lippincott Williams & Wilkins Health, 2011.
Lorenz J.N., Kranias E.G. Regulatory effects of phospholamban on cardiac function in intact mice. Am J Physiol. 1997;273:H2826.
Niggli E. Ca++ sparks in cardiac muscle: Is there life without them? News Physiol Sci. 1999;14:129.
Shannon T.R., Bers D.M. Integrated Ca2+ management in cardiac myocytes. Ann N Y Acad Sci. 2004;1015:28.
Soeller C., Cannell M.B. Analysing cardiac excitation-contraction coupling with mathematical models of local control. Prog Biophys Mol Biol. 2004;85:141.
Suga H. Ventricular energetics. Physiol Rev. 1990;70:247.
Verdonck F., Mubagwa K., Sipido K.R. [Na+] in the subsarcolemmal “fuzzy” space and modulation of [Ca2+]i and contraction in cardiac myocytes. Cell Calcium. 2004;35:603.
Wier W.G., Balke C.W. Ca++ release mechanisms, Ca++ sparks, and local control of excitation-contraction coupling in normal heart muscle. Circ Res. 1999;85:770.
CASE 4-1
History
A 60-year-old woman entered the hospital complaining of shortness of breath, fatigue, and swelling of her ankles and lower legs. She had had these symptoms for about 3 years but refused medical treatment until they became severe. As a child she had rheumatic fever and experienced a murmur, which was diagnosed as mitral stenosis. Physical examination revealed a dyspneic, slightly cyanotic woman with ankle and pretibial edema, distended neck veins, an enlarged tender liver, ascites, and rales at the lung bases. The electrocardiogram showed atrial fibrillation and right axis deviation. A chest x-ray showed an enlarged heart and shadows at the lung bases that were compatible with pulmonary edema. A cardiac workup showed a low cardiac output. After a week of treatment for the congestive heart failure, the patient’s symptoms abated and she was sent home with medication therapy.
Questions
1. Auscultation of the heart revealed a:
2. Which of the following is observed in atrial fibrillation?
3. Which of the following therapeutic measures would help this patient?
4. Which of the following findings would be true for this patient?
5. The patient’s whole body oxygen consumption was 300 mL/min and the pulmonary artery and the brachial artery blood oxygen content were 8 mL/dL and 18 mL/dL, respectively. What was the patient’s cardiac output?