Electroencephalography for the Sleep Specialist
An understanding of the technical aspects of electroencephalography (EEG) and recognition of basic normal and abnormal EEG patterns in wakefulness and sleep are essential skills for a polysomnographer. EEG records the difference in electrical potentials between two electrodes placed over the scalp. This scalp EEG activity results from extracerebral current flow caused by summated excitatory postsynaptic potentials (EPSPs) and inhibitory postsynaptic potentials (IPSPs). Rhythmical oscillations of the thalamocortical neuronal projections cause synchronous synaptic EPSPs and IPSPs over areas of the cortex. The scalp EEG recording voltages are attenuated by the skull and intervening tissues and reflect about one tenth of the voltage recorded over the cortical surface.
Method of Electroencephalographic Recording
Electrical signals are transmitted by the electrodes and conducting gel through electrode wires, which connect the electrodes and the jack box of the polysomnography (PSG) equipment. Different types of electrodes are available, but for recording EEG the best electrodes to use are gold cup electrodes with holes in the center and the silver–silver chloride electrodes. Silver–silver chloride electrodes need repeated chloriding for proper maintenance. Electrode paste or conducting gel is used to secure the electrodes. Positive and negative charges are generated between the scalp and recording electrode as a result of ionic dissociation. The electrode-electrolyte interface is the most critical link in the PSG machine, because most artifacts originate at this site; careful preparation is therefore very important. The impedance in a pair of electrodes should be measured by an impedance meter and should not be greater than 5000 ohms. High impedance impairs the ability of the electrical signal to reach the amplifier and interferes with the capacity of the amplifier to eliminate environmental noise, thus increasing artifacts. All electrode wires terminate in a pin, called a jack, that is plugged into the electrode box. All the wires from the head are gathered into a ponytail in back of the head and then secured by tying them together. A wrap around the scalp secures the electrodes and the wires. The arrangement is therefore as follows: electrodes from the surface of the scalp are connected by electrode wires into the jacks, which are numbered, and then the wires from the jack box are connected through a shielded conductor cable to the electrode montage selector containing rows of switches in pairs corresponding to the inputs of the amplifier.
The placement of the electrodes is determined by the 10-20 electrode placement system that is recommended by the International Federation of Societies for EEG and Clinical Neurophysiology and was published by Jasper in 1958. The 10-20 system is based on definable anatomical landmarks (Fig. 3.1). The system consists of letters denoting the parts of the brain underneath the area of the scalp and numbers denoting specific locations. The odd numbers refer to the left side of the head, and the even numbers refer to the right side. The technician should be familiar with the measurement technique for placement of the electrodes according to the 10-20 international system. Important landmarks for measuring include the inion, the nasion, and the right and left preauricular points. The distance from the nasion to inion along the midline through the vertex should be measured. FPz in the midline is 10% above the nasion of the total distance between the inion and nasion. The electrodes marked FP1 and FP2 are located laterally 10% above the nasion of the total distance between the inion and nasion measured along the temporal regions through the preauricular points. Oz denotes an electrode placed at a distance of 10% above the inion of the total distance between the nasion and inion. T3 and T4 electrodes are placed in a location 10% above the preauricular points of the total distance between the two preauricular points. The rest of the electrodes are located at a distance of 20% measured from inion to nasion anteroposteriorly or laterally through the ears as well as transversely between the ears. The montage refers to an arrangement of two electrodes (derivations). Both bipolar montage (connection of the electrodes between two relatively active sites over the scalp) and referential montage (connection of the electrodes between an active and relatively inactive site, e.g., M1, M2, Cz, Pz; see Fig. 2.1) are recommended. The nomenclature was recently changed to rename T3, T4, T5, and T6 to T7, T8, P7, and P8, respectively, in a modified 10-20 electrode placement system.
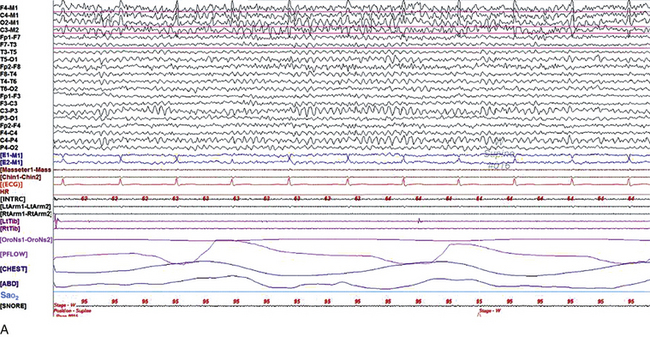
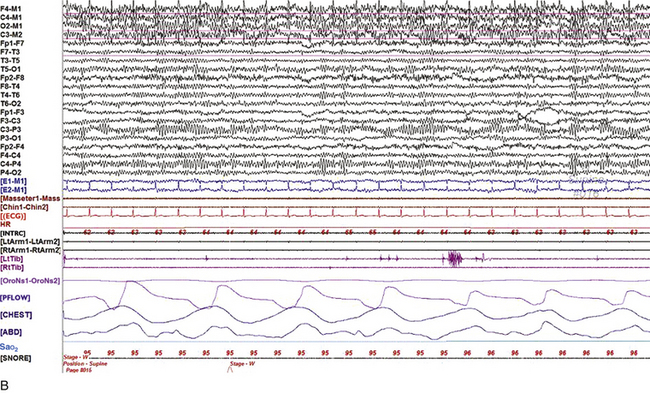
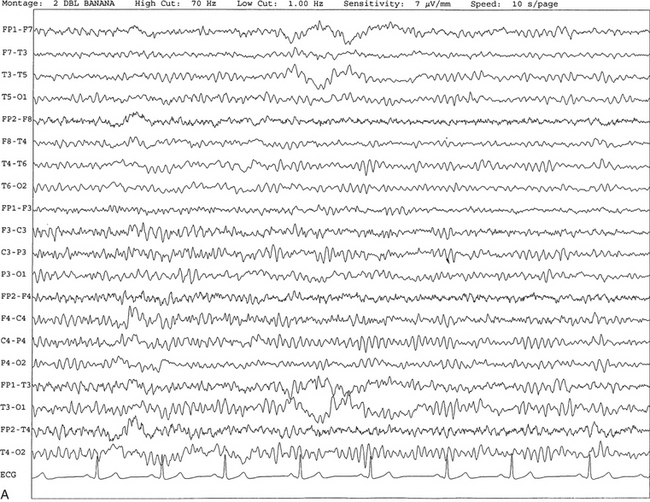
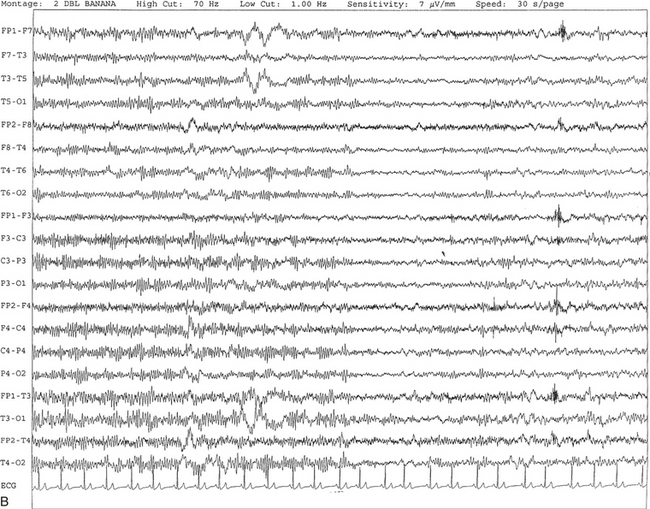
FIGURE 2.1 A, A 10-second epoch from the polysomnogram of a 32-year-old man referred to the sleep laboratory for possible obstructive sleep apnea. He has a history of epilepsy, hence an extended electroencephalogram (EEG) (“seizure”) montage was requested. Normal awake EEG pattern characterized by symmetrical, sinusoidal posterior dominant alpha rhythm at 9 to 10 Hz is noted. The top four channels are referential channels connected to the left mastoid. The next 16 electrodes are bipolar channels arranged in a double banana montage as per the international 10-20 electrode placement system. B, Same subject data as in A viewed at a 30-second epoch. E1-M1 and E2-M1, Electro-oculogram (EOG) channels; Masseter1-Masseter2,Chin1-Chin2, masseter and submental electromyogram (EMG); ECG; electrocardiogram; HR, heart rate; INTRC, intercostal EMG; LtArm1-LtArm2, RtArm1-RtArm2, left and right biceps EMG; LtTib, RtTib, left and right tibialis anterior EMG; OroNs1-OroNs2 oronasal airflow; PFLOW, nasal pressure transducer; CHEST and ABD, effort belts; Sao2, arterial oxygen saturation by finger oximetry. Also included is a snore channel. ECG artifact is noted in the referential leads and EOG leads.
The 2007 American Academy of Sleep Medicine manual recommends three channels; this results in significant limitations (see Chapter 1). Most importantly, such a limited montage would result in the inability to capture focal epileptiform activity arising from the temporal lobes, the most common location for such discharges, as well as missing focal slowing from the hemisphere not being recorded. In our own laboratory we use between four and eight EEG channels, including temporal leads from both hemispheres (see Table 1.2); this increases the yield of capturing focal or diffuse slow waves or epileptiform activities over recording with two to four channels. Many patients are referred to the sleep laboratory with a diagnosis of possible nocturnal seizures. In these cases an extended EEG montage (Fig. 2.1; see Table 1.3), covering the bilateral temporal and parasagittal regions and including both bipolar and referential channels, is recommended. A full complement of electrodes and special electrode placements (e.g., Tl and T2 electrodes) should be used. Simultaneous video recording (video-PSG study) for correlation of EEG activities with the actual behavior of the patient is crucial. In computerized PSG recordings (digital PSG recordings), which are currently performed in most laboratories, it is easy to change the recording speed from the standard 10 mm/sec of the usual sleep recording to 30 mm/sec of the standard EEG recording for proper identification of the epileptiform discharges.
Normal Waking and Sleep Electroencephalographic Rhythms in Adults
The dominant rhythm in adults during wakefulness is the alpha rhythm, consisting of 8 to 13 Hz activity distributed synchronously and symmetrically over the parietooccipital regions (see Fig. 2.1). The frequency of the rhythm between the two hemispheres should not vary by more than 1 Hz, and the amplitude should not vary by more than 50%. This alpha rhythm is best seen during quiet wakefulness with eyes closed and is significantly attenuated by eye opening or mental concentration. A small percentage of normal adults show no alpha rhythm, and their EEG is characterized by a dominant rhythm of low-amplitude EEG in the beta frequencies (greater than 13 Hz) with amplitudes varying between 10 and 25 μV (Fig. 2.2). In most adults the beta rhythms are seen predominately in the frontal and central regions intermixed with the posterior alpha rhythms.
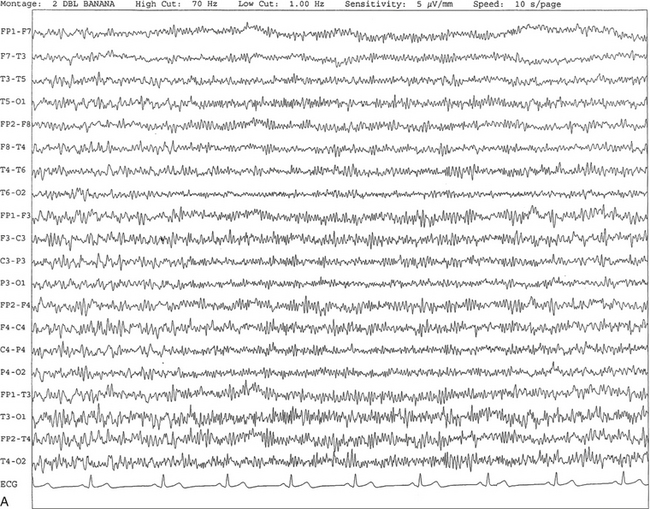
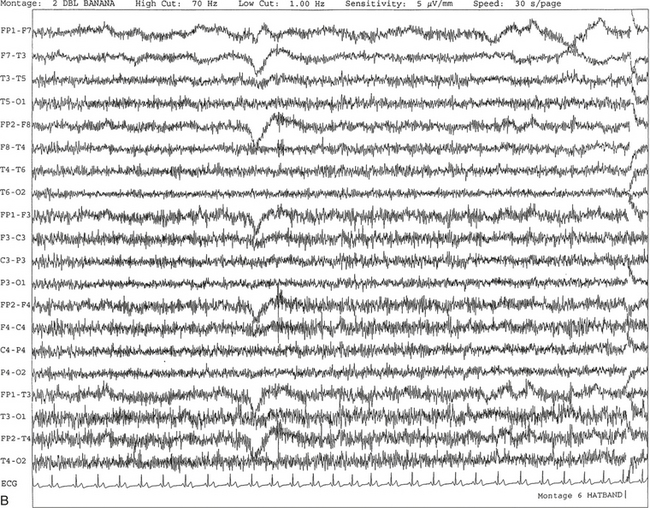
FIGURE 2.2 A, Normal awake electroencephalographic (EEG) pattern characterized by diffuse low-voltage beta (greater than 13 Hz) rhythm in a 23-year-old man at a conventional EEG paper speed of 10 seconds per page. B, Same subject data as in A viewed at a 30-second epoch.
There are characteristic changes in the background EEG rhythms as an individual progresses through the three stages of non–rapid eye movement (NREM) sleep and the tonic and phasic stages of rapid eye movement (REM) sleep. The various characteristics during different sleep stages are described in detail in Chapter 3.
EEG in older adult subjects shows a progressive slowing of the alpha frequency during wakefulness and diminution of alpha blocking and photic driving responses. Focal temporal slow waves, particularly in the left temporal region, often called benign temporal delta transients (Fig. 2.3) of older adults, are seen in many apparently normal older adults, and are sometimes associated with sharp transients. Transient bursts of anteriorly dominant rhythmical delta waves may also be seen in some older adults in the early stage of sleep. Other changes in older adults consist of sleep fragmentation with frequent awakenings, including early morning awakening and multiple sleep-stage shifts. Another important finding in the sleep EEG of older adults is the reduction in amplitude of the slow waves. Because of this, many slow waves do not meet American Academy of Sleep Medicine scoring guidelines; the percentage of slow-wave sleep is therefore often reduced in these subjects.
Abnormal Electroencephalographic Patterns
Abnormal EEG patterns consist of focal or diffuse slow waves and epileptiform discharges. The importance of multiple-channel EEG recordings (see Table 1.3) is to document this focal (Fig. 2.4) or diffuse (Figs. 2.5 and 2.6) slowing and epileptiform discharges (see later).
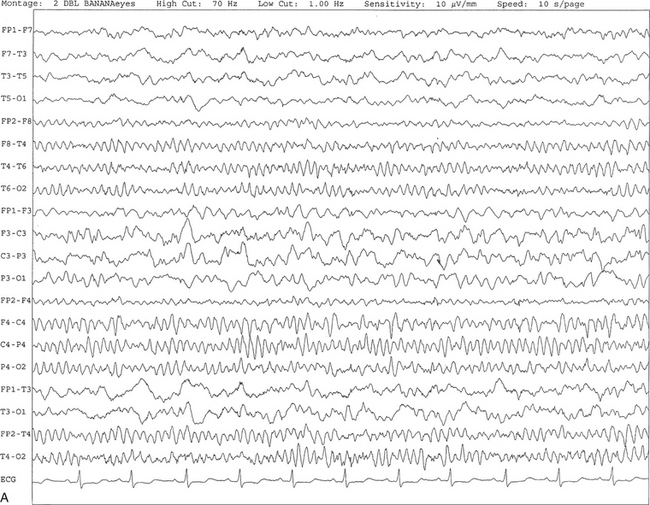
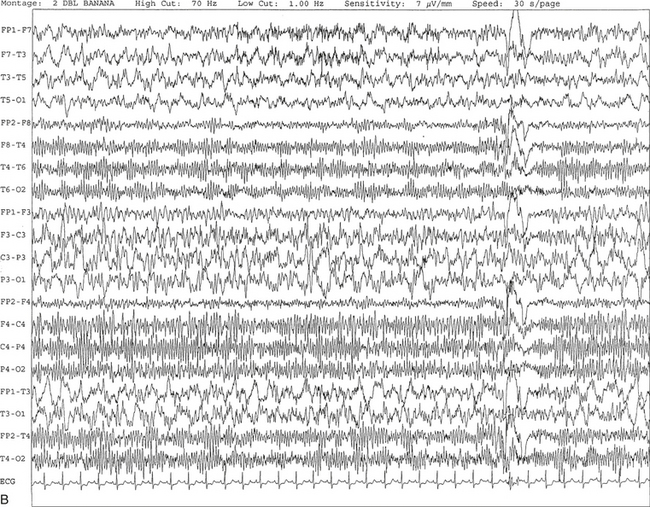
FIGURE 2.4 A, A 10-second electroencephalogram epoch shows focal slowing at 3 to 6 Hz over the left temporoparietal region in an 85-year-old man with history of a stroke. Normal alpha rhythm at 10 to 11 Hz is noted on the right side. B, Same subject data as in A viewed at a 30-second epoch.
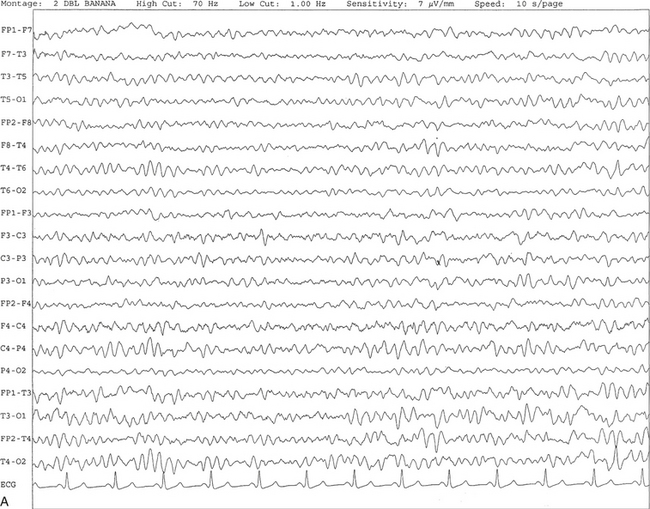
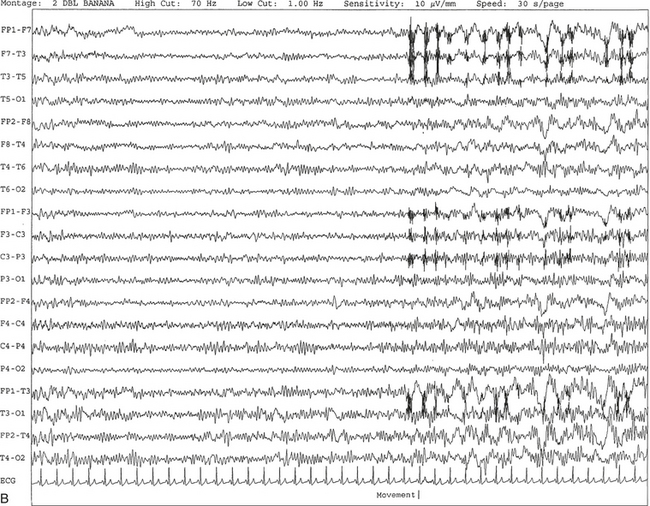
FIGURE 2.5 A, A 10-second electroencephalogram epoch shows mild diffuse slowing of the background rhythm, dominated by 6- to 7-Hz theta activity in an 80-year-old woman with history of hypertension, diabetes mellitus, and bacteremia. B, Same subject data as in A viewed at a 30-second epoch. In addition, brief bursts of rhythmical muscle artifact are noted on the left side toward the end of the epoch. Mild diffuse slowing of the background rhythm may be missed during conventional polysomnography scoring. The clue is that the epoch looks like an awake recording without the characteristic alpha rhythm. This necessitates viewing the segment as a 10-second epoch.
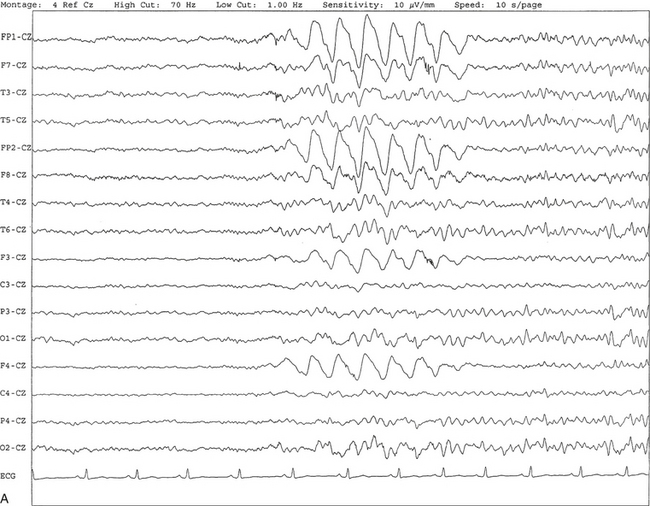
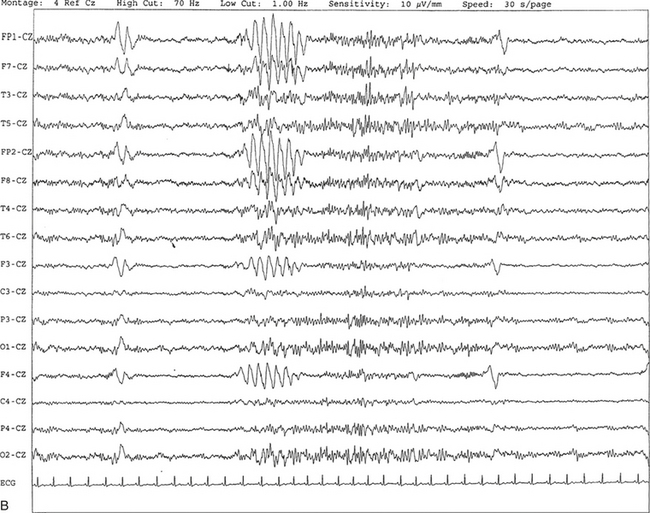
FIGURE 2.6 A, A 27-year-old man with a 3-week history of sudden severe headaches diagnosed as pituitary adenoma. A 10-second electroencephalogram epoch shows evidence of a brief burst of frontal intermittent rhythmical delta activity (FIRDA), synchronously recorded over both hemispheres. FIRDA was originally believed to arise from a deep midline pathological condition, which is demonstrated in this case. However, FIRDA is now believed to be anatomically nonlocalizing and indicates diffuse cerebral dysfunction secondary to metabolic or structural involvement. B, Same subject data as in A viewed at a 30-second epoch.
Recognition of Epileptiform Patterns in the Polysomnographic Tracing
Epilepsy is a clinical diagnosis; therefore history must be obtained from patients, relatives, witnesses, or medical personnel if a patient is referred to the sleep laboratory with a suspected diagnosis of nocturnal seizures. The history must include descriptions of ictal, preictal, postictal, and interictal phenomena, family and drug histories, as well as history of any significant medical or surgical illnesses that might be responsible for triggering the seizures. Physical examination must be conducted to find any evidence of neurological or other medical disorders before PSG recording in the laboratory.
Electroencephalographic Signs of Epilepsy
EEG is the single most important diagnostic laboratory test for patients with suspected seizure disorders. Certain characteristic EEG waveforms correlate with a high percentage of patients with clinical seizures and therefore can be considered of potentially epileptogenic significance. These epileptiform patterns consist of spikes, sharp waves, spike and waves, sharp and slow-wave complexes, as well as evolving pattern of rhythmical focal activities, particularly in neonatal seizures. In addition, a pattern that correlates highly with complex partial seizure is temporal intermittent rhythmical delta activity (TIRDA) (Fig. 2.7). Another pattern that is considered a marker of the seizure-onset zone is interictal scalp high-frequency oscillations (HFOs) consisting of gamma frequency activity (30-80 Hz), ripples (80-250 Hz), and fast ripples (250-1000 Hz), recorded noninvasively using amplifiers with appropriate filter settings (Fig. 2.8). Therefore recording HFOs may help map epileptogenic zones.
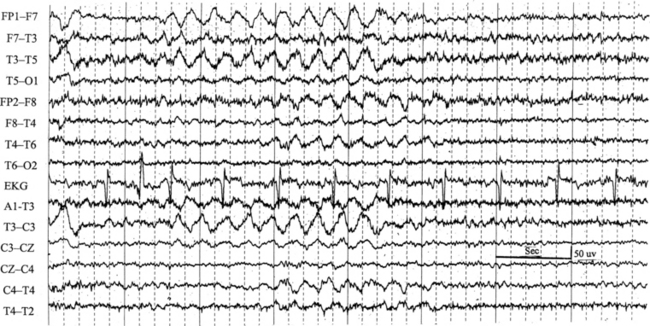
FIGURE 2.7 Ten-second electroencephalogram epoch shows left temporal intermittent rhythmical delta activity (TIRDA) during wakefulness in a 30-year-old woman with partial complex seizures.
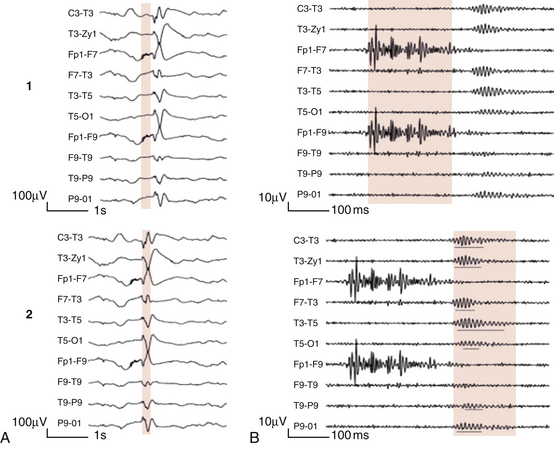
FIGURE 2.8 1, Short electromyographic bursts, which could be mistaken for ripples but are actually artifactual oscillations. 2, Ripples co-occurring with sharp wave. A, Raw electroencephalogram (EEG). B, EEG filtered with high-pass filter of 80 Hz. Shaded section in A is expanded in time and amplitude in B. Note that for this figure the calibration is different in the left and right parts of the figure but is the same for the top and bottom parts. Ripple oscillations are underlined. The waveform morphological appearance of nonartifactual fast oscillations is more rhythmical and regular in amplitude and frequency than that of artifactual oscillations. (From Andrade-Valencia LP, Dubeau F, Mari F, et al. Interictal scalp fast oscillations as a marker of the seizure onset zone. Neurology. 2011;77:524. Used with permission.)
Recognition of a spike or a sharp wave depends on the presence of certain characteristics. A spike is defined as a waveform that suddenly appears out of the background rhythm with a brief duration of 20 to 70 milliseconds showing a field of distribution and is often followed by an after-going slow wave (Fig. 2.9, A). The characteristic feature of a true epileptiform spike or sharp wave is a biphasic or triphasic appearance with a sharp ascending limb followed by a slow descending limb in contrast to augmented background rhythm of sharp contour, which is generally monophasic and has uniform ascending and descending limbs (Fig. 2.9, B). The amplitude of a true epileptiform spike or sharp wave is at least 30% higher than the background activity, and often there is a disturbance in the background rhythm in the neighboring region of the spikes or the sharp waves. Generally spikes or sharp waves are surface negative. A sharp wave fulfills all the criteria described for a spike except that the duration is 70 to 200 milliseconds. Spike and waves and sharp- and slow-wave complexes may be transient or may repeat for several seconds or longer, and in some patients these repeat in a rhythmical manner, such as may be seen in patients with absence seizure showing 3-Hz spike and wave complexes in the EEG (Fig. 2.10).
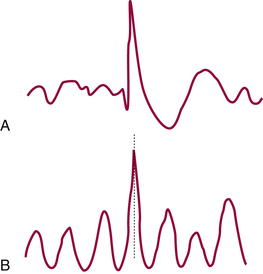
FIGURE 2.9 Diagram of epileptic spike (A) and an augmented background sharp rhythm (B). (From Ajmone-Marsan C. Encephalographic studies in seizure disorders: additional considerations. J Clin Neurophysiol. 1984;1:143, with permission.)
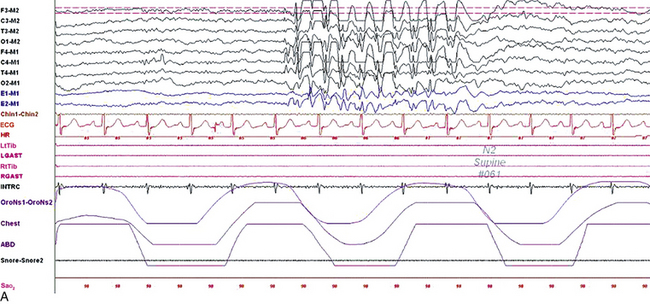
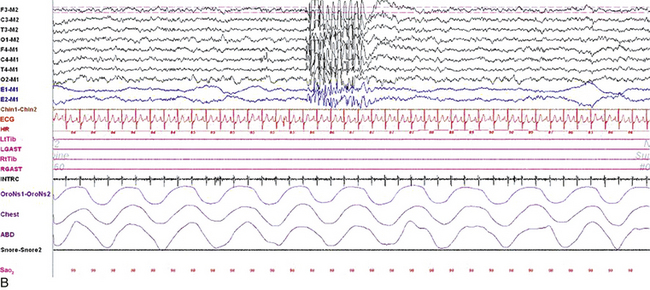
FIGURE 2.10 Polysomnogram (PSG) epochs from an 8-year-old girl referred to the sleep laboratory with complaints of insomnia, frequent nocturnal awakenings, and declining school performance. She did not have a history of convulsions or a previous diagnosis of epilepsy, but the family reported episodes of “daydreaming” and staring. Her neurological examination was normal with no history of developmental delay. The PSG showed an apnea-hypopnea index of 1/hr, mainly caused by physiological central apneas. However, the electroencephalogram (EEG) channels showed frequent bursts of frontally predominant, generalized 3-Hz spike and wave discharges in drowsiness and non–rapid eye movement sleep, less well seen in rapid eye movement sleep. A, A 10-second epoch showing these discharges. B, Same epoch as viewed at a 30-second speed. Top eight channels, EEG recording with electrodes placed according to the 10-20 international electrode placement system; E1-M1 and E2-M1, electro-oculogram channels; Chin1-Chin2, submental electromyogram (EMG); ECG, electrocardiogram; HR, heart rate; LtTib, RtTib, left and right tibialis anterior EMG; LGAST, RGAST, left and right gastrocnemius EMG; OroNs1-OroNs2, oronasal airflow; Chest and ABD, effort belts; Sao2, arterial oxygen saturation by finger oximetry. Also included is a snore channel.
An EEG showing all the characteristic features of sharp waves or spikes and accompanied by the behavioral correlates simultaneously during the recording in the laboratory confirms the diagnosis of epilepsy. However, it is rare to observe the occurrence of a clinical seizure during an EEG recording (Fig. 2.11). Therefore a definitive statement about the diagnosis of epilepsy in a particular patient cannot be made even in the presence of the characteristic EEG signs of epilepsy. In patients suspected of seizure disorder it is advantageous to include activation procedures such as sleep, hyperventilation, and photic stimulation during routine EEG recording in the daytime to bring out the ictal or interictal epileptiform patterns. Special basal temporal electrodes (T1, T2, and sphenoidal electrodes) should be used in addition to the routine electrode placement in patients suspected of partial complex seizure. As described earlier, in such patients the PSG study must include multiple EEG channels covering the parasagittal and temporal regions bilaterally.
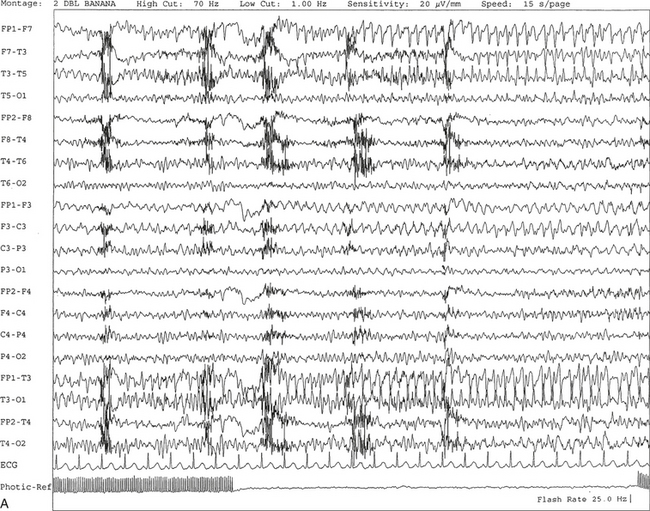
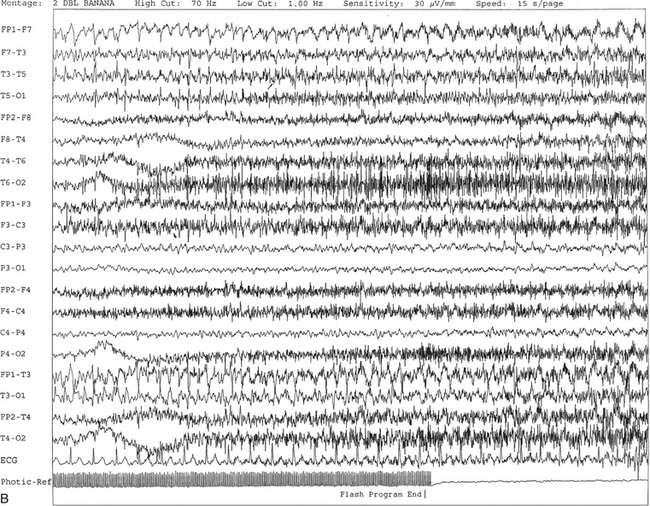
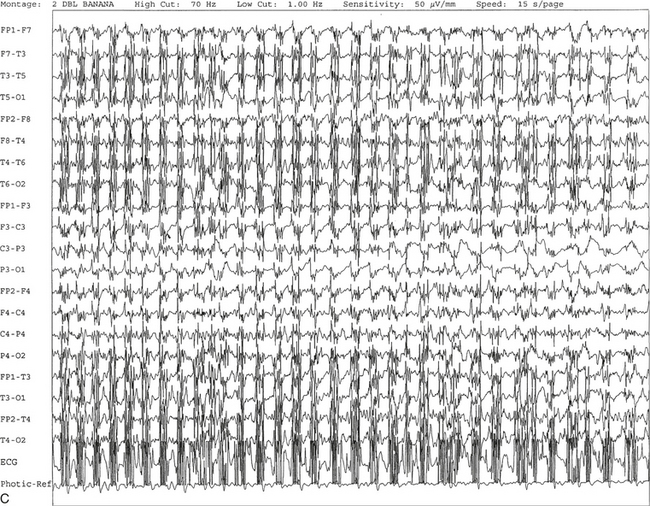
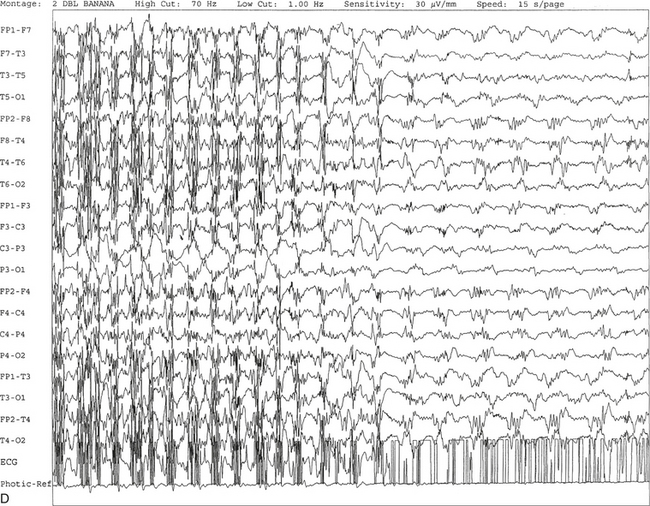
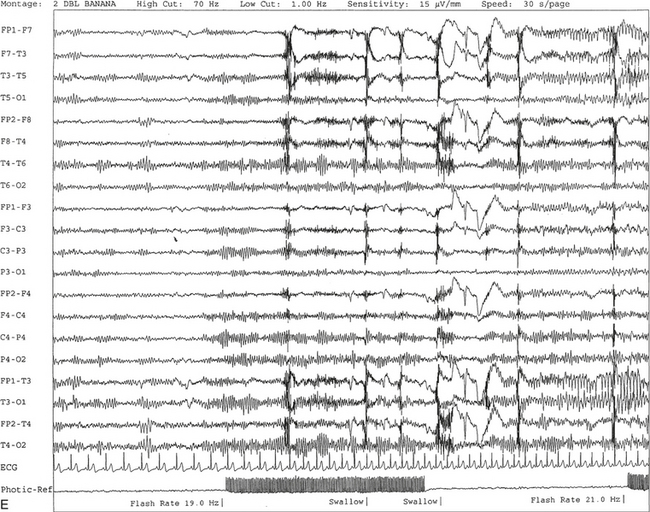
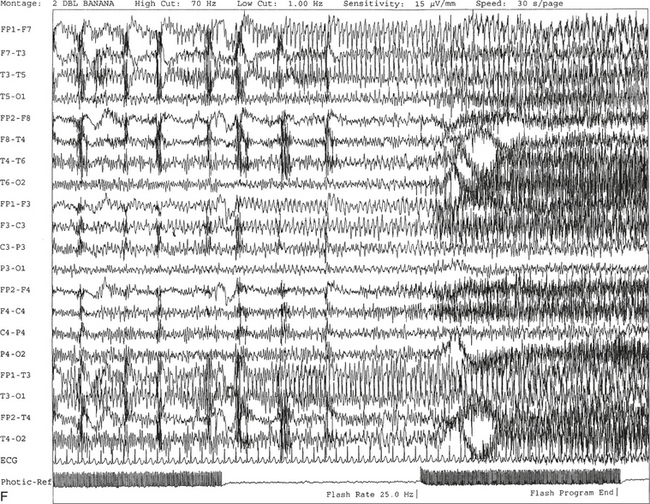
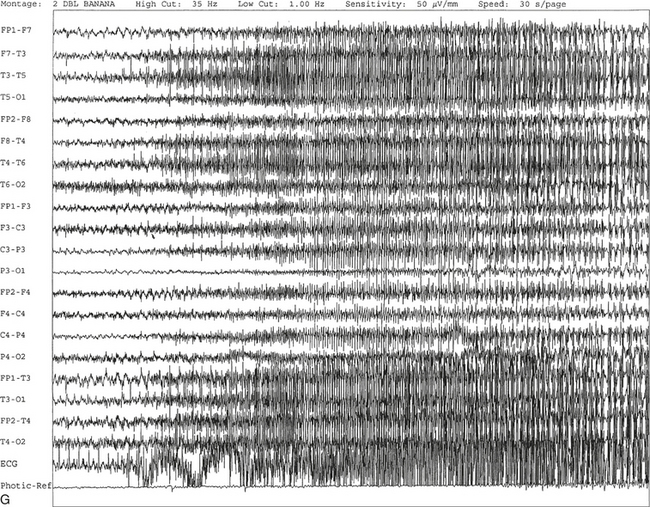
FIGURE 2.11 A, A 61-year-old woman with a history of insomnia and one episode of screaming at night. The electroencephalogram (EEG) shows four sequential epochs at 15 seconds per page at sensitivities ranging from 20 to 50 μV/mm. The figure shows onset of left temporofrontal rhythmical spike and wave activity during photic stimulation at 17 Hz. The spike and wave activity is incremental in nature with increasing frequency and amplitude noted. B, Bilateral generalized spread of the spike and wave activity now being contaminated by muscle activity.
C, Generalized spike and wave activity contaminated by rhythmical generalized muscle activity. D, Continuation of generalized spike and wave activity contaminated by muscle activity followed by postictal EEG depression of the amplitudes and slowing of the background. The EEG development of the ictus was clinically accompanied by a loud scream and sudden turning of the head to the right, followed by shaking of both arms, frothing at the mouth, and fixed and dilated pupils. The entire episode lasted approximately 60 seconds. The patient was in a postictal state for approximately 10 minutes. E to G, The same subject data as in A to D viewed over three 30-second epochs.Nonepileptiform Patterns Mimicking Epileptiform Discharges
Several nonepiletpiform EEG patterns may mimic epileptiform discharges but are not of epileptogenic significance. It is crucial that the polysomnographer be familiar with such normal variants to avoid an erroneous report of epileptiform activity, which may lead to unnecessary further testing and unwarranted medication administration. Some commonly seen normal variants are described in the following sections.
Sharp and Slow Artifacts
Sharp artifacts include activity that is generally easy to identify from its distribution, temporal relationship to other phenomena, and morphological appearance. Electrocardiogram (ECG) artifacts (see Fig. 1.13) can be identified by correlation to a one-lead ECG. Unlike true epileptiform activity, electrode pops are limited to one channel (see Fig. 1.15) and are eliminated after the electrode problems are resolved. Muscle artifacts (see Fig. 1.5) can be reduced by having the patient relax.
Slow artifacts include sweat artifact (see Fig. 1.7), movement artifact (see Fig. 1.6), and respiratory artifact (see Figs. 1.8 and 1.9). These are discussed in further detail in Chapter 1. Pulse artifact (Fig. 2.12) occurs because of placement of an electrode over a major scalp artery and is time-locked to ECG.
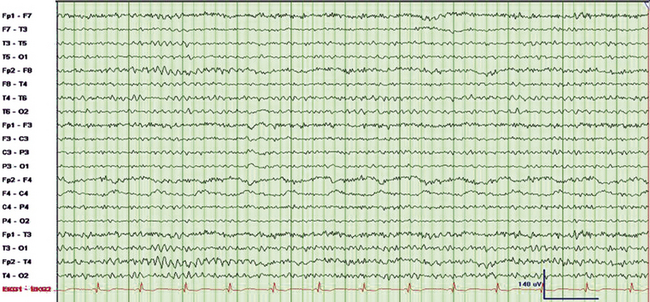
FIGURE 2.12 Ten-second electroencephalogram (EEG) epoch. Pulse artifact is noted to occur in the right frontal EEG electrode (F4). This artifact occurs as a result of placement of electrodes over scalp arteries. Note the clear time-locked relationship between the electrocardiogram and the artifact. The recognition of this relationship helps distinguish the artifact from focal slowing.
Sharp Transients Seen During Sleep and Wakefulness
Sharp transients seen during sleep and wakefulness may include positive occipital sharp transients of sleep (POSTS) (Fig. 2.13), mu rhythms (Fig. 2.14), posterior slow waves of youth (Fig. 2.15), particularly sharp-appearing vertex sharp waves (Fig. 2.16) and K complexes (Fig. 2.17), sharp-appearing spindles, hypnagogic or hypnopompic hypersynchrony resembling spike and wave complexes (Fig. 2.18), benign epileptiform transients of sleep (BETS) (Fig. 2.19), photic driving responses that may resemble spikes or sharp waves (Fig. 2.20), and augmentation of ongoing background rhythm assuming a sharp or spikelike appearance (Fig. 2.21). These sharp transients can be differentiated from true epileptiform activity by studying their distribution and morphological characteristics, the underlying background, and the state of the patient’s alertness. Vertex sharp waves, sharp-appearing K complexes, spindles, and POSTs are stage dependent and have characteristic distributions. In addition, they tend to occur in younger subjects. Hypnagogic hypersynchrony and posterior slow waves of youth are seen in children and adolescents. Mu rhythms (see Fig. 2.14) consist of brief bursts of 7- to 11-Hz activity over the central regions, which show attenuation on active or passive movements of the limbs or even an intention to move the limbs, usually contralaterally. Similar rhythms located in the temporal regions are called wicket rhythms (see Fig. 2.21), and these have no specific significance but may sometimes be mistaken for epileptiform discharges. Lambda waves (Fig. 2.22), also known as scanning waves, are surface-positive, occipitally predominant waveforms that resemble POSTs but occur in wakefulness and are associated with reading.
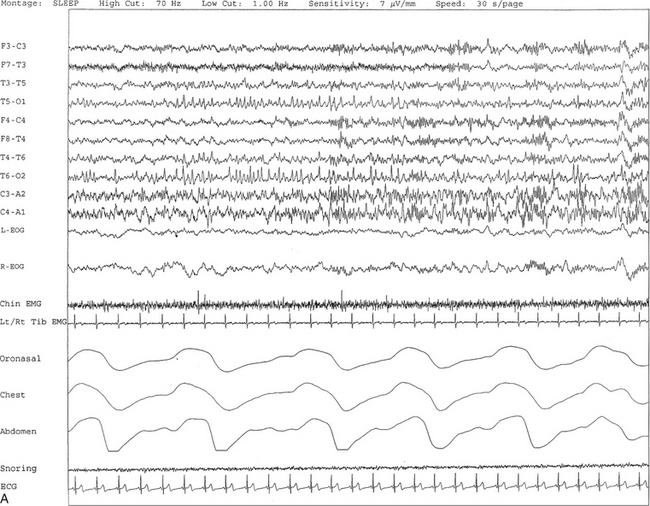
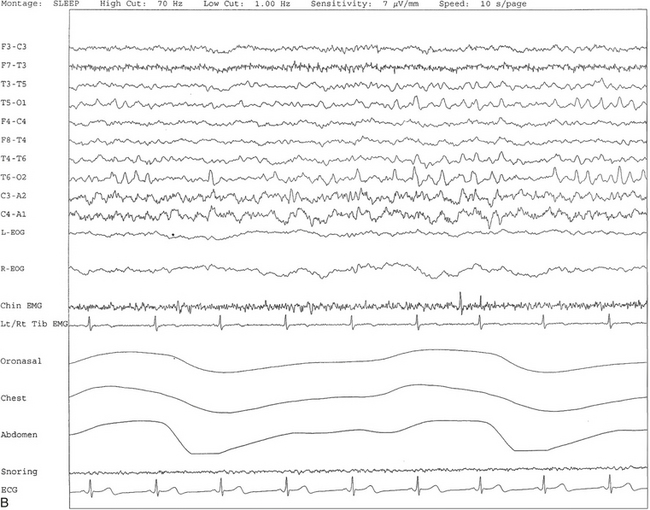
FIGURE 2.13 A, A 30-second epoch from nocturnal polysomnographic recording. Positive occipital sharp transients of sleep are seen bilaterally in posterior temporal and occipital electrodes recorded during stage II non–rapid eye movement sleep. B, Same subject data as in A viewed at a 10-second epoch.
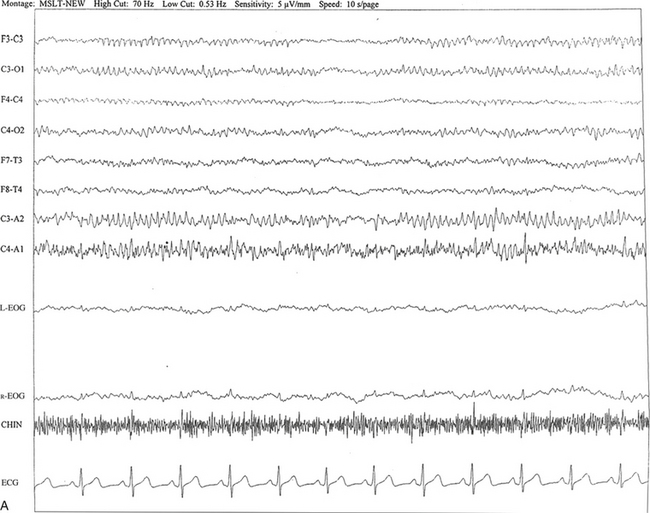
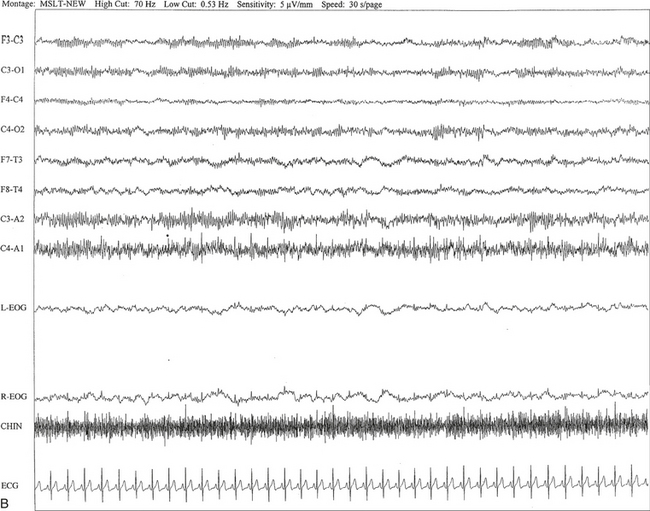
FIGURE 2.14 A, A 40-year-old man referred for evaluation of difficulty sleeping at night, snoring, and excessive daytime sleepiness. The epoch is taken from multiple sleep latency tests in stage I non–rapid eye movement sleep. Mu rhythm is seen bilaterally over the central regions (C3-C4 electrodes), but it is better defined on the left than on the right central regions. B, Same subject data as in A viewed at a 30-second epoch.
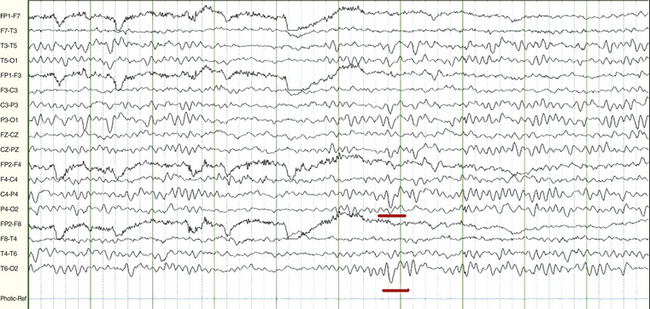
FIGURE 2.15 A 15-year-old female patient with history of new onset of seizures. The electroencephalogram in wakefulness shows slow waves of youth (underlined in red) at 2 to 3 Hz superimposed intermittently on occipital alpha rhythm at 9 to 10 Hz bilaterally. This is a normal finding between ages 2 and 21 years of age, most commonly occurring between 8 and 14 years of age, and it attenuates with eye opening.
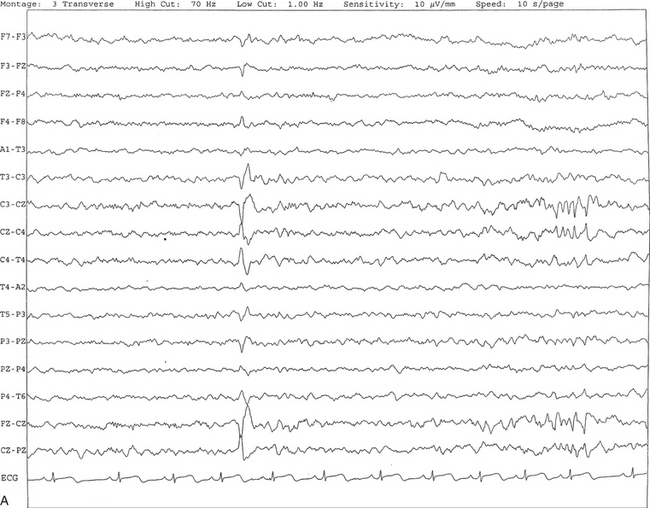
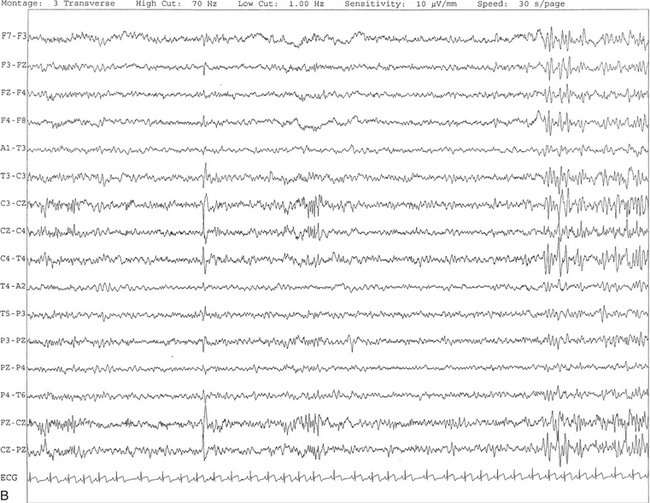
FIGURE 2.16 A, This tracing shows vertex sharp waves seen as negative potentials with a wide distribution around the vertex. In this segment, V waves are seen at C3, C4, and CZ with spread of activities to F3, F4, P3, P4, PZ, and FZ. B, Same subject as in A with data viewed over a 30-second epoch.
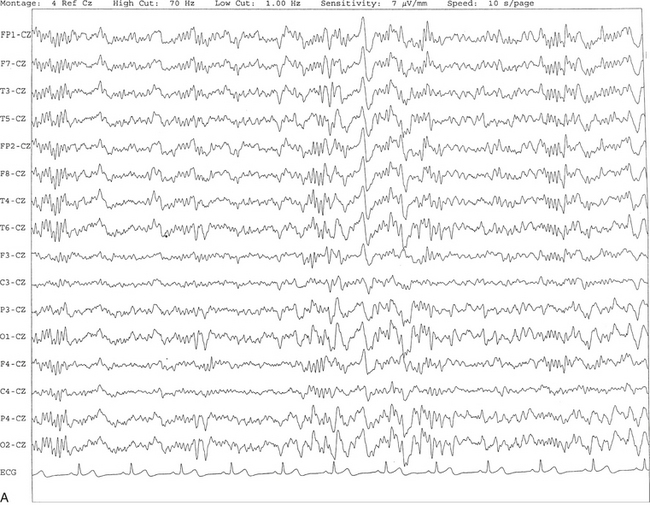
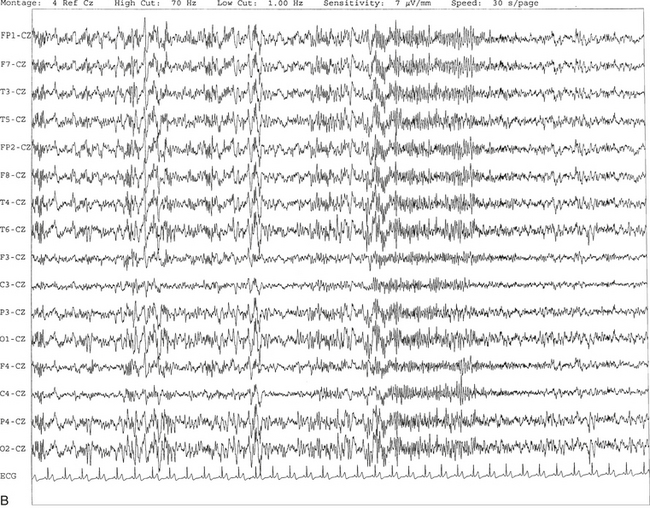
FIGURE 2.17 A, The tracing shows the presence of a sharp-appearing K complex in the middle of a 10-second epoch characterized by a high-voltage negative-positive potential followed by sleep spindles. B, Same subject as in A with data viewed over a 30-second epoch with several K complexes.
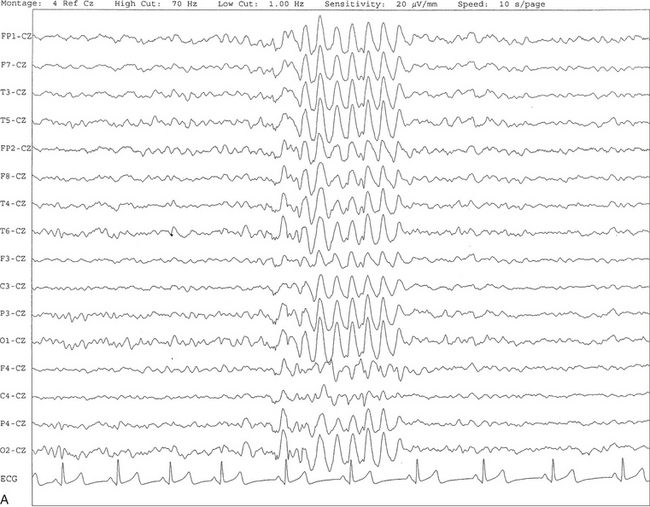
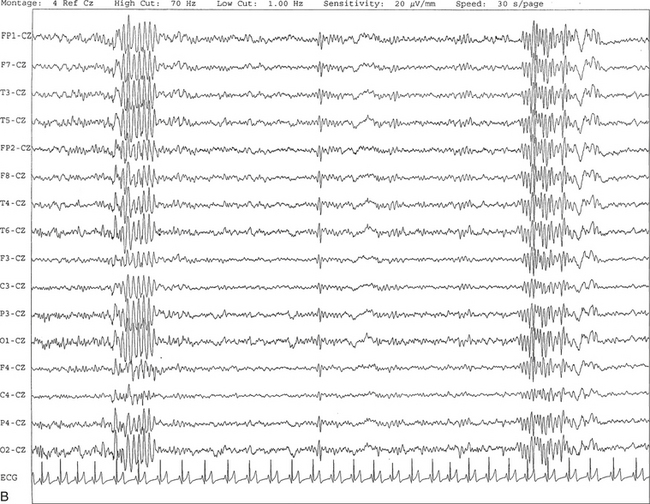
FIGURE 2.18 A, This 10-second electroencephalogram epoch was recorded in a 9-year-old girl during stage II non–rapid eye movement sleep showing hypnagogic hypersynchrony characterized by a brief burst of synchronous high-voltage slow activity at 4- to 5-Hz activity. B, Same subject data as in A viewed over a 30-second epoch. At end of the epoch, a sleep spindle burst is seen in all channels referred to the CZ electrode.
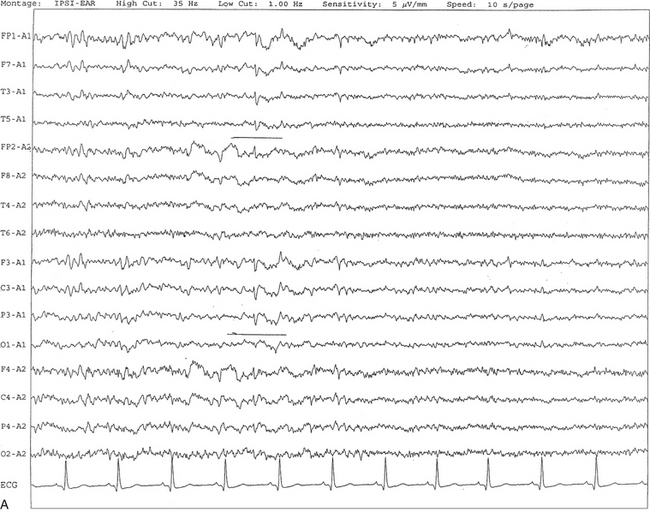
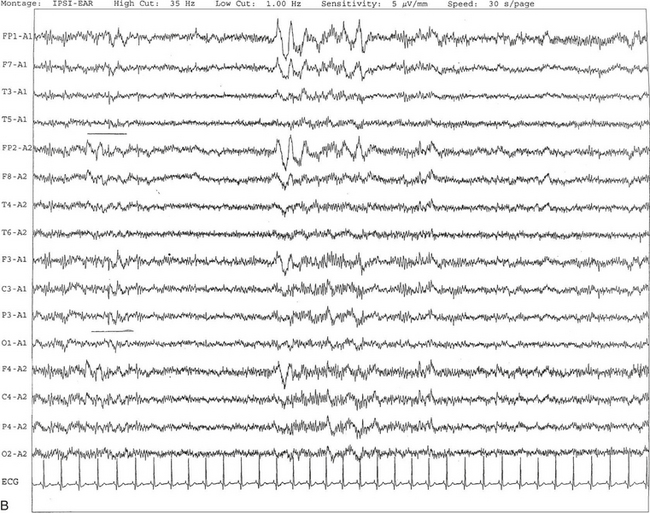
FIGURE 2.19 A, Benign epileptiform transients of sleep or small sharp spikes are seen bilaterally, more prominent on the left side in channels 1 to 5 and 9 to 11 in a 67-year-old man. Small sharp spikes are best recorded in ipsilateral ear montage during stage I non–rapid eye movement sleep as shown in this epoch. Small sharp spikes may be seen asynchronously on either side as well. B, Same subject as in A viewed over a 30-second epoch.
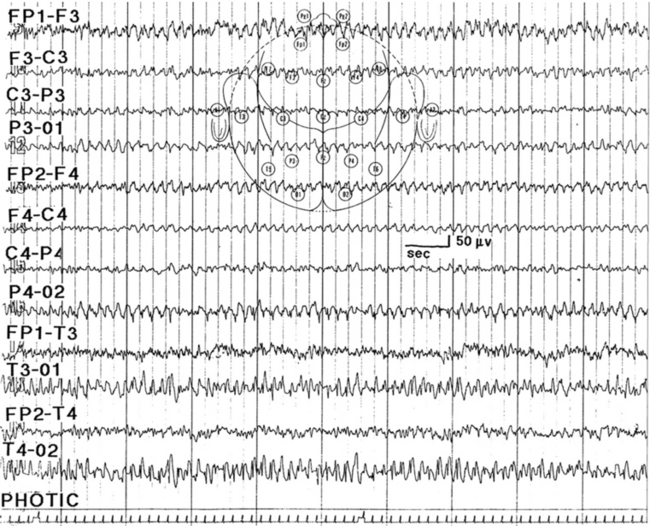
FIGURE 2.20 Photic driving responses seen diffusely at 7 Hz resembling spike and wave bursts. (From Chokroverty S. Role of electroencephalography in epilepsy. In: Management of Epilepsy. Boston: Butterworth-Heinemann, 1996, with permission.)
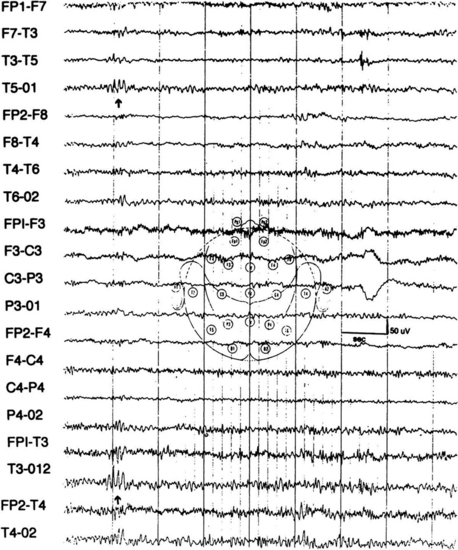
FIGURE 2.21 Several spikelike waves (wicket spikes) repeating rhythmically at T3-T5 (arrows) as well as in T4 with reduced amplitude in an adult without any history of seizures. (From Chokroverty S. Role of electroencephalography in epilepsy. In Chokroverty S, ed. Management of Epilepsy. Boston: Butterworth-Heinemann; 1996, with permission.)
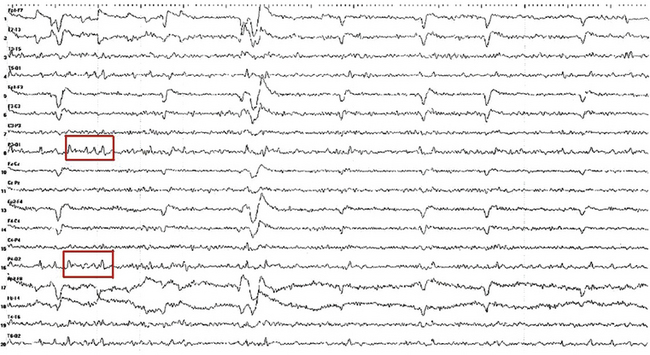
FIGURE 2.22 Ten-second electroencephalogram epoch showing lambda waves (in red boxes) recorded from a 16-year-old girl with a history of a syncopal spell. She was scanning ceiling tiles at the time of the recording. Note the surface positive, occipitally predominant activity occurring simultaneously with rapid eye movements recorded in the frontal channels.
Sharp Transients of Doubtful Significance
These transients include small sharp spikes (see Fig. 2.19), also known as benign epileptiform transients of sleep (BETS), 6-Hz spike and waves (Fig. 2.23) or phantom spike waves, and psychomotor variant pattern or rhythmical midtemporal discharges (Fig. 2.24). Midtemporal rhythmical discharge of drowsiness has a characteristic square-topped appearance and is usually seen during stages I and II of NREM sleep, maximally in the midtemporal region.
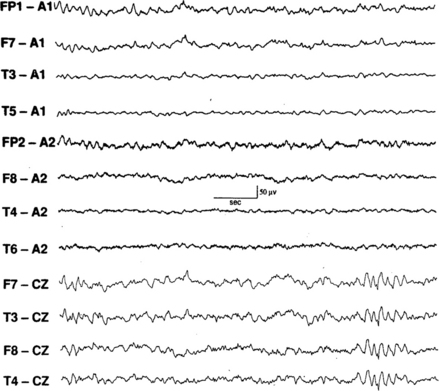
FIGURE 2.23 Six-hertz spike and wave pattern seen in the last four channels. (From Walczak T, Chokroverty S. Electroencephalography, electroymyography, and electro-oculography: general principles and basic technology. In: Chokroverty S, ed. Sleep Disorders Medicine: Basic Science, Technical Considerations, and Clinical Aspects. 3rd ed. Philadelphia: Saunders/Elsevier; 2009:157-181, used with permission.)
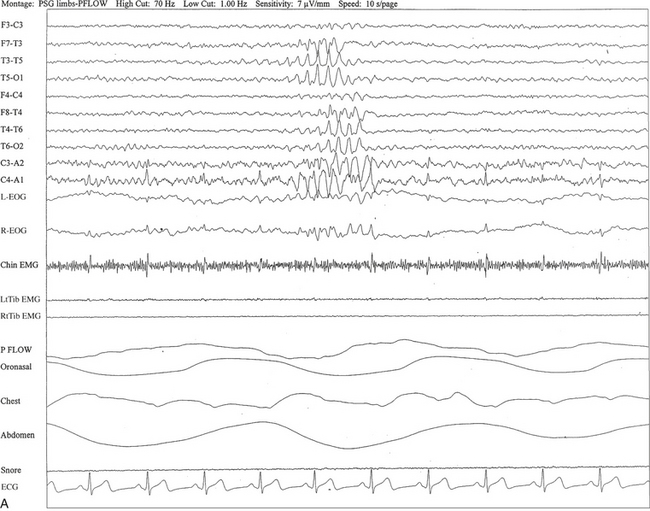
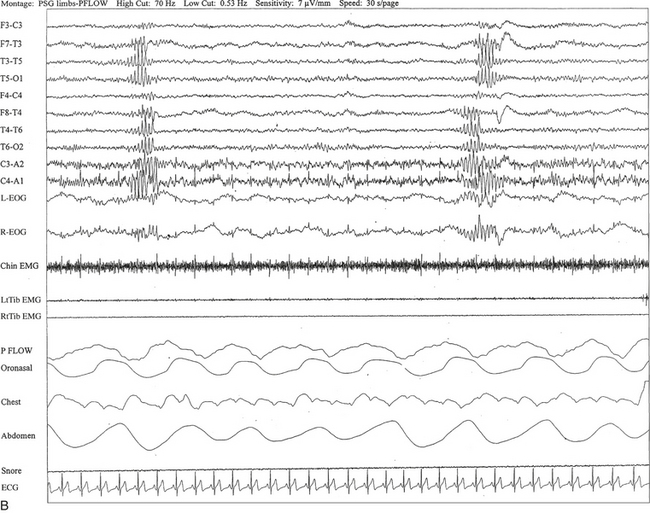
FIGURE 2.24 A, A 40-year-old man referred for evaluation of difficulty sleeping at night, snoring, and excessive daytime sleepiness. This 10-second epoch is taken from nocturnal polysomnography in stage I non–rapid eye movement sleep. Rhythmical midtemporal theta of drowsiness (RMTD) is seen as a brief burst of rhythmical theta activity at 6 to 7 Hz recorded asynchronously over left and right temporal electrodes. B, Same subject data as in A viewed over 30-second epoch. It shows two brief bursts of RMTD, one at each end of the epoch.
Epileptiform-like Patterns without Epileptogenic Significance
These patterns include the following: triphasic waves (Fig. 2.25), periodic or pseudoperiodic lateralized epileptiform discharges (PLEDs; Fig. 2.26), periodic complexes (Fig. 2.27), subclinical rhythmical epileptiform discharge of adults, and burst suppression patterns (Fig. 2.28). Whether PLEDs are ictal or interictal waveforms remains controversial. However, certain specific PLEDs patterns, known as PLEDs-plus, characterized by PLEDs with high-frequency, low-amplitude multispikes, have a stronger correlation with clinical seizures than simple PLEDs. Triphasic waves have an initial positive configuration and characteristic distribution. These are seen synchronously and symmetrically with frontal dominance of the amplitude with anteroposterior phase shift. Triphasic waves are not of epileptiform significance but may be seen in metabolic or toxic encephalopathies (e.g., hepatic, renal, or respiratory failure). Sometimes these are seen in anoxic encephalopathies also.
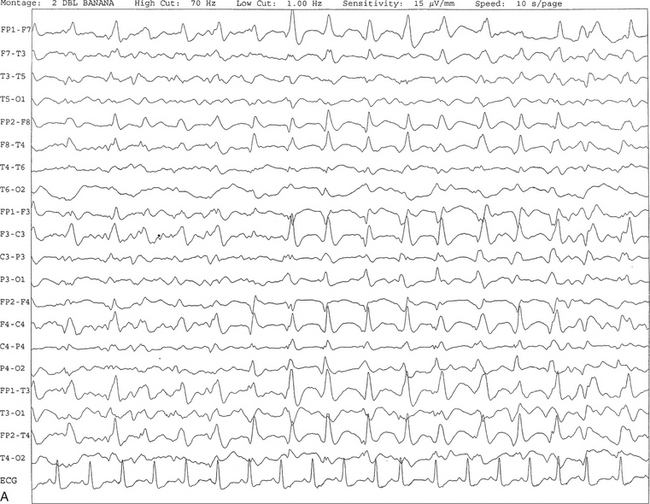
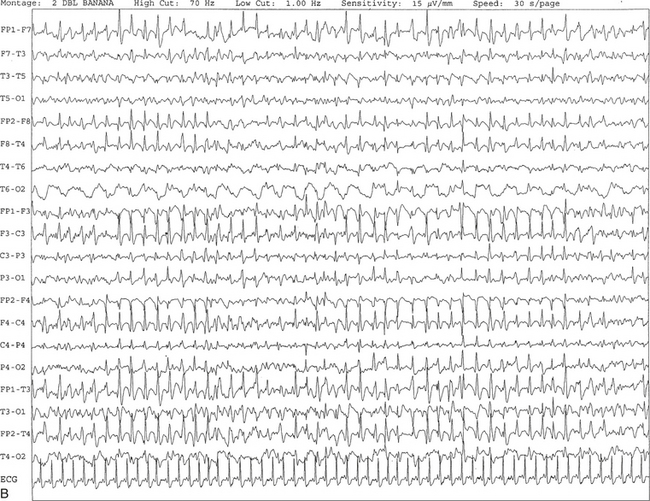
FIGURE 2.25 A, Ten-second electroencephalogram epoch showing triphasic waves at 1 to 2 Hz recorded synchronously, with maximal amplitude frontally in a 67-year-old woman with a history of end-stage renal disease and hepatitis. B, Same subject data as in A viewed over a 30-second epoch.
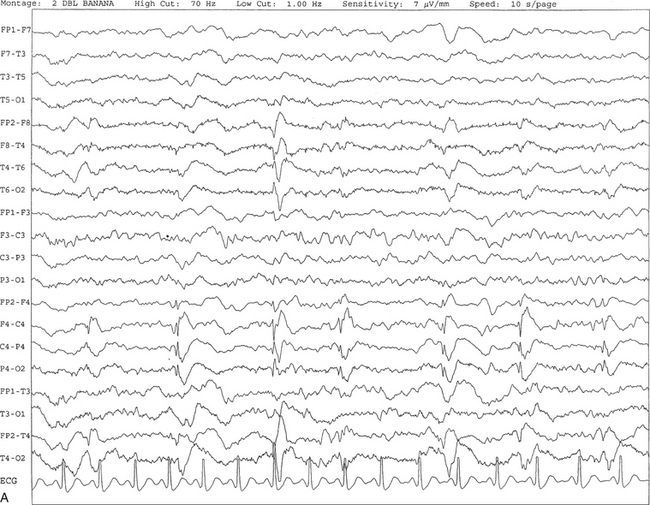
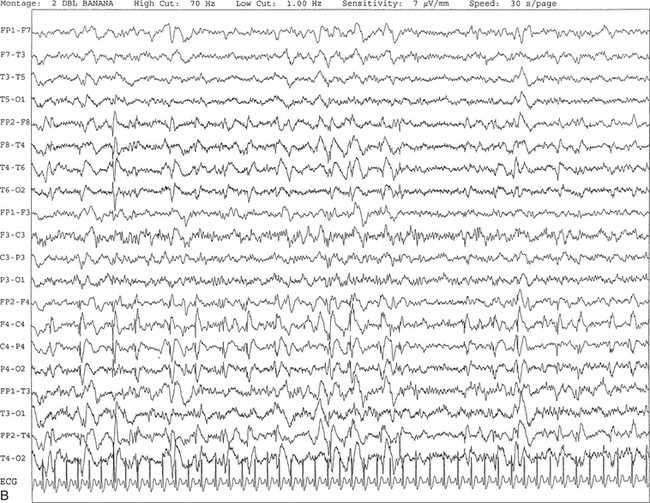
FIGURE 2.26 A, A 49-year-old woman with a history of right frontal subdural hematoma, ovarian cancer, colon cancer, and seizures. Periodic lateralized epileptiform discharges are seen in this 10-second electroencephalogram epoch, characterized by spike and wave activity recurring at 1.5 to 2 seconds over the right central region and spreading to the right temporal region. The background shows diffuse slowing. B, Same subject data as in A viewed over 30-second epochs.
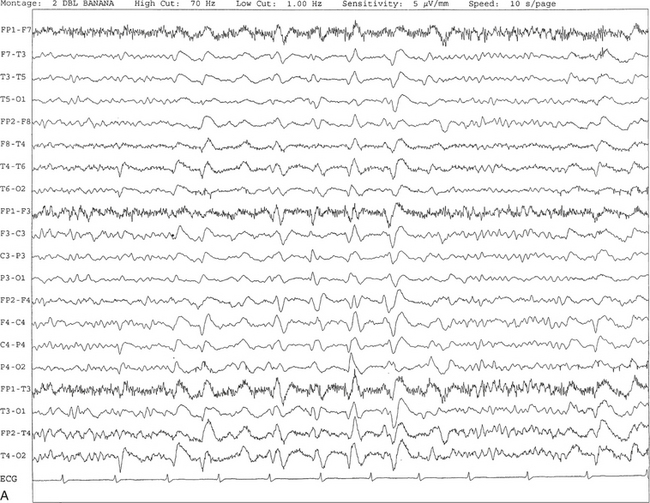
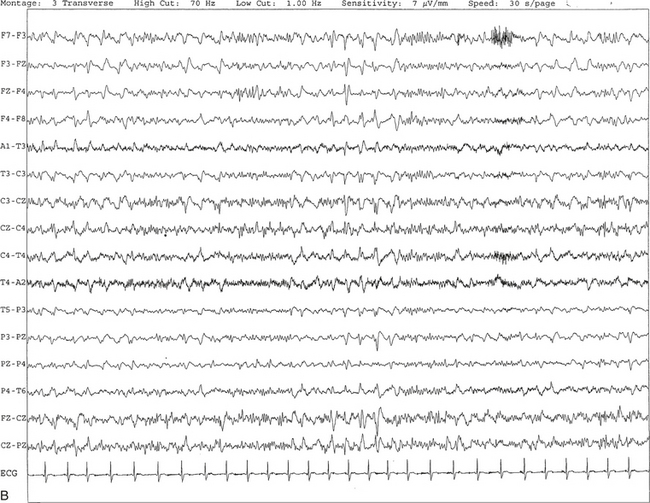
FIGURE 2.27 A, An 81-year-old man with history of dementia and transient ischemic attacks. Ten-second electroencephalogram epoch shows the presence of generalized, intermittent, periodic, or pseudoperiodic sharp- and slow-wave discharges at 1 to 2 Hz. B, Same subject data as in A viewed at a 30-second epoch.
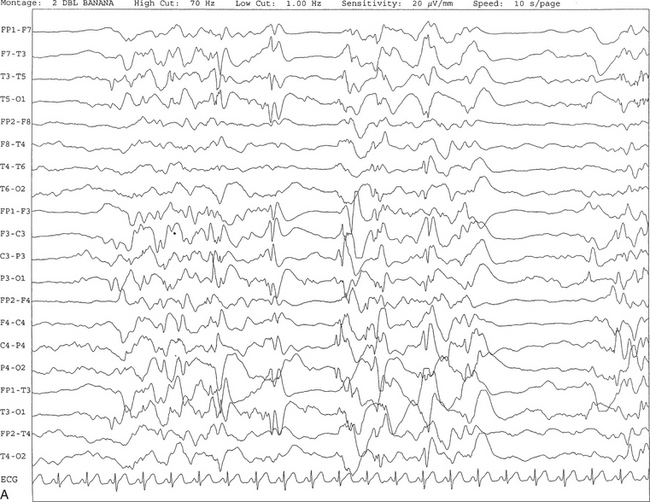
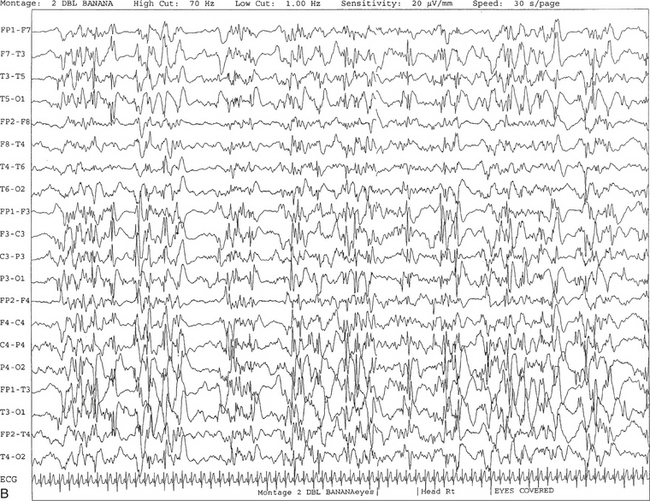
FIGURE 2.28 A, The patient is a 6-month-old girl with a history of hypoxic ischemic encephalopathy and recurrent seizures. The recording shows a burst suppression pattern characterized by bursts of generalized spike and wave and polyspike and wave discharges lasting 2 to 3 seconds with intervening periods of relative voltage suppression (quiescence). B, Same subject data as in A viewed at a 30-second epoch.
Epileptiform Patterns in Sleep
Patients with focal or generalized seizures may sometimes present only at night. On the one hand, such nocturnal seizures may be mistaken for other motor disorders during sleep such as parasomnias. On the other hand, patients with a variety of sleep-related movement disorders (severe sleep apnea, periodic limb movements of sleep, hypnic jerks, confusional arousals, night terrors) are misdiagnosed as having nocturnal seizures. It is therefore important for the sleep specialist to be familiar with the clinical and EEG patterns seen in primary generalized seizure (e.g., absence spells or generalized tonic-clonic seizures) and partial complex seizures of temporal or extratemporal (frontal) origin.
Patients with nocturnal frontal lobe epilepsy are often referred to the laboratory for PSG recording (see Chapter 11). The characteristic EEG pattern in the primary generalized epilepsy of the absence type is the presence of symmetrical and synchronous frontally dominant 3-Hz spike and wave discharges (see Fig. 2.10) seen either as an ictal or interictal pattern. Patients with tonic-clonic seizure may show a sudden burst of spike and slow waves beginning at a rate of 4 to 6 Hz and then gradually slowing down and stopping before the postictal period. These discharges are seen in a bilaterally symmetrical and synchronous fashion. Postictal slow waves are followed by gradual recovery to the preictal normal background rhythm after several hours or sometimes after a day or two. Interictal EEG may show generalized synchronous and symmetrical 4- to 6-Hz spike and slow-wave discharges or multiple spike and waves.
Certain types of seizures are characteristically observed during sleep, including benign epilepsy of childhood with centrotemporal spikes (Fig. 2.29), tonic seizures, juvenile myoclonic epilepsy (Fig. 2.30), continuous spike and waves during slow-wave sleep (Fig. 2.31), nocturnal frontal lobe epilepsy, and a subtype of partial complex seizure of temporal lobe origin. Some patients with generalized tonic-clonic and partial complex seizure may also have predominantly nocturnal seizures. It is well known that sleep deprivation can lower seizure threshold; indeed, EEGs performed when patients are sleep deprived increase the yield of identifying epileptiform activity.
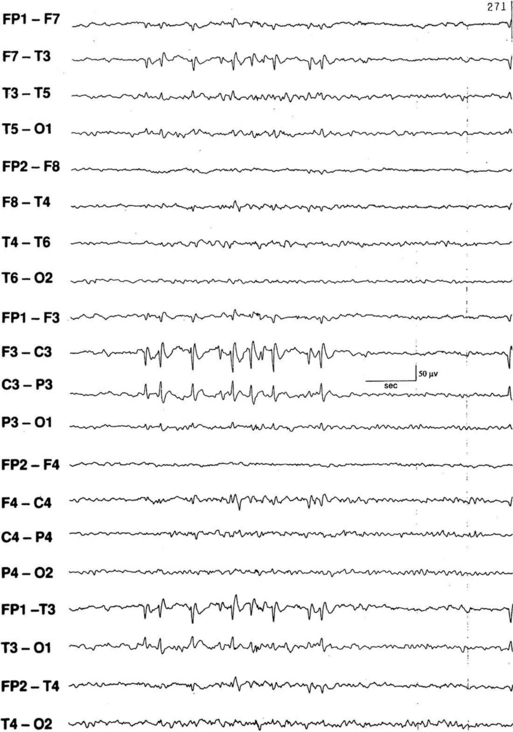
FIGURE 2.29 Electroencephalogram showing left centrotemporal spikes and sharp waves in a patient with benign rolandic epilepsy (sylvian seizures). Benign rolandic seizures commonly present in childhood as unilateral tonic or clonic seizures in face or arm, speech arrest, and paresthesias in the mouth or tongue. (From Chokroverty S, Montagna P. Sleep and epilepsy. In: Chokroverty S, ed. Sleep Disorders Medicine: Basic Science, Technical Considerations, and Clinical Aspects. 3rd ed. Philadelphia: Saunders/Elsevier; 2009:499-529.)
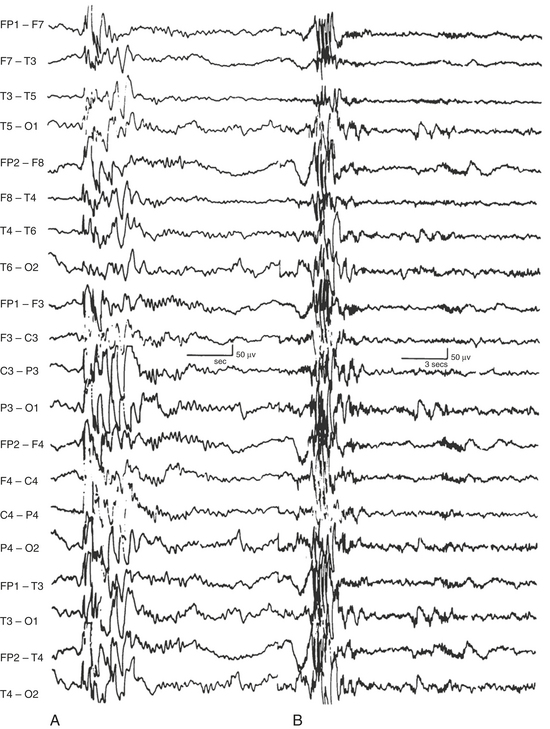
FIGURE 2.30 Interictal generalized multiple spike and wave discharges in the electroencephalogram (EEG) of a patient with juvenile myoclonic epilepsy. Note the recording at 30 mm/sec (10-second epoch, conventional EEG speed) on the left (A) and at 10 mm/sec (30-second epoch, conventional polysomnogram speed) on the right (B). (From Chokroverty S, Montagna P. Sleep and epilepsy. In Chokroverty S, ed. Sleep Disorders Medicine: Basic Science, Technical Considerations, and Clinical Aspects. 3rd ed. Philadelphia: Saunders/Elsevier, 2009:49-529.)
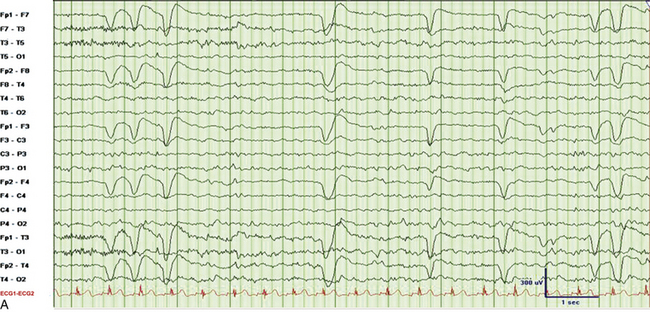
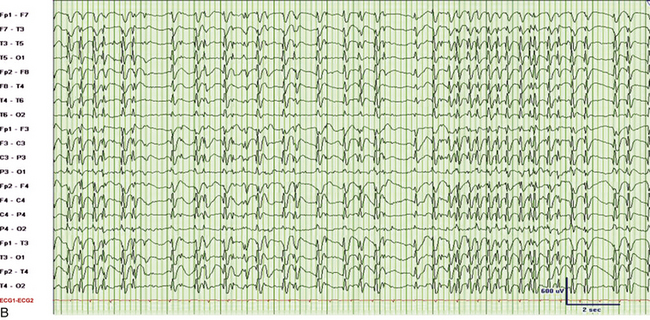
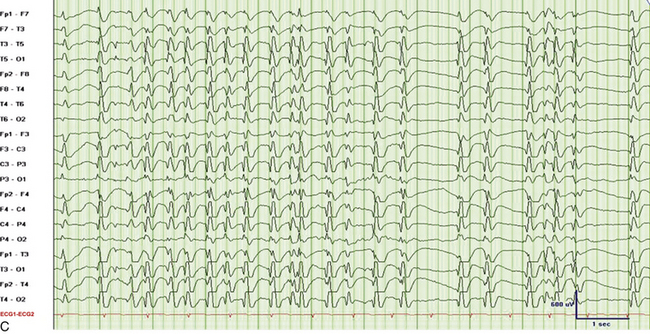
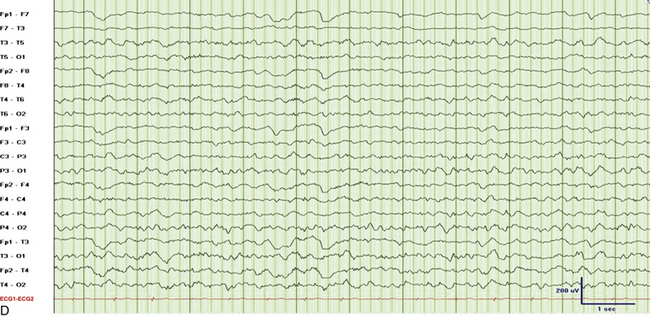
FIGURE 2.31 Electroencephalographic (EEG) tracings from a 9-year-old boy with developmental delay, poor speech output, and nocturnal events of uncertain etiology. A, A 30-mm/sec epoch of wakefulness showing eye blinks in the bilateral frontopolar leads with no evidence of epileptiform activity. B, A 30-mm/sec EEG epoch of stage N3 sleep. The patient had 2- to 3.5-Hz continuous generalized spike and wave discharges with 1 to 2 seconds of electrocerebral decrement (continuous spike and wave in slow wave sleep). C, Same epoch as B, displayed at a speed of 10 mm/sec (the usual speed at which polysomnograms are reviewed). D, A 30-mm/sec EEG epoch of rapid eye movement sleep in the same patient showing absence of epileptiform activity. (Reproduced with permission from Neiman ES, Seyffert M, Richards A, Gupta D, Chokroverty S. Epilepsy with continuous spikes and waves during slow wave sleep in a child diagnosed with pervasive developmental disorder-not otherwise specified. Sleep Med. 2010;11:799-802.)
It is important to differentiate nocturnal seizures from motor and behavioral parasomnias and other movement disorders persisting during sleep. Tonic seizures are typically activated by sleep, occur frequently during NREM sleep, and are never seen during REM sleep. A typical EEG shows interictal abnormality as slow spike and waves intermixed during sleep with trains of fast spikes. Benign focal epilepsy of childhood with centrotemporal spikes is characterized by the presence of centrotemporal or rolandic spikes or sharp waves (see Fig. 2.29). Seizures generally resolve by the age of 15 to 20 years without any neurological sequelae. The EEG in patients with juvenile myoclonic epilepsy (see Fig. 2.30) typically shows symmetrical and synchronous multiple spike and wave discharges. The EEG in the entity of continuous spike and waves during NREM sleep consists of generalized 2- to 2.5-Hz spike and wave discharges occupying 85% of NREM sleep that are suppressed during REM sleep (see Fig. 2.31). This entity is generally seen in children and is associated with developmental regression; it may be mistaken for autism and illustrates the importance of capturing sleep even on daytime EEGs. Nocturnal frontal lobe seizures are discussed in Chapter 11.
Diagnostic Approach to Patients With Suspected Nocturnal Seizures
In a patient suspected of having nocturnal seizures, a routine daytime EEG recording with hyperventilation, sleep, and photic stimulation is the initial recommended diagnostic step. If no epileptiform discharges are noted, then the EEG should be repeated after partial or total sleep deprivation. After three of four negative EEGs in these particular patients, an overnight video-PSG study should be obtained for electroclinical correlation. An appropriately devised seizure montage with full complement of electrodes (see earlier) or special electrode placements (e.g., T1 and T2 electrodes) should be used. During the interpretation of the PSG study, the montage can be reformatted to analyze any abnormal behavior or suspected clinical seizures at 10 mm/sec (the conventional EEG speed) instead of the usual 30 mm/sec (the conventional PSG speed); this makes it easier to recognize abnormal EEG patterns.
Andrade-Valencia, L. P., Dubeau, F., Mari, F., et al. Interictal scalp fast oscillations as a marker of the seizure onset zone. Neurology. 2011; 77:524.
Chokroverty, S. Role of electroencephalography in epilepsy. In: Chokroverty S., ed. Management of Epilepsy. Boston: Butterworth-Heinemann; 1996:67–112.
Ebersole, J., Pedley, T. Current Practice of Clinical Electroencephalography, 3rd ed. Philadelphia: Lippincott, Williams and Wilkins; 2003.
Iber, C., Ancoli-Israel, S., Chesson, A. L., Quan, S. F. The AASM Manual for the Scoring of Sleep and Associated Events: Rules, Terminology, and Technical Specifications. Westchester, Ill: American Academy of Sleep Medicine. 2007.
Libenson, M. H. Practical approach to electroencephalography. Philadelphia: Saunders/Elsevier; 2010.
Nickels, K., Wirrell, E. Electrical status epilepticus in sleep. Semin Pediatr Neurol. 2008; 15:50–60.
Schomer D., Da Silva L., eds. Niedermeyer’s Electroencephalography: Basic Principles, Clinical Science, and Related Fields, 5th ed., Philadelphia: Lippincott, Williams and Wilkins, 2011.
Walczak, T., Chokroverty, S. Electroencephalography, electromyography, and electro-oculography: general principles and basic technology. In: Chokroverty S., ed. Sleep Disorders Medicine: Basic Science, Technical Considerations, and Clinical Aspects. 3rd ed. Philadelphia: Saunders/Elsevier; 2009:157–181.