Hypnogram Analysis
The hypnogram is a compressed graphic summary of an entire sleep study. It allows, on a single page, a representation of multiple variables, including sleep stages, respiratory events, positive airway pressure (if used), motor movements, oximetry, end-tidal or transcutaneous CO2, heart rate variability measures, electroencephalographic power spectrum, and body position.
Information in a hypnogram has two dimensions—horizontal and vertical. Examples of the horizontal dimension are the flow of sleep stages across the night, the oximetry profile, and the occurrence of respiratory events. Examples of the vertical dimension are the effect of body position and sleep stage on respiration and oxygenation. Some patterns are common and characteristic, such as stage-related sleep-disordered breathing (rapid eye movement [REM]-predominant obstructive sleep apnea [OSA]), positional sleep-disordered breathing (supine-predominant OSA), and central sleep apnea (associated with minimal disease in REM sleep and smooth-symmetrical moderate oxygen desaturations in non-REM sleep). A prolonged sleep-onset latency followed by consolidated sleep suggests delayed circadian phase. Fragmentation of the sleep cycle can be secondary to a severe first-night effect or poor sleep hygiene.
The continued development of sleep technologies has expanded the concept of the hypnogram, and this chapter reflects that. Advances in tracking sleep in the home environment, especially with positive pressure therapy machines, and the ability to graph use, leak, and respiration provide a wealth of direct and indirect information.
The possible combinations of pathophysiological features are many, and the following snapshots show some of the patterns that can be seen (Figs. 6.1 to 6.19) and provide unique insights into disease.
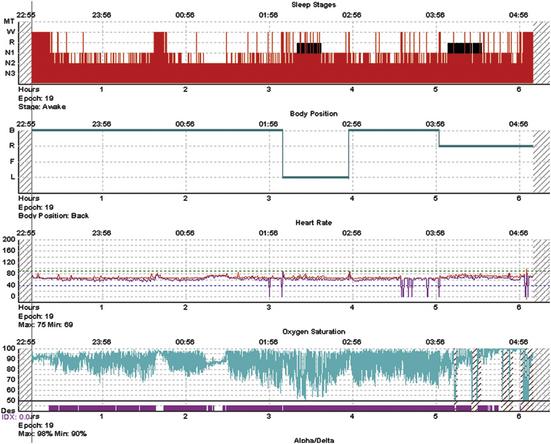
FIGURE 6.1 Classic hypoxic obstructive sleep apnea.
A 52-year-old obese man with a body mass index of 45 kg/m2 presents with snoring, daytime sleepiness, and witnessed apneas. The diagnostic polysomnogram shows relatively well-preserved overall sleep macroarchitecture even though stage and state transitions are frequent, and there is severe oxygen desaturation that seems worse during the first rapid eye movement period. The return of saturation to baseline is caused by vigorous arousals. There is one brief period of stable sleep just after 1 AM, in which the oximetry does not show fluctuations.
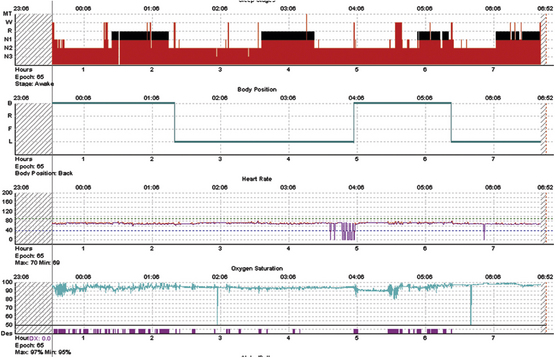
FIGURE 6.2 Response to therapy for sleep apnea.
The same subject as in Figure 7.1, during positive pressure therapy. Optimal pressures were obtained quickly and resulted in nearly normalized oxygenation, elimination of stage and state transitions, but no slow wave sleep. The latter may reflect limitations of conventional amplitude-based sleep stage scoring; it may also be speculated that such severe sleep apnea could cause cortical injury and an inability to generate large-amplitude slow waves acutely. On the other hand, slow wave sleep rebound is considered a feature of successful titration but is absent here. Note that the duration of rapid eye movement (REM) sleep shows the inverse of the norm—longer periods earlier, which is one manifestation of REM sleep rebound.
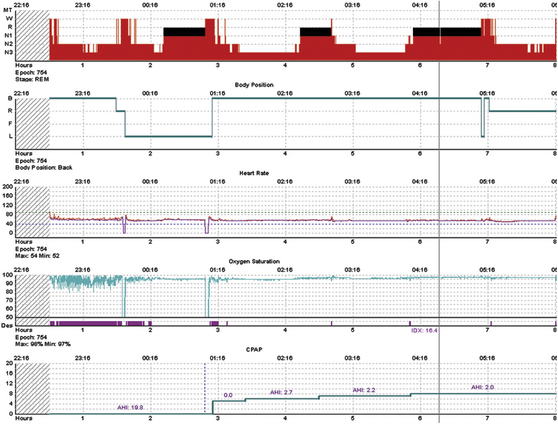
FIGURE 6.3 Split night polysomnogram.
A 42-year-old woman presents with typical sleep apnea symptoms. Here, there is a relatively straightforward response to positive pressure therapy, with a major slow wave sleep and possibly some rapid eye movement sleep rebound.
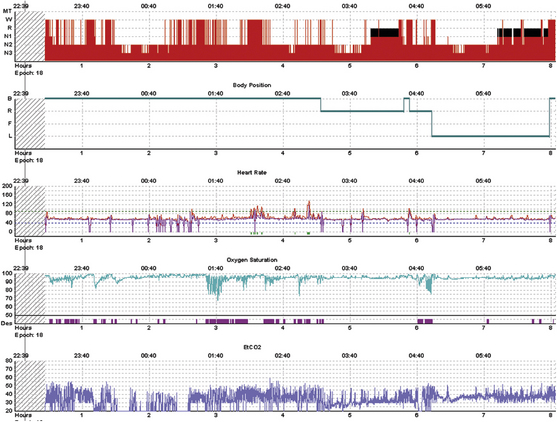
FIGURE 6.4 Congenital myotonic dystrophy.
A 40-year-old man with nocturnal respiratory failure and central sleep apnea from congenital myotonic dystrophy. This is a positive pressure titration with bilevel ventilation and a backup rate. The majority of breaths are ventilator supported. The bottom trace is end-tidal CO2 measures using a nonvented mask; variable leak intermittently degrades the signal. Transcutaneous CO2 was also measured and remained between 48 and 56 mm Hg. Severe sleep fragmentation with greater consolidation during the second half of the night is consistent with moderate phase delay. The periods of severe desaturation were caused by inadvertent switch to continuous positive airway pressure while adjusting pressures in the Respironics PC Direct module. Supplemental oxygen was not used.
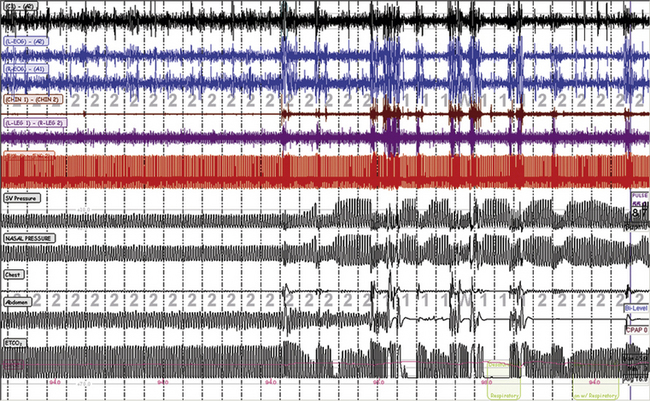
FIGURE 6.5 Spontaneous switches between stable and unstable non–rapid eye movement sleep.
Periods of stability occur in stage N2 that are intrinsic to sleep and are recognized readily as periods of stable breathing even in those with severe sleep apnea. This is a titration with ResMed adaptive servo ventilation (ResMed Adapt SV). The left half of the figure shows a period of stability and stage N2; the right half shows repetitive arousals, respiratory events, and periodic breathing. The SV pressure channel is the pressure output from the ventilator, the nasal pressure is mask pressure, the chest effort and then the abdominal effort belts have fallen off, and the end-tidal CO2 (ETCO2) is being measured using a nonvented oronasal mask. The “cycling” of ventilator pressure is a typical response of this specific ventilator to detected periodic breathing.
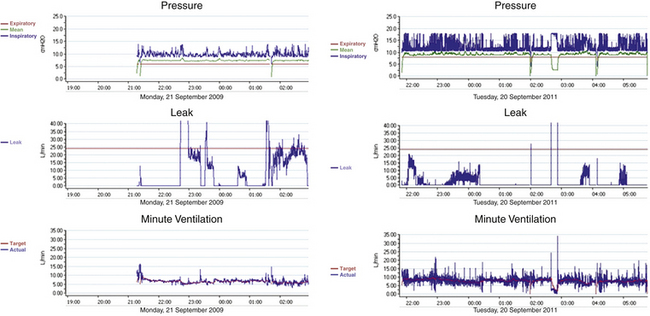
FIGURE 6.6 Successful (left) and unsuccessful (right) home therapy with ResMed VPAP Adapt SV.
The ventilator provides a detailed output that includes the instantaneous delivered pressure, respiratory rate, tidal volume, and leak. The subject on the right shows minimal “pressure cycling” despite intermittent fluctuating leak; note the minimal fluctuations in integrated (machine + patient) tidal volume. The graph on the left shows severe pressure cycling and far greater tidal volume variability relative to the subject on the left. Persistent pressure cycling during home use suggests ongoing periodic breathing, necessitating aggressive responses from the ventilator. Patients with this pattern often note persistence of subjective sleep symptoms.
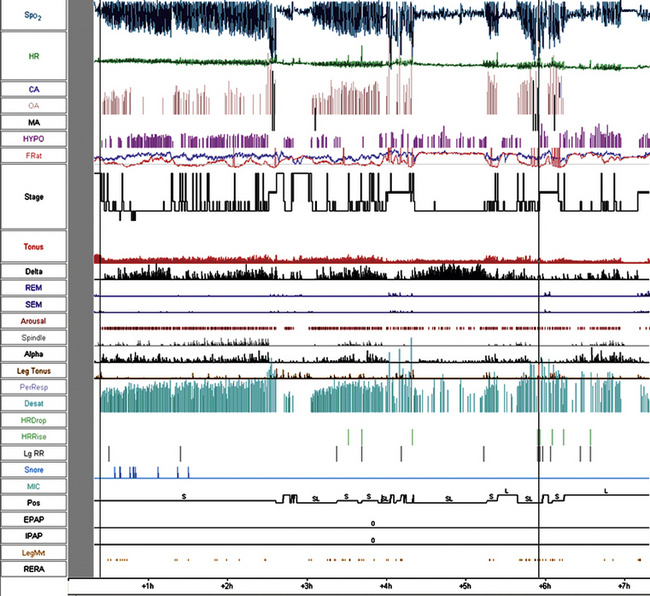
FIGURE 6.7 Dynamic features of obstructive sleep apnea not captured in oxygenation indices.
Note that there is severe desaturation during rapid eye movement (REM) sleep, but the oxygenation abnormality during non–REM (NREM) sleep is a thick “band” for significant periods of the night. This may reflect secondary chemoreflex sensitization and periodic breathing added to the obstructive component. Note the period of sleep and respiratory stability (and minimal oximetry abnormality) during the fourth NREM cycle; this cycle is also associated with the greatest delta power, which is contrary to the normal pattern of the first NREM period, demonstrating the greatest slow wave sleep. The heart rate plot shows less variability than expected, a feature of sleep apnea. Such sleep regulatory disturbances are frequently seen in sleep apnea but are not necessarily captured by the conventional sleep metrics.
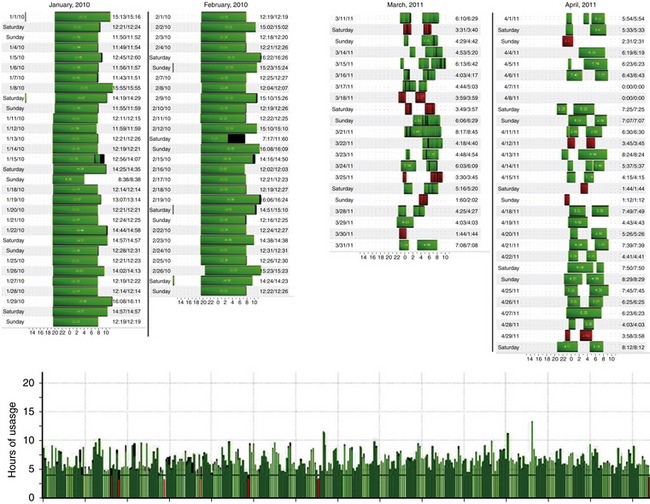
FIGURE 6.8 Compliance-based hypnogram.
The data tracking and graphing capabilities of positive pressure machines can provide insights into the patient’s condition, besides the “hours of use” and related insurance-friendly compliance metrics. The figure shows three examples. On the left, a 33-year-old man with idiopathic hypersomnia plus long sleep time and moderate sleep apnea (note the long sleep durations). On the right, a 28-year-old female patient with central sleep apnea from opiate use, fibromyalgia, poor sleep hygiene, and psychophysiological insomnia. The bottom graph shows a pattern of fluctuating use across a whole year—longer and shorter periods of use cycle smoothly. The patient is a 40-year-old man with treated bipolar disorder and sleep apnea. It seems that there is a cycling of expressed homeostatic sleep drive in this instance; it is speculated that such a pattern could be a feature of bipolar disorder.
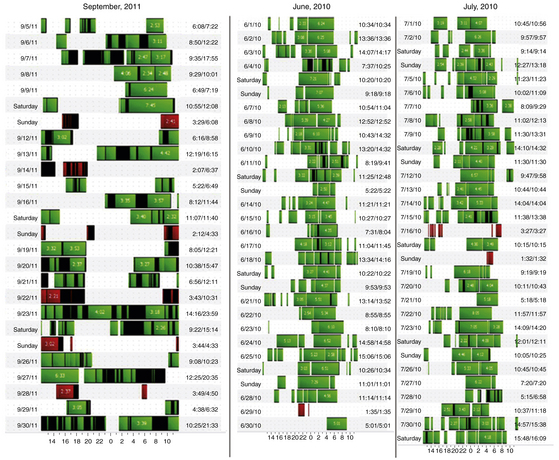
FIGURE 6.9 Compliance-based hypnograph showing sleep fragmentation.
On the left is a 70-year-old woman with sleep apnea and Parkinson’s disease; note the features of an irregular sleep-wake cycle disorder and lost sleep-wake consolidation. Sleep hygiene and light/dark measures did not improve this pattern. On the right is a 70-year-old woman with frontotemporal dementia. There is variability in use of positive pressure therapy, use during naps that are irregular in timing and duration, and variability in sleep onset and offset.
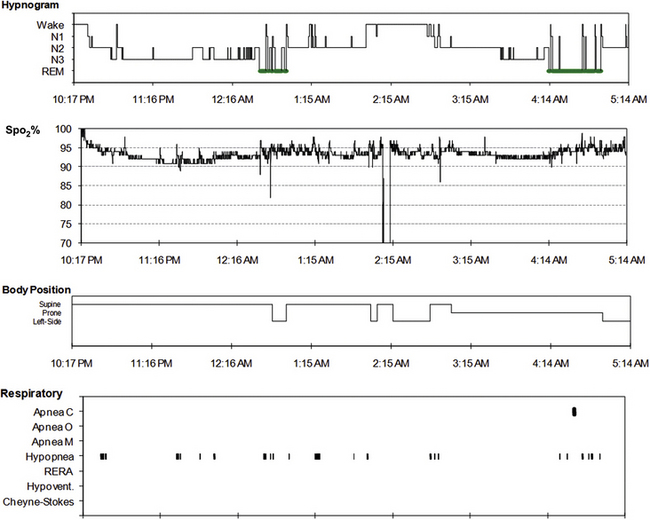
FIGURE 6.10 Possible obstructive hypoventilation during slow wave sleep.
A 25-year-old man with a body mass index of 44 kg/m2. This diagnostic polysomnogram shows “sag” of the oximetry values during both stage N3 and relative paucity of discrete respiratory events. End-tidal CO2 was not monitored during this study—it would have provided a more definitive measure of hypoventilation.
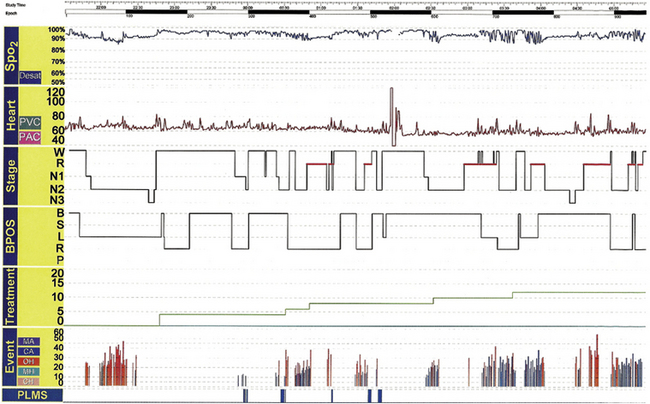
FIGURE 6.11 Predominantly central sleep apnea.
A 62-year-old man with typical symptoms of sleep apnea and no other medical comorbidities. Note the persistence of respiratory events during positive pressure titration, the progressive emergence of central apneas, and some parts of rapid eye movement sleep with reduced respiratory events. The patient was ultimately treated with ResMed VPAP Adapt SV, supplemental oxygen, and 50 mL of enhanced expiratory rebreathing space.
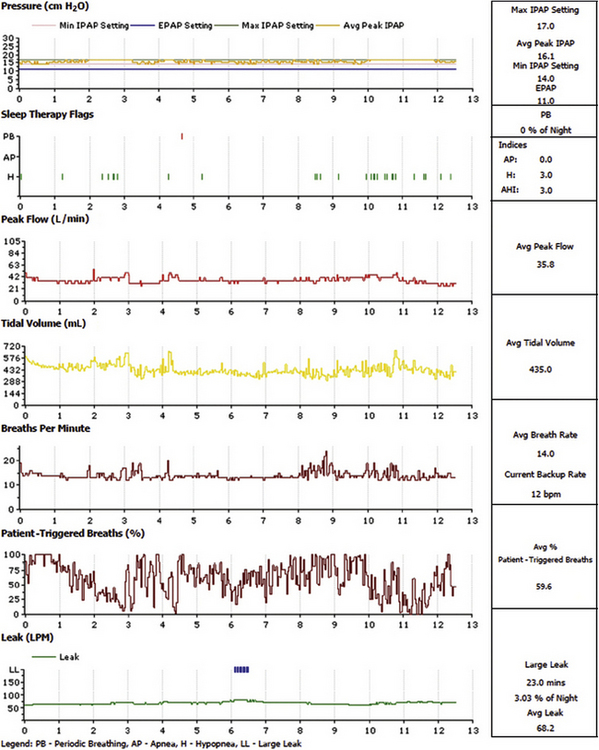
FIGURE 6.12 Compliance-based respiratory hypnograph in kyphoscoliosis and ventilatory failure.
The figure is an example of the excellent data-tracking capabilities of current respiratory therapy devices and the utility of such graphing to provide a new type of hypnogram across several nights. From top are the pressure settings, detected apneas and hypopneas, and average peak flow, tidal volumes, and breath rate. The percentage of patient-triggered breaths is an important measure, attesting to the ventilator dependence of this patient. Tracking this metric would be one method of assessing general health of this patient. The wide variations in this patient is bothersome and may reflect fluid and acid-base status, leak, body position effects, pulmonary function, and cardiac function. The average leak is rather high, and a mask fitting should be considered.
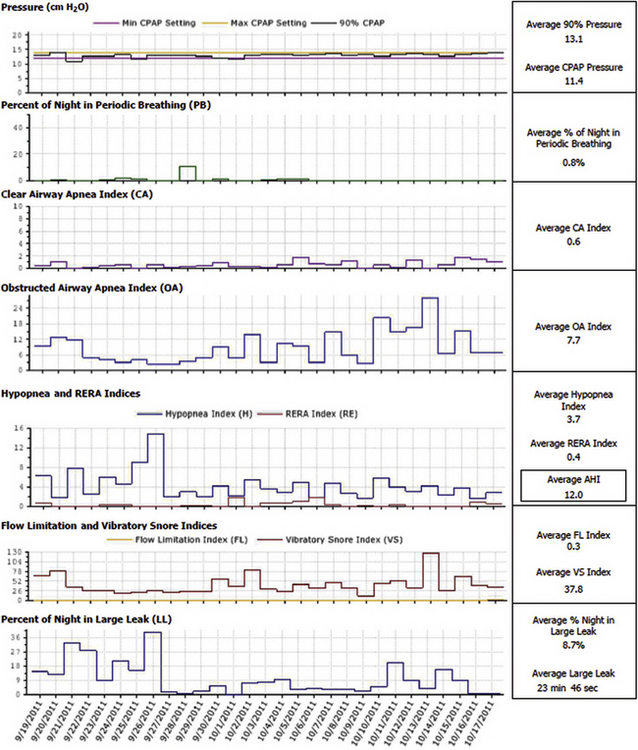
FIGURE 6.13 Compliance-based respiratory hypnograph in obstructive sleep apnea.
A 1-month period of tracking showing an unacceptably high residual apnea-hypopnea index (AHI). Note that there is some but not perfect matching of average leak and the residual respiratory index. There is minimal machine-detected periodic breathing and central apneas, but clinically important events may be subthreshold to machine-based detection. If a mask fitting and improved leak does not reduce the residual events, a retitration in the sleep laboratory may be considered, including approaches to manage complex sleep apnea.
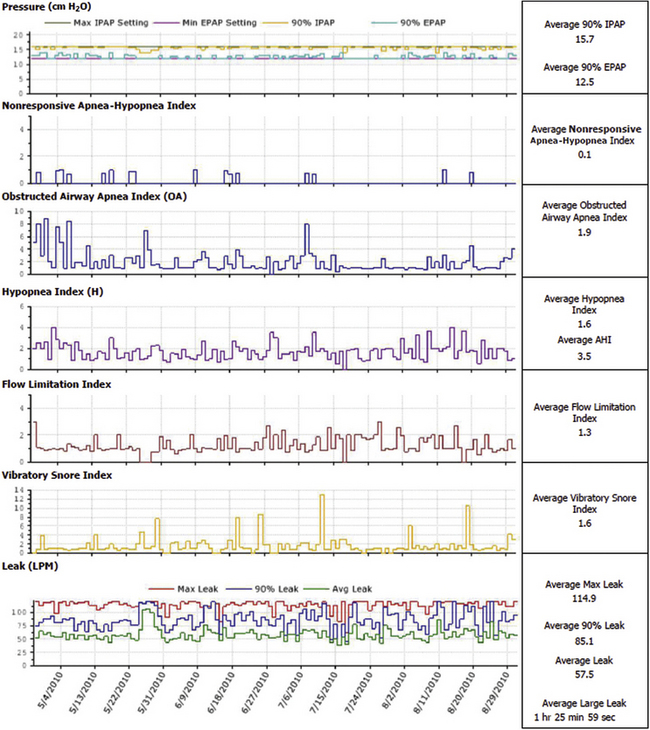
FIGURE 6.14 Compliance-based respiratory hypnograph showing a leak problem.
In this instance the data clearly suggest excessive leaks (bottom of the graph). Single-night expanded graphs are also available to assess time-of-night effects on leak. Therapy devices do not currently integrate body position monitoring—such capability would be clinically useful.
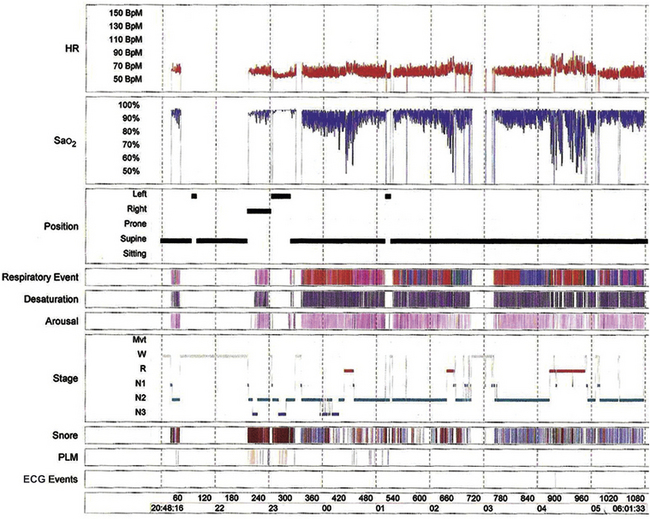
FIGURE 6.15 Severe sleep apnea.
Hypnogram showing severe obstructive, mixed, and central apneas-hypopneas (apnea-hypopnea index of 67/hr) associated with event-related hypoxemia in a 46-year-old man with a history of habitual snoring, gasping/choking in sleep, witnessed apneas, and excessive daytime sleepiness. He also has hypertension and type 2 diabetes mellitus. His body mass index is 29 kg/m2. ECG, Electrocardiographic; HR, heart rate; PLM, periodic limb movements; SaO2, arterial oxygen saturation by finger oximetry.
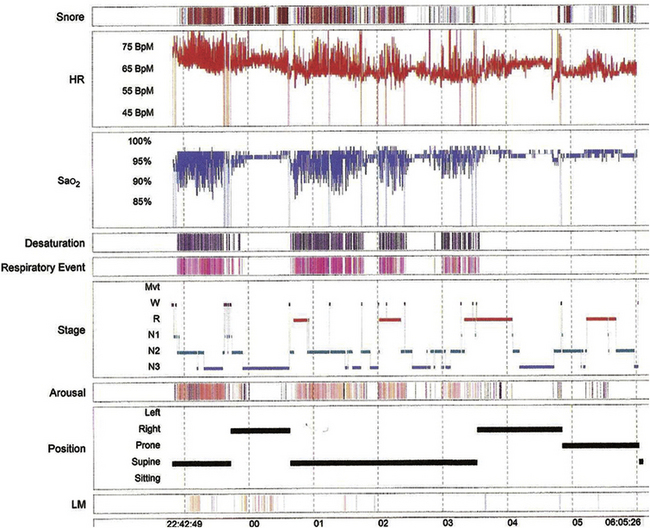
FIGURE 6.16 Supine-specific obstructive sleep apnea.
A 28-year-old man presented with loud snoring, witnessed apneas, and excessive daytime sleepiness, with bilaterally enlarged tonsils. His body mass index was 33 kg/m2. The hypnogram shows clustering of frequent obstructive apneas and hypopneas in the supine position. The apnea-hypopnea index (AHI) was 62.3/hr in the supine position with oxygen desaturations (O2 saturation less than 90% for 2.1% of the total sleep time); AHI was 2.4/hr in the lateral positions. HR, Heart rate; LM, leg movements; SaO2, arterial oxygen saturation by finger oximetry.
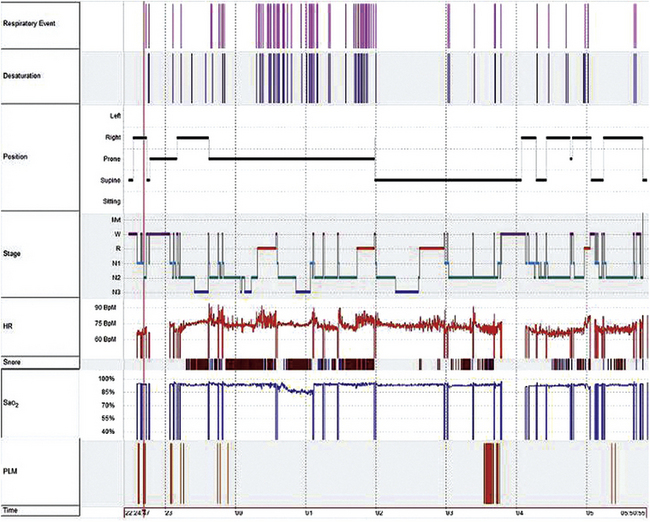
FIGURE 6.17 Prone-predominant obstructive sleep apnea.
A 61-year-old woman presented with excessive daytime sleepiness, snoring, and frequent nasal congestion and stuffiness. Her body mass index was 22 kg/m2. Hypnogram shows mild obstructive sleep apnea (apnea-hypopnea index [AHI] of 11.5/hr), but recurrent episodes of moderate obstructive sleep-apnea-hypopnea in the prone position (AHI of 47/hr). Prone position induced more severe apnea than supine or lateral position; an unusual finding that may have been related to nasal obstruction in this patient. HR, Heart rate; PLM, periodic limb movements; SaO2, arterial oxygen saturation by finger oximetry.
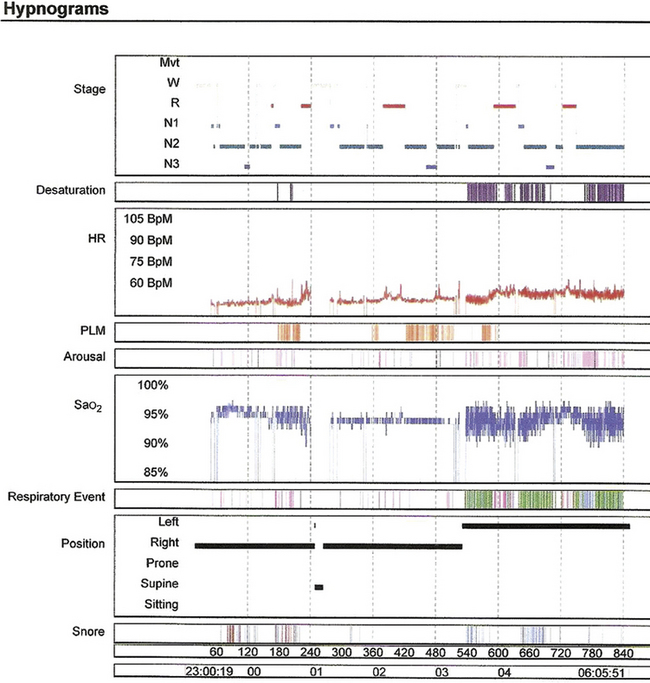
FIGURE 6.18 Cheyne-Stokes respiration worsening throughout the night.
Progressive worsening of respiratory events as the night progresses, with events maximal in the last third of the night independent of the body position and sleep stage. Hypnogram from an 81-year-old man with a history of excessive daytime sleepiness, disturbed nocturnal sleep, hypertension, and coronary artery disease. This pattern strongly suggests occult congestive cardiac failure. His overnight polysomnogram showed mixed and central apneas, including Cheyne-Stokes breathing. HR, Heart rate; PLM, periodic limb movements; SaO2, arterial oxygen saturation by finger oximetry.
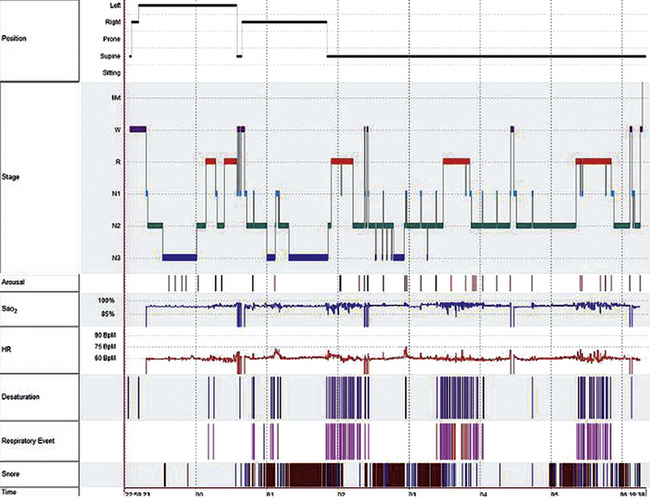
FIGURE 6.19 Rapid eye movement (REM)-predominant obstructive sleep apnea (OSA).
Hypnogram from the overnight polysomnogram of a 60-year-old woman with complaints of snoring and excessive daytime sleepiness. Note the clustering of respiratory events in supine REM sleep (supine REM apnea-hypopnea index [AHI] of 56.5/hr, non-REM AHI of 6.5/hr). The nature and natural history of REM-specific or REM-predominant OSA remains to be elucidated. HR, Heart rate; PLM, periodic limb movements; SaO2, arterial oxygen saturation by finger oximetry.