Two-dimensional distortion and flow of a monolayer is analogous to the behaviour of a bulk phase in three dimensions. A wide range of surface mechanical behaviour can be demonstrated such as viscosity and elasticity in both dilatation and shear. Thus the surface elastic modulus Ks is given by:
and its reciprocal is the surface compressional compliance which, for a perfectly elastic film, is also the surface compressibility Cs given by
d being the film thickness which is of the order of 2 nm for monolayers. Thus a monolayer having a surface viscosity of 10−4 sP has a viscosity of about 500 P (= 50 N.s.m−2) over its thickness. A liquid with such a high viscosity would be termed ‘very thick’ so that monolayers having surface viscosities of the order of 1 sP or more would generally be regarded as solid.
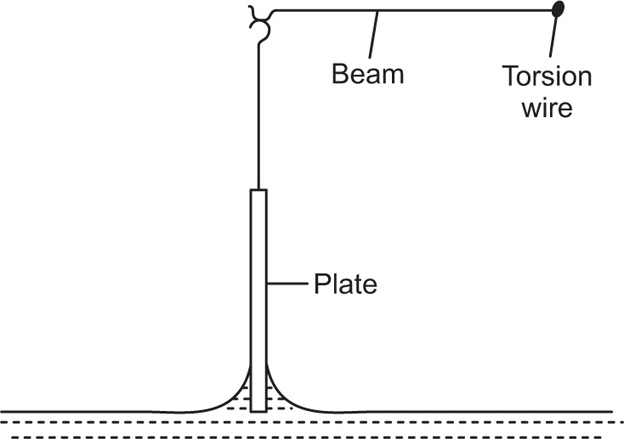
Another method, suitable for liquid–air surfaces, also uses two concentric rings but the inner one is rotated while the liquid is kept stationary. Liquid motion imparted by the rotating ring is kept to a minimum by placing a sheet of mica about 1mm below the surface. Other techniques that have been used include those which determine the damping of the oscillations of a torsion pendulum.
Creep tests can also be used to study the viscoelastic behaviour of films. This is best achieved by applying a constant torsional stress to a ring or biconical disc suspended in the interface from a torsion wire and observing the displacement with time. The ring or disc must be concentric with the circular dish.
Structure and State of Monolayers
Just as the bulk state is affected by the three dimensional pressure (
P) so changes in surface pressure (
π) can alter the state of a monolayer. By the equation analogous to
Eq. 5.31:

it follows that if the monolayer thickness is 2nm, then a surface pressure of 2mN.m−1 is equivalent to a bulk pressure of 1MN.m−2 or about ten times atmospheric pressure. Since surface pressures well in excess of 20mN.m−1 are frequently encountered, it will be appreciated that such monolayers have a strong tendency to maintain their integrity without collapsing and in so doing they exhibit a surface compressibility equivalent to the bulk compressibility of solids or liquids.
The surface pressure of a monolayer is the resultant of three components: that due to kinetic motion (πk), that due to electrostatic repulsion (πr), and the opposing effect due to cohesional forces (π) which is always negative. Thus:

The effect of these pressure components can be seen in
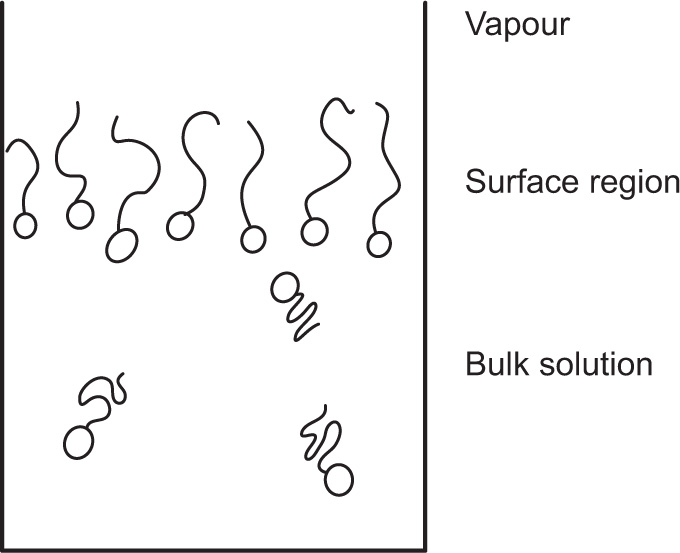
Fig. 5.43. Unionized molecules of straight chain fatty acids or alcohols can pack very closely to each other in vertical orientation and cohesion due to van der Waals forces is large. If a large area is available, these form large clusters up to several millimetres in diameter and exert only a very small surface pressure. These clusters behave rather like a two-dimensional liquid with a few
‘gaseous’ molecules in between: Only when the available area is decreased so that the groups begin to pack tightly does
π increase appreciably. Further compression of the monolayers results in large values of
π with only a small decrease in
A when the compressibility becomes even smaller due to the attainment of a two-dimensional solid state. A little more compression then results in collapse of the film.
A double bond in the hydrocarbon chain particularly with a cis configuration prevents close packing of the molecules and reduces interchain cohesion. The monolayer therefore is much more expanded than with saturated-chain acids. Similar behaviour is also observed with other polarizable groups in the hydrocarbon chain such as with hydroxy acids. At large areas both polar groups become anchored to the aqueous substrate so that the molecule occupies a much larger area than when vertically orientated. Appreciable pressures are required to detach the second polar group and to force the molecules into a more or less vertical Orientation. This monolayer then has the character of an expanded liquid with the hydrocarbon chains in a more random state than with straight saturated chains and consequently a higher compressibility. Further compression will force the molecules into a closer packing with a smaller compressibility having the character of a condensed film before collapse occurs.
An ionized monolayer, spread on a salt solution in order to reduce its solubility, has an appreciable surface pressure even at very large available areas. Repulsion between the polar groups overcomes the cohesional forces causing the molecules to fill the surface in a manner analogous to a gas filling an available space. These monolayers are therefore termed gaseous.
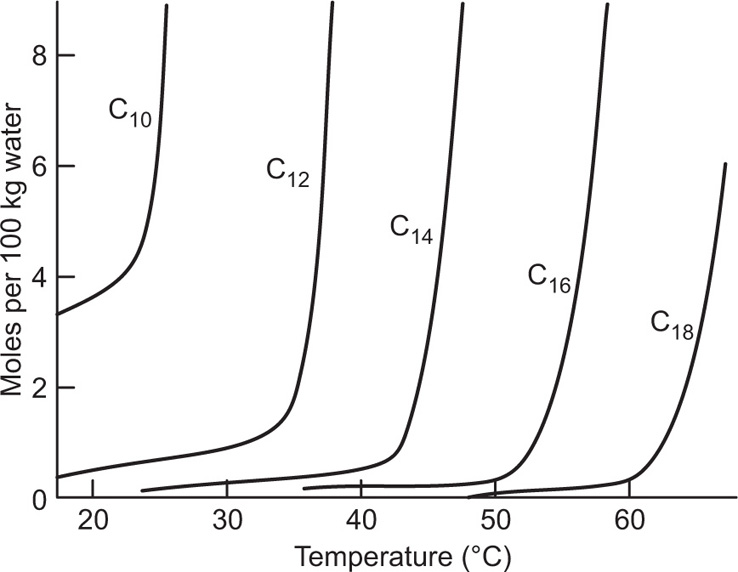
Interchain cohesion increases with length of the hydrocarbon chains.
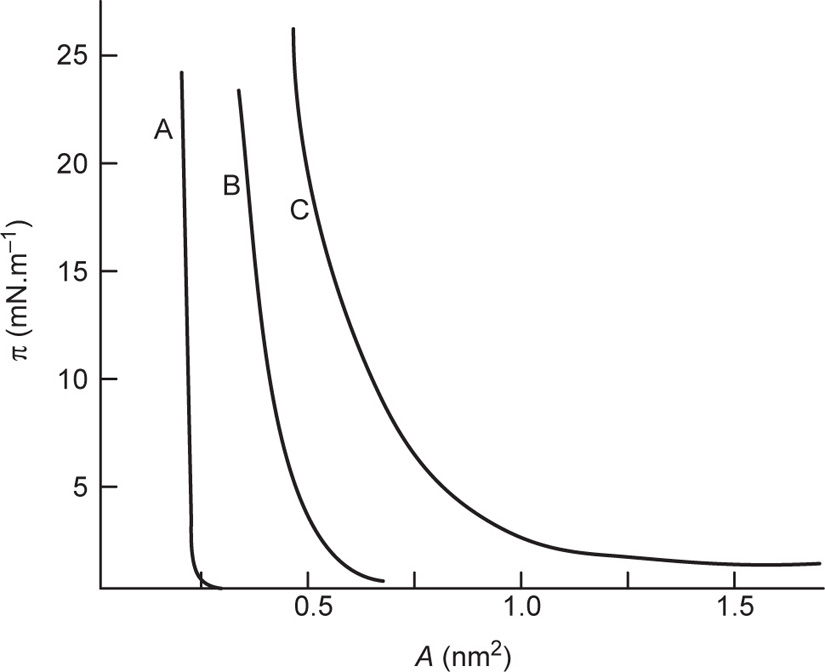
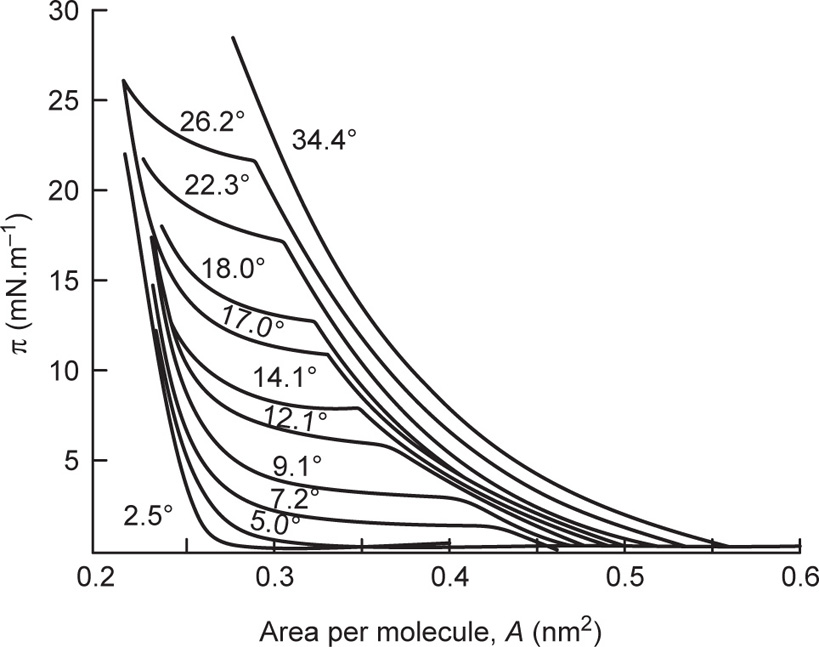
Figs. 5.44 and
5.45 show the effect of chain length, and temperature upon the
π−
A curves for fatty acids.
Fig. 5.44 demonstrates a remarkable similarity to Andrew’s
P–
V curves for a gas above and below the critical temperature suggesting that an increase in interchain cohesion results in a higher critical temperature. The shallow curves on the right hand side of the figure represent highly compressible gaseous films while the steep portions on the left are produced by liquid-like films of low compressibility. For fatty acids below the critical temperature (in
Fig. 5.44 at about 14° with more than 12
c atoms) a horizontal portion represents a first order transition, that is, d
A/d
π becomes infinite. Monolayers having a mean area per molecule lying within this transition are composed of discontinuous regions some/with coherent molecules, the rest being gaseous. Such a condition leads to surface potentials which fluctuate from one part of the surface to another.
The extreme left hand portion of
Fig. 5.44 for the C
14 acid has been enlarged in
Fig. 5.45, which shows the effect of temperature upon the liquid-like state. The steep curves on the right hand side are those for the
liquid-expanded state whilst on the left
hand side the condensed state is found. Between these two states is another transition, this time for a second order where d
A/d
π is finite. It is known as a
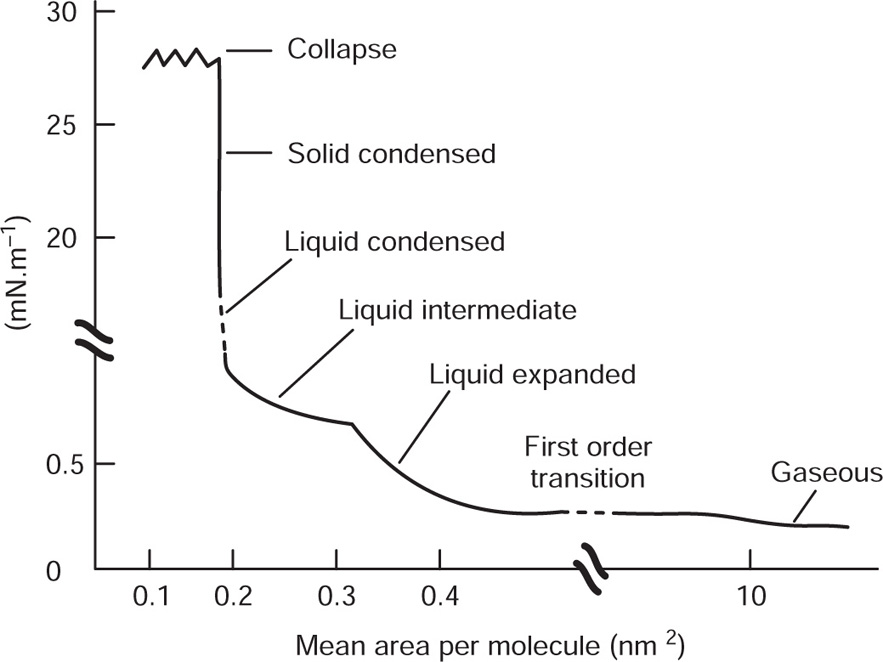
liquid-intermediate state and has a higher compressibility than either the liquid-condensed or liquid-expanded states. This transition probably involves the loss of rotational freedom about the long axis of the molecules thereby creating further area for close packing. The sequence of phase changes is summarized in
Fig. 5.46. Not all states are given by every compound or at all temperatures. For example, at low temperatures a liquid condensed film may change directly into a gaseous film. Some workers have also distinguished other states such as the
superliquid, which is rheologically liquid but has a compressibility like that of a solid film; cetyl alcohol behaves in this manner.
By analogy with a gas, the simple equation of state for a gaseous film is
 (5.33)
where
k is the Boltzmann constant, that is, the gas constant per molecule (
R/N). This assumes that the film pressure has no contribution from cohesional or electrostatic repulsive forces and is due only to kinetic motion so that
π =
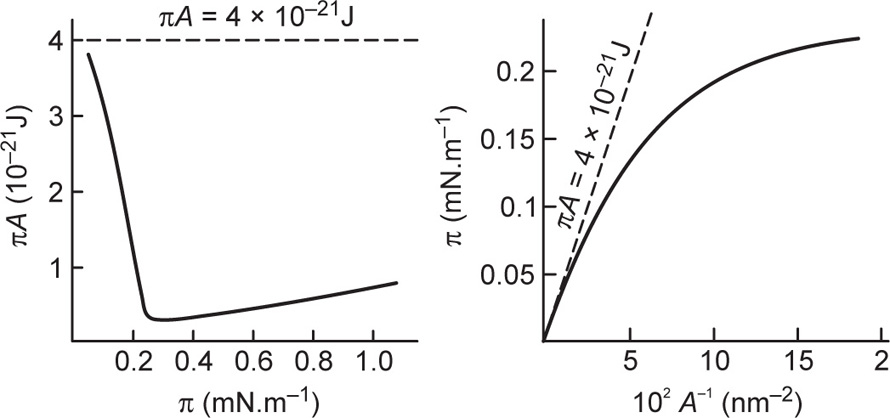
πk Thus
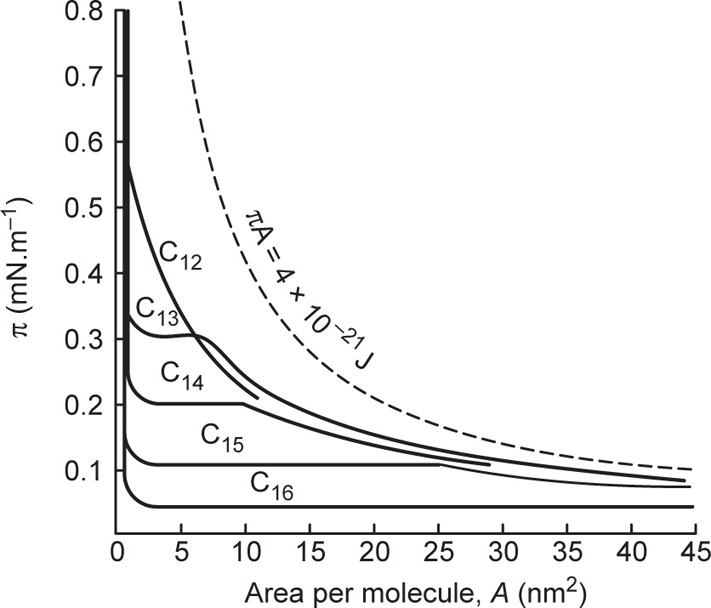
Eq. 5.33 is a limiting law and can be represented by a rectangular hyperbola having a value of about 4 × 10
−21 J at room temperature (see also
Fig. 5.44). Gaseous films tend to approximate to such a curve only at areas per molecule approaching 100 nm
2 as shown in
Fig. 5.47.
This ideal gaseous film equation (
Eq. 5.33) suggests that
A becomes vanishingly small as
π becomes very large. A better equation of state is obtained by taking into account the effective area (
Ao) of the molecule when
 (5.34)
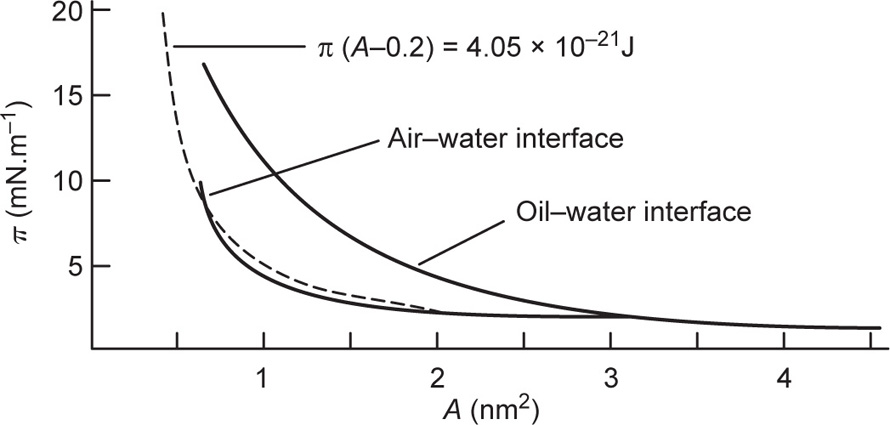
Films likely to obey
Eq. 5.34 are those which are uncharged (
πr = 0) and which have no interchain cohesion
(πo = 0). Interchain cohesion is virtually eliminated at an oil–water interface since the oil molecules penetrate between the hydrocarbon chains and satisfy their London attraction forces (
Fig. 5.48). This leads to greater surface pressures for a given area per molecule at the oil–water interface. The surface pressures of films of quaternary ammonium ions do however have an electrostatic repulsion component and the
π(
A − Ao) hyperbola is therefore not coincident with the curve for the oil–water interface. Approximate coincidence with the curve for the air–water surface implies that the cohesive forces and the electrostatic repulsive forces are opposite and of nearly equal magnitude.
Interchain cohesion becomes appreciable in gaseous films under high surface pressure or in liquid-expanded films. For an uncharged film
π=
πk+
π0 whence
πk=
π−
π0 and
Eq. 5.34 becomes

This equation of state is analogous to the van der Waals equation for real gases and in the case of liquid-expanded films π0 is nearly independent of A.
Since condensed films have nearly linear π−A plots, their equation of state can be written

where
a and
b are constant for a given compound and set of physicochemical conditions. Comparison with
Eq. 5.30 shows that
aA is tilt: surface compressional modulus

.
Extrapolation of a linear plot to zero pressure gives information concerning the packing and orientation of the film molecules. Saturated straight long-chain fatty acids at room temperature show both the liquid and solid condensed states with limiting
areas (
A0) per molecules of about 0.24–0.26 nm
2 and 0.203–0.205 nm
2, respectively. These areas are independent of chain length at a water air surface (although not at a water–oil–interface) and indicate a vertically orientated monolayer. That of the solid condensed state is about 0.02
nm
2 greater than the area of cross section (0.185 nm
2) in the three-dimensional crystal.
At high surface pressures, many straight-chain compounds have limiting areas of about 0.205nm2 Besides the fatty acids, this is found with alcohols, amides and esters where staggering of the polar groups allows the area to be limited only by the interlocked hydrocarbon chains. Since the cross section of the polar groups is larger than that of the chains, a larger limiting area is often found at low surface pressures; for example, alcohols and esters pack to about 0.22 nm2 and nitriles to about 0.27 nm2. However, association between the polar groups by hydrogen bonding, with amides for example, may ensure a low limiting area given at low surface pressures.
For a given surface pressure, the area per molecule of a liquid-condensed film decreases slightly with an increase in chain length due to the increased interchain cohesion. Thus at 5mN.m−1 and 25° a hexadecanoic acid molecule occupies 0.24 nm2 whereas an eicosanoic acid molecule occupies only 0.23 nm2. Under these conditions, tetradecanoic acid would form only an expanded film with an area per molecule of 0.37 nm2.
The effect of an unsaturated bond depends upon the position and configuration. A double bond near the middle of the chain with a cis configuration produces too much bending of the chain for a condensed film to form whereas the chain of a trans compound is straighter and can produce such a film. Condensed films also form if the double bond is next to a terminal carboxyl group, the liquid condensed phase then having a limiting area of 0.287 nm2.
Sterichindrance to close packing also results from chain branching. Thus 16-methylheptadecanoic acid forms a much more expanded film than octadecanoic acid although both are saturated C18 acids. If the methyl group is near the middle of the chain, the film is even more expanded for a given surface pressure.
Sterols such as cholesterol with a hydroxyl group at the 3 position also form condensed films with a limiting area between 0.37 and 0.42 nm2 according to the stereochemical configuration of the A and B rings. Such molecules tend to stand nearly upright at a surface, packing closely to form a film of low compressibility. The tilt of the sterol nucleus is affected by the type and position of the polar group. Sometimes the molecules are caused to lie nearly flat at low surface pressures and consequently they possess large limiting areas. Such films have a much greater compressibility than cholesterol.
A liquid condensed film of a straight-chain fatty acid has been shown to have an appreciable compressibility, the area per molecule decreasing from about 0.25 to about 0.205 nm2 due to a rearrangement of the carboxyl groups. The polar groups of L-monoglycerides are also closely packed with a limiting area of about 0.263 nm2 but are not rearranged by compression. Their low compressibility suggests that the molecules are held apart bi structure formation between the polar groups. The head groups of p-alkyl-phenols are also closely packed with a limiting area of 0.24 nm2. Low compressibility in this case suggests that the benzene rings are vertically orientated in a closely packed layer about 0.6 nm thick and that these take up the whole of the compression.
The areas quoted above refer to unionized films and for fatty acids apply to films spread on dilute HCl or on fresh very pure water. On water, trace contaminants such as polyvalent cations may eliminate the liquid-condensed state causing the solid state to persist down to low film pressures. Alkaline substrates cause ionization and expansion of fatty acid monolayers. Although electrostatic repulsion between ionized carboxyl groups would be expected to have some effect, association of the carboxyl groups with the hydrated cations appears to be the prime cause of the expansion. Liquid-expanded films of octadecanoic acid are produced at pH 13 on solutions of LiOH, NaOH and KOH and it is probable that the size of the hydrated cation in the surface increases in the order Li, Na and K, producing the same order of effect upon expansion of the monolayer. Traces of Ca ions, however, markedly reduce the expansion effected by monovalent cations. At pH 8.5, using bicarbonates, compression of the now incompletely ionized monolayer causes monovalent cations to be ejected. These changes in the condition of the monolayer are reflected in tile surface potential which becomes considerably reduced by dipolar opposition of the counterions.
The conclusion, therefore, is that the state of a given monolayer and its transition from one state to another is influenced by three independent variables. These are the temperature, surface pressure and the extent to which the polar groups interact with the liquid substrate. In the latter case this is affected by the composition of the substrate such as the presence of electrolytes and the prevailing pH. Additional to these factors the configuration and size of the hydrophobic groups influence the cohesive forces and extent of packing of different monolayers.
Mixed Monolayers
While monolayers of water-insoluble amphipaths such as octadecanoic acid tend to be coherent, those composed of less hydrophobic substances tend to be fully solvated, that is, they are penetrated by water to form two-dimensional aqueous solutions. Compression of such monolayers causes the water molecules to be squeezed out at some critical pressure which is less than 0.1mN.m-1 in the case of octadecanoic acid but between 28 and 30mN.m−1 for sodium dodecylsulphate.
Water-soluble surfactants can also penetrate into an insoluble monolayer, the free energy of the penetrant molecules being decreased by dilution in the monolayer. The excess free energy of mixing monolayers of long-chain alcohols with some ionic surfactants has been shown to be a minimum when the monolayer contains equimolecular proportions of the two components. Interchain cohesion and screening of the ionic groups by the intervening alcohol groups are both probably involved in maintaining the integrity of the mixed monolayer.
Molecular association between two components requires a strong interaction between the polar groups but this is accompanied by monolayer penetration only if the soluble molecules have large enough hydrocarbon groups whereby they can form a strong interchain cohesion with the insoluble molecule. Sometimes the association in the· monolayer is strong enough for stoichiometric complexes to be distinguished. Thus a cholesterol film on NaCl solution has a limiting area per molecule of about 0.4 nm2. If the film is expanded and sodium hexadecylsulphate is injected underneath, a very large rise in surface pressure occurs upon recompression with collapse at about 0.6 nm2 per cholesterol molecule. This indicates that some hexadecylsulphate molecules become squeezed out of the monolayer upon compression but that type remaining molecules strongly adhere in a 1:1 ratio. The surface complex is less stable in the absence of salt. Some hexadecylsulphate also appears to be adsorbed underneath the monolayer and this may enhance the stability of the film.
Similar 1:1 complexes have been found to form between other amphipaths such as between cholesterol and the steroidal saponin digitonin while 1:2 or 1:3 complexes have been detected with some other substances. Many other mixed monolayers also have collapse pressures and areas larger than those of the pure insoluble component but not all form stable ‘complexes’. Thus molecular association occurs between long-chain alcohols and sodium hexadecylsulphate but a stoichiometric relationship is not found. In such cases the association is strongest when the alcohol possesses a straight hydrocarbon chain.
Surface association is paralleled in bulk solution by the formation of mixed micelles or liquid crystals. A thermolabile complex of cholesterol and digitonin can crystallize from alcohol. Complexing may also affect certain properties in the bulk phase. Thus sodium hexadecylsulphate loses its haemolytic power and is not precipitated by silver nitrate when its solutions contain an equimolar proportion of cholesterol. The extent of molecular association at a water–oil interface is also implicated in the stability of emulsions and may involve multilayer formation.
Monolayer penetration may be accompanied by a change in the physical state of the film. Thus a solid film of ergosterol becomes liquid on injection of saponin or sodium hexadecylsulphate into the substrate whilst a liquid film of cholesterol becomes solid op injection of saponin but remains unchanged with sodium hexadecylsulphate.
If cholesterol is added to a liquid expanded film of a long-chain fatty acid in the molecular proportion of 1:4, the bulky cholesterol molecule restricts the oscillatory motion of the acid molecules causing them to occupy the smaller area of a condensed film. A mixed monolayer of cholesterol and lecithin also occupies a smaller area for a given surface pressure than the sum of the areas of the separate components. Although it has been suggested that the components of the film form molecular complexes, it would seem that the mean molecular area simply reflects the best arrangement of the molecules in accordance with their mutual attractive forces.
Biological Membranes
Multimolecular films form the boundary around all living cells and organelles such as mitochondria and chloroplasts. They are composed of lipids and protein molecules held together by hydrophobic and electrostatic interactions to form lipoprotein.
The lipids consist of nonionic amphipaths such as cholesterol and amphoteric amphipaths called
compound lipids. Compound lipids are long-chain fatty acid esters of alcohols containing other polar groups; for example, a glycerophospholipid is based upon glycerol which contains a phosphoric acid residue and a nitrogenous base this being choline in the case of lecithins
(p. 57). Another phospholipid is based upon inositol while the sphingolipids are derived from the unsaturated amino alcohol, sphingosine. Hydrolysis of some compound lipids also yields sugars such as galactose from cerebrosides and sialic acids from gangliosides. Phospholipids predominate in animal cells.
Membranes differ considerably in their lipid and protein content according to their source and function. Thus myelin membranes contain a dry weight fraction of over 0.7 of lipid whereas rat liver mitochondria membranes contain less than 0.3, proteins making up most of the remaining weight. The proportion of cholesterol in the lipid also varies considerably, constituting about 0.4 of myelin lipid but only 0.06–0.14 of mitochondrial lipid and being absent from chloroplast lipid, while bacterial membranes contain little or no cholesterol.
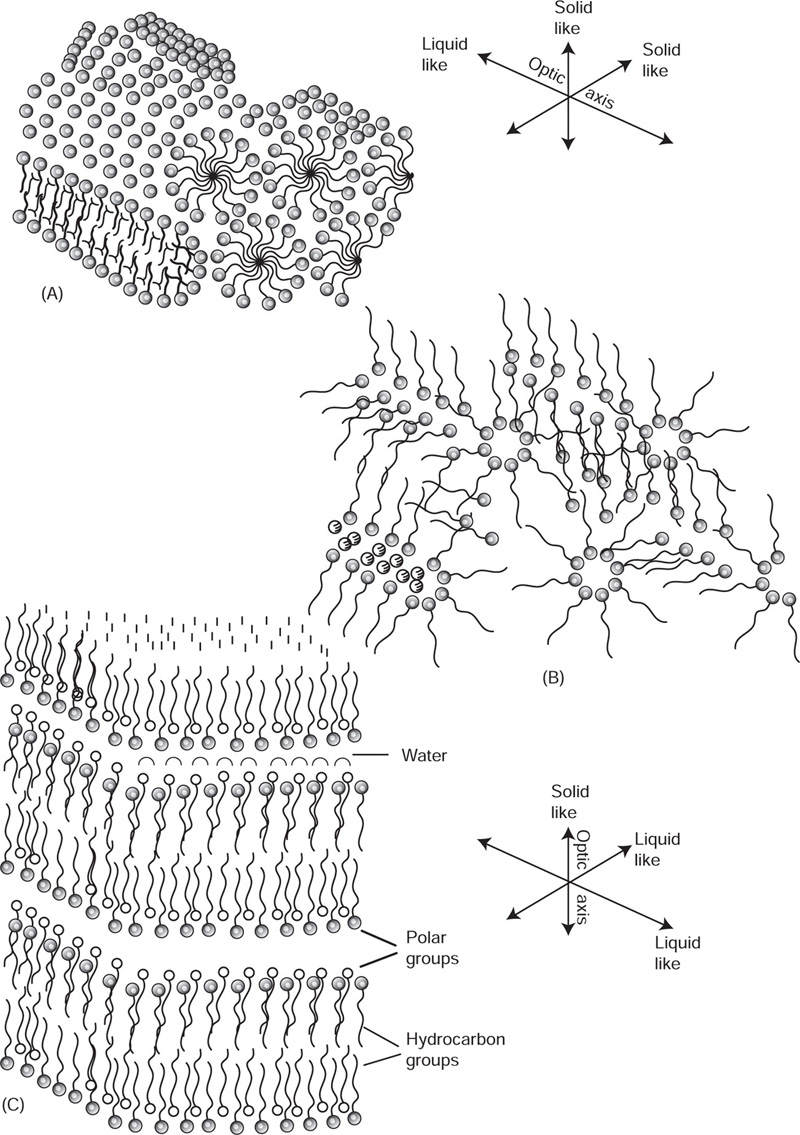
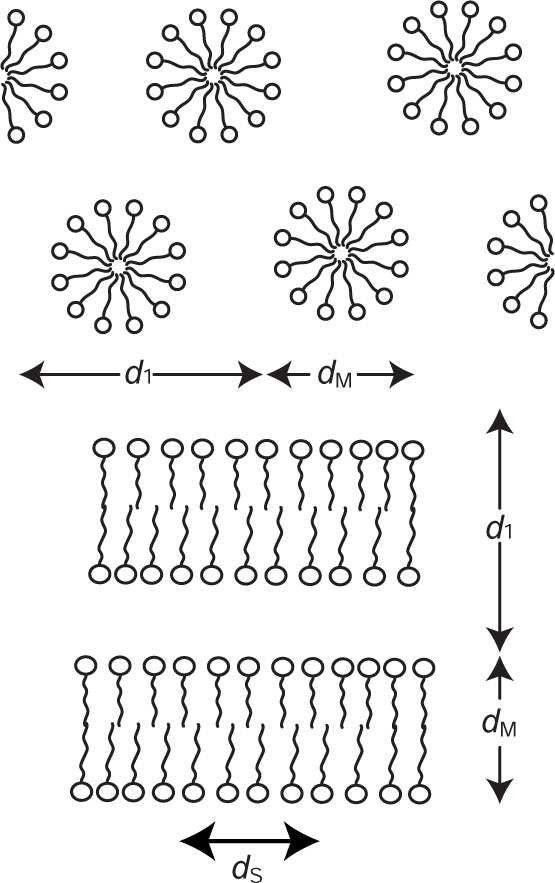
Unlike films formed at an air–water or an oil–water interface, biological membranes are bounded on either side by an essentially aqueous environment. This requires that a multilayer be formed with the hydrophobic groups orientated towards each other inside the membrane, with the more polar groups or molecules exposed on the surface. If the lipids are extracted from erythrocyte membranes and spread as a monolayer upon water they occupy twice the area of the original erythrocyte surface demonstrating that the lipid portion of the membrane is two molecules thick.
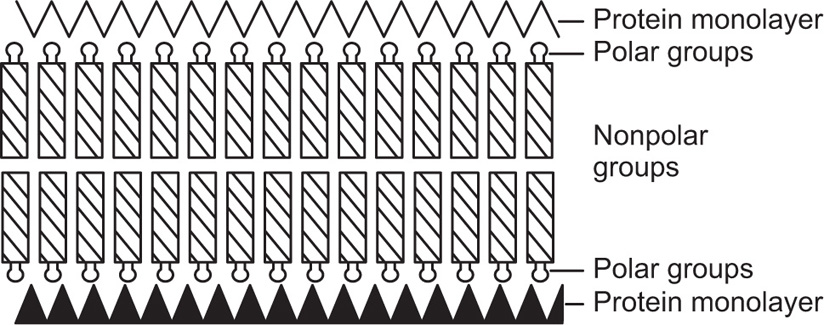
Danielli and Davson proposed that cell membranes consist of a biomolecular lipid leaflet bounded on either side with a layer of protein molecules (
Fig. 5.49). Electron microscopic evidence for such a structure in membranes forming the myelin sheath of nerves has been obtained by
Robertson (1967) where the bimolecular lipoprotein forms a repeating unit about 7.5 nm thick. However the protein does not appear to be held on the outside of the lipid bilayer merely by coulomb interaction but some portions of the protein molecules must penetrate to the interior where they are held by hydrophobic interactions.
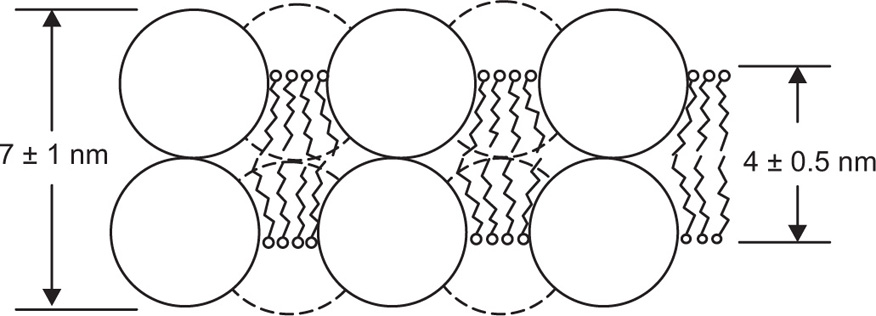
Myelin lipids contain a high proportion of saturated and long-chain fatty acids which favours the formation of a condensed bilayer. Although containing a considerable proportion of polyunsaturated fatty acid esters, human erythrocyte lipids can also form a condensed bilayer within most of the membrane due to the condensing effect of the high proportion (0.42) of cholesterol. Such tightly organized membranes function as permeability barriers. On the other hand, membranes such as those of mitochondria and chloroplasts, which are associated with the metabolic activity of the cell, contain lipids which are rich in polyunsaturated or branched-chain fatty acid esters and contain little or no cholesterol. These are unable to form condensed bilayers and are associated with a high proportion of protein. Other, more loosely organized, structures have been proposed for organelle membranes which involve two dimensional arrays of protein interposed by lipid (
O’Brien, 1967). One such model (
Fig. 5.50) consists of a bimolecular array of globular protein having predominantly nonpolar amino acids towards the centre of the layer, the cavities between the protein molecules containing the lipid bilayer. It would also appear that some protein molecules extend right across a single membrane and may even extend across two membranes when these are stacked together.
Membranes are not only essential for maintaining the integrity of cells and organelles, but play other vital roles. They are selective to the passage of substances into and out of the cell, ranging from electrolytes to large molecules. ‘Active transport’ mechanisms are frequently encountered which can be biochemically modified. The difference in permeability of ions together with the Donnan equilibrium gives rise to a resting electrical potential which if affected by increasing the permeability of Na+ ‘during stimulation’ gives rise to an action potential. Many enzymes are bound to membranes which therefore become the sites for certain metabolic pathways such as protein synthesis and respiration. Immunological reactions are also based at the membrane.
The structure and functions of biological membranes have been reviewed by
Gross (1971). Their study has been facilitated by the use of artificial membranes. The formation and properties of the latter have been reviewed by
Castleden (1969).
Chapman (1968) and
Sutton (1969) have also written short articles.


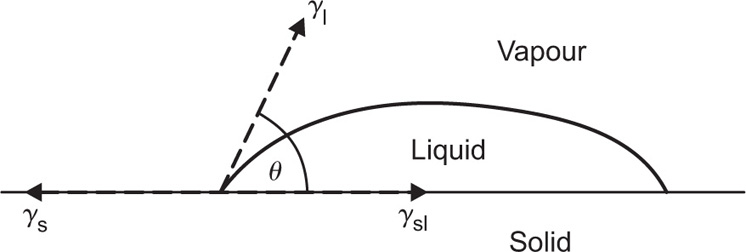
 , where
  and
and  denoting the polar interaction component. The separate tensions are thereby reduced to:
 (5.1)
(5.1) denotes that only the dispersion force interaction across the interface is taken into account
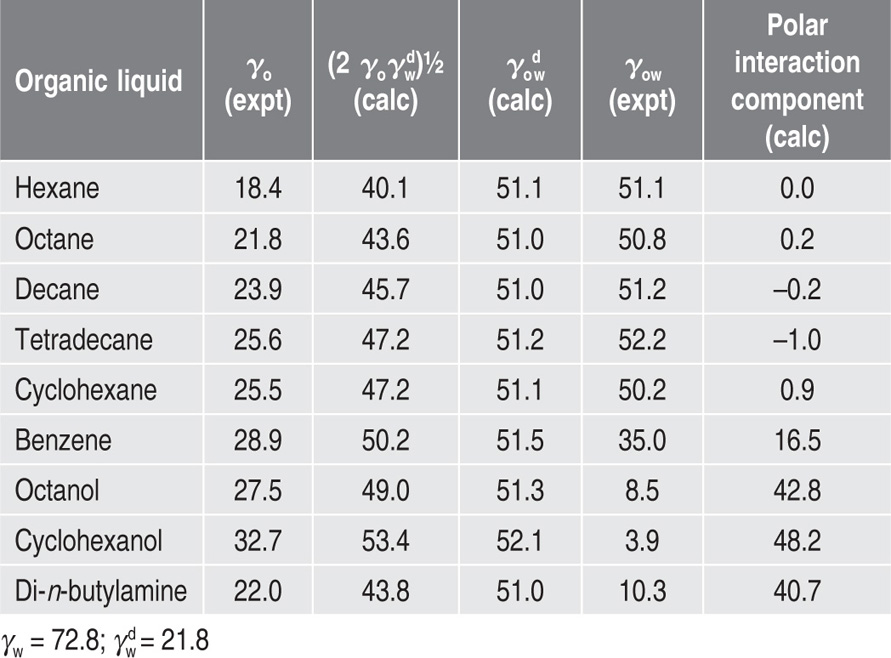

 (5.2)
(5.2) (5.3)
(5.3)

 (5.4)
(5.4)
 (5.5)
(5.5)
 (5.7)
(5.7) (5.8)
(5.8)

 (5.9)
(5.9)
 (5.10)
 (5.11)
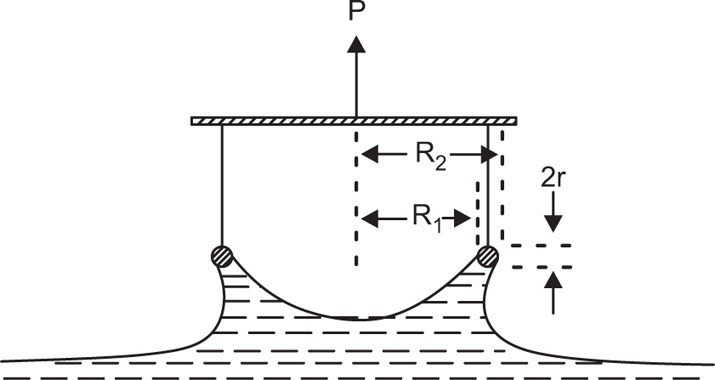

 (5.12)
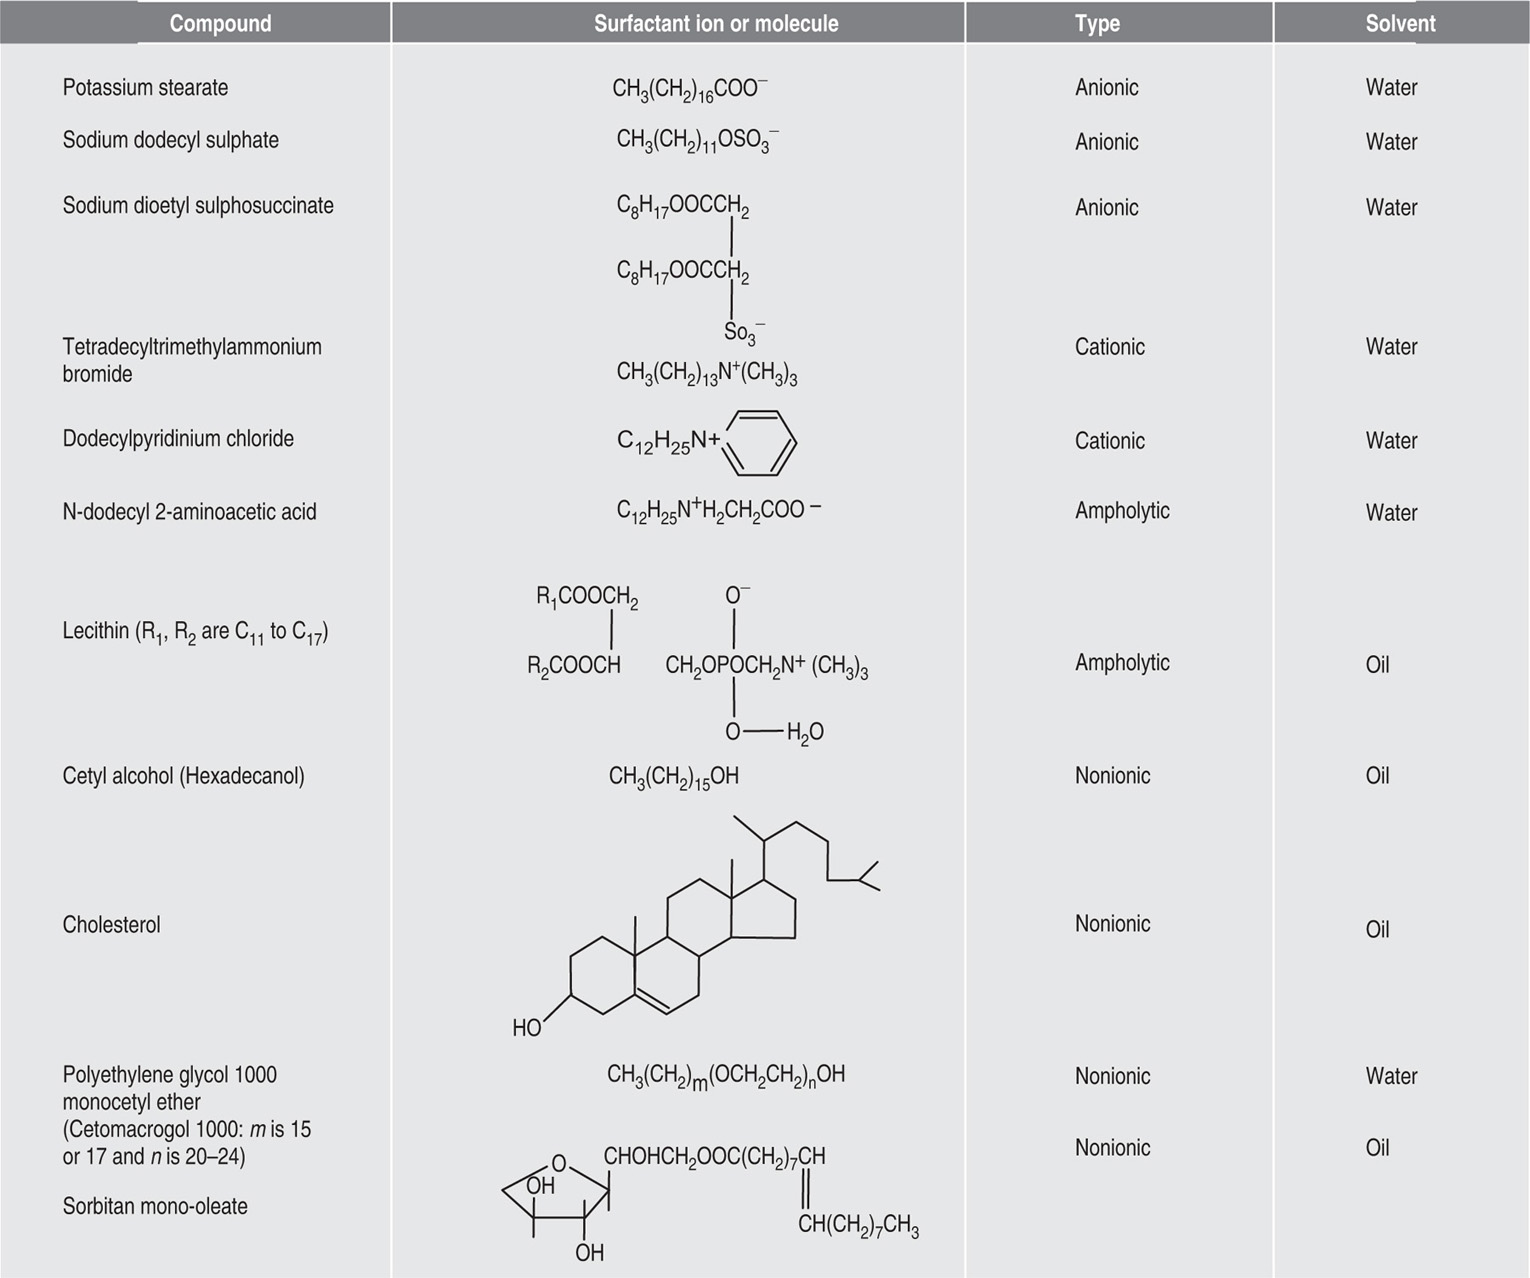
 (5.13)
 and
and  respectively, where Ss, Vs and ns may be positive or negative. Thus:


 (5.15)

 (5.16)
 .
.
 (5.17)
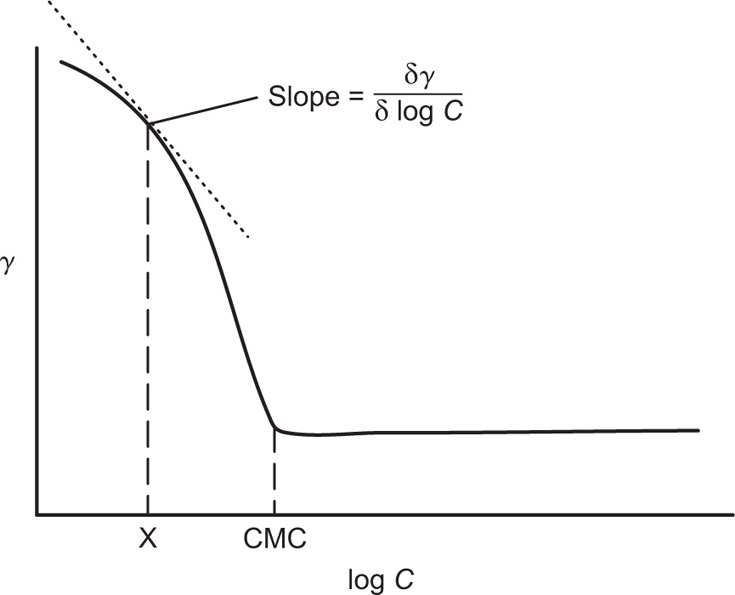
 . For a single univalent surface-active strong electrolyte (MA) in water:

 (5.18)
 (5.19)
 (5.20)
 (5.21)
 (5.22)
 (5.23)


 applies to a very thin surface and may be used to calculate surface packing where the area (m2) per mole of a monolayer is given by
  . It has been shown that very little additional electrolyte is in fact required and so an equation of the form of Eq. 5.20 holds only for solutions of extremely pure surface-active electrolytes.
 (5.24)
 (5.25)
 (5.26)
 (5.27)
 (5.28)
 (5.29)

 (5.30)
 which is known as the surface compressional modulus. The compressibility is readily calculated from π–A plots and its value depends upon the state of the film, it being small for closely packed monolayers having the character of a two-dimensional condensed state. The compressibility of a film and its relaxation time are important parameters governing the stability of foams and perhaps some emulsions. The various surface elastic moduli and their interrelationship have been described by Tschoegl (1958).
 (5.31)
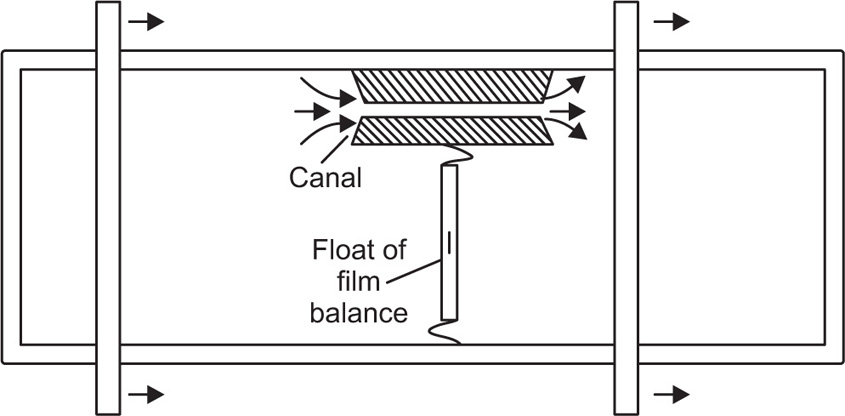
 (5.32)
 (5.35)
 (5.36)
 (5.37)
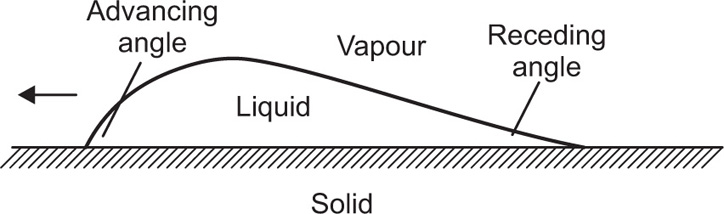

 (5.38)

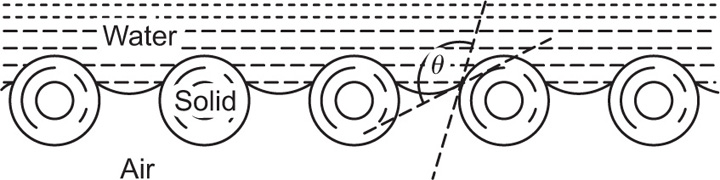
 can be considerably greater than 90°C. This is essential for tents and raincoats where the receding contact angle must be greater than 90°C for raindrops to ‘pearl’ off the fabric.