Intake
Analysis of the Diet
Nutrition status mirrors the degree to which physiologic nutrient needs are met for an individual. The balance between nutrient intake and nutrient requirements equals that nutrition status. When adequate nutrients are consumed to support the body’s daily needs, including any increased metabolic demands, the person moves into optimal nutrition status (Figure 4-1). Adequate intake promotes growth and development, maintains general health, supports activities of daily living, and helps protect the body from disease and illness.
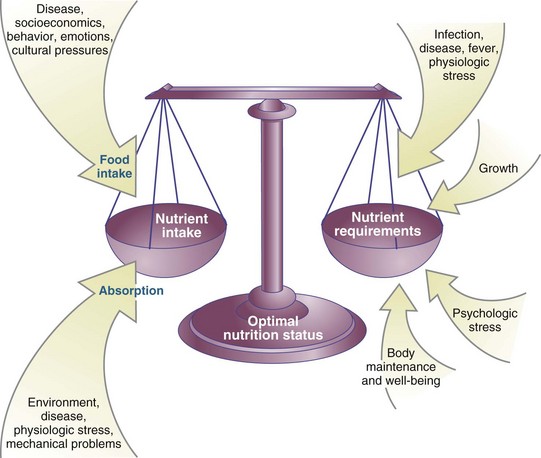
Accurate assessment of dietary intake is essential for researchers and public health practitioners to make advancements in public health, especially for population groups that display high disease prevalence rates (Fialkowski et al., 2010). Appropriate assessment techniques can detect a nutritional deficiency in the early stages of development, allowing dietary intake to be improved through nutrition support and counseling before a more severe condition develops. Personal intake is influenced by factors such as economic situation, eating behavior, emotional climate, cultural influences, effects of disease states on appetite, and the ability to acquire and absorb nutrients. Nutrient requirements are influenced by genetics, physiologic stressors such as infection, acute or chronic disease processes, fever, trauma; anabolic states such as pregnancy, childhood, or rehabilitation; overall body maintenance; and psychological stress.
Although a nutrition assessment can be performed routinely for any individual, ideal tools will differ for healthy versus critically ill individuals. Persons at nutritional risk can be identified on the basis of screening information that is routinely obtained at the time of admission to a hospital or nursing home, in a clinic setting, or after returning to home-based care. This information is then used to design an individualized nutrition care plan. A thorough assessment increases the likelihood that effective interventions will be applied to resolve the identified nutritional diagnoses.
Nutrition Imbalance
Nutrition is an important factor in the cause and management of several major causes of death and disability in contemporary society (Table 4-1) (Centers for Disease Control and Prevention [CDC], 2009b; Xu et al., 2009). Heart disease, strokes, diabetes, and most cancers are influenced by the type and amount of food consumed. Nutrition is also significant in major diseases such as obesity, anemia, and osteoporosis. In addition, cirrhosis of the liver and some accidents may be associated with excessive alcohol intake. Modifications in diet can assist in the prevention of disease, particularly for overweight and obese individuals. In addition, nutrition intake affects gene expression and vice versa, with implications for many disorders.
TABLE 4-1
Ranking of the Leading Causes of Death in the United States, 2005
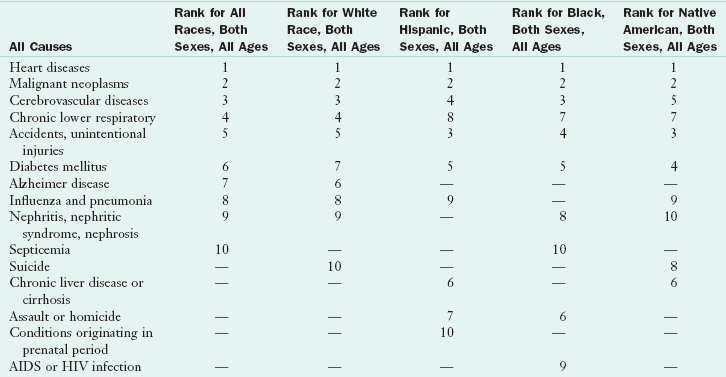
—, a ranking was not in the top 10 causes for the category; AIDS, Acquired immunodeficiency syndrome; HIV, human immunodeficiency virus.
From Heron M, Tejada-Vera B: Deaths: leading causes for 2005: national vital statistics reports, vol 58, no. 8, Hyattsville, Md, 2009, National Center for Health Statistics.
States of nutritional deficiency or excess occur when nutrient intake does not match an individual’s requirements for optimal health. Within the safe range of intake, homeostatic mechanisms allow the body to use nutrients equally effectively, with no detectable advantage gained by a specific intake. As deficiencies or excesses develop, adaptations are made to achieve a new steady state without any significant loss in physiologic function. As the intake departs further from the desirable range, the organism accommodates to the changing supply of nutrients by reducing the function, size, or status of the affected body compartments. The nutrition status of an individual is identified by the success or failure of these adaptations. For example, before iron deficiency anemia is diagnosed from measures of hematocrit, hemoglobin, and clinical signs, a gradual diminution in iron stores can be diagnosed on the basis of increased iron absorption, decreased serum ferritin levels, or bone marrow evaluation.
When nutritional reserves are depleted or intake is inadequate to meet daily metabolic needs, a state of undernutrition develops. Undernutrition may stem from inadequate ingestion, impaired digestion or absorption, dysfunctional metabolic processing, or increased excretion of essential nutrients. Infants, children, pregnant women, individuals with low incomes, hospitalized persons, and older adults are at the greatest risk for becoming undernourished. Impaired growth and development, lowered resistance to infection, delayed wound healing, poor clinical outcome from disease or trauma, development of chronic disease and increased morbidity and mortality may result.
Critically ill patients who have severe injury and stress can rapidly break down their body protein and energy stores; in such cases, malnutrition and protein wasting can negatively affect patient outcome (Btaiche et al., 2010). Hospital malnutrition was identified more than 30 years ago in a landmark article by Butterworth (1974), yet the problem continues today (DeLegge and Drake, 2007). It is estimated that in academic hospitals in the United States, 25% to 50% of patients show some type of malnutrition, generalized wasting, or protein depletion; this is most detrimental in a lengthy hospital stay.
Overnutrition also presents problems manifesting as obesity, diabetes, atherosclerotic heart disease, hypertension, and the metabolic syndrome. These conditions may also result in poor clinical outcomes. Obesity is associated with low-grade inflammation, high levels of inflammatory markers such as C-reactive protein, and proinflammatory cytokines. Obesity has reached epidemic proportions in the United States and in other parts of the world. One third of all adults are classified as obese and 300,000 deaths per year in the US are related to obesity (CDC, 2009a; USDHHS, 2007; 2009). Assessing the obese injured patient presents an even greater challenge. Screening tools that identify one to be at risk only when undernourished may label the injured obese patient as low risk and less likely to be identified as having the potential for increased morbidity. More appropriate tools are needed to accurately assess this population.
Nutritional well-being and the continuum of nutritional health are essential concepts to understand. Indeed, the best nutrition-based strategy for promoting optimal health and reducing the risk of chronic disease is to choose a wide variety of nutrient-rich foods and to use supplements when necessary (American Dietetic Association [ADA], 2009). Figure 4-2 illustrates the general sequence of steps leading to nutritional decline and the development of a nutritional deficiency, as well as areas in which an assessment can identify problems.
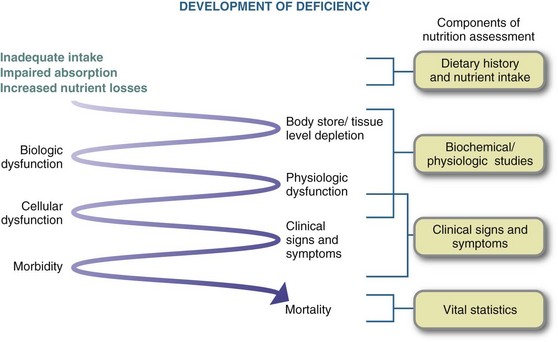
FIGURE 4-2 Development of clinical nutritional deficiency with corresponding dietary, biochemical, and clinical evaluations.
Many factors help measure whether a person is at nutritional risk. Factors to consider include food and nutrient intake patterns, psychosocial factors, medical and health histories, physical conditions associated with particular disease states and disorders, body weight and fatness, physical examination, biochemical abnormalities, medication regimens and use of herbs or botanical products (Table 4-2).
TABLE 4-2
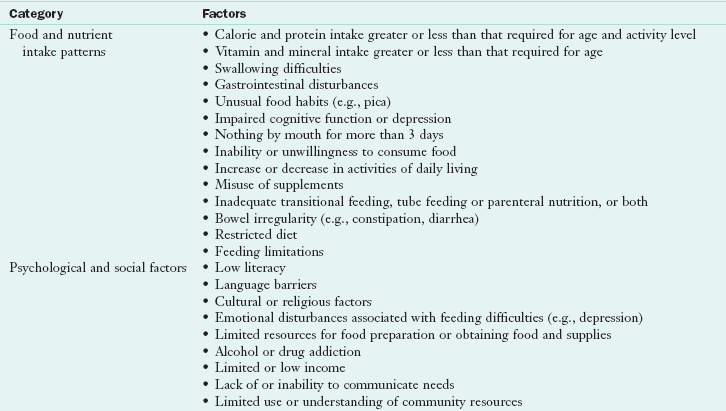
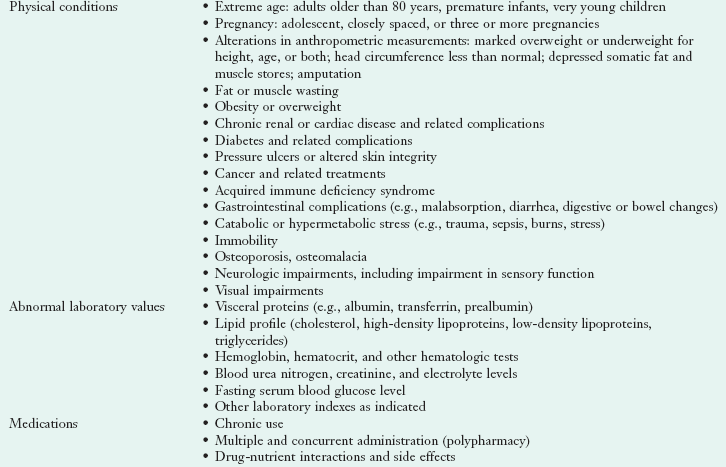
Adapted from the Council on Practice, Quality Management Committee: ADA’s definitions for nutrition screening and nutrition assessment, J Am Diet Assoc 94:838, 1994.
Screening and assessment are integral parts of nutrition care. The accepted nutrition care process (NCP) has four steps: (1) assessment of nutrition status; (2) identification of nutritional diagnoses; (3) interventions such as goal setting, food and nutrient delivery, education, counseling, coordination of care; and (4) monitoring and evaluation of the effectiveness of the interventions (ADA, 2010).
Nutrition Screening
Ideally everyone should undergo periodic nutrition screening throughout life. Just as a medical provider conducts an annual health examination, a trained nutrition provider conducts regular nutritional evaluations. To provide cost-effective nutrition services in today’s health care environment, it is important first to screen patients to find those who are at nutritional risk. Screening precedes the NCP provided by a registered dietitian (RD). The purpose of a nutrition screen is to quickly identify individuals who are malnourished or at nutritional risk and determine whether a more detailed assessment is warranted (ASPEN, 2009; Charney, 2005). In most settings the nutrition screen is completed by a dietetic technician, nurse, physician, or other qualified health care professional. Once completed, patients who are at nutritional risk are referred to an RD to perform a more in-depth assessment. Evaluation of intake is truly the specialized role of the dietetics profession, as it requires depth and skills related to nutrition and food sciences, social and behavioral sciences, physiology, and biochemistry.
Although the components of nutrition screening may vary slightly from one setting to another, the tool should be simple and easy to complete, inclusive of readily available data, cost-effective, and effective in identifying nutrition problems. The tools must be both reliable (consistent between measures of the same factor, such as weight) and valid to measure what it is supposed to measure. In a survey of clinical nutrition managers, most common screenings include history of weight loss, current need for nutrition support, skin breakdown, poor intake, and chronic use of modified diets (Chima, 2006). Further information collected during a nutrition screen depends on (1) the setting in which the information is obtained (e.g., home, clinic, hospital), (2) the life stage or disease type, (3) available data, (4) a definition of risk priorities, and (5) the goal for the screening process. Regardless of the information gathered, the goal of screening is to identify individuals who are at nutritional risk, those likely to become at nutritional risk, and those who need further assessment. For example, being 85 years or older, having low nutrient intake, losing the ability to eat independently, having swallowing and chewing difficulties, becoming bedridden, having pressure ulcers or a hip fracture or dementia, and suffering from two or more chronic illnesses are factors of concern in a nutritional screen (Salva et al., 2009).
One useful screening tool is the Malnutrition Universal Screening Tool (MUST) developed by Stratton and colleagues (2004) to assess malnutrition rapidly, easily, accurately, and completely (Figure 4-3). MUST is designed to be used by multiple disciplines of professionals. Three independent criteria are used: current weight and height with determination of body mass index (BMI), unintentional weight loss using specific cutoff points, and acute disease effect on nutrition intake for greater than 5 days. These three components work better together to predict outcome rather than the individual components. Once the scores are added, the overall risk of malnutrition can be determined using three categories: 0 = low risk, 1= medium risk, and 2 and above = high risk. Management guidelines can then be followed (Stratton et al., 2004). The MUST tool is more effective than some other available tools (Henderson et al., 2008).
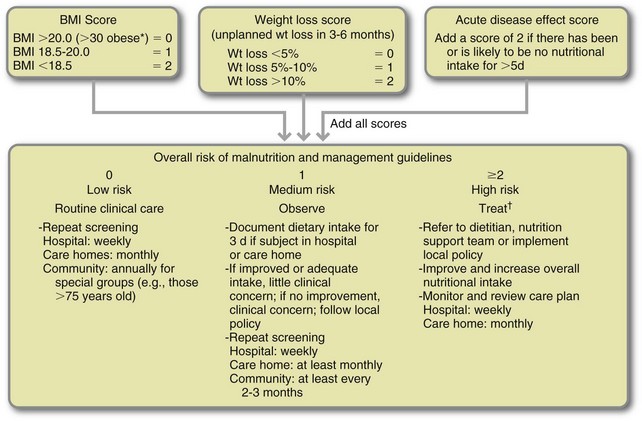
FIGURE 4-3 The Malnutrition Universal Screening Tool (“MUST”) for adults. Record malnutrition risk category, presence of obesity and/or need for special diets and follow local policy for those identified at risk.
If unable to obtain height and weight, alternative measurements and subjective criteria are provided (Elia, 2003).
*In the obese, underlying acute conditions are generally controlled before treatment of obesity.
†Unless detrimental or no benefit is expected from nutritional support (e.g., imminent death). (Courtesy Professor Marinos Elia, Editor; BAPEN, 2003 ISBN 1 899467 70X. Copies of the full report are available from the BAPEN Office, Secure Hold Business Centre, Studley Road, Redditch, Worcs BN98 7LG Tel: 01527 457850.)
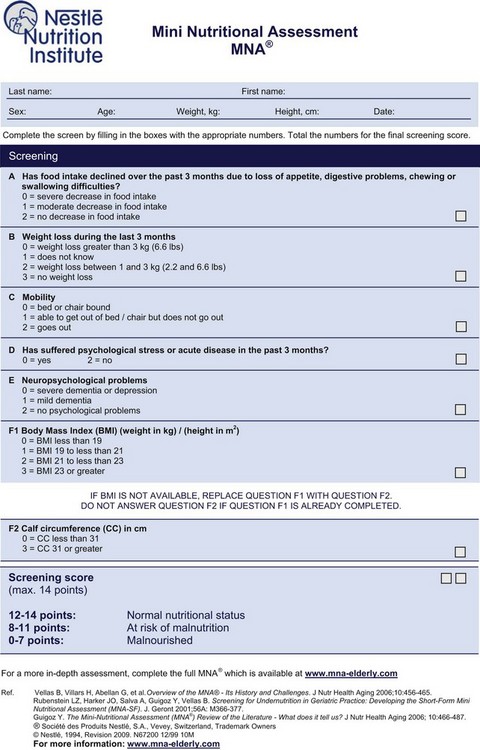
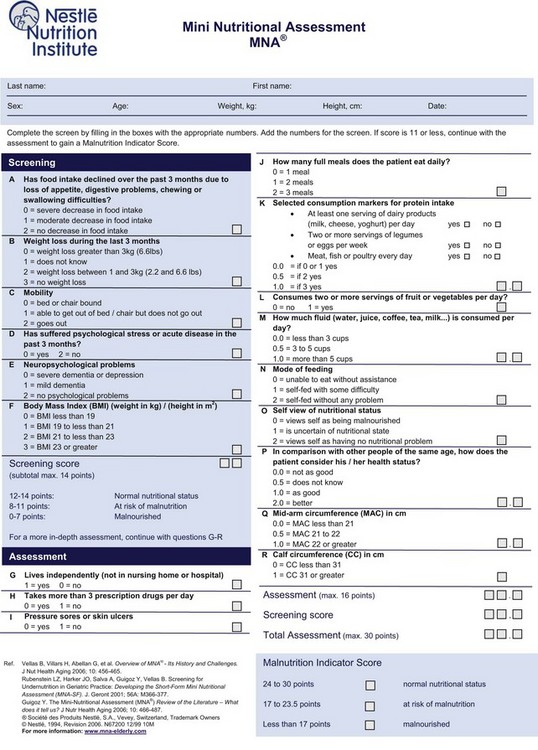
The Mini Nutritional Assessment (MNA) is a rapid and reliable method for evaluating nutritional status in older patients (i.e., 65 years and older). This tool includes both a screening section and assessment section. The screening portion contains questions related to food intake, weight loss, mobility, stress, neuropsychological condition, and BMI. Recently, a shorter version was validated using 6 versus 18 questions; this version can be completed in 15 minutes (Kaiser et al., 2009) (Figure 4-4).
Another tool is the Geriatric Nutritional Risk Index (GNRI), which relies on serum albumin and differences between current and previous body weights. With the GNRI, ideal body weight (calculated using the Lorentz formula) is used in place of usual weight because usual or normal weight is often difficult to assess in the older population (Box 4-1). The GNRI can be used to predict the risk of malnutrition from weight loss and low BMI associated with illness and functional decline (Bouillanne et al., 2005).
Regardless of the tool used, the management of undernutrition requires a multidisciplinary approach. Dietary and environmental improvements, managing multiple comorbidities, avoiding polypharmacy, and the need for supplementation or tube feeding should be considered.
Nutrition Assessment
Nutrition assessment is a comprehensive evaluation carried out by an RD using medical, and health, social, nutritional, and medication histories; physical examination; anthropometric measurements; and laboratory data. Nutrition assessment interprets data from the nutrition screen and incorporates additional information. The purpose of assessment is to gather adequate information in which to make a professional judgment about nutrition status (ASPEN, 2009). Assessment is the first step in the nutrition care process Table 4-3.
TABLE 4-3
Nutrition Care Process: Step 1: Nutrition Assessment
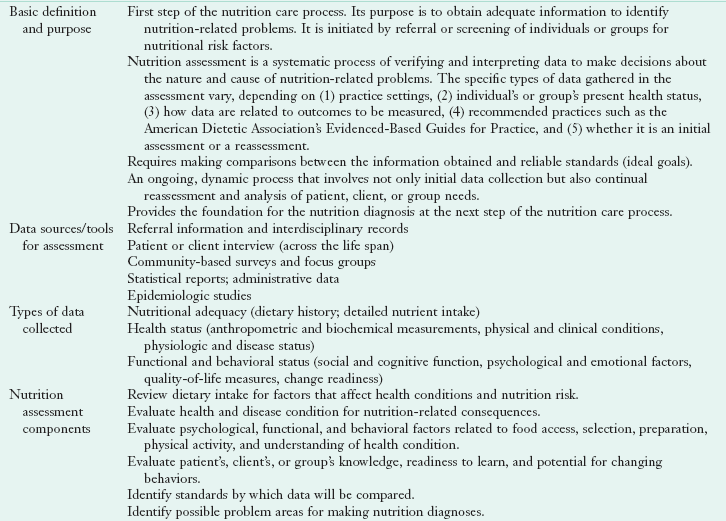
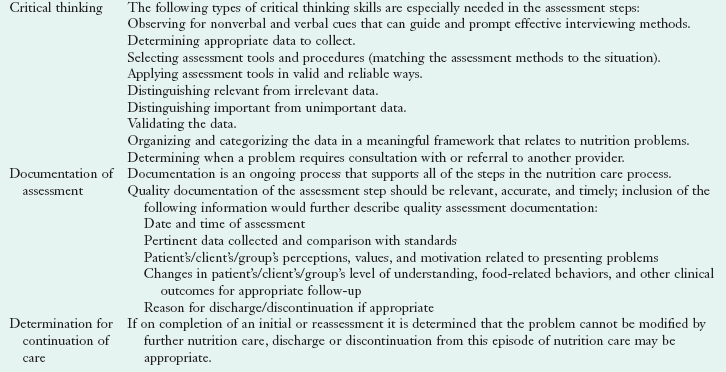
Adapted from Lacey K, Pritchett E: Nutrition care process and model: ADA adopts road map to quality care and outcomes management, J Am Diet Assoc 103(8):1064, 2003.
The information gathered depends on the particular setting, the present health status of the individual or group, how data are related to particular outcomes, whether it is an initial or follow-up assessment, and recommended practices (ADA, 2009). Once the nutrition assessment process is complete and a nutrition diagnosis made, the plan of care can be developed. Once interventions are chosen, they can be tailored for the appropriate setting (hospital, clinic, long-term care facility, rehabilitation center, or home). In an intensive care unit, assessment is best administered within 24 hours of admission to the unit. Malnourished patients experience increased morbidity and mortality and prolonged hospital stays; nutrition support measures should begin early (Agency for Healthcare Research and Quality, 2010).
The goals of nutrition assessment are to (1) identify individuals who require aggressive nutrition support, (2) restore or maintain an individual’s nutrition wellness, and (3) identify appropriate medical nutrition therapy (MNT). Patients with acute or chronic illnesses who have the potential for malnutrition should be evaluated further. Malnutrition is common in those who are obese, cachexic, or older; who have undergone trauma; and in whom nutritional intervention is neglected. Furthermore, the nutrition status of patients who are hospitalized for longer than 2 weeks deteriorates. With only minimum training in nutrition in many medical schools physicians often graduate with little practical knowledge about nutrition and the features of malnutrition. To maintain a high level of awareness, physician education programs in nutritional topics should be conducted regularly.
Tools for Assessment of Nutritional Status
Several tools are available for the assessment of nutritional status. The Subjective Global Assessment (SGA) is a nutritional assessment tool that has been validated and correlates well with nutrition risk indices and other assessment data in hospitalized patients (DeLegge and Drake, 2007; Kyle et al., 2006) (see Table 6-5). The MNA tool mentioned earlier evaluates independence, medication therapy, pressure sores, number of full meals consumed per day, protein intake, consumption of fruits and vegetables, fluid intake, mode of feeding, self-view of nutritional status, comparison with peers, and mid-arm and calf circumferences (Figure 4-5) (Bauer et al., 2008; Guigoz, 2006).
Histories
The information collected about individuals or populations is used as part of the nutrition status assessment. Frequently the information is in the form of histories—health and medical, social, medication, and dietary.
Medical or Health History
The medical or health history usually includes the following information: chief complaint, present and past illness, current health, allergies, past or recent surgeries, family history of disease, psychosocial data, and a review of problems—by body system—from the patient’s perspective (Hammond, 2006). These histories usually provide much insight into nutrition-related problems. Alcohol and drug use, increased metabolic needs, increased nutritional losses, chronic disease, recent major surgery or illness, disease or surgery of the gastrointestinal tract, and recent significant weight loss all may contribute to malnutrition. In older patients, additional review is recommended to detect mental deterioration, constipation or incontinence, poor eyesight or hearing, slowed reactions, major organ diseases, effects of prescription and over-the-counter drugs, and physical disabilities.
Medication History
Food and drugs interact in many ways that affect nutrition status and drug therapy effectiveness; thus a medication history is an important part of any nutrition assessment. Those who are older, are chronically ill, have a history of marginal or inadequate nutritional intake, or are receiving multiple drugs for a long time are susceptible to drug-induced nutritional deficiencies. The effects of drug therapy can be altered by specific foods, the timing of food and meal consumption, and use of herbal products; see Chapter 9.
Social History
Social aspects of the medical or health history may also affect nutrition intake. Socioeconomic status, the ability to purchase food independently, whether the person is living alone, physical or mental handicaps, smoking, drug or alcohol addiction, confusion caused by environmental changes, unsuitable housing conditions, lack of socialization at meals, psychological problems, or poverty may add to the risks for inadequate nutrition intake. Knowledge of various cultures is also important to meet the needs of diverse groups of clients. Factors that affect a person’s cultural values include religious beliefs; rituals; symbols; language; dietary practices; education; communication style; views on health, wellness, and illness; and racial identity. Establishing a bond with clients of different cultures is important for positive outcomes (Stein, 2010). See Chapter 12 for more guidance on nutrition and cultural competency.
Nutrition or Diet History
Inadequate nutrient intake and nutritional inadequacy can result from anorexia, ageusia (loss of the sense of taste), dysgeusia (diminished or distorted taste), anosmia (loss of smell), excessive alcohol intake, poor-fitting dentures, fad dieting, chewing or swallowing problems, frequent meals away from home, adverse food and drug interactions, cultural or religious restrictions of diet, an inability to eat for more than 7 to 10 days, intravenous fluid therapy for more than 5 days, or feeding dependence. For many older adults, denture problems, changes in taste and smell, long-established poor food habits, food fads, and inadequate knowledge of nutrition are problems. Alternative nutrition therapies, including use of megadoses of vitamins and minerals, various herbs, macrobiotic diets, probiotics, and amino acid supplements, must be addressed because they have an effect on the person’s nutritional and overall health care.
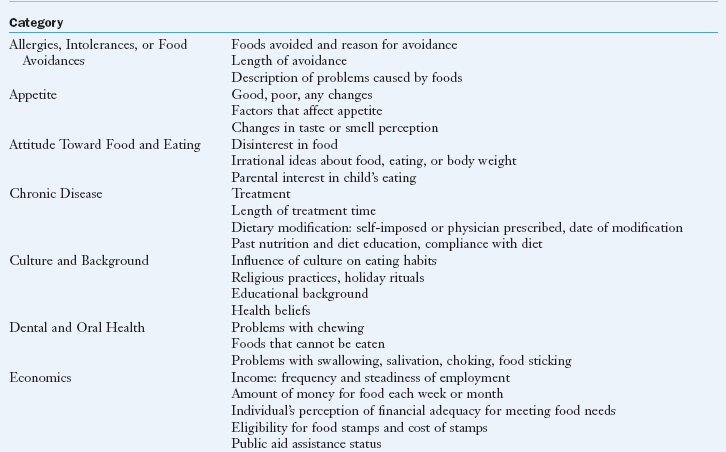
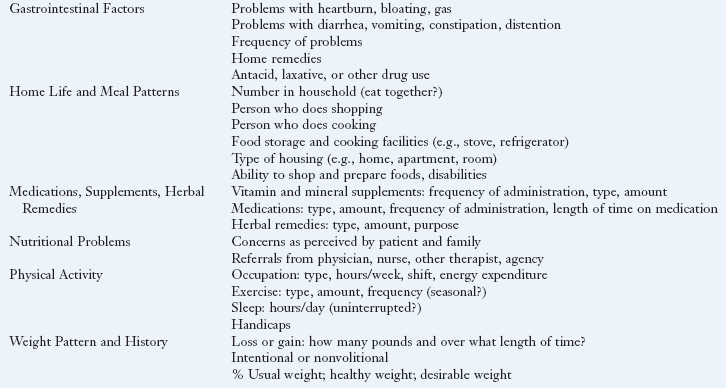
A diet history is perhaps the best means of obtaining dietary intake information and refers to a review of an individual’s usual patterns of food intake and the food selection variables that dictate the food intake. See Box 4-2 for the kind of information collected from a dietary history. Dietary intake data may be assessed either by collecting retrospective intake data as with a 24-hour recall or food frequency questionnaire or summarizing prospective intake data, as with a food record kept for a number of days by an individual or the caretaker. Each method has specific purposes, strengths, and weaknesses. Any self-reported method of obtaining data can be challenging because it is difficult for people to remember what they ate, the content, or even an accurate statement of portion size (Thompson et al., 2010). The choice of data collection depends on the purpose and setting in which the assessment is completed. The goal is to determine the nutrient content of the food and the appropriateness of the intake for a particular individual. The prospective method involves recording data at the time the food is consumed or shortly thereafter.
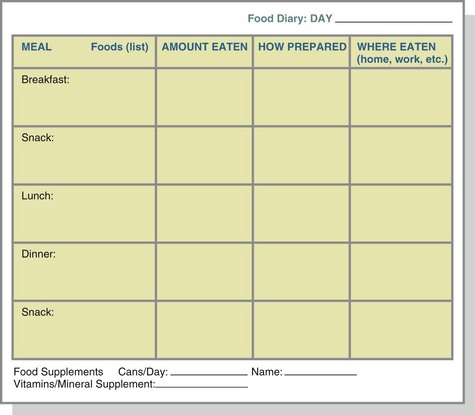
A daily food record, or food diary, involves documenting dietary intake as it occurs and is often used in outpatient clinic settings. The food diary is usually completed by the individual client (Figure 4-6). A food diary or record is usually most accurate if the food and amounts eaten are recorded at the time of consumption, minimizing error from incomplete memory or attention (Thompson et al., 2010). The individual’s nutrient intake is then calculated and averaged at the end of the desired period, usually 3 to 7 days, and compared with dietary reference intakes or guidelines in the MyPlate guide.
The food frequency questionnaire is a retrospective review of intake frequency (i.e., food consumed per day, per week, or per month). For ease of evaluation, the food frequency chart organizes foods into groups that have common nutrients. Because the focus of the food frequency questionnaire is the frequency of consumption of food groups rather than of specific nutrients, the information obtained is general, not specific, for certain nutrients. During illness, food consumption patterns can change, depending on the stage of illness. Therefore it is helpful to complete food frequency questionnaires for the period immediately before hospitalization and before illness to obtain a complete and accurate history. Box 4-3 shows a food frequency questionnaire. Another more specific, quantified questionnaire is online at http://www.fhcrc.org/science/shared_resources/nutrition/ffq/gsel.pdf.
The 24-hour recall method of data collection requires individuals to remember the specific foods and amounts of foods they consumed in the past 24 hours. The information is then analyzed by the person or professional gathering the information. Problems commonly associated with this method of data collection include (1) an inability to recall accurately the kinds and amounts of food eaten, (2) difficulty in determining whether the day being recalled represents an individual’s typical intake, and (3) the tendency for persons to exaggerate low intakes and underreport high intakes of foods. Concurrent use of food frequency and 24-hour recall questionnaires (i.e., doing a cross-check) improves the accuracy of intake estimates.
Reliability and validity of dietary recall methods are important issues. When attention is directed toward the diet, people may consciously or unconsciously alter their intake either to simplify recording or impress the interviewer, thus decreasing the information’s validity. The validity of dietary recall information from obese individuals is often questionable because they tend to underreport their intakes. The same can be true for children, patients with eating disorders, those who are critically ill, those who abuse drugs or alcohol, individuals who are confused, and those whose intake is unpredictable. Table 4-4 describes the advantages and disadvantages of the various methods used to obtain accurate dietary intake data.
TABLE 4-4
Methods of Obtaining Dietary Intake Data
| Method | Advantages | Disadvantages |
| Nutrient intake analysis | Allows actual observation of food in clinical setting | Does not account for possible variation in portion size. Does not reflect intake of free-living individual |
| Daily food record or diary | Provides daily record of food consumption. Can provide information on quantity of food, how food is prepared, and timing of meals and snacks. |
Depends on variable literacy skills of participants. Requires ability to measure or judge portion size. Actual food intake possibly influenced by the recording process. Reliability of records is questionable. |
| Food frequency | Easily standardized. Can be beneficial when considered in combination with usual intake. Provides overall picture of intake. |
Requires literacy skills. Does not provide meal pattern data. Requires knowledge of portion sizes. |
| 24-h recall | Is quick and easy. | Relies on memory. Requires knowledge of portion sizes. May not represent usual intake. Requires interviewing skills. |
Data from Diet manual and nutrition practice guidelines: a manual of the Georgia Dietetic Association, Section 5.5-5.3, 2004.
Technology is currently being adapted and incorporated into dietary assessment through a variety of means that are found to be very helpful and reduce associated cost. Electronic diaries can be more accurate and useful compared with handwritten entries. There are also recording electronic devices that can link a kitchen scale directly to a computer, and other devices use a bar code reader to transmit data by telephone (Thompson et al., 2010). Sun and associates (2010) describe an electronic system for dietary reporting by a person wearing a device to record food intake. The device contains a camera, a microphone, and other sensors that can be worn around the neck and can collect pictures of the actual meal to identify food items.
Nutrient Intake Analysis
A nutrient intake analysis (NIA) may also be referred to as a nutrient intake record or calorie count, depending on the information collected and the analysis done. The NIA is a tool used in various inpatient settings to identify nutritional inadequacies by monitoring intakes before deficiencies develop. Information about actual intake is collected through direct observation or an inventory of foods eaten based on observation of what remains on the individual’s tray or plate after a meal. Intake from tube feeding and intravenous products (enteral and parenteral nutrition) is also recorded.
An NIA should be recorded for at least 72 hours to reflect variations in intake that may occur from day to day. Complete records for this period usually accurately reflect an average intake for most individuals. If the record is incomplete, it may be necessary to extend the duration of the intake until a full 72-hour record can be completed. It should be kept in mind that eating habits or meals consumed during the weekend and during the week may differ.
The record of total intake can then be analyzed for its nutrient content, using one of several available computerized methods. The diet can be analyzed for macronutrient and micronutrient intake. Macronutrients are analyzed to assess total calorie intake along with the carbohydrate, fiber, fat, and protein content of the diet. Micronutrients, vitamins and minerals, can also be analyzed to assess intake to ensure proper body functioning. In addition, it may be advantageous to assess the phytonutrient and prebiotic content of the diet. Determining the oxygen radical absorbance capacity (ORAC) of certain types of fruits, nuts, and vegetables in the diet gives a measure of the anti-inflammatory effect of the diet because inflammation and its downstream effect of oxidative stress is linked to many chronic and degenerative diseases, including cancer, heart disease, Alzheimer disease, Parkinson disease, and also the aging process. A diet rich in fruit, nuts, and vegetables with high ORAC scores is considered to contain good sources of antioxidants. It is possible to search selected foods to obtain the ORAC value of each (U.S. Department of Agriculture, 2007).
Technological advances have been made for processing dietary intake data. Computerized processing of dietary intake data is a common practice in most settings. Several database choices are available for estimation of intake and can vary by the nutrient composition database used to process the data (Thompson et al., 2010).
 Clinical Scenario
Laverne, a 66-year-old black woman, has contacted you to set up an outpatient nutrition screening appointment. She has a 20-year history of diabetes mellitus, a 10-year history of colon cancer, and hypertension. She is 5 ft, 8 in tall and weighs 203 lb. Her current medications are glyburide and a diuretic. (She does not know its name.) She tells you that she eats throughout the day and sometimes at night after going to bed.
Nutrition Diagnostic Statement
Overweight/obesity related to poor food choices as evidenced by a BMI of 31.
1. What would you include in a nutrition screening for Laverne?
2. What would you include in a nutrition assessment for Laverne?
3. How could you identify her medications?
4. What additional information is needed for assessment of her dietary and nutrient intake?
5. If you need more details, what questions would you ask her physician?
Centers for Disease Control and Prevention—Growth Charts
http://www.cdc.gov/growthcharts/
International Food Information Council
Malnutrition Universal Screening Tool
http://www.bapen.org.uk/must_tool.html
National Cancer Institute (NCI) Diet History
http://riskfactor.cancer.gov/DHQ/
Automated Self-administered 24-hour Dietary Recall
http://riskfactor.cancer.gov/tools/instruments/asa24/
National Heart, Lung, and Blood Institute
http://www.nhlbi.nih.gov/index.htm
National Health and Nutrition Examination Survey Food Frequency Questionnaire
http://riskfactor.cancer.gov/diet/usualintakes/ffq.html
U.S. Department of Agriculture
http://www.nal.usda.gov/fnic/etext/000108.html
U.S. Department of Agriculture Healthy Eating Index
http://www.cnpp.usda.gov/HealthyEatingIndex.htm
U.S. Department of Agriculture Nutrient Content of the Food Supply
References
Agency for Healthcare Research and Quality (AHRQ). National Quality Measures Clearinghouse. Assessment of risk and prevention of malnutrition: percentage of intensive care unit (ICU) patients who are assessed for risk of malnutrition within 24 hours after admission. Accessed February 1, 2010 at http://www.qualitymeasures.ahrq.gov/content.aspx?id=14394.
American Dietetic Association (ADA). Nutrition assessment. In: ADA Nutrition Care Manual On-line. Chicago: American Dietetic Association; 2010.
American Dietetic Association (ADA). Position of the American Dietetic Association: nutrient supplementation. J Am Diet Assoc. 2009;109:2073.
ASPEN Board of Directors. Guidelines for the use of parenteral and enteral nutrition in adults and pediatric patients. JPEN J Parenter Enteral Nutr. 2009;33:255.
Bauer, JM, et al. The Mini Nutritional Assessment—its history, today’s practice, and future perspectives. Nutr Clin Pract. 2008;23:388.
Bouillanne, O, et al. Geriatric nutritional risk index: a new index for evaluating at-risk elderly medical patients. Am J Clin Nutr. 2005;82:777.
Btaiche, IF, et al. Critical illness, gastrointestinal complications, and medication therapy during enteral feeding in critically ill adult patients. Nutr Clin Pract. 2010;25:32.
Butterworth, CE. The skeleton in the hospital closet. Nutr Today. March/April:4, 1974.
Centers for Disease Control and Prevention (CDC). Overweight and obesity. http://www.cdc.gov/obesity/, 2009. [Accessed 10 February 2010 at].
Centers for Disease Control and Prevention (CDC), Quickstats: Age-adjusted death rates for the 10 leading causes of death—National Vital Statistics System, United States, 2006 and 2007. MMWR. 2009;58(46). Accessed 10 February 2010 at. http://www.cdc.gov/mmwr/preview/mmwrhtml
Charney, P. Nutrition screening and assessment in older adults. Today’s Dietitian. 2005;7:10.
Chima, C, Nutrition screening practices in health care organizations: a pilot survey, Clinical Nutrition Management. Chicago: American Dietetic Association; 2006. Accessed 14 February 2010 from. http://www.cnmdpg.org/index_875.cfm
DeLegge, M, Drake, L. Nutritional assessment. Gastroenterol Clin North Am. 2007;36:1.
Elia, M. Screening for malnutrition: a multidisciplinary responsibility: development and use of the “malnutrition universal screening tool” (“MUST”) for adults. Worcester, England: Redditch; 2003.
Fialkowski, MK, et al. Evaluation of dietary assessment tools used to assess the diet of adults participating in the Communities Advancing the Studies of Tribal Nations Across the Lifespan Cohort. J Am Diet Assoc. 2010;109:65.
Guigoz, Y. The Mini nutrition assessment (MNA®) review of the literature—what does it tell us? JNHA J Nutr Health Aging. 2006;10:6.
Hammond, KA. Physical assessment. In Lysen LK, ed.: Quick reference to Clinical Dietetics, ed 2, Boston: Jones and Bartlett, 2006.
Henderson, S, et al. Do the malnutrition universal screening tool (MUST) and Birmingham nutrition risk (BNR) score predict mortality in older hospitalised patients? BMC Geriatr. 2008;8:26.
Heron, M, Tejada-Vera, B. Deaths: leading causes for 2005. National Vital Statistics Reports, vol 58, no. 8. Hyattsville, Md: National Center for Health Statistics; 2009.
Kaiser, MJ, et al. The short-form Mini Nutritional Assessment® (MNA-SF): Can it be improved to facilitate clinical use? J Nutr Health Aging. 2009;13(Suppl 2):S16.
Kyle, UG, et al. Comparison of tools for nutritional assessment and screening at hospital admission: a population study. Clin Nutr. 2006;25:409.
Salva, A, et al. Nutritional assessment of residents in long-term care facilities (LTCFs): recommendations of the task force on nutrition and ageing of the IAGG European region and the IANA. J Nutr Health Aging. 2009;13:475.
Stein, K. Moving cultural competency from abstract to act. JADA. 2010;110(2):180.
Stratton, RJ, et al. Malnutrition in hospital outpatients and inpatients: prevalence, concurrent validity and ease of use of the “malnutrition universal screening tool” (“MUST”) for adults. Br J Nutr. 2004;92(5):799.
Sun, M, et al. A wearable electronic system for objective dietary assessment. J Am Diet Assoc. 2010;110:45.
Tarnus, E, Bourdon, E. Anthropometric evaluations of body composition of undergraduate students at the University of La Reunion. Adv Physiol Educ. 2006;30:248.
Thompson, F, et al. Need for technological innovation in dietary assessment. J Am Diet Assoc. 2010;110:48.
U.S. Department of Agriculture (USDA). Oxygen radical absorbance capacity (ORAC) of Selected Foods, 2007. Beltsville, Md: USDA; 2007.
U.S. Department of Health and Human Services (USDHHS). Healthy people 2020. Washington, DC: USDHHS; 2009.
U.S. Department of Health and Human Services (USDHHS). The Surgeon General’s call to action to prevent and decrease overweight and obesity. Rockville, Md: Office of the Surgeon General; 2007.
Xu, J, et al. Deaths: preliminary data for 2007. National Vital Statistics Reports. August 2009;58(1):19. [U.S. Dept. of Health and Human Services, 2009].