Virtual Reality Imaging
CT IMAGE DATA SETS
The increasing size of computed tomography (CT) image data sets (axial images) obtained from multislice CT scanners has created a range of technical applications including CT fluoroscopy, CT angiography (CTA), three-dimensional (3D) imaging, and CT virtual reality imaging.
Multislice CT scanners produce very large volume data sets of the anatomy under investigation. Hundreds of images can be obtained and presented to the radiologist for interpretation and diagnosis. In general, these images are examined one at a time, and observers must rely on their mental reconstruction abilities to visualize the anatomy in three dimensions by using the two-dimensional (2D) images. The perception of 3D anatomy from 2D images often is difficult for some individuals because of the complexity of the structures in terms of their geometrical shapes. One solution is a 3D image processing technique referred to as virtual reality (VR) imaging.
The technical developments in multislice CT scanners have led to the acquisition of increasing amounts of isotropic image data sets (see Chapter 1), leading to improvements in applications such as CT fluoroscopy, CTA, and 3D imaging as described in Chapters 13 and 14, respectively.
Radiologists now use various image display techniques including the display of 2D axial images, 2D multiplanar reformatted (MPR) images, 3D images, and even computer-assisted detection and diagnosis (CAD) and more recently virtual dissection (described subsequently) to assist in image interpretation of VR images.
OVERVIEW OF VIRTUAL REALITY IMAGING
VR is a branch of computer science that immerses users in a computer-generated environment and allows them to interact with 3D scenes. The use of VR concepts to the creation of inner views of tubular structures is called virtual endoscopy (Vining, 1996). As explained by Higgins et al (1998):
A virtual endoscope is a graphics-based software system used for simulating endoscopic exploration inside a 3D image. In virtual endoscopy, a 3D image acts as a “copy” or virtual environment, representing the scanned anatomy. With the use of computer-based rendering tools, a virtual endoscope produces endoluminal surface views inside the virtual environment similar to those from a real endoscope. A virtual endoscope permits essentially unrestricted exploration because it cannot traumatize the virtual environment.
A real endoscope uses optical video-assisted technology to help physicians interactively examine the inside of tubular anatomical structures. Because of the nature of the physical device, the patient may feel some discomfort, and other risks may also exist.
Recently, the topic of VR imaging received significant attention at the 2006 Computer Assisted Radiology and Surgery conference held in Osaka, Japan, where researchers presented their work on VR imaging applications. At the conference, Dr. Naoki Suzuki described a number of projects at Japan’s Institute of Medical Imaging at the Jikei University School of Medicine in Tokyo and made an important comment that “our vision is to utilize VR techniques to improve medical simulation and navigation” (Barnes, 2006). VR applications in medicine, surgery, and four-dimensional (4D) imaging range from diagnosis using 3D and 4D image data sets, image fusion, and virtual surgery to treatment simulation, human body dynamics and medical education in virtual space (Barnes, 2006).
TECHNICAL CONSIDERATIONS
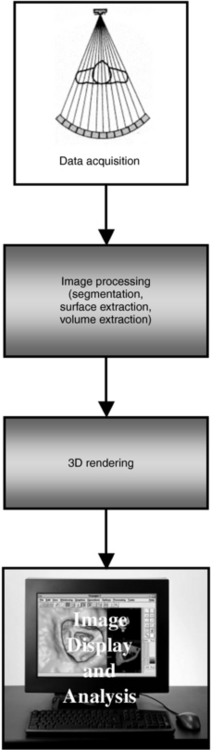
Several technical requirements must be taken into account when CT virtual endoscopy is considered. The four fundamental requirements are data acquisition, image preprocessing, 3D rendering, and image display and analysis (Fig. 15-1). Each of these techniques is currently being researched in an effort to improve the performance of virtual CT colonoscopy, although some controversy still exists among physicians such as gastroenterologists and radiologists, for example (Macari and Bini, 2005).
Data Acquisition
The first step in virtual endoscopy imaging is careful selection of the scan parameters to be used for creating the data set. These parameters, which optimize image display while reducing the radiation dose to the patient, include slice thickness, spiral/helical pitch, slice reconstruction overlap, and the scanning exposure technique (i.e., peak kilovolts [kVp], milliamperes [mA]/revolution, and scan time/revolution). In addition, the reconstruction parameters with respect to the type of interpolation algorithm and reconstruction kernel are also vital to the optimization of the procedure (Jolesz et al, 2007).
The selection of these parameters has been discussed in the literature for several virtual endoscopic examinations. For CT bronchoscopy, for example, Hooper (1999) reports that a 2-millimeter (mm) slice thickness, a pitch of 1, and a 75% slice reconstruction overlap produce significantly better virtual images than do a slice thickness of 4 to 8 mm, a pitch of 1.5 to 2, and a 25% to 50% slice overlap. In addition, Jolesz et al (2007) recommends parameters such as 120 kVp, 70 to 165 mA, 20 to 40 seconds’ exposure time; 3 to 5 mm collimation, 5 to 6 mm table feed with a pitch of 1 or 2, 512 × 512 matrix size and 180 degrees of linear interpolation algorithm with a standard reconstruction algorithm, and 3 mm table incrementation. In addition, for virtual colonoscopy, proper patient preparation is an essential element of the success of the examination. In this respect, oral colonoscopic preparation and the use of contrast medium should be considered. Additionally, to improve image quality, some individuals may consider the use of glucagons to reduce motion caused by peristalsis of the bowel (Lakarc and Kaufman, 2003).
The imaging parameters represent a tradeoff between radiation dose and image quality. The effect of slice thickness, for example, on image quality is demonstrated in Figure 15-2. Techniques for virtual studies in bronchoscopy, colonoscopy, and angioscopy also require consideration of several parameters such as kilovolts (kV), mA/revolutions, scan time/revolution, pitch, slice thickness, and so forth. The choice of the actual values for each will depend on the clinical facility and radiologists. For example, typical values for a virtual bronchoscopy may include 120 kV, 150 mA/30 revolutions, 1 second/revolution, and a pitch of 1, a slice thickness of, say, 5 mm, and an image index of 1 mm.
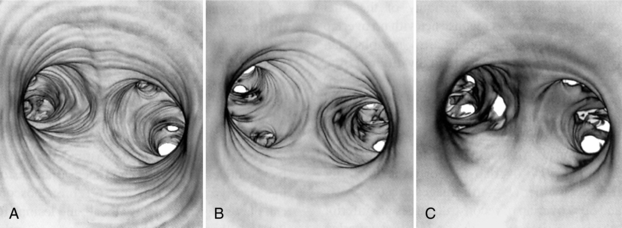
FIGURE 15-2 The effect of slice thickness on image quality in CT virtual endoscopy. Thin (2-mm) slices produce sharper images (A) compared with 4-mm (B) and 8-mm (C) thick slices. These images were obtained with 50% reconstruction overlap using a pitch of 1. From Hooper KD: CT bronchoscopy, Semin Ultrasound CT MRI 20:10-15, 1999.
Image Preprocessing
Preprocessing of image data is the next step after data acquisition (see Fig. 15-1), and it is intended to optimize the images before they are subject to further processing and analysis. Preprocessing involves the use of various noise filtering algorithms, image segmentation, defining paths through tubular structures, and other tools, such as classification, “cropping,” and “cutting.”
Image segmentation is an important step in the creation of VR images in CT. Segmentation can be performed by the operator (semiautomatic), or it can be done automatically. In the semiautomatic mode, the user selects objects to include in the data set through the use of windowing. These objects are then prepared for rendering. For bronchoscopy the result of this procedure defines a 3D image mask that, as Higgins et al (1998) explained, “excludes voxels not belonging to the lungs or major airways. All mediastinal structures, bones, and other extraneous structures are removed.”
Another preprocessing tool is volume extraction, a technique where 3D surfaces are extracted from a volume (Doi et al, 2002; Takanashi et al, 1997). Another approach to volume extraction is one discussed by Lakarc and Kaufman (2003), a technique where voxels (rather than 3D surfaces) are extracted from a volume into another 3D segmented region. These techniques are beyond the scope of this book.
Three-Dimensional Rendering
3D rendering is described in detail in Chapter 14. Two rendering techniques used in virtual CT endoscopy are surface rendering and volume rendering. Both have been used in various virtual CT examinations, but most experts agree that surface rendering is not best suited for use in CT VR imaging (Fleiter et al, 1997; Higgins et al, 1998; Lakarc and Kaufman, 2003) because of problems such as the production of partial volume averaging artifacts.
Volume rendering provides the best results because it produces optimum visualization of the anatomy (e.g., mucosal patterns and lesions), minimizes partial volume averaging artifacts, and adds lifelike reality to images (Hooper, 1999, 2000; Lakarc and Kaufman, 2003; Tomandl et al, 2000; Vining, 1996). Hybrid rendering, or techniques that combine features of both surface and volume rendering algorithms, are under investigation (Vining, 1999).
Image Display and Analysis
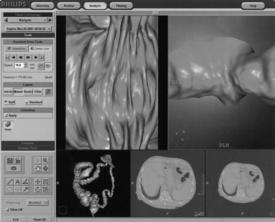
Because of the nature of the visualizations and interactivity needed for optimum viewing and evaluation of images, image display and analysis in CT VR imaging require powerful computer workstations (Fig. 15-3) to handle both data acquisition and advanced visualization processing operations.
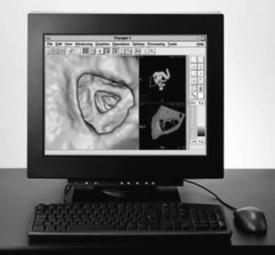
FIGURE 15-3 A workstation for CT virtual reality image display and analysis. Courtesy Phillips Medical Systems.
As an alternative, some CT consoles may also facilitate virtual endoscopy. Virtual CT endoscopy includes image analysis techniques that allow the user to assess images interactively with a wide range of software tools. These tools will allow the user to perform a wide range of operations such as the following, for example:
• Pan through a stack of 2D images (axial CT display mode)
• “Fly through” the 3D-rendered anatomical models (virtual endoscopic mode)
• Navigate the 3D anatomical models by using automated flight path programs
• Split or unfold anatomical models
• Identify pathological conditions through computer-aided detection
• Depict topography of inner colonic surfaces as flattened structures (panoramic endoscopic display mode)
In an early study conducted by Beaulieu et al (1999), the researchers found that panoramic endoscopy is more sensitive than virtual endoscopy for detection of polyps. This has been supported more recently by Silva et al (2006).
APPLICATIONS OF VIRTUAL ENDOSCOPY
Virtual endoscopy is evolving into a clinical tool with a wide range of applications. It has been used to evaluate the colon (virtual colonoscopy) (Vining, 1999), airways (virtual bronchoscopy) (Hooper, 1999), paranasal sinuses, bladder, spinal canal, and, more recently, the pancreatic and common bile ducts (virtual cholangiopancreatoscopy) (Prassopoulos et al, 1998) and the inner ear (virtual labyrinthoscopy) (Tomandl et al, 2000). Figure 15-2 shows an example of images from CT virtual endoscopy of the bronchus. Of these applications, virtual colonoscopy, or CT colonoscopy as it is popularly referred to, has received much attention in the literature (Macari and Bini, 2005; Pickhardt, 2004; Silva et al, 2006).
CT Colonoscopy: A Brief Overview
The developments in multislice CT scanners have provided the motivation for a number of improvements in CT colonoscopy. Furthermore, CT colonoscopy has become an integral tool for the evaluation of colorectal polyp detection, and it may be used routinely in the future for colorectal screening (Macari and Bini, 2005; Silva et al, 2006; Taylor et al, 2006). In a special review of CT colonography, Macari and Bini (2005) point out that there are two schools of thought with regard to the clinical use of CT colonography. Although some individuals are excited about the noninvasiveness of the technique, others believe that much more work needs to be done to not only demonstrate the sensitivity of CT colonography but also to emphasize that a certain degree of expertise in radiology is required for diagnostic interpretation of the images. Furthermore, the study by Taylor et al (2006) concluded that “for polyps smaller than 1 cm, measurement differences of up to 2.5 mm are within the expected limits of inter- and intraobserver agreement for all measurement techniques. Automated and manual 3D polyp measurements are more accurate than manual 2D measurements.”
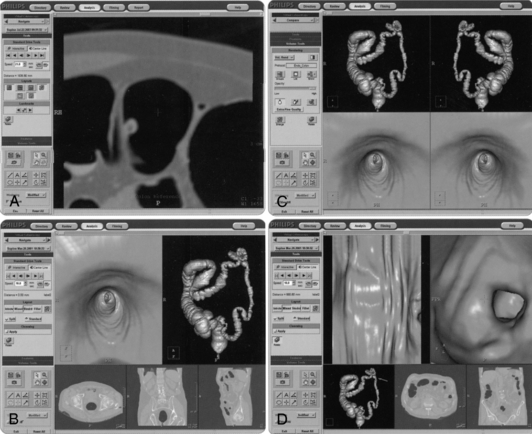
Display Tools: A typical CT colonoscopy imaging examination may generate a thousand plus images; therefore, it is important that radiologists have the necessary display tools to expedite the viewing of such a large image data set. In this respect, CT manufacturers have provided various software tools for display, viewing, and interpretation. For example, Figure 15-4 shows one manufacturer’s workstation display tools for CT virtual colonoscopy, and Figure 15-5 presents another display structure showing several views displayed simultaneously.
Virtual Dissection: A recent report by Silva et al (2006) identifies the work of various researchers who have used display tools such as 2D axial images, 2D MPR images, 3D images, CAD images, and virtual dissection images. They note that virtual dissection “is an innovative technique whereby the three dimensional (3D) model of the colon is virtually unrolled, sliced open, and displayed as a flat 3D rendering of the mucosal surface, similar to a gross pathologic specimen. This technique has the potential to reduce evaluation time by providing a more rapid 3D image assessment than is possible with an antegrade and retrograde 3D endoluminal fly-through. It may also ultimately improve accuracy by reducing blind spots present with endoluminal displays and by reducing reader fatigue” (Silva et al, 2006). Figure 15-6 illustrates the technique of virtual dissection, whereas Figures 15-7 and 15-8 show the 3D volume-rendered image of the colon and the associated virtual dissection image of the same colon, respectively.
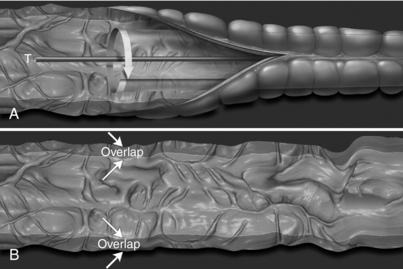
FIGURE 15-6 Virtual dissection schema. A, The virtual dissection software slices the colon open and unfolds it longitudinally by reconstructing the axial CT source image data from the perspective of a virtual camera with an orientation perpendicular to the midline of the colonic tract. B, A 360-degree view of the inner colonic surface is presented as a flattened 3D panel with a few degrees of overlap at the edges (arrows). From Silva AC et al: Three-dimensional virtual dissection at CT colonoscopy: unraveling the colon to search for lesions, Radiographics 26: 1669-1686, 2006. Figure and legend reproduced by permission of the Radiological Society of North America and the authors.
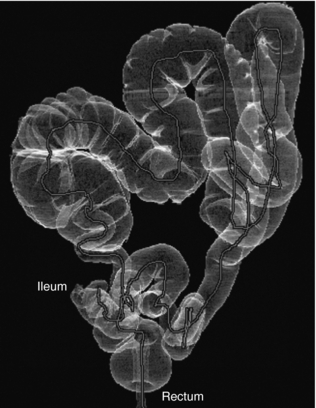
FIGURE 15-7 Normal anatomy and common features in a complete CT colonographic examination. Volume-rendered image of the colon from the rectum to the distal ileum. From Silva AC et al: Three-dimensional virtual dissection at CT colonoscopy: unraveling the colon to search for lesions, Radiographics 26: 1669-1686, 2006. Figure and legend reproduced by permission of the Radiological Society of North America and the authors

FIGURE 15-8 Virtual dissection image of the same colon shows the rectal tube as an elongated horizontal structure that parallels the midline of the tract (red arrows). The adjacent section outlined in red (Fig. 6 in image) shows the normal appearance of haustral folds in a straight colonic segment. Sections outlined in yellow (Fig. 5, Fig. 7, Fig. 8 in image) and yellow arrows indicate haustral distortions related to the degree of colonic curvature and the relative position of the haustral folds on the virtual dissection image. The section outlined in green (Fig. 9 in image) and the green arrowheads indicate areas of the colon that contain residual fluid. From Silva AC et al: Three-dimensional virtual dissection at CT colonoscopy: unraveling the colon to search for lesions, Radiographics 26: 1669-1686, 2006. Figure and legend reproduced by permission of the Radiological Society of North America and the authors. Please visit http://evolve.elsevier.com/Seeram/ to view a color image.
ADVANTAGES AND LIMITATIONS
The various features of virtual endoscopy and real endoscopy have been described in the literature (Hooper, 1999; Vining, 1999; Higgins et al, 1998; Blezek and Robb, 1997). Early results indicate that virtual endoscopy offers unique features and advantages for gathering both endoluminal and extraluminal information. (Table 15-1 presents a comparison of the features of virtual and real bronchoscopy.) Virtual endoscopy can also reduce complications (e.g., infection and perforation) that could arise from real endoscopy.
TABLE 15-1
Comparison of Features of Virtual and Real Bronchoscopy
| Virtual Bronchoscopy | Real Bronchoscopy |
| Imaging environment is a virtual environment as captured in a 3D CT image. | Imaging environment is illuminated in vivo endoluminal regions. |
| Awareness is enhanced by the many display tools. | Video is the only display tool. |
| Many quantitative measurements can be taken. | Quantitation is limited. |
| Viewing direction is unrestricted. | Only frontal views are possible. |
| Views inside and outside solid structures are possible. | Only endoluminal views are possible. |
| Viewing geometry is controllable. | Perspective is fixed. |
| User can track 3D position during navigation. | User must remember position of scope. |
| Multiple simultaneous views are possible. | User can see only one view at a time. |
| Cine sequences can be recorded. | High-quality video can be recorded. |
| No information on the mucosal surface can be obtained. | Detailed information on the mucosal surface can be obtained. |
| Performance of interventional procedures with views is not possible without linkage to a real bronchoscope. | Real intervention is possible. |
| View quality is limited by image resolution. | High-resolution video is used. |
From Hooper KD: CT bronchoscopy, Semin Ultrasound CT MRI 20:10-15, 1999.
More recently, and as pointed out by Macari and Bini (2005), although CT colonography is a useful tool for the evaluation of colorectal neoplasia, “substantial controversy” still exists as to its clinical efficacy. Silva et al (2006), on the other hand, explain that the technique of virtual dissection can provide radiologists with more information to ensure accurate diagnosis compared with 3D endoluminal image displays.
SOFTWARE FOR INTERACTIVE IMAGE ASSESSMENT
A wide range of software tools for interactive image assessment is available. All these packages feature a variety of visual and quantitative tools specifically for use in virtual endoscopy imaging in CT and MRI. For example, in the past, Higgins et al (1998) used QUICKSEE and VIDA in their virtual bronchoscopy studies; Blezek and Robb (1997) used ANALYZE software, developed and used at the Mayo Clinic in Rochester, Minnesota.
Other software tools for interactive image assessment have become available, including a CT endoscopy tool (Philips Medical Systems), Navigator (General Electric Healthcare), syngo Fly Through (Siemens Medical Solutions), and the V3D System from Viatronix (Stony Brook, NY).
CT Endoscopy Tool
The CT virtual endoscopy tool is an advanced visualization package that can provide real-time “fly through” within and around tubular anatomy in the same manner that a real endoscope is used. The tool features an intuitive user interface that provides considerable flexibility in interactive image assessment. For example, mouse technology is used to guide the user through the anatomy. In addition, this tool can provide movie loop presentations, which can be recorded on videotape and used for remote communications.
A unique feature of the CT endoscopy tool is compositing (a volumetric imaging technique that displays bone, soft tissues, and vessels at the same time), also called 4D angiography, which provides 3D images with a fourth dimension, opacity. There are other features as well, but they are beyond the scope of this chapter. For example, this tool makes use of an exclusive technology referred to as the Filet View that is intended to display all details of the structure in a single view. Figure 15-9 shows Filet Views (Fig. 15-9, B and C) compared with the typical straight-on colonoscopy view (Fig. 15-9, A).
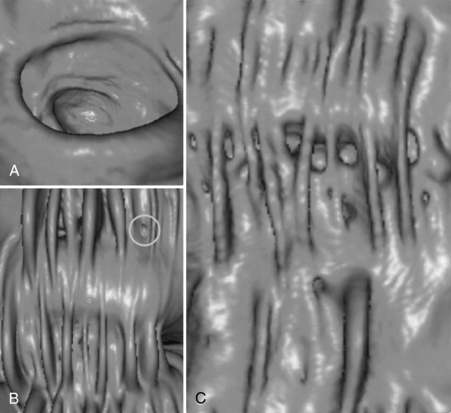
FIGURE 15-9 The effect of the Filet view in demonstrating pathologies of interest compared with the typical straight-on view in CT colonoscopy. Although the straight-on view (A) does not show the polyp, the Filet View (B) shows not only the polyp (circle) but also the entire lumen of the colon on a single view as well as a polyp (circle). C, The diverticulosis and the haustral folds are demonstrated. Courtesy Philips Medical Systems.
The tool can be used in a wide range of clinical applications, including pre-endoscopic evaluation of lesion screening and planning of endoscopic or surgical procedures. It also can be used to explore hollow anatomical structures such as the bronchus, colon, stomach, blood vessels, upper respiratory tract and larynx, paranasal sinuses, bladder, and spinal canal, for example.
Three-Dimensional Navigator
The Navigator advanced visualization software provides a single icon-driven interface for ease of use and interaction with virtual endoscopic images. For example, it allows real-time navigation of structures, unique “fly through” of tubular structures, enhanced visualization capabilities for viewing inside cavities, smooth or edge detail viewing, and endoluminal viewing of 3D surface-rendered abnormalities of tubular structures (e.g., polyps, tumors, clots, vascular strictures or aneurysms, and blockages). The Navigator also allows the user to “fly around” the outside of the anatomy, such as the circle of Willis.
syngo Fly Through
This interactive image assessment tool allows the user to perform several tasks, including showing the inside of hollow structures, correlating 3D endoscopic and MPR images, and a number of fly modes, for example, to enhance diagnostic interpretation.
V3D Colon
The V3D Colon is yet another example of the types of interactive image assessment tool used for CT colonoscopy. It is intuitive and is intended to provide image visualization of the colon for masses, cancers, polyps and other lesions and allows the user to perform 3D measurements, translucent rendering, automated 2D flights, real-time volume rendering, automatic and interactive navigation, and automatic segmentation, to mention only a few.
Functional and Molecular Imaging Tools
The introduction of image fusion techniques for hybrid imaging such as positron emission tomography (PET)/CT that combines functional or molecular data with anatomical images produced by CT and MRI alone will require new tools to assist radiologists to navigate and interpret multidimensional multimodality images. Recently, one such tool called Osirix was introduced and described by Rosset et al (2006). The tool is also compliant with DICOM (Digital Imaging and Communication in Medicine) software that can be used to navigate through the huge image data sets generated by PET/CT scanners, multislice CT scanners that produce dynamic cardiac images, and MRI scanners that produce functional cardiac images.
FLIGHT PATH PLANNING
Figure 15-10 shows the difference between surface-rendered and volume-rendered images in CT virtual endoscopy. Figure 15-11 shows the use of the navigation tool, one of the visualization tools of the CT endoscopy tool. Three orthogonal projections are created from the image data set sent to the computer workstation to assist the user in navigating through the anatomy. First, the navigation path is outlined by placing markers along the anatomy to be examined. This is followed by a “fly through” of the path. The active virtual image is shown in the middle of the screen.
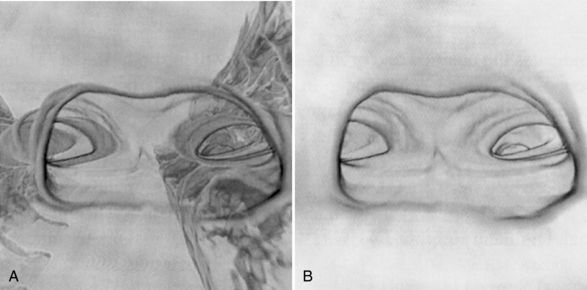
FIGURE 15-10 Visual comparison of a surface-rendered image (A) and a volume-rendered image (B) in CT virtual endoscopy. Volume rendering not only improves image quality but also reduces artifacts caused by partial volume averaging. From Hooper KD: CT bronchoscopy, Semin Ultrasound CT MRI 20:10-15, 1999.
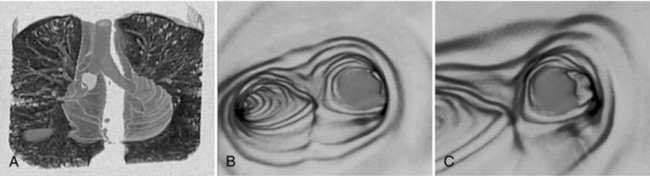
FIGURE 15-11 The appearance of CT virtual endoscopy images of the bronchus. A, Holographic projection helps the observer to localize the exact position and shows the “flow in flight path.” B and C, Virtual endoscopic images. Courtesy Picker International, Cleveland, Ohio.
Navigation
Successful navigation within the hollow anatomical region is essential so that structures of interest can be located and examined; such navigation depends on flight path algorithms. Because manual planning of flight paths can be time consuming, algorithms have been developed that plan the flight paths automatically.
An early algorithm, described by Paik et al (1998), uses a virtual “camera” to fly through the anatomy. First, the camera’s position and orientation (straight pointing and angled pointing) are defined. Then a sequence of views along a path can be rendered as a sequence of frames to make a virtual endoscopic movie. Figure 15-12 presents an example of flight path planning. It shows a portion of a hollow anatomical structure in which a path has been defined. The path has three segments: start voxel (Vstart) to S1 segment, a segment from S1 to S2, and a segment from S2 to an end voxel (Vend). The authors, Paik et al (1998), explain this initial path selection as follows:

FIGURE 15-12 An example of planning a flight path in virtual endoscopy. Paik DS et al: Automated flight path planning for virtual endoscopy, Med Phys 25:629-637, 1998.
Our algorithm determines the voxel on the surface that is closest to the start voxel, S1, and the voxel closest to the end voxel, S2. With a goal voxel of Vstart, the algorithm computes a Euclidean distance map for the union of the surface and the voxels in the Vstart to S1 line segment and the S2 to Vend line segment. This distance map is computed by assigning the goal voxel a distance of zero and iteratively assigning neighbor voxels the minimum Euclidean distance along a voxel path back to the goal voxel in a breadth first traversal until all voxels are reached. The algorithm follows the shallowest descent to find a path connecting Vend to Vstart.
FUTURE OF CT VIRTUAL ENDOSCOPY
CT virtual endoscopy is an evolving diagnostic imaging tool. Investigators involved in research and practical applications of virtual endoscopy have noted that its future is promising. It has great potential as a diagnostic tool for providing better visualization of various anatomic structures such as the colon, airways, and other tubular structures, from both outside and inside perspectives. A special review of CT colonoscopy (Macari and Bini, 2005) indicates that it is a “viable alternative imaging tool for colorectal polyp detection” and that a good deal of education in CT colonoscopy techniques will be necessary if it is to have an impact on screening the colon for cancer.
Developments in the technology for virtual endoscopy, such as digital image processing and computer visualization tools and automated techniques, can only lead to improvement of virtual endoscopy as a clinically useful tool. Multislice CT technology will have a significant impact on the accuracy of virtual endoscopy. The vast amount of data sets collected from a multislice CT scanner will generate much better virtual endoscopic images than those obtained with single-slice data sets (Kopecky, 1999). A more recent study indicates that the use of computer software for making 3D measurements and manual 3D measurements provide more accurate results that 2D manual measurements (Taylor et al, 2006).
Already, studies are under way to validate the clinical usefulness of CT virtual endoscopy in a wide range of applications, including colonoscopy and bronchoscopy, which have received more attention in the literature because of the prevalence of colorectal and bronchogenic carcinoma (Higgins et al, 1998; Hooper, 1999; Vining, 1999). Some of these studies have shown that, compared with real endoscopy, virtual endoscopy is much cheaper and risk free and causes the patient less discomfort.
As noted by Vining (1999) and others such as Macari and Bini (2005), Silva et al (2006), and Taylor et al (2006), other factors must be considered before the use of virtual endoscopy becomes commonplace, such as the following:
• It must be better than real endoscopy in detecting various anatomical structures and pathological conditions.
• Radiologists must be well versed in interpreting normal and abnormal features of the anatomy under investigation to make an accurate diagnosis.
• It should be easy to perform on patients and easy for technologists and radiologists to use.
• It should be available on all multislice CT scanners and MRI scanners as well.
• The use of computer software to make measurements provides more accuracy than manual measurements.
• It must be accepted by primary care physicians and insurance companies.
Finally, Brenner (2006) reports that currently, virtual colonoscopy is undergoing clinical trials in the United States and in other countries and will ultimately provide definitive results as to its efficacy as a screening tool for lesions in the colon.
VIRTUAL ENDOSCOPY ON THE INTERNET
The Internet currently offers a number of sites that provide not only 3D images but also virtual endoscopic images. More important, these sites offer the opportunity for “fly through” explorations of various anatomical regions. The reader is encouraged to perform a search on the Internet (a Google search, for example) on virtual colonoscopy or to visit one of the CT manufacturers’ sites and experience a “fly-through.”
REFERENCES
Barnes E: Medical image processing has room to grow—parts 1, 2, and 3 (2006): AuntMinni.com. Accessed December 2006.
Beaulieu, CF, et al. Display modes for CT colonography. Radiology. 1999;212:203–212.
Blezek, DJ, Robb, RA. Evaluating virtual endoscopy for clinical use. J Digit Imaging. 1997;10:51–55.
Brenner, DJ. Radiation risks in diagnostic radiology. In: RSNA categorical course in diagnostic radiology: from invisible to visible—the science and practice of x-ray imaging and radiation dose optimization. Oak Ridge: Radiological Society of North America; 2006:41–50.
Doi, A, et al. 3D volume extraction and mesh generation using energy minimization techniques. In Proceedings of the 1st International Symposium on 3D Data Processing Visualization and Transmission. New York: IEEE; 2002.
Fleiter, T, et al. Comparison of real-time virtual and fiberoptic bronchoscopy in patients with bronchial carcinoma: opportunities and limitations. AJR Am J Roentgenol. 1997;169:1591–1595.
Higgins, WE, et al. Virtual bronchoscopy for three dimensional pulmonary image assessment: state of the art and future needs. Radiographics. 1998;18:761–778.
Hooper, KD. CT bronchoscopy. Semin Ultrasound CT MRI. 1999;20:10–15.
Kopecky, KK. Multislice CT spirals past single-slice CT in diagnostic efficiency. Diagn Imaging. 1999;21:36–42.
Macari, M, Bini, EJ. CT colonography: where have we been and where are we going? Radiology. 2005;237:819–833.
Paik, DS, et al. Automated flight path planning for virtual endoscopy. Med Phys. 1998;25:629–637.
Pickhardt, PJ. Differential diagnosis of polypoid lesions seen at CT colonography (virtual colonoscopy). Radiographics. 2004;24:1535–1559.
Prassopoulos, P, et al. Development of virtual CT cholangiopancreatoscopy. Radiology. 1998;209:570–574.
Rosset, A, et al. Navigating the fifth dimension: innovative interface for multidimensional multimodality image navigation. Radiographics. 2006;26:299–308.
Silva, AC, et al. Three-dimensional virtual dissection at CT colonoscopy: unraveling the colon to search for lesions. Radiographics. 2006;26:1669–1686.
Takanashi, I, et al. 3D active net-3D volume extraction. J Inst Image Information Television Eng. 1997;51:2097–2106.
Taylor, SA, et al. CT colonoscopy: automated measurement of colonic polyps compared with manual techniques—human in vitro study. Radiology. 2006;242:120–128.
Tomandl, BF, et al. Virtual labyrinthoscopy: visualization of the inner ear with interactive direct volume rendering. Radiographics. 2000;20:547–558.
Vining, DJ. Virtual endoscopy: is it reality? Radiology. 1996;200:30–31.
Vining, DJ. Virtual colonoscopy. Semin Ultrasound CT MRI. 1999;20(1):56–60.