Other Technical Applications of Computed Tomography Imaging: Basic Principles
There are several other technical applications of computed tomography (CT) imaging that have been used to image the patient to provide more information to enhance diagnostic interpretation of CT images and also play a role in the medical management of the patient. These applications range from those that have been used successfully in the past, such as subsecond CT scanning (see Chapter 12), CT angiography (CTA), CT fluoroscopy, quantitative CT, and applications of CT in radiation treatment planning, such as CT simulation and image fusion, to other developments. These include CT screening, breast CT, and more recently improved methods for CT imaging of the heart and portable CT scanners.
This chapter presents a description of these technical applications with the goal of setting the stage for a further exploration of these topics. Therefore only the essential technical elements will be introduced, and the interested reader should refer to the literature (journal articles and textbooks) dedicated to a more detailed explanation of the various techniques presented later. The chapter begins with a description of cardiac CT imaging and concludes with a brief introduction to portable CT scanners.
CARDIAC CT IMAGING
The technical advances in CT within the past 10 years have provided the motivation for the development of artifact-free cardiac CT imaging. Two of these advances include faster rotation times and multislice data acquisition methods at submillimeter slice thickness (Blobel et al, 2008; Hsieh et al, 2006). Although the faster rotation times relate to the temporal resolution needed to image the beating heart without motion artifacts, multislice data acquisition addresses the need to cover the organ in its entirety in a single rotation at high spatial resolution. This is necessary to demonstrate the tiny vasculature associated with the anatomy of the heart. The temporal resolution is a measure of the data acquisition time for one image. In addition, multisegment image reconstruction can be used to improve the temporal resolution, which is accomplished by using a set of raw data from a number of cardiac cycles (Blobel et al, 2008). As introduced in Chapter 1, cardiac CT applications include quantitative assessment of coronary artery calcifications, ventricular function assessment, coronary angiography assessment of pulmonary veins, cardiac masses and pericardial disease, and coronary artery bypass grafts and so forth (Prat-Gonzalez et al, 2008).
Although the rotation time for the 64-slice multislice CT (MSCT) scanners is about 330 milliseconds, the temporal resolution is about 165 milliseconds, which is not fast enough to image a fast-beating heart without motion artifacts (Gupta et al, 2006). In an effort to reduce the temporal resolution, two dedicated cardiac CT scanners were introduced: the dual-source CT (DSCT) scanner (Siemens Medical Solutions) and the more recent AquilionONE (Toshiba Medical Systems), a dynamic volume CT scanner.
The AquilionONE scanner features high temporal resolution and covers the entire heart in a single rotation with its wide area detector that offers a 16-centimeter (cm) organ coverage by use of its 320 × 0.5 millimeter (mm) detector rows. The DSCT scanner, on the other hand, uses two data acquisition systems (two x-ray tubes coupled to two sets of detector arrays) offset by 90 degrees to improve the temporal resolution and scan speed. The characteristic features of these two scanners are described in Chapter 12.
Physics of Cardiac Imaging with Multiple-Row Detector CT
Cardiac CT imaging is now being used almost routinely in large centers throughout the world, and therefore it is essential that users and operators alike (technologists and radiologists) have a firm understanding of the fundamental physics of cardiac CT. Mahesh and Cody (2007) describe such physics comprehensively in a seminal article entitled “Physics of Cardiac Imaging with Multiple-Row Detector CT.” This article is reproduced in its entirety in Appendix C. Their coverage includes the following topics:
• Key issues in cardiac imaging with multiple-row detector CT
The reader should review this article for details of the physics of cardiac CT imaging.
CT ANGIOGRAPHY: A TECHNICAL OVERVIEW
A significant advantage of spiral/helical CT data acquisition is its application to three-dimensional (3D) imaging of vascular structures with an intravenous injection of contrast medium. Such an application is referred to as CT angiography (Kalender, 2005; Lell et al, 2006).
During spiral/helical data acquisition, the entire area of interest can be scanned during the injection of contrast. Images can be captured when vessels are fully opacified to demonstrate either arterial or venous phase enhancement through the acquisition of both data sets (arterial and venous). CTA has been applied successfully to a number of examinations investigating vascular anatomy problems and diseases. In particular, CTA techniques have proved useful in imaging the neurovasculature, and in particular stroke, coronary artery disease, the abdominal and thoracic aorta, and renal vasculature and in evaluating the vasculature of the abdominal viscera (Gupta et al, 2006; Pomerantz et al, 2006; Schoepf et al, 2007; Tanenbaum, 2006). Specifically, CTA can provide information regarding carotid artery stenosis, intracranial stenosis, venous thrombosis, vascular malformations, and aneurysms (Lell et al, 2006).
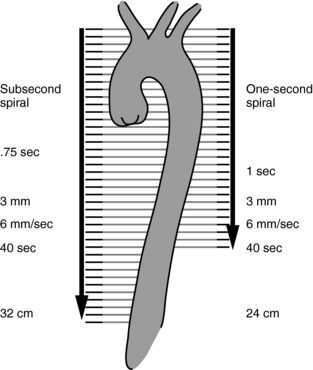
CTA is based on 3D imaging techniques to display images of the vasculature through intravenous administration of contrast, differing from conventional intra-arterial angiography. In 1995, the advantages of CTA over conventional angiography were several; they are highlighted in Table 13-1. At the time, one of the major disadvantages of CTA was its poor spatial resolution (Rawlings, 1995); however, MSCT scanners were developed that feature isotropic imaging, where the voxels are perfect cubes (equal dimensions in all three axes, x, y, and z). The 16- to 64-slice scanners can provide isotropic imaging with thin slice images that show a dramatic improvement in the spatial resolution of CTA images (Tanenbaum, 2006). Furthermore, spiral/helical scanning provides increased volume coverage (Fig. 13-1) without the loss of image quality.
TABLE 13-1
Comparison of the Advantages of Computed Tomographic Angiography and Conventional Angiography
| Conventional Angiography | CT Angiography |
| Biplane systems can acquire at most two view angles of a given vascular structure per contrast injection. When required, alternate views and examination of additional structures require added x-ray exposure and contrast media. | CTA acquires an entire volume of 3D data with a single injection of contrast agent. Thus, arbitrary views can be retrospectively targeted and reconstructed without the need for additional iodine or x-ray exposure. |
| Because an arterial puncture is made, patients must recover from the procedure with close nursing observation and strict bed rest for a minimum of 6 to 8 hours. An overnight hospital stay may also be required. Thus, recovery time adds significantly to the cost of the examination. | Peripheral intravenous injections permit a true outpatient examination with minimal postprocedure observation. |
| Serious complications from angiography can include reactions to contrast media and thromboembolic complications from catheterization of arteries that can lead to infarctions, strokes, arterial dissections, pseudoaneurysms, and arterial bleeding. Using cerebral angiography as an example, the risk of a neurological complication such as a transient ischemic attack or stroke is about 4% and the risk for development of a permanent neurological deficit from a disabling stroke is about 1%. | Although the contrast agent is the same, peripheral intravenous injections significantly reduce the risk of thromboembolic complications. |
| Conventional angiography is a projection imaging technique that produces two-dimensional images of 3D structures. Therefore, blood vessels and other structures that overlap in the direction of the projection may obscure the site of interest. | CTA is a 3D examination. Overlying structures may be eliminated by postprocessing. |
| Conventional angiography is an intraluminal technique and as such does not display mural abnormalities or true mural dimensions, making percent stenosis and aneurysm size measurements difficult. | CT is a cross-sectional imaging modality that exhibits excellent soft tissue discrimination. As such, it has utility for depicting mural thrombus, calcifications, and true mural dimensions. |
From Napel SA: Principles and techniques of 3D spiral CT angiography. In Fishman EK, Jeffrey RB Jr, editors: Spiral CT: principles, techniques and clinical applications, New York, 1995, Raven Press.
Technical Requirements
Several authors, such as Lell et al (2006), Tanenbaum (2006), Jacobs (2006), and Schoepf et al (2007) have described the techniques for CTA with MSCT scanners, and in general they identify at least four major steps that are crucial to carrying out a CTA examination. Careful execution of these steps will serve to optimize the examination and produce high-quality images that will aid the radiologist in making an accurate diagnosis. Essentially these steps include the following:
Patient Preparation: A successful CTA examination depends on careful preparation of the patient before the examination. Such preparation requires that both the technologist and radiologist work together to obtain the appropriate and correct information from the patient and to ensure that the patient understands the procedure, particularly breath-holding techniques. It is not within the scope of this chapter to describe the specifics of patient preparation because this will differ somewhat from department to department.
Acquisition Parameters: The acquisition parameters include the scan speed, the pitch, the spatial resolution needed, contrast material administration, and the image reconstruction algorithm.
In general, a routine CT examination precedes a CTA examination. The routine examination provides some evidence of the range of anatomy to be scanned. Once the scan distance or scan range, R (mm), has been determined, a number of parameters must be carefully chosen to optimize both the quality of the 3D images and the accuracy of the CTA examination. These parameters include the total spiral/helical scan time, T (seconds); the slice thickness, S (mm); and the speed of the patient through the gantry, that is, the table speed, d (mm/second) (Kalender, 2005).
The table speed (or scan speed), can be calculated by using Equation 13-1 or 13-2 (Kalender, 2005):


where s is slice collimation, p is pitch, and t is scan time (seconds) per 360-degree rotation.
The spatial resolution (z-axis or longitudinal resolution) of the CTA images is influenced by the collimation. To image the basal intracranial arteries, for example, a 100-mm length of tissue coverage is necessary. With a four-slice MSCT scanner with a collimated 1-mm section width, a pitch of 1.5, and a gantry rotation time of 0.5 second, the 100-mm volume of tissue can be scanned in 9 seconds. With a 16-slice MSCT scanner with the same pitch and rotation time of the 4-slice MSCT scanner and at a slice width of 0.75 mm, the 100-mm volume can be scanned in 3 seconds (Lell et al, 2006).
In addition, the in-plane spatial resolution is important and is affected by not only the detector design (with thin slices such as 0.5 and 0.75 mm on 16- to 64-slice scanners). As noted by Lell et al (2006), the typical in-plane resolution for a 64-slice scanner with a 0.6-mm detector element is 0.6 to 0.7 mm.
Also influencing the quality of the CTA examination is careful selection of peak kilovolt (kVp) and milliampere (mA) values and the image reconstruction intervals. The selection of kVp and mA used in CTA examinations is usually determined by the size of the patient and the level of noise in the images. To maintain a good signal-to-noise ratio, mA and kVp must be adjusted accordingly. In this respect, Lell et al (2006) and Tanenbaum (2006) point out that 120 kVp is commonly used, mA values selected are based on the size of the patient’s body section to be examined, and 140 mAs (effective) is not uncommon. Finally, the role of isotropic imaging (voxels are perfect cubes) has made a significant impact on the quality of CTA images, especially 3D images and reformatted images (Tanenbaum, 2006).
The image reconstruction interval, or increment, refers to the spacing between the center of the slices. Reconstruction intervals are important because they play a role in the quality of the 3D CTA images. Overlapping reconstructions improve the 3D image quality, and a reconstruction increment of 50% to 75% of the slice width can serve as a “reasonable rule of thumb” (Lell et al, 2006). Spatial resolution is also influenced by the reconstruction algorithm used. Lell et al point out that “the ideal kernel would combine low image noise and sharp edge definition, maintaining good low-contrast resolution.” Additionally, although soft kernels decrease noise and smooth images, edge enhancement kernels improve sharpness but create increased image noise.
Contrast Medium Administration: Imaging the contrast while it is in the vascular area of interest during the CTA examination is a critical step in the acquisition of images. Contrast injection techniques take into consideration the volume of contrast needed to opacify vascular regions, the contrast injection rate, and the timing between the start of contrast medium injection and the start of the spiral/helical scan. Measuring the contrast circulation times for different patients is important in CTA to ensure that images are recorded when flow-in of contrast is optimum in the vessels. To help with this task, various automated systems such as SmartPrep (General Electric Medical Systems), Siemens Combined Applications to Reduce Exposure (CARE Bolus), and Toshiba’s SureStart are available commercially. These products ensure optimized contrast monitoring in CTA. Figure 13-2 demonstrates such optimization with Toshiba’s SureStart package. The change in CT number on the image, which is displayed in real time, is monitored by the monitoring scan. When the contrast reaches a set value (threshold), the monitoring scan ends, and the main scan (helical scan) starts automatically to provide images when contrast flow in the vessels is optimum. Figure 13-3 details the essential steps for operating SureStart.
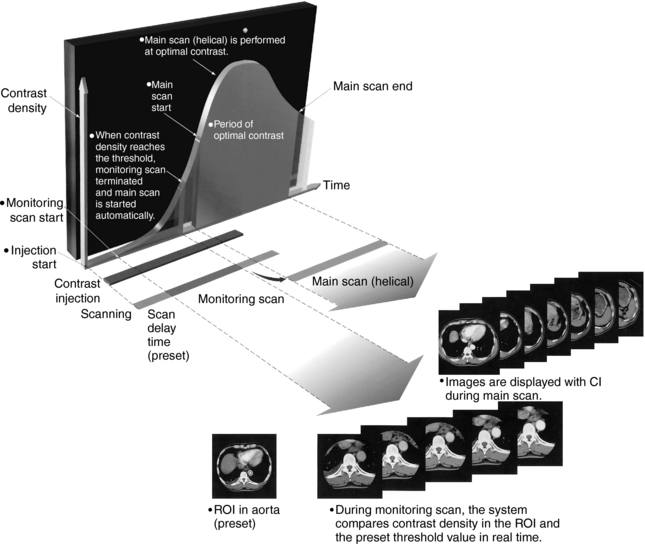
FIGURE 13-2 Optimization of contrast monitoring for CTA examinations using SureStart, an automated package for optimal scan control for contrast studies. ROI, Region of interest. Courtesy Toshiba America Medical Systems, Tustin, Calif.
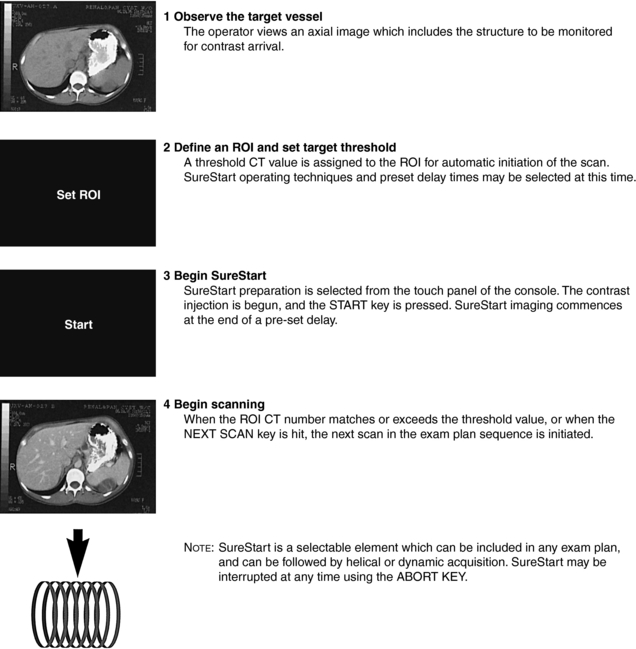
FIGURE 13-3 The four essential steps to operating SureStart, Toshiba’s automated system for optimized contrast monitoring in CTA. ROI, Region of interest. Courtesy Toshiba America Medical Systems, Tustin, Calif.
Consideration must be given to the size of the needle and the site of the injection. Various-size intravenous angiocatheters, such as 18- or 20-gauge or 20- or 22-gauge, are commonly inserted into a medial antecubital vein, using injections at rates that vary from 3 to 4 ml per second to 5 ml per second (Lell et al, 2006).
Image Postprocessing Techniques: Visualization Tools: The algorithms used to display 3D images from the axial data set are described in detail in Chapter 14. These algorithms are digital postprocessing techniques or visualization tools, which are used quite extensively in CTA. Currently, the following techniques are commonplace in CTA:
1. Multiplanar reconstruction (MPR), including curved MPR
2. Shaded surface display (SSD)
Furthermore, the student should refer to Lell et al (2006) for an excellent review of the use of these image postprocessing operations in CTA.
Multiplanar Reconstruction: MPR is the first visualization tool for use in CTA. It is simple and faster to reconstruct than any other 3D technique and enables visualization of the volume data set in any plane, including curved planes. However, MPR is less useful in a number of applications, such as visualization of complex vessels (circle of Willis) and intracranial arteriovenous malformations. In addition, no editing is required when using MPR in CTA examinations.
The use of isotropic imaging possible with multislice CT scanners offering slices from 16 to 320 per revolution provides excellent spatial resolution because the voxels are perfect cubes under certain imaging conditions. Additionally, a variation of the MPR technique called curved MPR can be used to demonstrate tortuous structures (Lell et al, 2006).
Shaded Surface Display: The SSD visualization tool requires little editing to remove overlapping structures obscuring the vessels. It is faster than VR because it uses only a small fraction of the total axial data set. This characteristic can result in artifact generation and images that are not very accurate. SSD images are useful in the display of vascular relationships, vessel origins, and the surface contours of vessels.
Maximum Intensity Projection: The MIP visualization tool is the most frequently used in CTA examinations to display the structure of vessels. It is popular in CT and magnetic resonance imaging (MRI) and is more accurate than SSD (Kuszyk and Fishman, 1998). Although MIP has proved useful in CTA, it requires editing to remove unwanted structures, such as bone and calcified plaques that prevent the observer from viewing intravascular detail. The MIP can be used successfully to separate out vascular calcifications, lumen thrombus, and intravascular thrombus (Oldendorf and Weber, 1997).
Volume Rendering: Another postprocessing 3D visualization tool that is popular for use in CTA is VR. VR uses all the information in the axial data set to display internal structures (soft tissues, vascular and bony anatomy) and to provide accurate vessel diameters and 3D vascular relationships. In the past, VR was performed only on powerful workstations, and not only was it expensive but also time consuming.
SSD and MIP processing techniques use data from surface and voxel intensities, respectively. However, VR uses all the data in the axial volume data set. Therefore, all voxel information is used in the processing. Developments in computer graphics hardware now make it possible to process VR images at higher speeds and higher frame rates (5 to 20 frames/seconds), thus resulting in real-time rendering.
Kuszyk and Fishman (1998) describe four VR parameters intended to enhance the “accuracy and the practicality of CT angiography.” These parameters include windowing (window width and window level), opacity, brightness, and accuracy. Although windowing allows observers to alter the image contrast and density to suit their viewing needs, opacity refers to the degree that structures that are close to the user obscure structures that are further away. Opacity can be varied from 0% to 100%. Higher opacity values produce an appearance similar to surface rendering, which helps to display complex 3D relationships. Lower opacity values allow the user to “see through” structures and can be very useful for such applications as seeing a free-floating thrombus within the lumen of a vein or evaluating bony abnormalities such as tumors that are located below the cortical surface (Kuszyk and Fishman, 1998).
Brightness, on the other hand, provides the observer with the ability to alter the image appearance from 0% to 100%. Kuszyk and Fishman (1998) report that a brightness setting of 100% is useful for a wide range of examinations. Finally, VR provides more accurate results for a number of vascular problems (stenosis, for example) than do SSD and MIP 3D visualization tools (Johnson et al, 1998; Kuszyk et al, 1998). However, Ebert et al (1998) have shown that VR is not without problems. One such problem is that of interobserver variability.
These 3D visualization tools are described in detail in Chapter 14.
Interactive Cine: The developments in image processing and display of 3D images have led to interactive cine viewing and display. Interactive cine refers to the viewing and evaluation of the images in the axial data set by panning through the set of images. Because each of these images is separated only slightly in time, the rapid display of the set of axial images provides the effect of motion (much like a cine film). Although axial images can be used to provide a diagnosis, 3D images help to demonstrate anatomical relationships and show vessels that run along the z-axis.
CT FLUOROSCOPY
The basis for continuous CT imaging or real-time CT fluoroscopy depends on slip-ring technology, high-speed processing of the data collected from the patient, and a fast processing algorithm for image reconstruction. CT fluoroscopy has been used as a guidance tool in interventional radiology procedures (Carlson et al, 2001; Carlson et al, 2005; Hohl et al, 2008; Kalender, 2005; Kataoka et al, 2006; Paulson et al, 2001).
This section of the chapter focuses on a basic description of the imaging principles, equipment components, image quality, and radiation dose considerations.
Conventional CT as an Interventional Guidance Tool
Conventional slice-by-slice CT has been used as a clinical tool for guidance in nonvascular interventional radiologic procedures, such as percutaneous interventions as biopsies and drainage, together with other techniques (e.g., ultrasonography, conventional fluoroscopy, and MRI). A problem with conventional CT-guided interventional procedure, compared with ultrasonography and fluoroscopy, is the lack of real-time display of images, resulting from a time lag between data collection and image reconstruction. Such image display is especially important during needle puncture of the patient. Conventional CT-guided intervention is also limited in imaging body regions where movement is present, such as the respiratory system and the upper abdominal region. The movement associated with these body regions is responsible for shifting and disappearance of lesions of interest, making localization almost impossible (Daly and Templeton, 1999; Froelich et al, 1997). This results in an unsuccessful examination that must often be repeated.
This limitation of conventional CT-guided interventional technique has been overcome by CT hardware and software that allow current CT scanners to reconstruct and display images in real time with frame rates that can vary from two to eight frames per second, depending on the scanner. Such improvements facilitated the development of CT fluoroscopy (Katada, 1996).
CT Fluoroscopy Fundamentals
Historical Background: In 1993 Dr. K. Katada of the Fujita Health University, School of Health Sciences, in Japan initiated the idea for real-time imaging with use of a CT scanner. Dr. Katada subsequently approached Toshiba CT Systems Design Group with a proposal for decreasing the image reconstruction time, the image matrix size, the number of views, and the field-of-view (Katada, 1996). This resulted in a modification of one of Toshiba’s CT scanners to provide images at a rate of three per second with a time delay of 0.83 second. Having conducted preliminary experiments and clinical trials, Katada and colleagues reported their early clinical experience with real-time CT fluoroscopy at the Radiological Society of North America (RSNA) meeting in 1994. The first CT scanner capable of real-time imaging was introduced in North America in 1994.
In 1996 the U.S. Food and Drug Administration approved real-time CT fluoroscopy as a useful clinical tool (Daly and Templeton, 1999). Today, several CT scanner manufacturers offer scanners capable of performing real-time CT fluoroscopy, including Toshiba Medical Systems, Siemens Medical Solutions, Philips Medical Systems, and General Electric Healthcare. These scanners feature multiple-image multidetector row CT fluoroscopy compared with the single-image CT fluoroscopy system (Kataoka et al, 2006; Keat, 2001; Paulson et al, 2001)
The evolution of CT fluoroscopy has now made it possible to acquire dynamic CT images in real time (Fig. 13-4), analogous to dynamic images produced in conventional fluoroscopy.
Imaging Principles Overview: The fundamental principles of real-time CT fluoroscopy are based on three advances in CT technology that have also led to other innovations in CT. The fundamental imaging principles involved in real-time CT fluoroscopy are illustrated in Figure 13-5, which shows three steps that are based on the initial framework of Ozaki (1995): fast continuous scanning, fast image reconstruction, and continuous image display. Each of these is briefly described.
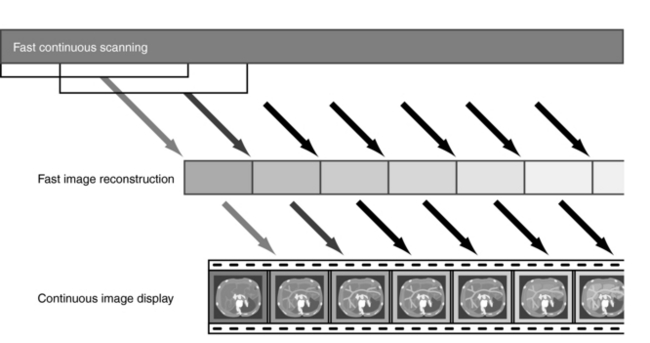
FIGURE 13-5 The principles of real-time CT fluoroscopy are based on three steps: fast continuous scanning, fast image reconstruction, and continuous image display.
Fast Continuous Scanning: Fast continuous scanning was a major technologic development in CT, which resulted in spiral/helical scanning. Spiral/helical scanning is made possible by slip-ring technology, which allows for continuous rotation of the x-ray tube compared with the stop-and-go scanning characteristic of conventional CT systems, which resulted from cable wraparound. Continuous rotation of the x-ray tube speeds up data collection and allows data to be collected for one rotation (360 degrees) per second.
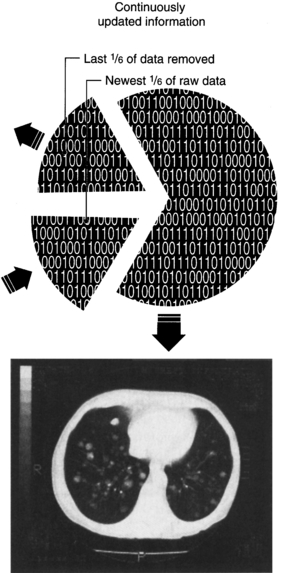
An important point to note during data acquisition in CT fluoroscopy is that the patient does not move during continuous rotation of the x-ray tube. The patient remains stationary. When data are collected after one rotation (360 degrees), the first image is displayed on the monitor for viewing. Subsequent images are displayed every time a data set has been collected for every 60-degree rotation. The data set for every 60-degree rotation is used to refresh the previous image, which is discarded as new 60-degree data sets are processed. This means that six images per second (360/60) can be displayed as shown in Figure 13-6.
Fast Image Reconstruction: In real-time CT fluoroscopy, fast image reconstruction is made possible by a set of hardware components dedicated to provide fast computations, together with a new image reconstruction algorithm. An important point to note about CT fluoroscopy is that the interpolation algorithm used in spiral/helical CT scanning is not used. The purpose of this algorithm is to compute a planar section from which all other sections can be obtained by interpolation. This process removes artifacts resulting from the simultaneous movement of the patient through the gantry while the x-ray tube rotates continuously during data acquisition.
In CT fluoroscopy motion artifacts are therefore present on the image and appear as streaks; however, these artifacts do not restrict visualization of relevant structures. The dedicated hardware components include a fast arithmetic unit, high-speed memory, and a back-projection gate array. All these components are housed in the image reconstruction unit. Parallel processing of the data is an integral element of real-time CT fluoroscopy.
The other key element of a real-time CT fluoroscopic imaging system is an image reconstruction algorithm, the fundamental elements of which were described earlier by Ozaki (1995) and Katada et al (1996). Conceptually, the fast image reconstruction algorithm for CT fluoroscopy processes six images per second (for a 1-second spiral/helical scanner) by first adding the next 60-degree data set acquired and subsequently subtracting the previously acquired 60-degree data set from the image as the data set is acquired continuously (see Fig. 13-6).
Continuous Image Display: As data are collected continuously, it is reconstructed by the fast reconstruction unit on a defined matrix size (256 × 256) and subsequently interpolated to larger matrix sizes 768 × 768 (Paulson et al, 2001) or 1024 × 1024 to provide better resolution. Images are subsequently displayed on a monitor in the cine mode (dynamic display) at frame rates that can vary from two to eight images per second (Carlson et al, 2001).
Equipment Configuration and Data Flow
The basic equipment configuration of a CT fluoroscopic imaging system consists of a number of acquisition, image processing, image display, and recording components (Fig. 13-7).
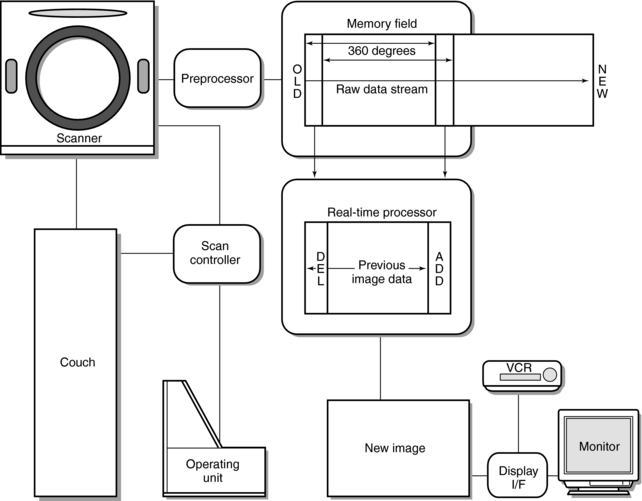
FIGURE 13-7 The basic equipment configuration for CT fluoroscopy. See text for further explanation. From Katada K et al: Guidance with real-time CT fluoroscopy: early clinical experience, Radiology 200:851-856, 1996.
The acquisition components include the scanner, which uses a third-generation spiral/helical data collection geometry with slip-ring technology for continuous data acquisition. The gantry aperture will vary with a variable field of view (FOV) (18 to 40 cm is not uncommon) depending on the type of system. The scanner houses the x-ray generator, x-ray tube, detectors, and associated electronics. The x-ray generator is a high-frequency generator, and the x-ray tube is a high-capacity tube capable of very high heat units.
Once the raw data are acquired, they are sent to a preprocessor and then to the high-speed memory. The first 360-degree data set is processed using convolution and back-projection, and the reconstructed image is displayed on a monitor for viewing. Subsequent CT fluoroscopic data are acquired and processed with the real-time reconstruction unit (as described earlier). With use of a display interface (I/F), images can be stored and be displayed for viewing and interpretation.
The control console for CT fluoroscopy allows the operator to have full control of the table movement through the gantry, to vary height of the tabletop, and to tilt the gantry during the interventional procedure.
X-Ray Technique Parameters
The x-ray exposure parameters can vary depending on the department and the needs of the examination. In general however, tube currents of 30 to 50 mAs and tube voltages of 80 to 120 kVp are not uncommon. Additionally, in the CT fluoroscopy mode, a special filter is introduced into the dose to the patient. The magnitude of the dose reduction depends on the type of scanner and the exposure parameters used during the examination.
Other technique parameters that must be considered in CT fluoroscopy are slice widths (collimator width), the FOV, and the maximum fluoroscopy time. In addition, a choice of slice widths ranging from say 1, 2, 3, 5, 7, to 10 mm and FOV of 18, 24, 32 or 40 cm is available to the operator, and the maximum fluoroscopy time for continuous imaging is 100 seconds. This timer must be reset after 100 seconds of fluoroscopy.
Image Quality and Radiation Dose Considerations
Measuring the parameters that affect image quality and radiation dose ascertains the performance of a CT scanner. In CT fluoroscopy, image quality and radiation assessment are ongoing concerns.
Image Quality: Image quality parameters in CT fluoroscopy include spatial resolution, density resolution, image noise, and artifacts. As early as 1995, these parameters were examined by Ozaki (1995), who compared spatial resolution, density resolution, and image noise of CT fluoroscopy with that of conventional CT. These early results demonstrate that the image quality parameters measured for CT fluoroscopy are comparable to those of conventional CT. For example, Ozaki (1995) showed that, although the spatial and density resolution for CT fluoroscopy was 6.8 line pairs per centimeter (lp/cm) and 3 mm at 0.45%, respectively, it was 7.5 lp/cm and 3 mm at 0.41%, respectively, for conventional CT. Although the image noise for a 10-mm slice at 50 mA used for CT fluoroscopy was ±3.9 Hounsfield units (HU), it was the same (±3.9 HU) at 150 mA for conventional CT.
Radiation Dose Considerations: With any new technique that uses x-rays to image the patient, radiation dose is always a primary consideration because the goal of radiology is to operate within the as low as reasonably achievable (ALARA) philosophy. Furthermore, the dose in CT fluoroscopy is also important because personnel are present in the room during the procedure.
A number of factors influence the dose to the patient and operator in CT (Hohl et al, 2008; Kataoka et al, 2006; Keat, 2001). One of the important factors is the length of the time of the exposure because dose is directly proportional to exposure time. For example, in an early dose assessment study, Daly and Templeton (1999) report absorbed doses in the range of 3.53 rad (35.3 milligrays [mGy]) for 50 seconds of exposure at 80 kVp and 30 mA to 19.81 rad (198.1 mGy) for a similar exposure time at 120 kVp and 50 mA.
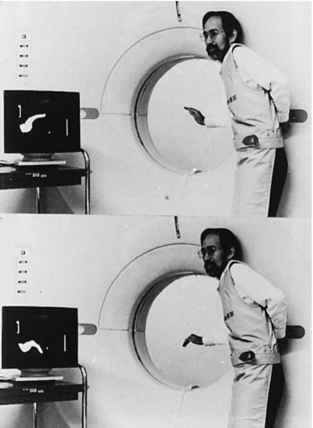
During the development and early implementation of CT fluoroscopy, the dose to the hands of the operator was of particular concern because they were directly in the x-ray beam during the procedure. Early studies reported excessively high doses to the operator’s hands during the procedure (Katada et al, 1996; Kato et al, 1996). The solution to this problem was the development of needle holders, which are intended to keep the hands of the operator out of the x-ray beam. An early study by Kato et al (1996) showed that the needle holders reduced the absorbed dose rate to the operator’s hands. Additionally, the needle holders do not produce image artifacts.
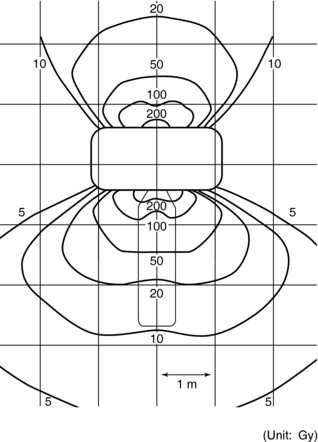
Another concern related to the dose in CT fluoroscopy procedures is that of scatter radiation distribution in the room during the procedure and the dose received by the operator resulting from this scatter. One example of an early scattered radiation dose distribution is shown in Figure 13-8.
Wearing a protective apron during the procedure will certainly reduce the effective dose to the operator. Operators standing in the CT room during the procedure must wear protective lead aprons, thyroid shields, and lead glasses or goggles. These protective apparel must be at least 0.5 mm lead equivalent. Additionally, the use of lead drapes in close proximity will result in a marked reduction of exposure to scattered radiation (Nawfel, 2000; Wagner, 2000).
Reducing radiation dose to both patients and personnel is an important goal of radiology. In CT fluoroscopy, one technique that is incorporated in the design of the equipment to reduce the dose to the patient is the use of a special x-ray filter. In addition, lower tube currents and shorter examination times also play a significant role in reducing patient exposures (Paulson et al, 2001). Another technique referred to as the “quick check” technique can be used to reduce the dose in CT fluoroscopy. As described by Paulson et al (2001), the quick check technique is similar to conventional CT and uses single-section CT fluoroscopic spot images to check the location of the needle and ensure that the correct alignment is obtained.
Another useful method to reduce the dose to the patient and operator is the use of a tungsten antimony shielding drape, which hangs near to the scan plane. With a 16-slice volume CT scanner operating in the CT fluoroscopy mode, the dose was measured to adult and pediatric phantoms with a solid-state UNFORS (Billdal, Sweden) dosimeter.
A more recent study by Hohl et al (2008) investigated the use of angular beam modulation (ABM, see Chapter 10) to reduce the dose in CT fluoroscopy. Their prospective study was done with an Alderson-Rando phantom using thermoluminescent dosimeters and a 64-slice volume CT scanner. Their results showed that the ABM technique reduced the effective dose to the patient by 35%, the skin dose by 75%, the breast dose by 47%, and the hand dose by between 27% and 72%. The authors conclude that “ABM leads to significant dose reduction for both patients and personnel during CT fluoroscopy-guided thoracic interventions, without impairing image quality.”
APPLICATIONS IN RADIATION THERAPY: CT SIMULATION AND IMAGE FUSION
Radiation therapy is an interdisciplinary field based on not only radiation biology but also on physics, mathematics, and engineering. The goal of radiation therapy is to kill tumor cells (tumor volumes) by delivering maximum radiation dose to these cells with minimum dose to the surrounding healthy tissues, especially those that are highly radiosensitive, such as the gonads, eyes, and thyroid, for example.
Through the years radiation therapy has experienced significant technical developments intended to improve the clinical performance of radiation treatment schemes, including the use of imaging techniques to provide more accurate localization of tumor volumes (Kessler, 2006; Newbold et al, 2006; Schlegel et al, 2006) and guidance (Mah and Chen, 2008) and target delineation (Ahn and Garg, 2008). One such important milestone was the development of the CT scanner that became a significant tool in radiation treatment planning in the late 1970s. The fact that the CT scanner produces 3D images paved the way for 3D treatment planning that has now become an integral tool in radiation therapy. With these 3D images from the CT scanner, the tumor volumes can now be accurately localized with respect to the surrounding healthy tissues. In addition, the physical properties such as the electron densities of the tissues can be extracted from the 3D image data sets and are used to calculate radiation treatment doses.
This section of the chapter outlines the elements of the use of the CT scanner in radiation treatment planning through a technique referred to as CT simulation. The physical principles and technology of the CT scanner, image quality, quality assurance, and image processing including 3D imaging techniques, are covered in detail in the rest of this book.
CT Simulation Basics
The CT scanner is now used in the radiation oncology department and plays a role in the radiation treatment planning process. It is an integral part of the CT simulation process (Brunetti et al, 2008; Mutic et al, 2003).
Definition: As defined by Mutic et al (2003), CT simulation “is a geometric simulation process that provides beam arrangements and treatment fields without any dosimetric information.” As shown in Figure 13-9, the CT simulator is coupled to the radiation treatment planning system to provide data for radiation dose calculation.
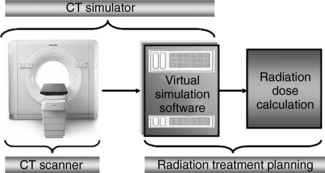
CT Simulator: The CT simulator is a CT scanner characterized by physical devices (hardware) and specialized software.
The hardware is a CT scanner, specifically a multislice CT scanner featuring all the major components (x-ray generator, x-ray tube, detector system, for example) as described in Chapter 12; however, there are several notable features that are different from a CT scanner used in diagnostic CT examinations. For example, this scanner has a flat tabletop with immobilization devices, a large bore (gantry aperture), a registration device, and a laser system. The flat tabletop and immobilization devices ensure that patients are scanned in exactly the same position as they would be when they are on the radiation treatment machine, and the large-bore (e.g., 85 cm) of the scanner accommodates patients in specific positions on the tabletop and enables the use of a large scan FOV. The registration device, on the other hand, ensures that the immobilization device on the CT scanner can be moved and used in exactly the same manner on the treatment machine. Finally, the laser system is intended to facilitate accurate positioning with the axes of the CT scanner.
The CT simulator also includes specialized software referred to as virtual simulation software. While the CT scanner acquires a volumetric data set from the patient and represents the “virtual” patient (or digital patient), the CT simulation software “provides virtual representations of the geometric capabilities of a treatment machine. This software can be a special virtual simulation program or it can be a component of a treatment planning system. Often CT simulation is referred to as virtual simulation and the two terms are used interchangeably. Virtual simulation is used to define any simulation based on the software created ‘virtual simulator’ and a volumetric patient scan. The scan does not necessarily have to be a CT and other imaging modalities can be used. A virtual simulator is a set of software which recreates the treatment machine and which allows import, manipulation, display, and storage of images from CT and/or other imaging modalities” (Mutic et al, 2003).
CT Simulation Process: The CT simulation process includes at least three steps (Fig. 13-10) as identified by Mutic et al (2003). These include the following:

1. Scan the patient in the CT scanner. The patient is positioned, immobilized, and scanned in exactly the same position that he or she would be on the treatment machine. The electron densities from the image data set obtained would be used to compute dose distributions.
2. Plan the treatment and CT simulation. This is where the beam placement and the treatment design are executed using the virtual simulation software, which includes “contouring of the target and normal structures, placement of the treatment isocenter and the beams, design of the treatment portal shapes” and the production of digitally reconstructed radiographs, and finally documentation. It is not within the scope of this section to describe these procedures; however, the interested reader should refer to Mutic et al (2003) for a description of each procedure.
3. Treatment setup. In this final step, the CT simulation software results are used to set up the patient in the treatment machine.
Image Fusion Overview
Anatomical images such as those from the CT scanner or an MRI scanner as well as functional images from nuclear medicine (positron emission tomography [PET]) and single-photon emission computed tomography [SPECT]) are now used in radiation therapy. The overall goal of using these images is to enhance the medical management of the radiation therapy patient (Brunetti et al, 2008; Kessler, 2006; Webb, 2003).
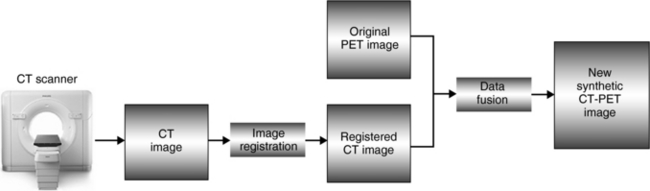
The information from both anatomical and functional images can now be combined using an image synthesis technique called image fusion. Image fusion is computer software that can integrate the image data from CT, MRI, PET, SPECT, and ultrasonography to produce fused images that now contain highly informative data. The basic process is illustrated in Figure 13-11. As can be seen, a technique referred to as image registration (establish the geometric relationships between the images) occurs before image fusion. Image registration is a complex process (Maintz and Viergever, 1998) and its principles are not within the scope of this book.
The clinical applications of image registration and image fusion range from treatment planning and treatment delivery to treatment adaptation and customization (Kessler, 2006).
FLAT-DETECTOR CT
The use of flat detectors or flat-panel digital detectors used in digital projection radiography and fluoroscopy is rapidly replacing image intensifier-based C-arm imaging systems that are used in a CT-like fashion in interventional and intraoperative medical imaging. A flat-panel C-arm imaging system is shown in Figure 13-12.
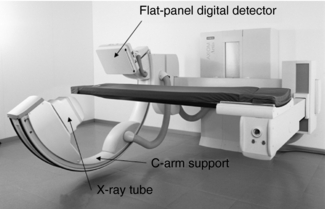
FIGURE 13-12 A C-arm imaging system using a flat-panel digital detector. The digital detector has replaced the image intensifier tube. Photo courtesy General Electric Healthcare.
Definition and Use
Flat-detector CT (FD-CT) refers to “CT imaging using C-arm systems built for radiography and fluoroscopy which are equipped with an FD and prepared to take projection data over an angular range of 180° or more” (Kalender and Kyriakou, 2007).
One of the early applications of using the principle of collecting data over 180 degrees (plus the fan angle of the x-ray beam) was with image intensifier-based C-arm units in interventional angiography (Fahrig et al, 2006). Although these units demonstrated high-contrast vascular structures after intra-arterial injection of contrast media with good spatial resolution, they failed to show low-contrast resolution characteristic of soft tissues. This limitation provided the motivational factors for replacing the image intensifier tube with the flat-panel digital detector used in digital radiography imaging systems.
FD-CT systems are now being used in interventional and intraoperative imaging, radiation therapy, maxillofacial scanning, micro-CT imaging (micro-CT scanners are now being used to image small animals), breast CT imaging, and in a physical setup where they are incorporated in a standard CT gantry (Kalender and Kyriakou, 2007). It is not within the scope of this chapter to outline the details of these applications, and the interested reader should refer to the works of Kalender (2005) for more information. The use of FD-CT for breast imaging is reviewed briefly at the end of this chapter.
Technical Elements
Kalender and Kyriakou (2007) present an excellent technical overview of the major components of FD-CT systems. These include the x-ray tube, the digital detectors, image reconstruction, image quality, artifacts, and radiation dose. In summary they identify the following points as being noteworthy:
1. Table 13-2 presents a comparison of the “typical parameters” between MSCT and FD-CT. It is clear that there is a difference between the two technologies with respect to kVp, mA, generator power, focal spot size, rotation time, detector elements, field of measurement, slice thickness, and data rate.
TABLE 13-2
Typical Parameters for Multislice and Flat-Detector Computed Tomography
| MSCT | FD-CT | |
| Tube voltage (kilovolts) | 80-140 | 50-125 |
| Tube current (mA) | 10-600 | 10-800 |
| X-ray power (kilowatts) | 20-100 | 10-80 |
| Focal spot size (mm) | 0.6-1.2 | 0.3-0.8 |
| Rotation time (seconds) | 0.33-1 | 5-20 |
| Detector elements | ||
| In fan direction | 512-1024 | 512-2490 |
| In z-direction | 16-64 | 512-2490 |
| Field of measurement (mm) | ||
| In fan direction | 500-700 | 100-250 |
| In z-direction | 2-40 | 100-200 |
| Minimum slice thickness (mm) | 0.6 | 0.1-0.3 |
| Typical scintillator/thickness (mm) | Gd2O2S: 1.4 | CsI: (T1) 0.4-0.8 |
| Data rate (megabytes/second) | ≤1000 | ≤60 |
Kalender WA, Kryiakou Y: Flat-detector computed tomography (FD-CT), Eur Radiol 17, 2767-2779, 2007. Reproduced with kind permission of Springer Science and Business Media and the authors.
2. Of the two flat-panel digital detectors (indirect and direct conversion detectors graphically illustrated in Fig. 13-13, A and B. respectively) used for digital radiography, the indirect conversion flat-panel detector is used in FD-CT systems.

FIGURE 13-13 The basic design structure of two types of flat-panel digital detectors. The indirect conversion detector is shown in A and the direct conversion detector is shown in B. See text for further explanation.
3. The indirect conversion detector (Fig. 13-13, A) converts x-ray photons to light by using a cesium iodide (CsI) scintillation phosphor coupled to a photodiode thin film transistor (TFT) array. The photodiode receives the light from the CsI phosphor and converts it into electrical charges that are subsequently stored and read out as an electrical signal (analog signal) by the TFT array. This signal is then digitized by the analog-to-digital converters (ADCs) and sent to a digital computer for processing and image creation. As shown in Fig. 13-13, A, the CsI phosphor is arranged in a needlelike fashion (structured fashion) to reduce the lateral spread of light characteristic of a turbid phosphor. This spread of light (lateral dispersion) destroys the spatial resolution of the image. This problem is solved by the structured phosphor arrangement that improves the spatial resolution of the image.
4. The direct conversion flat-panel digital detector (Fig. 13-13, B) converts x-ray photons directly into electrical signals by using amorphous selenium (a-Se). There is no light conversion step. The a-Se detector has been used in some research units; however, it has not become commonplace in clinical FD-CT systems only because they “do not provide the necessary temporal resolution characteristics and dynamic capabilities” (Kalender and Kyriakou, 2007).
5. The beam from the x-ray tube that falls on a two-dimensional (2D) detector is a cone beam, and therefore a cone-beam algorithm, namely, the Feldkamp algorithm (Chapter 12) is used in the image reconstruction process.
6. Image quality can be discussed in terms of spatial resolution, noise, and contrast resolution. Although the spatial resolution for MSCT systems is about 1.2 lp/mm to 1.4 lp/mm (in the high resolution mode), the spatial resolution from FD-CT is about 1.5 lp/mm with a pixel binning (where pixels in a region, say n × n are combined and read out as one to increase frame rates and reduce noise). With no binning, the spatial resolution is 3.0 lp/mm. This is clearly illustrated in Figure 13-14.
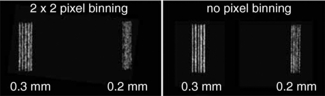
FIGURE 13-14 The visual effect of combining (binning) the pixels on spatial resolution of the FD-CT detector with bar resolution test pattern. No binning of the pixels results in better spatial resolution (sharper bar patterns). From Kalender WA, Kryiakou Y: Flat-detector computed tomography [FD-CT], Eur Radiol 17, 2767-2779, 2007. Reproduced with kind permission of Springer Science and Business Media and the authors.
7. Compared with MSCT detectors, the FD-CT detector has higher noise and reduced low-contrast resolution for a given dose. This is visually illustrated in Figure 13-15. To improve low-contrast detectability, the dose must be increased.
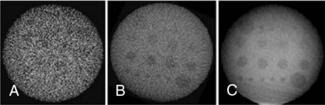
FIGURE 13-15 The detectability of low-contrast details depends on reconstruction parameters and dose. A and B, High- and low-resolution reconstructions are associated with high and low noise, respectively. C, An increase of dose compared with A and B leads to lower noise and results in improved low-contrast detectability. From Kalender WA, Kryiakou Y: Flat-detector computed tomography [FD-CT], Eur Radiol 17, 2767-2779, 2007. Figure and legend reproduced with kind permission of Springer Science and Business Media and the authors.
8. FD-CT is not an artifact-free imaging system. Artifacts can arise from beam hardening (see Chapter 9), defective detector elements, and metal present in the patient. Other artifacts such as cupping and truncation artifacts (see Chapter 9) are also possible. These artifacts however, can be corrected by using suitable correction algorithms.
9. The radiation dose from an FD-CT system is higher compared with that from a clinical CT study for the same image quality because the detection efficiency of the FD-CT detector is lower (Kalender and Kyriakou, 2007).
BREAST CT IMAGING
Mammography is still considered the best imaging modality for the early detection of cancer of the breast through its use as a screening tool (Boone et al, 2004; Glick et al, 2007). Apart from the screening tool advantage, mammography offers high spatial resolution that is critical in demonstrating microcalcifications and masses located in adipose tissue (Glick et al, 2007), but mammography has some drawbacks. These include its poor performance in imaging dense breasts and the superimposition of structures, which is a common problem in projection imaging where a 3D object (the breast) is projected as a 2D image. Such superimposition can create detection problems for the observer.
Early CT Mammography
In the mid 1970s, General Electric Healthcare (formerly General Electric Medical Systems, Milwaukee, Wis.) built two research prototype CT scanners for mammography (CT/M), one of which was installed at the Mayo Clinic and the other at the University of Kansas Medical Center. Researchers at these two facilities conducted clinical efficacy studies of the CT/M systems.
The CT/M unit used a continuously rotating fan beam (26 degrees), a water box, and an array of xenon detectors. Operating at 116 kVp and 30 mA, the absorption values from the breast ranged from −127 to +127 with water being assigned the value of zero (Gisvold et al, 1979). The patient was placed in a prone position and the breast inserted into a hole cut into the tabletop. The breast was lowered into the water box and immersed in water for scanning. X-ray transmissions readings were recorded, and images were reconstructed by the already established fan-beam algorithms typical of conventional diagnostic CT scanners in clinical use. Reconstructed images were displayed on a 128 × 128 matrix with pixel dimensions of 1.5 mm × 1.5 mm (Gisvold et al, 1979).
Clinical studies conducted by Gisvold et al (1979) and Chang et al (1979) showed that “the spatial resolution of CT/M was poor and that the main feature used in interpreting results was the attenuation related measure. With infusion of contrast material, CT/M was capable or revealing clinically and mammographically occult malignancy but was not considered suitable for routine screening of asymptomatic women. The reconstructed images of the original CT/M were prone to artifacts caused by the long scanning time: the lower detectability of small lesions was due to the large slice thickness and poor spatial resolution” (Chen and Ning, 2002).
Major Technical Components
Interest in developing dedicated breast CT scanners using FD detector technology surfaced as early as 2001 (Boone et al, 2004). The advantages offered by FD technology such as wide dynamic range, high spatial resolution, excellent linearity, high detective quantum efficiency, and no geometric distortion provide a good rationale for using them in the design of FD-CT scanners for breast imaging (Chen and Ning, 2002).
The basic design framework for an FD-CT scanner for breast imaging, shown in Figure 13-16, is based on what is referred to as a pendant geometry cone-beam CT imaging system. The major system components include an x-ray tube coupled to a flat-panel digital detector and a tabletop with a hole cut in it. Although the x-ray tube is designed to produce an x-ray beam optimized for breast imaging with appropriate target materials, filters, and beam intensity (lowered kVp and mAs compared with MSCT scanners) (Boone et al, 2004; Chen and Ning, 2002; Glick et al, 2007; Shaw et al, 2005), the flat-panel detector in most systems is a CsI amorphous silicon TFT digital radiography detector. The FD-CT scanner for imaging the breast shown in Figure 13-17 uses a 14-bit (214) 40 cm × 30 cm CsI amorphous silicon TFT digital detector.
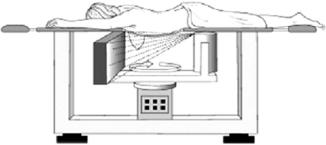
FIGURE 13-16 The basic design framework for an FD-CT scanner for breast imaging on the basis of pendant geometry. See text for further explanation. From Glick SJ et al: Evaluating the impact of x-ray spectral shape on image quality in flat-panel CT breast imaging, Med Phys 34:5-9, 2007. Reproduced by permission of the American Association of Physicists in Medicine.

FIGURE 13-17 An inside view of the flat-panel CsI amorphous silicon TFT digital radiography detector used in the FD-CT scanner for imaging the breast. From Kwan ALC et al: Evaluation of the spatial resolution characteristics of a cone-beam breast CT scanner, Med Phys 34:275-281, 2007. Reproduced by permission of the American Association of Physicists in Medicine.
The patient is placed in a prone position on the tabletop and the breast to be scanned is inserted through the hole to hang during the imaging process by use of a cone beam wide enough to cover the detector, as shown in Figure 13-16. This geometry is referred to as pendant geometry (Boone et al, 2007), and it prevents exposure of the chest cavity. The x-ray tube and detector are positioned close to the underside of the tabletop and rotate around the hanging breast. X-ray transmission readings are collected, digitized, and subsequently sent to the computer for image reconstruction with use of the Feldkamp cone-beam algorithm (see Chapter 12).
Research Studies
To date, a number of research studies have been conducted to evaluate the physical imaging parameters of the FD-CT breast scanner, such as the dose and image quality (Boone, 2001; Boone et al, 2004; Chen and Ning, 2002; Glick et al, 2007; Kwan et al, 2007; Shaw et al, 2005). It is beyond the scope of this section to elaborate on the results of these studies, and therefore the interested reader should refer to them for details of the findings with respect to each of these parameters.
In conclusion, Shaw et al (2005) showed that “the 3D nature of the image data may help eliminate interference from overlapping structures and allow lesions to be better defined and localized for biopsy or needle localization procedures. This suggests that cone beam CT breast imaging is a potentially powerful tool for diagnosis and management of breast cancers.”
CT SCREENING
The use of any medical technology for early detection of disease in healthy (asymptomatic) people is referred to as screening. In particular, the use of CT technology for the early detection of diseases in asymptomatic patients is popularly referred to a CT screening (Beinfield et al, 2005; Brant-Zawadzki, 2002; Brenner, 2006; Furtado et al, 2005; Horton et al, 2004; NY-ELCAP Investigators, 2007).
Rationale
Several investigators have provided the rationale for CT screening; it is fundamentally based on the increased prevalence of various types of high-risk diseases that may cause death to the population (Brant-Zawadzki, 2002). The increasing availability and ease of use of CT imaging has also provided a basis for its use as a screening tool.
Although there are those who support the use of CT as a screening tool, there are others who are vehemently opposed to its use in screening asymptomatic individuals. In this regard, therefore, CT screening “has generated significant controversy” (Horton et al, 2004), and it is not within the scope of this book to outline the elements of the controversy. The interested reader may refer to the various references cited in this section for an elaboration of the controversy.
Applications
The literature exploring the use of CT screening continues to increase from 2002 to the present. CT screening has been used in lung cancer screening, colon screening, coronary artery disease screening, and whole-body screening of healthy individuals. Although clinical efficacy studies have been performed on the first three mentioned previously to provide tangible justification for the use of CT screening, the latter (whole-body screening) remains a highly controversial subject (Brenner, 2006). The reason is that no studies (at the time of writing this chapter) have clearly demonstrated that whole-body CT screening has extended the life of individuals (Brenner, 2006).
Radiation Doses
Personnel working in radiology operate within the ALARA philosophy that requires that the dose to the patient should be kept as low as possible. To operate effectively within this philosophy, operators are now concerned with dose/image quality optimization, a procedure that ensures that the use of low doses does not compromise the image quality needed to make a diagnosis.
In addressing the dose issues in imaging asymptomatic individuals by CT screening, one notable expert, Dr. David Brenner, PhD, DSc, provides the radiological community with the following statement: “…the radiation exposure issues that relate to CT-based mass screening are unique. It is true, of course, that mammography also involves the use of x-rays, but the radiation doses involved are generally much higher for CT-based screening than for mammography. Thus, in addition to the more general efficacy issues discussed … the potential benefits of any CT-based screening procedure must far outweigh any potential harm from repeated low-dose x-ray exposures” (Brenner, 2006).
QUANTITATIVE CT
Quantitative CT is the most sensitive of all x-ray techniques for the measurement of the mineral content of trabecular bone in osteoporosis. This measurement is the bone mineral density (Kalender, 2005). Quantitative CT involves at least seven steps, as follows:
1. A prescan localization image is obtained (Fig. 13-18). This is sometimes referred to as a scout view (General Electric), or topogram (Siemens). The image is obtained as the patient moves through the gantry aperture while the x-ray tube and detector remain stationary. The computer then builds an image that resembles a conventional radiographic image.
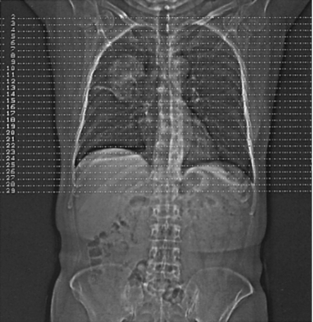
FIGURE 13-18 Prescan localization image produced when the patient moves continuously through the gantry while the x-ray tube and detectors remain in a fixed position. Courtesy Siemens Medical Systems, Iselin, NJ.
2. The slices are selected from the prescan localization image, and the midvertebral planes are examined.
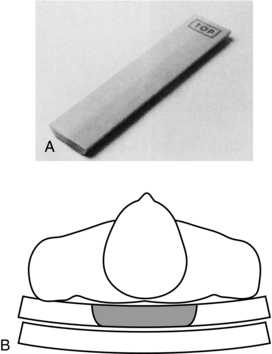
3. Transverse axial images are obtained. At this time, a reference phantom (Fig. 13-19, A) that contains water and bone-equivalent parts is positioned and scanned with the patient (Fig. 13-19, B).
4. An automatic contour tracing of trabecular and cortical regions of interest (ROI) is obtained (Fig. 13-20).
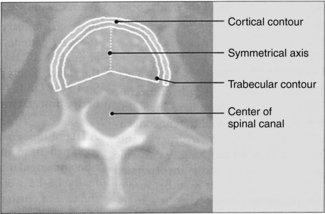
FIGURE 13-20 Automatic contour tracing of trabecular and cortical regions of interest. From Nagel W et al: Recent clinical results on the use of QCT in diagnosis of osteoporosis, Electromedica 55:104-110, 1987.
5. The computer calculates the mean values of the ROI.
6. The ROI values are converted to bone mineral density values.
7. An image graphics output is obtained, which shows the bone mineral density values plotted as a function of age. The bone mineral content is then determined and compared with normal values.
PORTABLE MULTISLICE CT IMAGING
Several problems are associated with transporting patients to a fixed CT scanner: (1) the risks of transporting unstable patients, (2) the costs associated with the workload of staff who are involved in patient transportation, and (3) the maintenance of the nurse-to-patient ratio in critical care. These problems are solved by using portable CT scanners. These scanners can be transported to critically ill patients in the intensive care unit, for example, to the emergency department, to the operating room, and other areas of the hospital where these patients are cared for. In addition, these scanners can be used in private medical facilities as well, to image ambulatory and other patients seen for various CT examinations.
Physical Principles
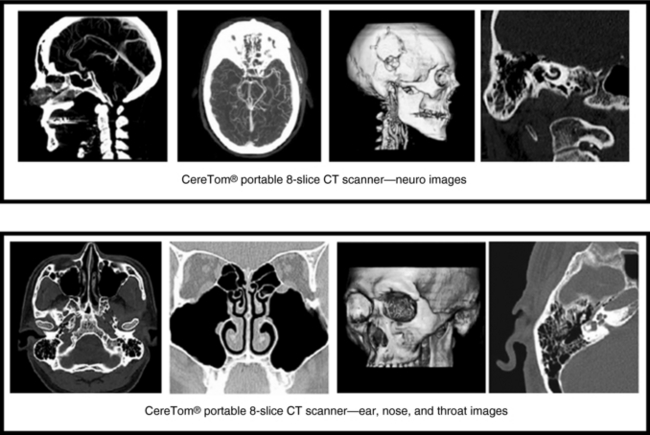
Portable multislice CT scanners are now commercially available from the NeuroLogica Corporation (Danvers, Mass.) specifically for imaging critically ill patients and other patients in the hospital who cannot be easily transported to the radiology department for examination by fixed CT scanners. The NeuroLogica Corporation has developed portable multislice (eight slices/revolution) CT scanners (CereTom) specifically designed for imaging anatomy that can fit into a 25-cm scan FOV, namely, the head and neck. The scanners therefore have been designed to image the brain, the neck up to the fifth cervical vertebrae (C5), and the ear, nose, and throat. In addition, CT perfusion, and xenon CT studies can be done on these portable multislice CT scanners.
The CereTom portable CT scanner is based on the same physical principles as fixed multislice CT scanners with up to eight detector rows (see Chapter 12). The goal of the portable CT scanner is to produce diagnostic quality images that are based on x-ray attenuation data collected from the patient and measured by multirow detectors. The detectors convert the x-ray photons into electrical signals (analog data) that are subsequently converted into digital data by the detector electronics (ADCs). The digital data are then sent to the computer for image reconstruction.
Instrumentation
The CereTom portable multislice CT scanners are compact, lightweight, high speed, battery and wall-powered scanners that can be transported to any point of care. The scanner is characterized by three major equipment components: a compact CT gantry (Fig. 13-21), a silhouette scan board that is made of carbon fiber, and a laptop computer workstation/cart.
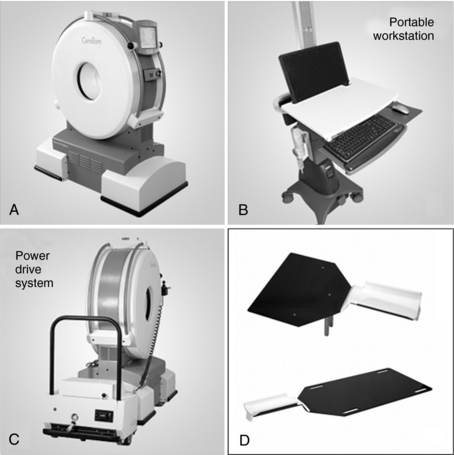
FIGURE 13-21 The gantry of the portable multislice CT scanner. A, Typical portable workstation. B, Power drive system. C, Scan boards to convert the patient’s bed into a scanning platform (D). Courtesy NeuroLogica, Danvers, Mass.
General System Requirements: The general system requirements can be described in terms of site requirements (space, room, temperature, and humidity) and installation requirements (power requirements and minimum line current ratings).
The CereTom portable CT scanner does not require any special electrical considerations because it can operate with single-phase alternating current power and 90- to 260-volt wall power outlets operating at 50 to 60 Hertz. In case of a power failure, the scanner is equipped with an independent battery power source that can last 2 hours (no scans) when fully charged.
Gantry Characteristics: The CereTom portable CT gantry (see Fig. 13-21) houses the x-ray tube, generator, detectors, and detector electronics. The detector electronics play an important role in analog-to-digital conversion and digital data transmission to the minicomputer system, which is responsible for image reconstruction and image processing.
The gantry characteristics of the CereTom portable CT scanner include the gantry aperture with an opening of 32 cm to accommodate the patient’s anatomy. Furthermore, the gantry will not tilt and therefore patient positioning is used to deal with views that require a gantry tilt. As mentioned earlier, the maximum scan FOV is 25 cm to accommodate examinations of the head, face, and neck.
The gantry also houses the x-ray tube with a fixed anode having a focal spot size of 1 mm × 1 mm and a maximum cooling of 2 minutes, and it can operate at tube currents between 1 and 7 mA and at 100, 120, and 140 kVp. The beam emerging from the x-ray tube is a cone beam because an eight-slice multirow solid-state detector system is used. Therefore, image reconstruction follows that described for cone-beam CT scanners using up to eight detector rows, as described in Chapter 12.
The CereTom portable CT scanner is based on the third-generation CT design concept, in which the x-ray tube is coupled to the multidetector row system that can provide slice thicknesses of 1.25, 2.5, 5, and 10 mm. Both the x-ray tube and detectors rotate at the same time during data collection.
Operator’s Laptop Computer Workstation: An integral component of the CereTom portable CT scanner system is the operator’s console, which is a DICOM (digital imaging and communication in medicine) compliant gigabit Ethernet networked laptop computer workstation with wireless connectivity to PACS (picture archiving and communication system). In addition, a 20-inch liquid crystal display monitor is available with a display matrix of 1920 × 1200. The CT number range with this scanner is between −1024 and 3071, featuring both variable and preset windows.
The workstation allows the operator to select scan protocols and window settings optimized from specific protocols. The operator can also perform several image processing functions such as advanced 3D visualization (targeted, segmentation, MIP) and MPR (sagittal, coronal, axial, curved and sliding slab) and so on, as shown in Figure 13-22.
Imaging Performance
The imaging performance of the CereTom portable CT scanner can be described in terms of spatial resolution, contrast resolution, noise, and radiation dose considerations. NeuroLogica provided the data presented later.
Spatial Resolution: Spatial resolution refers to the ability of the scanner to image fine detail, measured in lp/cm. Several figures for spatial resolution have been reported for the CereTom portable CT scanner and the user should refer to the manufacturer product data for these numbers. For example, spatial resolution has been reported to be 7.4 lp/cm at 10% modulation transfer function (MTF) to 13.0 lp/cm at 10% MTF depending on the reconstruction kernel and the windowing used.
Contrast Resolution: Contrast resolution refers to the ability of the scanner to demonstrate small differences in tissue contrast. The contrast resolution of the CereTom portable CT scanner has been measured by using an 8-inch Catphan phantom with 10-mm slice thickness at 15 mAs and 140 kVp and has been reported to be 3 mm at 0.3%.
Noise: Image quality from the portable CT scanner is also affected by noise. In CT, noise refers to the fluctuation of CT numbers between points in the image for a scan of uniform material such as water. The noise level is a percentage of contrast in CT numbers. The noise level of the CereTom portable CT scanner is 0.3% at 15 mAs and 140 kVp with a 10-mm slice thickness.
CT Dose Index: Manufacturers of CT scanners are now required by law to provide the CT dose index (CTDI) for their scanners. For the CereTom portable CT scanner, with a head phantom only (because of the small CereTom patient aperture) at 120 kV, 14 mAs, 2-second scan time, and a 10-mm aperture, the CTDI for the center and surface of the head phantom is 35.8 and 46.64 mGy, respectively.
Scattered Radiation Considerations: As in any portable x-ray imaging procedure, scattered radiation from the portable CT scanner concerns radiation workers and those individuals working in areas in which portable CT examinations are performed. For the CereTom portable CT scanner, the scatter radiation in general at 1 meter from the isocenter of the scanner is about 0.2 mRgm.
REFERENCES
Ahn, PH, Garg, MK. Positron emission tomography/computed tomography for target delineation in head and neck cancers. Semin Nucl Med. 2008;38:141–148.
Beinfield, MT, et al. Cost effectiveness of whole-body CT screening. Radiology. 2005;234:415–422.
Blobel, J, et al. Heart rate adaptive multisegment image reconstruction in diagnostic cardiac computed tomography. Visions. 2008;12:12–16.
Boone, JM, et al. Dedicated breast CT: radiation dose and image quality evaluation. Radiology. 2001;221:657–667.
Boone, JM, et al. A comprehensive analysis of DgN(CT) coefficients for pendant-geometry cone-beam breast computed tomography. Med Phys. 2004;31:226–235.
Brant-Zawadzki, MN. Screening CT: rationale. Radiographics. 2002;22:1532–1539.
Brenner, DJ. Radiation risks in diagnostic radiology. In: Huda W, ed. RSNA categorical course in diagnostic radiology physics: from invisible to visible—the science and practice of x-ray imaging and radiation dose optimization. Oakridge: Radiological Society of North America; 2006:41–50.
Brunetti, J, et al. Technical aspects of positron emission tomography/computed tomography fusion planning. Semin Nucl Med. 2008;38:129–136.
Carlson, SK, et al. Benefits and safety of CT fluoroscopy in interventional radiologic procedures. Radiology. 2001;219:515–520.
Carlson, SK, et al. CT fluoroscopy-guided biopsy of the lung or upper abdomen with a breath-hold monitoring and feedback system: a prospective randomized controlled clinical trial. Radiology. 2005;237:701–708.
Chang, CH, et al. Specific value of computed tomography breast scanner (CT/M) in diagnosis of breast diseases. Radiology. 1979;132:647–652.
Chen, B, Ning, R. Cone-beam volume CT breast imaging: feasibility study. Med Phys. 2002;29:755–770.
Daly, B, Templeton, PA. Real-time CT fluoroscopy: evolution of an interventional tool. Radiology. 1999;211:309–315.
Ebert, DS, et al. Evaluating the potential and problems of three-dimensional computed tomography measurements of arterial stenosis. J Dig Imag. 1998;11:1–8.
Fahrig, R, et al. Dose and image quality for a cone-beam C-arm CT system. Med Phys. 2006;33:4541–4550.
Froelich, JJ, et al. Guidance of non-vascular interventional procedures with real-time CT-fluoroscopy. Electromedica. 1997;66:50–55.
Furtado, CD, et al. Whole-body CT screening: spectrum of findings and recommendations in 1192 patients. Radiology. 2005;237:385–394.
Gisvold, JJ, et al. Computed tomographic mammography (CT/M). AJR Am J Roentgenol. 1979;133:1143–1149.
Glick, SJ, et al. Evaluating the impact of x-ray spectral shape on image quality in flat-panel CT breast imaging. Med Phys. 2007;34:5–9.
Gupta, R, et al. Computed tomography angiography in stroke imaging: fundamental principles, pathologic findings, and common pitfalls. Semin Ultrasound CT MRI. 2006;27:221–242.
Hohl, C, et al. Dose reduction during CT fluoroscopy: phantom study of angular beam modulation. Radiology. 2008;246:525–530.
Horton, KM, et al. CT screening: principles and controversies. In: Fishman EK, Jeffrey B, eds. Multidetector CT: principles, techniques, and clinical applications. Philadelphia: Lippincott Williams & Wilkins; 2004:549–559.
Hsieh, J, et al. Step-and-shoot data acquisition and reconstruction for cardiac x-ray computed tomography. Med Phys. 2006;33:4236–4248.
Johnson, PT, et al. Interactive three-dimensional volume rendering of spiral CT data, current applications in the thorax. Radiographics. 1998;18:165–1987.
Kalender W: Computed tomography: fundamentals, system technology, image quality, applications, GWA, Germany, 2005, Publicis Corp. Publishing.
Kalender, WA, Kryiakou, Y. Flat-detector computed tomography (FD-CT). Eur Radiol. 2007;17:2767–2779.
Katada, K, et al. Guidance with real-time CT fluoroscopy: early clinical experience. Radiology. 1996;200:851–856.
Kataoka, ML, et al. Multiple-image in-room imaging guidance for interventional procedures. Radiology. 2006;239:863–868.
Kato, R, et al. Radiation dosimetry at CT fluoroscopy: physician’s hand dose and development of needle holders. Radiology. 1996;201:576–578.
Keat, N. Real-time CT and CT fluoroscopy. Br J Radiol. 2001;74:1088–1090.
Kessler, ML. Image registration and data fusion in radiation therapy. Br J Radiol. 2006;79:S99–S108.
Kuszyk, BS, Fishman, EK. Technical aspects of CT angiography. Semin Ultrasound CT MRI. 1998;19:383–393.
Kuszyk, BS, et al. Neurovascular applications of CT angiography. Semin Ultrasound CT MRI. 1998;19:394–404.
Kwan, ALC, et al. Evaluation of the spatial resolution characteristics of a cone-beam breast CT scanner. Med Phys. 2007;34:275–281.
Lell, MM, et al. New techniques in CT angiography. Radiographics. 2006;26:S45–S62.
Mah, D, Chen, CC. Image guidance in radiation oncology treatment planning: the role of imaging technologies on the planning process. Semin Nucl Med. 2008;38:114–118.
Mahesh, M, Cody, DD. Physics of cardiac imaging with multiple-row detector CT. Radiographics. 2007;27:1495–1509.
Maintz, JB, Viergever, MA. A survey of medical image registration. Med Image Anal. 1998;2:1–36.
Mutic, S, et al. Quality assurance for computed tomography simulators and computed tomography-simulation process: report of the AAPM Radiation Therapy Committee Task Group No 66. Med Phys. 2003;30:2762–2792.
Nawfel, RD, et al. Patient and personnel exposure during CT fluoroscopy-guided interventional procedures. Radiology. 2000;216:180–184.
Newbold, K, et al. Advanced imaging applied to radiotherapy planning in head and neck cancer: a clinical review. Br J Radiol. 2006;79:554–561.
Oldendorf, M, Weber, P. Postprocessing techniques in CT angiography. Electromedica. 1997;65:21–26.
Ozaki, M. Development of a real-time reconstruction system for CT fluorography. Med Rev. 1995;53:12–17.
Paulson, EK, et al. CT fluoroscopy-guided interventional procedures: techniques and radiation dose to radiologists. Radiology. 2001;220:161–167.
Pomerantz, SR, et al. Computed tomography angiography and computed tomography perfusion in ischemic stroke: a step-by-step approach to image acquisition and three-dimensional postprocessing. Semin Ultrasound CT MRI. 2006;29:243–270.
Prat-Gonzalez, S, et al. Cardiac CT: indications and limitations. J Nucl Med Technol. 2008;36:18–24.
Rawlings, LH. Non-invasive cardiovascular imaging: focus on spiral CT angiography. Appl Radiol. 1995;12:28–32. [March].
Schlegel W, et al, eds. New technologies in radiation oncology. New York: Springer, 2006.
Schoepf, UJ, et al. Coronary CT angiography. Radiology. 2007;244:48–63.
Shaw, CC, et al. Cone beam breast CT with a flat panel detector—simulation, implementation, and demonstration. In: Proceedings of the IEEE, Engineering in Medicine and Biology 27th Annual Conference. Hong Kong, China: The Conference; 2005:4461–4464.
Tanenbaum, LN. Helical MCCT angiography: tips and techniques. Appl Radiol. 2006;4:3–10.
Wagner, LK. CT fluoroscopy: another advancement with additional challenges in radiation management. Radiology. 2000;216:9–10.
Webb, S. The physical basis of IMRT and inverse planning. Br J Radiol. 2003;76:678–689.