Introduction to: Discussion, questions and answers
This question is based on a survey which was published in an Australian newspaper. Of course, such surveys do not represent research published in scientific journals, but they are important sources for public knowledge and/or attitudes towards health sciences issues. The survey questioned a sample of adults concerning their smoking habits. Only one of the questions asked is discussed here and the results are hypothetical.
Table D24.1 Survey characteristics
| Sample | 1000 voters |
| Coverage | Australia-wide |
| Method | Telephone |
| Question | Do you smoke? (Yes or No) |
| Percentage of replies to the question in two major cities | ||
|---|---|---|
| Melbourne | Sydney | |
| Yes | 24 | 18 |
| No | 76 | 82 |
Questions
The following questions involve the critical analysis of the above survey.
1. If we assume that cigarette smoking is now a ‘stigmatized’ behaviour, do you think the telephone survey produced valid answers?
2. A total of 180 people were interviewed in Melbourne and 220 in Sydney. If the population of Australia is 17 million and the populations of Melbourne and Sydney are 2.5 and 3.2 million respectively, do the samples appear to be quota samples?
3. Which categories of smokers may not have been reached by this survey? What implications might this have for the external validity of the survey?
4. A journalist commented on the results, saying: ‘This difference is ironic, given that anti-smoking lobbyists have applauded Melbourne as a pacesetter for smoking law reform, such as tobacco tax-funded health promotion’.
(b) What research design would be appropriate to show a causal effect on smoking due to health promotion on smoking? (Hint:see Ch. 6.)
5. Explain why the comment quoted in question 4 is inappropriate, given that the statistical significance of the results was not calculated.
6. Which statistical test should be used to analyse the significance of the results concerning differences in smoking between the two cities? Justify your selection.
Answers
1. Although telephone interviews and mailed-out questionnaires are a relatively cost-efficient strategy for collecting data, we have problems validating the responses. This is particularly true for conditions and behaviours which are socially stigmatized: why should respondents disclose such information about themselves? In face-toface interviews, we can explore issues, for example if the respondents have nicotine-stained fingers or smell of cigarettes, we may pursue the issue further to establish the accuracy of the replies.
2. Given that n = 1000, 18% of the respondents were from Melbourne and 22% from Sydney. For a quota sample, the expected samples would be:


Assuming that the information used to calculate the above figures is correct, it seems that the sample included more respondents from Melbourne. This may reflect the different proportion of ‘voters’ in the two cities, or a rather poor quota sample.
3. People who are not on the electoral roll, such as persons under 18 years of age, and people who do not have or do not answer their telephones, would not have been contacted. In this way, the sample may not be representative of all the smokers in the city (e.g. young people, poor or itinerant people, people with unlisted telephone numbers). Therefore, the survey may not be externally valid if we generalize to all persons in Australia who smoke.
5. Although results for the samples show a difference between the two cities, this may simply reflect sampling error. We must establish the significance of the results before we can draw inferences (‘ironic’ or otherwise) about populations.
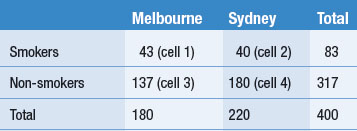
7. Convert the data into frequencies (see Ch. 19) before entering obtained values into a 2 × 2 contingency table (values rounded to closest whole number).
Expected values (for calculation procedure, see Ch. 19):
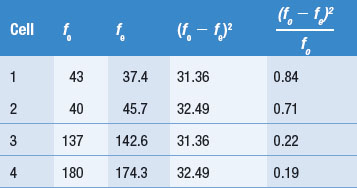

In this case we would retain H0: there is no association between the variables ‘city’ (Melbourne or Sydney) and smoking (Yes or No). (For details of the decision-making process, refer to Ch. 19.) It is apparent that the results are not significant, therefore we are not justified in drawing any inferences concerning the different proportions of smokers in Melbourne and Sydney.
8. Although a sample size of n = 1000 appears quite large, this was an Australia-wide sample which was divided up to represent regions. It is possible that the null results obtained in question 7 are because there are no differences in smoking rates between the two cities, but there are other possibilities (see Ch. 20). Perhaps the sample size was inadequate and we made a Type II error in our decision. Replicating the study with larger sample sizes might enable us to show significant differences in smoking rates.