Experimental-Type Designs
Using the language introduced in Chapter 8, we are ready to examine the characteristics of designs in the experimental-type research tradition. Experimental designs have traditionally been classified as true-experimental, quasi-experimental, pre-experimental, and nonexperimental. The true experiment is the criterion by which all other methodological approaches are judged. Most people think that the only real research or science is the experimental method. Of all the experimental-type designs, the true-experimental design offers the greatest degree of control and internal validity. It is this design and its variations that are used to reveal causal relationships between independent and dependent variables. Also, this design is often upheld as the highest level of scientific evidence, particularly in evidence-based practice model research and ratings that are applied to studies for the development of clinical guidelines as we discuss subsequently.
Although the true-experimental design is continually upheld as the most “objective” and “true” scientific approach, we believe it is important to recognize that every design in the experimental-type tradition has merit and value. The merit and value of a design are based on how well the design answers the research question that is being posed and the level of rigor that the investigator brings to the plan and conduct of the inquiry. This view of research differs from the perspective of the many experimental-type researchers who present the true experiment as the only design of choice and suggest that other designs are deficient or limited.1,2
We suggest that a design in the experimental-type tradition should be chosen purposively because it fits the question, level of theory development, and setting or environment in which the research will be conducted. True experimentation is the best design to use to predict causal relationships, but it may be inappropriate for other forms of inquiry in health and human service settings. In other words, not all research questions seek to predict causal relationships between independent and dependent variables. Moreover, in some cases, using a true-experimental design may present critical ethical concerns such that other design strategies may be more appropriate.
True-experimental designs
To express the structural relationships of true-experimental designs, we use Campbell and Stanley's classic, widely adopted notation system to diagram a design: X represents the independent variable, O the dependent variable, and R denotes random sample selection,3 as follows:

We also find it helpful to use the symbol r to refer to random group assignment in the absence of random sample selection. It is often difficult and frequently inappropriate or unethical for health and human service professionals to select a sample from a larger, predefined population based on random selection (R); rather, typically subjects enter studies on a volunteer basis. Such a sample is one of convenience in which subjects are then randomly assigned to either the experimental or the control group. The addition of “r” denotes this important structural distinction. Designs in which samples are not randomly selected but are randomly assigned still meet the criteria for true experimentation, but as we discuss later, are limited in their external validity, the degree to which the sample represents the population from which it was selected.
True-experimental designs are most commonly thought about when beginning researchers and laypersons hear the word “research.” True-experimental design refers to the classic two-group design in which subjects are randomly selected and randomly assigned (R) to either an experimental or control group condition. Before the experimental condition, all subjects are pretested or observed on a dependent measure (O). In the experimental group the independent variable or experimental condition is imposed (X), and it is withheld in the control group. After the experimental condition, all subjects are posttested or observed on the dependent variable (O).
 You are interested in enhancing shoulder range of motion in persons with stroke. The dependent variable would be a measure of shoulder range of motion, the independent variable or experimental condition a particular therapy protocol that is introduced, and the control condition a control group who receives usual care. Subjects in a rehabilitation facility who meet specific criteria for study participation would be pretested on the measure of shoulder range of motion, randomly assigned to receive the experimental condition or usual care, and then retested using the same range of motion measure.
In this design, the investigator expects to observe no difference between the experimental and control groups on the dependent measure at pretest. In other words, subjects are chosen randomly from a larger pool of potential subjects and then assigned to a group on a “chance-determined” basis; therefore, subjects in both groups are expected to perform similarly. In the example, we would expect that subjects in experimental and control group conditions would have similar shoulder range of motion scores at the first baseline or pretest assessment. However, the investigator anticipates or hypothesizes that differences will occur between experimental and control group subjects on the posttest scores. This expectation is expressed as a null hypothesis, which states that no difference is expected. In a true-experimental design, the investigator always states a null hypothesis that forms the basis for statistical testing. Usually in research reports, however, the alternative (working) hypothesis is stated (i.e., an expected difference). If the investigator's data analytical procedures reveal a significant difference (one that does not occur by chance) between experimental and control group scores at posttest, the investigator can fail to accept the null hypothesis with a reasonable degree of certainty. In failing to accept the null hypothesis, the investigator accepts with a certain level of confidence that the independent variable or experimental condition (X) caused the outcome observed at posttest time in the experimental group. In other words, the investigator infers that the difference at posttest time is not the result of chance but is caused by participation in the experimental condition.
Three major characteristics of the true-experimental design allow this causal claim to be made (Box 9-1).

Randomization
Randomization occurs at the sample selection phase, the group assignment phase, or both. If random sample selection is accomplished, the design notation appears as presented earlier (R). If randomization occurs only at the group assignment phase, we represent the design as such (r):

As we noted earlier, this variation has implications for external validity. Remember that a true-experimental design that does not use random sample selection is limited in the extent to which conclusions can be generalized to the population from which the sample is selected. Because subjects are not drawn by chance from a larger identified pool, the generalizability or external validity of findings is limited. However, such a design variation is common in experimental research and can still be used to reveal causal relationships within the sample itself.
Although random sample selection is often not possible to achieve, random assignment of subjects to group conditions based on chance is essential in true experimentation. It enhances the probability that subjects in experimental and control groups will be theoretically equivalent on all major dependent variables at the pretest occasion. Randomization, in principle, equalizes subjects or provides a high degree of assurance that subjects in both experimental and control groups will be comparable at pretest or the initial, baseline measure. How is this possible? By randomizing, people are assigned by chance, and as such, the researcher does not introduce any systematic order to the selection and assignment of the sample. Thus, any influence on one group theoretically will similarly affect the other group as well. In the absence of any other differences that could influence outcome, an observed change in the experimental group at posttest then can be attributed with a reasonable degree of certainty to the experimental condition.
Randomization is a powerful technique that increases control and eliminates bias by neutralizing the effects of extraneous influences on the outcome of a study. For example, the threats to internal validity by historical events and maturation are theoretically eliminated. Based on probability theory, such influences should affect subjects equally in both the experimental and the control group. Without randomization of subjects, you will not have a true-experimental design.
Control Group
We now extend the concept of control introduced in Chapter 8 to refer to the inclusion of a control group in a study. The control group allows the investigator to see what the sample will be without the influence of the experimental condition or independent variable. A control group theoretically performs or remains the same relative to the independent variable at pretest and posttest, since the control group has not had the chance of being exposed to the experimental (or planned change) condition. Therefore, the control group represents the characteristics of the experimental group before being changed by participation in the experimental condition.
The control group is also a mechanism that allows the investigator to examine what has been referred to as the “attention factor,” “Hawthorne effect,” or “halo effect.”4 These three terms all refer to the phenomenon of the subject experiencing change as a result of simply participating in a research project. For example, being the recipient of personal attention from an interviewer during pretesting and posttesting may influence how a subject feels and responds to interview questions. A change in scores in the experimental group may then occur, independent of the effect of the experimental condition. Without a control group, investigators are not able to observe the presence or absence of this phenomenon and are unable to judge the extent to which differences on posttest scores of the experimental group reflect experimental effect, not additional attention.
Interestingly, this attention phenomenon was discovered in the process of conducting research. In 1934, a group of investigators were examining productivity in the Hawthorne automobile plant in Chicago. The research involved interviewing workers. To improve productivity, the investigators recommended that the lighting of the facility be brightened. The researchers noted week after week that productivity increased after each subsequent increase in illumination. To confirm the success of their amazing findings, the researchers then dimmed the light. To their surprise, productivity continued to increase even under this circumstance. In reexamining the research process, they concluded that it was the additional attention given to the workers through the ongoing interview process and their inclusion in the research itself, not the lighting, that caused an increased work effort.5
Manipulation
In a true-experimental design, the independent variable is manipulated either by having it present (in the experimental group) or absent (in the control group). Manipulation is the ability to provide and withhold the independent variable that is unique to the true experiment.
According to Campbell and Stanley,3 true experimentation theoretically controls for each of the seven major threats to internal validity (see Chapter 8). However, when such a true-experimental design is implemented in the health care or human service environment, certain influences may remain as internal threats, thereby decreasing the potential for the investigator to support a cause-and-effect relationship. For example, the selection of a data collection instrument with a learning effect based on repeated testing could pose a significant threat to a study, regardless of how well the experiment is structured. It is also possible for experimental “mortality” to affect outcome, particularly if the groups become nonequivalent as a result of attrition from the experiment. The health or human service environment is complex and does not offer the same degree of control as a laboratory setting. Therefore, in applying the true-experimental design to the health or human service environment, the researcher must carefully examine the particular threats to internal validity and how each can be resolved.
True-experimental design variations
Many design variations of the true experiment have been developed to enhance its internal validity. For example, to assess the effect of the attention factor, a researcher may develop a three-group design. In this structure, subjects are randomly assigned to (1) an experimental condition, (2) an attention control group that receives an activity designed to equalize the attention that subjects receive in the experimental group, or (3) a silent control group that receives no attention other than that obtained naturally during data collection efforts. The term “silent control group” can also refer to the situation in which information is collected on subjects who have no knowledge of their own participation.
Extracting information from medical records on a group that remains unaware may provide the researcher with an understanding of how subjects in the study compare with those who are not, at least regarding identified demographic and medical characteristics.
Let us examine four basic design variations of the true experiment.
Posttest-Only Designs
Posttest-only designs conform to the norms of experimentation in that they contain the three elements of random assignment, control group, and manipulation. The difference between classic true-experimental design and this variation is the absence of a pretest. The basic design notation for a posttest-only experiment follows for randomly selected and randomly assigned samples:

In a posttest-only design, groups are considered equivalent before the experimental condition as a result of random assignment. Theoretically, randomization should yield equivalent groups. However, the absence of the pretest makes it impossible to determine whether random assignment successfully achieved equivalence between the experimental and control groups on the major dependent variables of the study. Some researchers assume that the control group posttest scores are equivalent to pretest scores for both control and experimental groups. However, caution is advised, especially considering the influence of attention on subjects that we discussed earlier. There are a number of variations of this basic design. For example, the researcher may add other posttest occasions or different types of experimental or control groups.
Posttest-only designs are most valuable when pretesting is not possible or appropriate but the research purpose is to seek causal relationships. Also, a posttest-only design might be chosen if the threat to learning is highly likely with repeated testing using the same measure of the dependent variable.
Solomon Four-Group Designs
More complex experimental structures than those previously discussed, Solomon four-group designs combine the true-experiment and posttest-only designs into one design structure. The strength of this design is that it provides the opportunity to test the potential influence of the test–retest learning phenomenon by adding the posttest-only two-group design to the true-experimental design. This design is noted as follows if random selection occurs:
If random assignment without random selection occurs, the notation r would be noted in lower case.
As shown in this notation, Group 3 does not receive the pretest but participates in the experimental condition. Group 4 also does not receive the pretest but serves as a control group. By comparing the posttest scores of all groups, the investigator can evaluate the effect of testing on scores on the posttest and interaction between the test and the experimental condition. The key benefit of this design is its ability to detect interaction effects. An interaction effect refers to changes that occur in the dependent variable as a consequence of the combined influence or interaction of taking the pretest and participating in the experimental condition.
The following example illustrates the power of the Solomon four-group design and the nature of interaction effects.
You want to assess the effects of an AIDS informational training program (independent variable) on the sexual risk-taking behaviors (dependent variable) of adolescents. You can pretest groups by asking questions about sexual activities and levels of knowledge regarding behavioral risks of developing acquired immunodeficiency syndrome (AIDS). You can expose one group to the experimental condition, which involves attending an educational forum led by peers. On posttesting, you discover that levels of knowledge increased and that risk behaviors decreased in subjects who received the experimental program. However, you cannot determine the effect of the pretest itself on the outcome. By adding Group 3 (experimental condition without pretest), you can determine whether the change in scores is as strong as when the pretest is administered (Group 1). If Group 2 (control) and Group 3 (experimental) show no change but experimental Group 1 does, you can be relatively certain that this change is a consequence of an interaction effect of the pretest and the intervention. If there is a change in experimental Groups 1 and 3 and some change in control Group 2, but none in control Group 4, there may be a direct effect of the intervention or experimental condition plus an interaction effect.
This design allows the investigator to determine the strength of the independent effects of the intervention and the strength of the effect of pretesting on outcomes. If the groups that have been pretested show a testing effect, statistical procedures can be used to correct it, if necessary.
As you can see, the Solomon four-group design offers increased control and the possibility of understanding complex outcomes. Because it requires the addition of two groups, however, it is a costly, time-consuming alternative to the true-experimental design and infrequently used in health and human service inquiry.
Factorial Designs
These designs offer even more opportunities for multiple comparisons and complexities in analysis. In factorial designs, the investigator evaluates the effects of two or more independent variables (X1 and X2) or the effects of an intervention on different factors or levels of a sample or study variables. The interaction of these parts, as well as the direct relationship of one part to another, is examined.
You are interested in examining the effects of an exercise program on older adults. Specifically, you want to determine the extent to which two levels of “health status” (good and poor) influence three “quality of life” areas for participants. In this case, the first independent variable that is manipulated assumes two values: participation in an exercise experimental group or participation in a nonexercise control group. The other independent variable that is not manipulated (health) also has two values (good and poor). The dependent variable or outcome measure (quality of life) has three factors (activity level, overall satisfaction, sense of well-being). This study represents a factorial design in which the independent variables have two factors or levels and the dependent variable has three levels. This structure is referred to as a “2 × 2 × 3” factorial design (Figure 9-1). This design allows you to examine the relationship between different levels of health and specific quality-of-life indicators for two conditions, subjects exercising and subjects participating in a nonexercise control group.
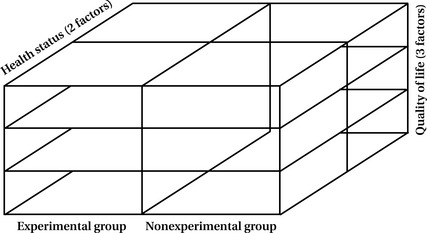
The factorial design enables you to examine not only direct relationships but interactive relationships as well. You can determine the combined effects of two or more variables that may be quite different from each direct effect. For example, you may want to examine whether the less healthy exerciser scores higher on a life satisfaction assessment than the less healthy nonexerciser. To evaluate statistically all the possible configurations in this design, you need to have a large sample size to ensure that each cell or block (Figure 9-1) contains an adequate number of scores for analysis.
Of course, you can develop more complex factorial designs in which both independent and dependent variables have more than two values or levels. With more complexity, however, increasingly large sample sizes are necessary to ensure sufficient numbers in each variation to permit analysis.
Counterbalance Designs
When more than one intervention is being tested and when the order of participation is manipulated, counterbalance designs are often used. This design allows the investigator to determine the combined effects of two or more interventions and the effect of order on study outcomes. Although there are many variations, the basic design (with random sample selection) is as follows:

Again, lower case r would denote random assignment and would still qualify for this true-experimental design.
Note the subscript numbers on the independent variables. The reversal of the conditions is characteristic of counterbalance designs in which both groups experience both conditions but in different orders. This reversal is called “crossover.” In a crossover study, one group is assigned to the experimental group first and to the control condition later; the reverse order is assigned for the other group. Measurements occur before the first set of conditions, before the second set, and after the experiment. Such a study allows you to eliminate the threats to internal validity caused by the interaction of the experimental variable and other aspects of the study.
Suppose you were interested in the psychosocial effects of two interventions for women whose husbands had been killed in military service in Iraq. You randomly assign your sample to one of two conditions, on-site support group only and peer telephone support, and then reverse their assignment. Testing would occur at three intervals: just before the experiment, after participation in condition one, and after the experiment. By structuring your research with this design, you would be able not only to ascertain the effects of each program on a single group but also to compare groups over time in each of the conditions.
True-Experimental Design Summary
True-experimental designs must contain three essential characteristics: random assignment, control group, and manipulation. The classic true experiment and its variations all contain these elements and thus are capable of producing knowledge about causal relationships among independent and dependent variables. The four design strategies in the true-experimental classification are appropriate for an experimental-type Level 3 research question in which the intent is to predict and reveal a cause. Each true-experimental-type design controls the influences of the basic threats to internal validity and theoretically eliminates unwanted or extraneous phenomena that can confound a causal study and invalidate causal claims. The three criteria for using a true-experimental design or its variation are (1) sufficient theory to examine causality, (2) a Level 3 causal question, and (3) conditions and ethics that permit randomization, use of a control group, and manipulation.
Developing even the most straightforward experimental design, such as the two-group randomized trial, involves many other considerations. It is important to consult with a statistician about the possible approaches to randomization. A statistician can help you determine the best approach to randomizing subjects based on your study design and the basic characteristics of the subjects that you plan to enroll. There are many ways to randomize to ensure that subjects are assigned to groups by chance. In complex designs or large clinical trials, a statistician is usually responsible for setting up a randomization scheme and placing group assignments in sealed, opaque envelopes so that the investigators or research team members cannot influence the group assignment.
Quasi-experimental designs
Although true experiments have been upheld as the ideal or prototype in research, such designs may not be appropriate for many reasons, as we have indicated throughout this book. First, in health and human service research, it may not be possible, appropriate, or ethical to use randomization or to manipulate the introduction and withholding of an experimental intervention. Second, and perhaps most important, all inquiries do not ask causal questions, and thus the experimental design is not appropriate for questions that do not seek answers about cause-and-effect relationships. So what can you do when it is not possible or appropriate to use randomization, manipulation, or a control group?
You can select other design options that do not contain the three elements of true experimentation to generate valuable knowledge. Even though the language of the experimental-type tradition implies that these designs are “missing something,” we suggest that these designs are not “inferior” but rather that they produce different knowledge, interpretations, and uses than true experimentation.
As in all design decisions, the decision to use quasi-experimental designs should be based on the level of theory, type of research question asked, and constraints of the research environment. Cook and Campbell, who wrote the seminal classical work on quasi-experimentation, defined these designs as:
experiments that have treatments, outcome measures, and experimental units, but do not use random assignment to create comparison from which treatment-caused change is inferred. Instead, the comparisons depend on nonequivalent groups that differ from each other in many ways other than the presence of the treatment whose effects are being tested.6
The key to the efficacious use of quasi-experimental designs lies in the claims made by the researcher about the findings. Because random assignment is absent in quasi-experimentation, the researcher can (1) make causal claims while acknowledging the alternative explanations for these claims and design limitations or (2) avoid making causal inferences when they are unjustified by the design.
Designs in the quasi-experimental category have two of the three true-experimental elements: control group and manipulation. Two basic design types fit the criteria for quasi-experimentation (Box 9-2).
Nonequivalent Control Group Designs
There are at least two comparison groups in nonequivalent control group designs, but subjects are not randomly assigned to these groups. The basic design is structured as a pretest and posttest comparison group, as in the following notation:
It is also possible to add comparison groups or to alter the testing sequence. This design can answer the basic question, “What changed after being exposed to the experimental condition compared to non-exposure?”
You want to test the effectiveness of an innovative mental health program designed to alleviate depression, but it is not possible to use randomization. You arrange for a community mental health center to use the experimental intervention for one month. You find another community mental health center in which the population is comparable and assign the comparison condition (conventional intervention) to that group. As with true-experimental design, you pretest and posttest all subjects, then compare group scores. If the group scores for the experimental condition are significantly different, there is strong support for the value of the innovative program. Once again, however, because of the multiple threats to internal validity, most likely you will not use this design to support cause but to explain the comparative changes in each of the study groups. That is, you can indicate that the changes after the intervention in the experimental group were significantly greater than the changes in the comparison group.
As an example, suppose you wanted to test the change in fitness after a new exercise program in of a population of individuals who had sustained mild stroke. However, you cannot institute random assignment because the exercise program is only offered at one facility for all outpatients who meet the diagnostic criteria. So you decide to compare groups in two facilities, the one offering the program and one that does not. A nonequivalent control group design would be appropriate for the context and to answer the following Level 2 question:
Compared to the group that did not undergo the experimental exercise program, what changes in fitness occurred in the group that participated in this program?
You might even hypothesize that the experimental group scores would improve compared with the control condition. However, because the groups were not randomly assigned to experimental and control group, it would not be possible to isolate theoretically the experimental condition (the fitness program) and examine its effect on fitness improvement. However, you can look at comparative change, providing important knowledge for further inquiry and clinical guidance.
Interrupted Time Series Designs
Interrupted time series designs involve repeated measurement of the dependent variable both before and after the introduction of the independent variable. There is no control or comparison group in this design. The multiple measures before the independent variable control for the threat to internal validity based on maturation and other time-related changes. A typical time series design is depicted as follows:

Although the number of observations may vary, it is suggested that no less than three occur before and three occur after the independent variable is introduced. The investigator is particularly interested in evaluating the change in scores between the observation that occurs immediately before the introduction of the intervention (O3) and the observation that follows the intervention (O4). Any sharp change in score compared with the other measures may suggest that the intervention had an effect (note that we say suggest since this design cannot produce a causal claim). The investigator must evaluate changes in scores in terms of the scoring patterns that occurred both before and after intervention. For example, if there is a trend for scores to increase at each testing occasion, even a sharp difference between O3 and O4 may not reflect a change because of the introduction of the intervention.
Because of the absence of the control group and randomization, the interrupted time series design cannot strongly support a causal relationship between the independent and dependent variables. In this type of design, however, the series of premeasures theoretically controls threats to internal validity, except for the threat of history. Maturation, testing, instrumentation, regression, and attrition are considered threats that may occur between all measures and thus are detectable and controlled by repeated measurements. In this design, however, it is extremely important to choose a form of measurement in which there is no learning effect or threat of testing. In the health and human service context, researchers often use an interrupted time series design when they may not be able to manipulate the experimental intervention but they have knowledge of its introduction. In other words, the intervention or experimental program may be a naturally occurring event in which it is possible to document performance of the dependent variable before and after the event's occurrence.
Consider the fitness example described earlier. You might choose this configuration if you do not have or choose to use a control condition.
Using an interrupted time series design, you would posit the following questions:
How did fitness scores change immediately following the intervention? How consistent were fitness scores over time following the intervention?
A hospital announces a plan to implement a new employee benefits program to enhance job satisfaction. The effects of this program on job satisfaction can be determined by taking a quarterly survey of employees for 1 year before the introduction of the new program. The same survey can be used quarterly after employee participation in the new benefits program. In this way, the hospital will have four data points regarding employee satisfaction before the program's introduction that can be compared with four data points after its implementation. This strategy will allow for such extraneous factors as staff turnover and fluctuations in patient census to be tracked over time to account for their effect on job satisfaction.
The interrupted times series design is extremely useful in answering questions about the nature of change over time.
Combined Design
A combination of nonequivalent groups and interrupted time series is a quasi-experimental design that can be considered appropriate for answering causal questions. In this combination, some of the potential bias attributable to nonequivalent groups is limited by multiple measures, whereas the time series design is strengthened by the addition of a comparison group.
Suppose you instituted a combined design to test the outcome of your fitness program. If scores were relatively stable in both groups before the intervention and there was a significant increase in scores only in the experimental group immediately following the intervention and then at the remainder of the testing intervals, you could surmise that the program achieved its outcome.
Quasi-Experimental Design Summary
Quasi-experimental designs are characterized by the presence of some type of comparison group and manipulation, but they do not contain random group assignment. Although there is no control group in time series and single-subject designs, control is exercised through multiple observations of the same phenomenon both before and after the introduction of the experimental condition. In nonequivalent group designs, the control is built in through the use of one or more comparison groups.
We suggest that quasi-experimentation is most valuable when the investigator is attempting to search for change over time or when a comparison between groups and the constraints of the health or human service environment are such that random assignment is not appropriate, ethical, or feasible.
Pre-experimental designs
In pre-experimental designs, two of the three criteria for true experimentation are absent. In pre-experiments, it is possible to describe phenomena or relationships. However, the outcomes of the study do not support claims for a causal relationship because of inadequate control and the potential of bias. Pre-experimental designs can be of value to answer descriptive Level 1 questions, Level 2 relational questions, or to generate pilot, exploratory evidence, but the investigator using these designs cannot consider causal explanations. The numerous pre-experimental designs are all variations on three designs (Box 9-3).
One-Shot Case Study
In the one-shot case study, the independent variable is introduced, then the dependent variable is measured in only one group, as follows:

Without a pretest or a comparison group, the investigator can answer the question, “How did the group score on the dependent variable after the intervention?” As you can see, a cause-and-effect relationship between the two variables cannot be supported because of the seven threats to internal validity (see Box 8-3).
Suppose researchers want to test an intervention that is designed to reduce depression in young adults. The investigator who uses the static group comparison will select two nonequivalent groups, such as two groups of persons with depression receiving treatment in two different community mental health centers. One group will receive the intervention and one will not. A posttest measuring the level of depression will be administered to both groups and then compared. This design can answer the following question with a fair degree of certainty: “How did the experimental group compare with the comparison group on the measure of depression?” Because random assignment did not occur, it is difficult to infer cause. Furthermore, there is minimal control in that the level of depression in either group was unknown before the introduction of the experimental condition.
This type of design is most useful in answering descriptive questions such as “what happened after a phenomenon occurred (e.g., an intervention, the introduction of a new or revised approach to promoting health, education, wellness, and so forth). For example, many university courses use this design to test student learning. Typically, no pretest is given when students enroll a class. The course (X) proceeds and then an exam (O) is given. Student scores on the exam can only tell what they learned but cannot attribute their learning to the course.
Suppose you want to know whether your online cardiac health education program for elders (X) is meeting its aim of improving their knowledge about diet and exercise strategies (O). You decide to pilot the program at a senior center and recruit a sample of healthy elders to view the site and then take a test to determine their knowledge. The subjects score relatively high on the test, and thus you conclude that it is likely they learned from the site. From this study, you can answer the following question:
How did elders in the senior center score after participating the online education program?
In both examples, there was insufficient control in level of knowledge and no randomization, and so the cause of the scores on the dependent variable cannot be inferred.
Pretest–Posttest Design
The pretest–posttest design is also valuable in describing what occurs after the introduction of the independent variable, as follows:

This design can answer questions about change following exposure to the independent variable in that the pretest is given before its introduction. If subjects are tested before and after the intervention, a change in scores on the dependent variable can be reported but cannot be attributed to the influence of the independent variable. Threats to internal validity, if one were to attempt to infer cause using this design, include maturation, history, testing, instrumentation, experimental mortality, and interactive effects.
Returning to students in a college course, suppose the instructor wanted to know whether knowledge changed over the course of the semester. In this case, the instructor would choose to test students on Day 1 before any reading, in-class lecture or activity, or assignments. If student scores improved by the midterm, the instructor can claim that improvement occurred in knowledge but cannot attribute this to the course.
If you want to test change in knowledge in the cardiac education program for elders, you would similarly give a pretest before any participation and examine the change in scores. A significant difference would indicate learning, but without attribution to your program because the absence of random assignment and the limited control would not support a causal claim.
Static Group Comparison
In static group comparison, a comparison group is added to the one-shot case study design, as follows:

This design, as in other pre-experimental structures, can answer descriptive questions about phenomena or relationships but is not considered a desirable choice for causal studies.
Some researchers consider the comparison group score as a pretest measure, because the group who did not receive intervention could approximate the pretest condition of the group receiving the intervention.
Introducing a static comparison group offers more control over extraneous factors than the one-shot case and pretest–posttest designs. However, we caution against its use to make statements on causal relationships between the independent and dependent variables.
Consider the cardiac education program. To institute a static comparison group design, you would provide the program to your subjects as we described in the one-shot case study design and recruit a similar sample from another senior center who would not participate in the online program. Both groups would receive the posttest at the same time. If the group that participated in the educational program scored significantly better than the group that did not participate, you could conclude that those who participated had more knowledge than those who did not. However, once again, you cannot conclude that the program influenced knowledge acquisition without random assignment or pretesting.
Pre-Experimental Design Summary
Pre-experimental designs may be valuable in answering a descriptive question. You may want to consider using a pre-experimental design for the specific purpose of pilot testing an intervention protocol or particular measurement approach. However, the absence of two of the three major conditions for true experimentation makes these designs an inappropriate choice if your pursuit is prediction and causal inference. If you attempt to answer predictive or causal questions with these designs, the basic seven threats to internal validity limit effective checks against bias.
At this point, you may be asking why an investigator would choose a design that cannot attribute an outcome to a cause. As we noted earlier, not all questions are causal. Think back to the chapters on theory and literature. Remember we said that theory is incrementally built and tested. Descriptive findings support the conduct of more complex research. Without sound description, relational and causal studies may not be indicated. Knowing “what” must precede knowing “why.”
Nonexperimental designs
Nonexperimental designs primarily rely on statistical manipulation of data rather than mechanical manipulation and sequencing. By definition, nonexperimental designs are those in which none of the three criteria for true experimentation exists in the structure of sample selection, exposure to an experimental condition, and data collection. These designs are most useful when testing a concept or construct or set of relationships among constructs that naturally occur. Any manipulation of variables is done post hoc through statistical analysis. Three nonexperimental designs are frequently used in health and human service research (Box 9-4).
Survey Designs
Survey designs are primarily used to measure characteristics of a population. Through survey designs, it is possible to describe population parameters as well as to predict relationships among these characteristics. Typically, surveys are conducted with large samples. Questions are posed either through online or mailed questionnaires, or through telecommunications or face-to-face interviews. Perhaps the most well-known survey is the U.S. Census, in which the federal government administers mailed surveys and conducts selected face-to-face interviews to develop a descriptive picture of the characteristics of the U.S. population. The census qualifies as a data collection project rather than a full inquiry because it does not have an articulated theory base. However, an excellent example of a large-scale survey inquiry of interest to health and human service providers is the recent analysis of well-being in America.7 On the basis of human development and capability theory (Nussbaum, 2006; Sen, 2009)8,9 and relying on secondary data, the American Human Development Index measured the main and interactive effects of three primary variables: longevity, access to knowledge, and standard of living.8 In addition, gender, geographic, and race/ethnicity correlates were included in the analysis.
Suppose you are interested in examining and predicting job satisfaction of “health and human service faculty” who are teaching in “distance education programs.” You create and host a survey on the internet and e-mail program directors of diverse health and human service programs with distance education components to ask them to elicit participation from faculty who are teaching in distance courses. After receiving 500 faculty responses containing demographic characteristics and job satisfaction scores, you conduct statistical analysis of the data and are able to develop descriptive and predictive conclusions.
The advantages of survey design are that (1) the investigator can reach a large number of respondents with relatively minimal expenditure and time, (2) numerous variables can be measured by a single instrument, and (3) statistical manipulation during the data analytical phase can permit multiple uses of the data set. Disadvantages may result from the survey structure. For example, the use of mailed or online questionnaires may yield a low response rate, compromising the external validity of the design. Face-to-face interviews are time-consuming and may pose reliability problems.
Online surveys are gaining in popularity and use. There are many online survey options, some of which are free to the investigator. Using online surveys has both advantages and disadvantages. Online survey methods are inexpensive in that they do not require postage, they are password protected, and control for multiple responses from one computer. Many formats have automated data entry, eliminating manual entry of data into a spreadsheet. Distribution is instantaneous and can be accessed around the globe. However, online methods eliminate those who do not have or choose to have access to computers. E-mail lists to recruit respondents are often expensive, and caution must be taken to ensure that respondents cannot answer multiple times. For example, suppose you are interested in studying the relationship of health provider attitudes toward obesity and planned quality of health care treatment. Using an online survey program, you create a survey of planned health care for a fictitious patient. You recruit a sample of health providers, and randomly assign them to one of two groups. Group 1 receives the survey and case information with a photo of the “case” at a typical weight, and Group 2 receives identical information with a photograph of an obese patient. Because you are using online survey methods, you are able to reach a wide audience and use automated data entry. In a relatively short period of time, this type of online survey design allows you to answer Level 1 and 2 questioning because you can recruit, conduct your survey, receive immediate responses, and analyze data in a short time.
Many books and online resources can guide you in designing a survey study on the Internet, by mail, by telephone, or in person. For more detailed discussion of how to structure surveys, these resources should be consulted.
Passive Observation Designs
Passive observation designs are used to examine phenomena as they naturally occur and to discern the relationship between two or more variables. Often referred to as “correlational designs,” passive observation can be as simple as examining the relationship between two variables (e.g., height and weight) or it can be as complex as predicting scores on one or more variables from knowledge of scores on other variables. As in the survey, variables are not manipulated but are measured and then examined for relationships and patterns of prediction.
In the survey on job satisfaction of health and human service faculty, you would be able to examine the relationships among multiple variables and to predict the degree of job satisfaction with respondent scores on other variables such as professional discipline, respondent age, and so forth.10
Ex Post Facto Designs
Ex post facto designs are considered to be one type of passive observation design. In ex post facto (“after the fact”) designs, however, the phenomena of interest have already occurred and cannot be manipulated in any way. Ex post facto designs are frequently used to examine relationships between naturally occurring population parameters and specific variables.
You are interested in understanding the effects of coronary bypass surgery on morale and resumption of former roles for men and women. Coronary bypass surgery is the event that the researcher cannot manipulate, but it can be examined for its effects after its occurrence. For example, ex post facto survey designs might be used to examine phenomena such as career patterns of graduates of professional curricula, recovery process, and differences in job satisfaction between male and female professionals.
Nonexperimental Design Summary
Nonexperimental designs have a wide range of uses. The value in these designs lies in their ability to examine and quantify naturally occurring phenomena so that statistical analysis can be accomplished. Therefore, the investigator does not manipulate the independent variable but rather examines it in relation to one or more variables for descriptive or predictive purposes. These designs have the capacity to include a large number of subjects and to examine events or phenomena that have already occurred. Because random selection, manipulation, and control group are not present in these designs, investigators must use caution when making causal claims from the findings.
As in the quasi-experimental and true-experimental situations, the researcher is still concerned with potential biases that may limit the internal validity of the nonexperimental design. The researcher tries to control the influence of external or extraneous influences on the study variables through the implementation of systematic data collection procedures, the use of reliable and valid instrumentation, and other techniques. The researcher also increases the generalizability of a study or its external validity by using random sample selection procedures, when appropriate and feasible, to ensure representation and minimize systematic sampling bias.
Experimental-type meta-analysis
A review of the literature is the core action process in meta-analysis (see Chapter 5).
Meta-analysis is a methodology in the experimental-type tradition that can be understood as a form of survey research. In meta-analysis, however, research reports, rather than real people, are surveyed and become the unit of analysis.11 In using reports as a form of survey research, first a specific research question must be posed, followed by boundary setting, development of a coding scheme, and implementation of analytical action processes. Box 9-5 outlines the basic steps in the meta-analysis research approach.
The purpose of experimental-type meta-analysis is to summarize, integrate, and interpret an empirical body of research or studies in which the outcomes are quantitative. In meta-analysis the findings of more than one study can be combined and averaged. As with all methodologies, there are certain limitations with a meta-analysis. Because you are delimiting your “sample” of reports both by content and method, meta-analysis is only applicable to one tradition at a time and thus cannot be used with mixed methods. Also, it can be used only with studies using similar constructs or reporting specific statistical analyses (e.g., inferential statistics) that can be meaningfully compared.
The strength of meta-analysis lies in its ability to synthesize a body of research that focuses on a specific topic (e.g., treatment for stroke) and to derive interpretations of the degree of effect of similar treatments. Meta-analysis provides a systematic and structured way of summarizing and analyzing research findings from more than one study in a specified area of inquiry. It can be applied to an area of inquiry with few studies or with many studies.
The key concept in experimental-type meta-analysis is effect size, a statistic that codes the magnitude of the effect (or outcome) as a result of being exposed to the independent variable (e.g., treatment, intervention, experimental condition). Different statistics to derive an effect size are used, depending on the type of data and specific research question and hypotheses being tested. The calculation of effect size is beyond the scope of this text, but it is important to understand that experimental-type meta-analysis focuses specifically on statistical outcome of an intervention or experimental condition.12
Meta-analysis is important in health and human service research. It enables the researcher to derive a systematic interpretation rather than a critical review of the literature as to the state of knowledge in a particular area. With the increasing popularity of evidence-based practice, as discussed in Chapter 24, meta-analysis provides a methodology through which to combine and integrate studies to identify “the best intervention.”
Geographic Techniques
Geographic analysis is a set of techniques in which data are geographically referenced. That is to say, information including economics, population parameters, epidemiology, natural and built resources, and policy, among many others, are geographically situated. Grounding information through its location provides a powerful tool for analysis, with particular attention to global, national, and local community comparisons. Although geographic methods are not a specific design and employ multiple experimental-type approaches to answer Level 1, 2, and 3 questions, we discuss this genre of inquiry here because of its increasing use and importance to health and human service professions in generating location-based knowledge.
There is a wide range of applications and complexity in geographic analysis, from static, slice-in-time snapshots to temporally changing dynamic modeling.13 What all have in common is the use of visual-spatial locations as delimiters of information and analysis. Further, whereas static, hand-drawn maps can be used for rudimentary examination, the development of computerized technology applications has resulted in the increasing use and scope of geographic analysis in research, planning, and theory building with geographic information system (GIS) becoming a valued analytic tool in diverse health and human service academic and professional arenas.
A GIS comprises the hardware and software used to input, organize, store, retrieve, and depict geographically situated information.14 Although the technical details of GIS are beyond the scope of our book, we bring your attention to several important concepts that are critical for understanding the power of GIS.
First, GIS is a computer-assisted system and thus has the capacity to handle and analyze multiple sources of data, providing that they are relevant to spatial depiction. Second, GIS relies on two overarching spatial paradigms, raster and vector. Raster GIS carves geography into mutually exclusive spaces and then examines the attributes of these. Thus, the attributes of one space can be represented and compared with the attributes of another. For example, consider infant mortality. Knowing geographic variation could assist providers in targeting specific locations for further inquiry and prevention of infant death.
Vector GIS relies on location points. This approach locates points and identifies spaces and the attributes delimited inside of them by the lines that connect the points. This technique would allow an in-depth look at local phenomena, such as the health and welfare of neighborhood youth.
Each approach has its strengths and limitations, but both have valuable applications. To compare approaches, suppose you are interested in the causes of underage drinking, and you ascertain that incidence in various geographic areas differ. To look at the attributes, from the raster approach, you would obtain a frequency count of the number of establishments that sell alcoholic beverages in delimited areas and then depict by color the number of establishments in that area. However, from the vector approach, you would identify the addresses or geographic coordinates of each alcohol sales establishment and plot it on your map.15
Finally, because GIS has the capacity to represent multiple data layers on a single map, the ability to analyze multivariate relationships is one of its most powerful functions. Consider the earlier example once again. In addition to examining the density or location of alcohol sales outlets, you also hypothesize that the availability of money to purchase alcohol and the freedom to do so without parental interference are important predictors of underage drinking.
To test the hypothesis, you map and depict the socioeconomic status of each location, the youth ages, the percentage of youth working, and the working hours of parents. Using geographic software, each variable can be translated into spatial data, located on a single map layer, and then aggregated into a complex map that depicts the relationship among two or more of the variables.
Geographic analysis is a powerful tool in itself, but when coupled with statistical analysis, it can be even a more potent strategy for association and prediction. Both tell the same story but through different means, and thus the strength of multiple communication formats and evidentiary bases can be brought to bear on dissemination to diverse audiences.1 Furthermore, because geographic analysis programs base maps on data tables, and because the software allows the importation of data from frequently used spreadsheets and databases such as Excel, Access, and even SPSS, combining visual and statistical analytic techniques is relatively simple.
Epidemiology
Epidemiology is a genre of research that examines the distribution of disease in populations and seeks to reveal the factors that influence population-based illness and disease as the basis for prevention, optimizing health services, tracing historical trends and risks, and influencing health policy.16 Although not a single design, we discuss epidemiology in this chapter because of its centrality to public health and the professions concerned with disease prevention and health promotion. Epidemiological studies focus on the body and the environment as well as their interactions as the basis for investigation and application of knowledge.
Epidemiological methods are complex, and thus a detailed discussion of them is beyond the scope of this text. Here we introduce you to concepts and general approaches to investigation that are central to the field. Epidemiologists conduct research to describe disease distribution, measure the severity of disease through morbidity and mortality (incidence and prevalence), and uncover the etiology (risk factors that are associated with or causative of disease). Incidence refers to the number of new occurrences of a disease and prevalence denotes the number or proportion of disease in a specified population.
Epidemiologists use large-scale surveillance methods, such as survey, secondary analysis of hospital data, birth and death certificates, and so forth, to answer Level 1, 2, and 3 questions. Of particular importance are the techniques of complex statistical modeling and geographic analysis to describe and predict the occurrences and causative factors of disease distribution. As example, an epidemiological study might measure (surveillance) the occurrence of birth defects in populations living near nuclear power plants and then conduct complex modeling that can statistically create conditions, based on current descriptors, that would indicate high risk. Models can serve as the basis for prevention, intervention, and policy responses and can be evaluated after they are enacted to determine their success in preventing illness and promoting health.
Clinical trial methodology
Most quantitative investigators and scientific journals consider the true-experimental design, also referred to as the randomized clinical trial (or RCT), as the design of choice to answer specific questions related to the efficacy of behavioral or biomedical interventions, including drugs, treatments, service programs, and devices. Also within the world of evidence-based practice, the RCT is upheld as the most important design structure from which evidence can be deduced. Thus, we now focus on the application of the true-experimental design to clinical practice.
Although seemingly straightforward, as we discussed earlier, the traditional two-group randomized controlled design is actually rather complex, and many action processes have been developed to structure this study design and ensure rigor. Because of its importance in health and human service research and its prominence in scientific journals, let us examine some key critical issues in implementing a clinical trial in an applied setting, such as the clinic, community center, or home. Because it is not possible to cover every aspect of the RCT in this text, we highlight here the key language that sets clear rules and expectations for the adequacy of the RCT design and research procedures.
Phases of Clinical Trials
Clinical trials are designed to address three levels of development for interventions. A Phase I clinical trial is the first type of randomized design that is usually conducted. The purpose of the Phase I study is to test a new behavioral or biomedical intervention not previously evaluated in a small group of people (20–80) to determine its acceptability, feasibility of implementation, and safety (e.g., side effects, safe dosage range for drugs). The next step, a Phase II clinical trial, is conducted to study the efficacy of an intervention in a larger group of people (several hundred) to determine efficacy and further evaluate safety. The final step, a Phase III clinical trial, may have a threefold purpose: (1) evaluate effectiveness further in a much larger group of persons (several hundred to thousands), (2) compare the intervention to other standard or experimental interventions to determine its added value or significance, and (3) evaluate how the intervention can be implemented safely in a larger community.
Each clinical trial phase may use randomization procedures and strict adherence to various protocols, but their goals differ. For Phase I, the goal is “proof of concept,” for Phase II it is “efficacy,” and for Phase III it is “effectiveness and safety” related to clinical implementation. These phases tend to fit best with classic pharmacological drug trial research, for which many of the procedures discussed in relation to clinical trial methodology have been developed. Nevertheless, these terms continue to be applied to behavioral and other clinical-type interventions and are noted here because they are used frequently by the experimentalist.
An additional phase is specific to behavioral interventions that are most relevant to health and human service and involves the “translation” of a proven or evidence-based intervention into a service or clinical setting. Most intervention protocols that are tested using clinical trial methodology require additional modification or translation to fit into and be effective in an applied setting or with a different target population than those involved in the initial testing. The translational phase may or may not involve a randomized two-group design, but it does require an evaluative approach to determine the acceptability and benefit. In this translational phase, it is important to ensure that the core components of a proven intervention remain intact. However, small changes that may have a large impact in the new setting or with a different target population may be necessary to ensure cultural appropriateness and acceptability.
For example, suppose you want to implement a well supported group-exercise conditioning program. However, the population you want to target does not typically engage in formal exercise programs. Thus, you may need to modify specific aspects of the program to enhance its acceptability and preserve its effectiveness in achieving its outcomes. A small change that would not affect the fidelity of the tested program might involve naming and framing the program differently or offering a wider range of exercise options. However, changing the frequency of the exercise regimen or offering it as a private versus group activity would alter the integrity of the intervention and possibly its outcomes. Let us examine how you might enact each phase of your clinical trial.
You have an idea for a new therapeutic regimen to enhance community reintegration for persons with traumatic head injury. You first conduct a Phase I study with a small group of patients, approximately 30 people, who fit highly specified inclusion and exclusion criteria. In this first phase, your goal is to evaluate whether your intervention approach is acceptable to patients, the extent to which participants comply with the innovative regimen, and the initial impact on treatment outcome (magnitude of change). Your main outcome is “life satisfaction,” as measured by self-report, and the “ability to live alone safely,” as measured by professional observation of daily self-care. You decide to use a two-group design and randomize 15 persons to receive the intervention program and 15 persons to a “usual care” control group. The control group receives a traditional rehabilitation program or usual care, and those in the intervention receive your treatment program.
Assume this first phase is successful in achieving its outcomes. You have evidence of treatment effect; 10 of the 15 persons randomized to treatment are able to perform self-care independently and safely, compared with 5 of 15 persons in the control group. Also, persons who received the treatment seemed to enjoy the therapeutic regimen and attended all skill classes and one-on-one sessions such that compliance was close to 95%. On the basis of this evidence, you design a Phase II trial involving many more persons, perhaps more than 150, recruited from two rehabilitation facilities. In Phase II, you seek to achieve statistically significant treatment effects and continue to monitor acceptability and participation, as well as safety (e.g., unsafe incidents from attending classes, living alone). Again, you find that your results from this phase are promising, with small to medium treatment effects, high compliance, and no adverse or unsafe events related to treatment.
Your next step is to develop a Phase III study, which might involve participation by numerous rehabilitation centers across the country and an attempt to implement the intervention in multiple sites. With the success of the intervention at each stage, there is great interest in using your intervention in rehabilitation.
However, another translational step is necessary to integrate your treatment in the current structure of rehabilitation. The intervention, as tested, is too labor intensive, and third-party intermediaries may not reimburse every component. Thus, you develop a translational phase in which you modify aspects of the intervention while preserving its essential elements, to integrate it successfully into clinical practice and obtain reimbursement for at least some of its therapeutic components.
Blinding (Masking)
Another key language structure of clinical trials is blinding or masking techniques. Remember that the procedures put into place in RCTs are designed to reduce bias. This point is important for the RCT structure because its main intent is to determine the impact or effect of a specific treatment regimen or intervention on a set of outcomes. Thus, critical to this design is the minimization of any competing reasons (e.g., Type I and II errors) that could explain a particular outcome.
Potential sources of bias are the tester, investigator, or interventionist.
You are an interviewer in a large study that is testing the efficacy of social support groups for persons undergoing cancer treatments. You are responsible for conducting both the pretest and the posttest interviews to evaluate whether group support affects a person's well-being. However, you are aware of a person's assignment to intervention or control as you interview. You may be favorably predisposed to observing positive changes in the intervention group. Or, because of your enthusiasm and investment in the intervention, you may inadvertently set a tone or ask questions that introduce a source of bias.
Thus, to minimize partiality or the possibility of introducing any form of bias, most clinical trials implement some type of blinding procedures. One simple approach to blinding, or masking, is to minimize who among the research team in contact with study participants is informed of group assignment. It is usually possible to mask interviewers to group assignments.
Blinding works best in medical trials. A single-blind trial means that the persons enrolled in the study do not know which group or treatment they have been assigned to, but the investigative team does know. In a double-blind trial, neither study participants nor investigators (nor anyone else on the research team) is aware of group assignments. As you can see, this level of blinding is difficult to achieve in behavioral-oriented treatments that are being evaluated in an RCT.
Randomization Scheme
The language of randomization is also essential to the clinical trial design structure. The way in which study participants are randomized to the experimental and control group conditions can take different forms and is scrutinized by institutional review boards, data and safety monitoring boards, and scientific journals (see Chapter 12).
There are many ways to randomize to ensure that subjects are assigned to experimental and control groups by chance. In complex designs or large clinical trials, a statistician is usually responsible for establishing a randomization scheme. After a randomization format has been developed, assignments are typed up on single sheets of paper, and each is sealed in opaque double envelopes so that the investigators or research team members cannot see the paper until it is opened and cannot influence the group assignment.
A related consideration is whether simple randomization alone is sufficient to ensure comparability between the experimental and control groups.
Suppose you are testing a mental health intervention involving counseling and activity engagement for persons with functional limitations. The dependent or outcome variable is a measure of depressive symptoms. You know that gender is highly related to depressive symptoms, with women reporting higher scores than men. Given the strong association between gender and your treatment outcome, you might want to consider a method of randomization to ensure that an equal number of men and women will be assigned to both the experimental and the control condition.
One approach would be to “stratify” randomization by gender (male, female) to ensure that the two groups will be balanced with respect to this factor. This involves setting up a separate or independent randomization scheme for both males and females. Within each stratum (male and female), randomization would occur by the method of “random permuted blocks” to control for possible changes over time in the subject mix. A blocking number is usually developed by a statistician and is not disclosed to the investigators or members of the project team. The statistician generates randomization lists for each of the two strata and then prepares two sets of randomization envelopes (double-enveloped), one set for males and the other for females. Each subject is randomized by opening the next envelope with the appropriate stratum.
Criteria for selecting appropriate and adequate experimental-type designs
As discussed, some researchers believe that the true-experimental design represents the only structure that is appropriate and adequate. However, each design in the experimental-type tradition has its strengths and limitations. The true experiment is the best design for testing theory, making causal statements, and determining the efficacy of treatments. If causality is not your purpose, however, or if the design structure does not fit the particular environment in which the research is to be conducted, true-experimental design is not an appropriate or adequate choice.
It is often difficult to apply strict experimental conditions to a field setting. For example, although subjects may be randomly assigned to a group, it may not be possible to obtain the initial list of subjects for a random sampling process, or it may be unethical to withhold a type of treatment (or experimental intervention) from a consumer in a service setting. Although clinical drug trials or testing of new technologies often obtain the degree of control necessary for true-experimental conditions, research on the social and psychological dimensions of health and human service work often pose a different set of issues and challenges for the researcher. These challenges make it essential for the investigator to be flexible in the use of design so that a research strategy appropriate to the question and to the level of theory, purpose, and practical constraints can be selected and rigorously applied.
To illustrate the value of each type of research design within the experimental-type tradition, apply the concepts in this chapter to an example that you may encounter in rehabilitation practice.
You are employed in a hospital in the rehabilitation unit. You have just read about a new computer intervention that seems to enhance the cognitive recovery of persons with traumatic brain injury. You order the program and recruit a group of patients to use it. To determine the extent to which the program works (which you have defined as “significant improvement in cognitive function”), you select an instrument to measure cognitive function (operationalizing your concept of cognitive improvement), and then you test a sample of 10 patients with the same instrument after their use of the computer intervention.
This type of inquiry is an XO design (pre-experimental) in which the computer program is the independent variable and cognitive performance is the dependent variable. The mean score for your sample was within normal limits, with a normal dispersion of scores around the mean. From this design, you have answered the question, “How did subjects score on a test of cognitive performance after their participation in a computer intervention?” Although these data are valuable to you in describing your sample, you still have not answered the question about whether the program “works.” Multiple threats to internal validity interfere with your ability to make a causal inference between variables with any degree of assuredness. You therefore decide to build on this study by adding a pretest.
In the next study, you pretest your new sample, introduce the computer intervention, and then posttest the sample.
This type of study is an OXO design (also pre-experimental). Because the subjects have greatly improved from the pretest to the posttest, you conclude that your program has worked. However, can you really come to this conclusion? What about the effects of sampling bias, maturation, and history on your sample? You realize that even though you have stronger evidence for the value of the program, the design that you have selected has answered the question, “To what extent did the subjects change in cognitive function after participating in the experimental condition?”
For your next sample, you add a control group so that your research structure is now a quasi-experimental design.
Your design now appears as follows:
When the experimental group improves more than the control group, you now are convinced that your program works. However, can you make that claim? What about sampling bias and other interactive effects that might confound your study? From this design, you can answer the question, “Which group made more progress?” This type of design provides fairly strong support for the value of your program, but it cannot be used yet to make causal claims.
For your next project, you add random group assignment to your design so that you are conducting a true experiment.
Your design looks like the following:

Because your experimental group has improved significantly more than the control group, you can now make the claim, with reasonable certainty, that the program works. You have used true experimentation to test the efficacy of the computer intervention in your sample. However, can you advise your colleague to use this intervention for his or her clients? The answer is a resounding “maybe.”
Because you did not randomly select your sample, the capacity to generalize your findings beyond your own experiment is limited. We are often faced with the desire to generalize, but practical restraints of conducting practice research will not allow us to select our sample randomly, as discussed later in the text. You might select experimental-type meta-analysis to expand your scope of knowledge beyond a single study if studies have used similar methods about the same constructs in your study.
You are interested in examining the extent to which the cognitive intervention produced client outcomes that were satisfactory to family members after a client's discharge. You may then select a nonexperimental survey design to examine the level of satisfaction. You also may include predictor variables, such as length of time in treatment and degree of family support, to inform future use and success with this intervention.
Each research design has strengths and limitations related to claims about the knowledge generated as well as practical and ethical issues. The key to doing rigorous and valued research with experimental-type designs is to (1) state your question clearly; (2) select a design that can best answer the question given the level of theory development, the practical considerations, and the purpose in conducting the study; and (3) report accurate conclusions.
Now that you are aware of experimental-type designs and techniques for enhancing the strength of these designs, you still may wonder how to select a design to fit your particular study question. Begin by asking yourself five guiding questions (Box 9-6).
What does each of these questions really ask you to consider? Question 1 raises the issues of validity. When a design is selected, the project must be internally consistent, the construct valid, and the research capable of providing the level of answer that the question seeks. Question 2 also addresses validity but issues of control and structure as well. The researcher must consider what extraneous influences could confound the study and what ways maximum control can be built into the design. Question 3 summarizes the previous issues raised by guiding the researcher to be most rigorous in planning control and minimizing bias. Question 4 addresses external validity and sampling. The researcher must develop a design that allows as broad a generalization as possible without threatening internal validity. Question 5 reminds the researcher of practical and ethical concerns that shape the design.
If these questions are answered successfully, the criteria for adequacy of experimental-type designs have been addressed. However, keep in mind that design considerations within the experimental-type tradition are more than just knowing the definitions of design characteristics. Knowledge of these design possibilities is your “set of tools,” which you can then apply and modify to fit the specific conditions of the setting in which you are conducting research. Developing a design within the tradition of experimental-type research in the health and human service field is a creative process. You must use your knowledge of the language and thinking processes, the basic elements of design, and the issues of internal and external validity to develop a study that fits the particular environment and question that you are asking.
Summary
Experimental-type research designs range from true-experimental to nonexperimental, and each design varies in its level of control, randomization, and manipulation of variables (Table 9-1). Also, field conditions and other practicalities influence the implementation of any type of design. The basic elements of design structure in the experimental-type tradition have many variations, and new applications of experimental designs are being advanced with the advent of meta-analysis and field-based intervention studies.
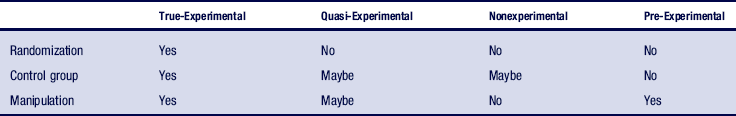
References
1. DePoy, E., Gilson, S.F. The human experience: description, explanation and judgment. Lanham: Roman and Littlefield, 2007.
2. Berg, C. Essentials of research in health, physical education, exercise science and recreation. Baltimore: Williams & Wilkins, 2007.
3. Campbell, D.T., Stanley, J.C. Experimental and quasi-experimental designs for research. Chicago: Rand McNally, 1963.
4. Hatch, M. Organization theory: modern, symbolic, and postmodern perspectives. New York: Oxford, 2006.
5. Roethlisberger, F.J., Dickson, W.J. Management and the worker. Cambridge, Mass: Harvard University Press, 1947.
6. Cook, T.D., Campbell, D.T. Quasi-experimentation: design and analysis for field settings. Boston: Houghton Mifflin, 1979. [p6 part 2].
7. Burd-Sharps, S., Lewis, K., Borges, Martins E. The Measure of America: American Human Development Report, 2008–2009. New York: Columbia University Press, 2008.
8. Nussbaum, M.C. Frontiers of Justice: Disability. Boston: President & Fellows of Harvard College, 2006.
9. Sen, A. The Idea of Justice. New York: Columbia Press, 2009.
10. Rozier, C., Gilkerson, G., Hamilton, B.L. Job satisfaction of occupational therapy faculty. Am J Occup Ther. 1991;45:160–165.
11. Cooper, H. Research synthesis and meta-analysis: A step-by-step approach, ed 4. Thousand Oaks: Calif, 2001. [Sage].
12. DerSimonian, R., Laird, N. Meta-analysis in clinical trials. Control Clin Trials. 1986;7:177–188.
13. Worboys, M.F. Modeling changes and events in dynamic spatial systems with reference to socio-economic units. In: Frank A.U., Raper J., Cheylan J.P., eds. Life and motion of socio-economic units. London: Taylor and Francis; 2001:129–138.
14. Ormsby, T., Napoleon, E.I., Burke, R., Groess, C., Feaster, L. Getting to know ArcGIS, 2nd ed. Redlands, CA: ESRI Press, 2004.
15. Burrough, P.A. Principles of Geographical Information Systems for Land Resources Assessment. Clarendon: Oxford, 1986.
16. Gordis, L. Epidemiology. Philadelphia: W. B. Saunders Company, 2009.