Hematology and Hemostasis
Hematology testing represents an important role of the veterinary technician: to provide accurate and reliable clinical laboratory test results to the veterinarian. An understanding of the principles of the various hematology tests and methods to ensure accuracy of results is vital. The recent focus on economic health of the veterinary clinic has also provided an opportunity for veterinary technicians to perform additional diagnostic testing, improve overall animal care, and provide an additional source of revenue for the clinic.
A complete hematology profile is indicated for diagnostic evaluation of disease states, well-animal screening (e.g., geriatric), and as a screening tool before surgery. The complete blood count (CBC) includes red and white blood cell counts, hemoglobin concentration, packed cell volume, differential white blood film examination, and calculation of absolute values and erythrocyte indices. Additional tests that may be needed include reticulocyte counts, measurement of total solids, and thrombocyte (platelet) estimates. Bone marrow evaluation is sometimes needed for definitive diagnosis and prognosis in some patients. In some patients, additional information on the hematopoietic and hemostatic systems are needed and bone marrow evaluation must be performed. Specific indications include unexplained nonregenerative anemia, leukopenia, thrombocytopenia, and pancytopenia (decreased numbers of all cell lines). Bone marrow evaluation is also used to confirm certain infections (e.g., ehrlichiosis) and diagnose hematopoietic neoplasms (e.g., lymphoproliferative disorders). Tests of the hemostatic systems (blood coagulation) include the thrombocyte count, bleeding time test, prothrombin time, and activated clotting time tests.
HEMATOPOIESIS
Hematopoiesis refers to the production of blood cells and platelets. Whole blood is composed of fluid and cells. The fluid component is plasma; the cellular component is made up of red blood cells (RBCs), also called erythrocytes; white blood cells (WBCs), also called leukocytes; and platelets, also called thrombocytes. An understanding of the overall process in the production of these components will aid in their evaluation. The process begins in early embryonic life and involves a number of complex chemical pathways and various organs. Some variations in the processes exist between juvenile and adult animals. Hematopoietic activity in the prenatal animal occurs in a variety of organs, including the liver, spleen, thymus, and red bone marrow. In the adult animal, the red bone marrow is the primary site for production and maturation of all the blood cells and platelets. However, during periods of hematopoietic stress, the liver and spleen may revert to their fetal role and produce blood cells in the adult.
Erythropoiesis (the production of erythrocytes), leukopoiesis (the production of leukocytes), and thrombopoiesis (the production of platelets) involve different pathways and chemical messengers. However, all the blood cells arise from the same pluripotent hematopoietic stem cell. In response to interaction with various chemical messengers, referred to as cytokines, the stem cells begin to differentiate into one of two types: myeloid or lymphoid. Further differentiation in response to additional cytokines results in commitment to forming specific cell types. Nearly two dozen different cytokines have been identified. The primary cytokine responsible for the production of RBCs is erythropoietin (EPO). EPO is primarily produced by certain cells in the kidney in response to decreased oxygen tension. The cells produce EPO, which then circulates in the blood to the bone marrow, where it binds to receptors on the surface of erythroid precursor cells, causing them to divide and mature. Lesser amounts of EPO are also produced in hepatocytes. The stimulus for production of leukocytes and thrombocytes is less understood. The hormones leukopoietin and thrombopoietin are involved, as are numerous additional cytokines. Figure 2-1 summarizes the stages in early hematopoiesis. Some references refer to the early progenitor lines (myeloid, lymphoid) as colony-forming units and the later stages as blast-forming units.
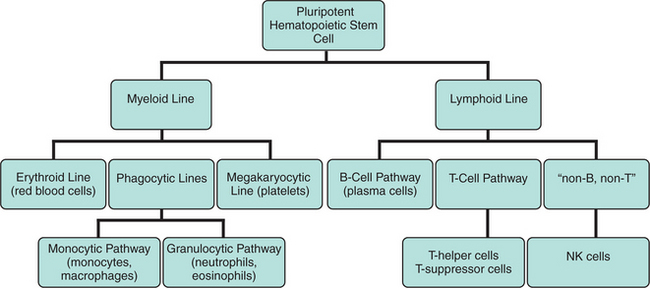
The myeloid line differentiates into erythroblasts, which give rise to the erythrocytes; megakaryoblasts, which give rise to platelets; and the myeloblast, which gives rise to the granulocytic leukocytes and the monocytes. The lymphoid line differentiates into the lymphoblast, which gives rise to the various populations of lymphocytes.
COLLECTION AND HANDLINGOF BLOOD SAMPLES
When preparing to collect blood, the technician should first determine what specific test procedures will be needed. This will determine, in part, the equipment and supplies needed and the choice of a particular blood vessel from which to collect the sample. The sample must be drawn before the initiation of any medical treatment. If treatments have been given, these must be noted on the blood sample collection record. Some test methods cannot be accurately performed once the patient has received certain pharmaceutical therapies.
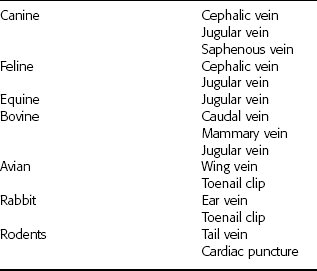
The preferred blood source is almost always venous blood. Jugular blood collection is most appropriate in common veterinary species. In some species there are no readily accessible veins, or the collection of venous blood would be excessively traumatic to the animal. It may be necessary to collect peripheral or capillary blood samples in those cases. Commonly used blood collection sites are summarized in Table 2-1. The blood collection site must be cleaned and swabbed with alcohol before collection. The alcohol should be allowed to dry before proceeding with the sample collection. The animal must be restrained, preferably with minimal manual restraint. Every effort should be made to minimize stress in the patient because it often compromises the sample.
TABLE 2-1
Commonly Used Blood Collection Sites
Reprinted from Sirois M: Veterinary clinical laboratory procedures, St Louis, 1995, Mosby.
Collection Equipment
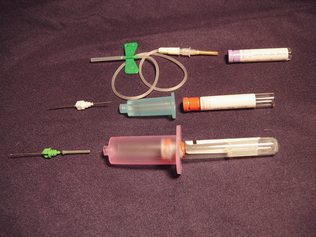
Traditionally samples have been collected by using a needle and syringe. When this method is used, the needle chosen should always be the largest one that the animal can comfortably accommodate. The syringe chosen should be one that is closest to the required sample volume. Use of a larger syringe could collapse the patient’s vein. The preferred method of blood collection is the use of a vacuum system (Fig. 2-2). This system is composed of a needle, needle holder, and collection tubes. The collection tubes may be plain sterile tubes or may contain anticoagulants. The tubes are available in sizes ranging from a few microliters to 15 ml. The correct size tube must be used to minimize damage to the sample or the possibility of collapsing the vein. The tubes should be allowed to fill to the correct volume, based on the strength of the vacuum pressure in the tube, to ensure the appropriate ratio of anticoagulant and blood. An advantage of this system is that multiple samples can be collected directly into the collection tubes without multiple venipuncture procedures. Sample quality is best when samples are collected with vacuum tubes using proper techniques.
Whole Blood
The veterinary technician obtains a whole blood sample by withdrawing the blood into a suitable container with the proper anticoagulant to prevent clotting. As soon as the blood is collected, the blood and anticoagulant are mixed with a gentle rocking motion. Shaking the sample vigorously causes hemolysis, which in turn can affect the results of the assays when chemicals normally found within the erythrocytes are released into the plasma.
Plasma and Serum
Plasma is the fluid portion of whole blood in which the cells are suspended. It is composed of approximately 90% water and 10% dissolved constituents such as proteins, carbohydrates, vitamins, hormones, enzymes, lipids, salts, waste materials, antibodies, and other ions and molecules. Serum is plasma from which fibrinogen, a plasma protein, has been removed. During the clotting process, the soluble fibrinogen in plasma is converted to an insoluble fibrin clot matrix. When blood clots, the fluid that is squeezed out around the cellular clot is serum. Specific protocols for obtaining serum and plasma samples are located in Chapter 3.
Anticoagulants
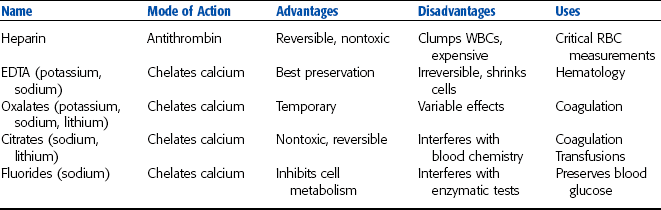
Hematology testing primarily uses whole blood samples. Hemostatic testing uses both whole blood and blood plasma. Anticoagulants are required when whole blood or plasma samples are needed. An anticoagulant is a chemical that, when added to a whole blood sample, prevents or delays clotting (coagulation) of the sample. The choice of a particular anticoagulant should be made on the basis of the tests needed. Some anticoagulants may affect assays, so the test procedure should be consulted for the proper anticoagulant. Some anticoagulants can interfere with certain coagulation tests. Regardless of the anticoagulant chosen, the sample and anticoagulant must be well mixed (by gentle inversion) before use. Samples that are not tested within 1 hour of collection should be refrigerated. Refrigerated samples must be brought back to room temperature and remixed by gentle inversion before analysis. Whole blood should not be frozen because blood cells lyse during the freezing and thawing processes. Table 2-2 summarizes commonly used anticoagulants.
TABLE 2-2
Reprinted from Sirois M: Veterinary clinical laboratory procedures, St Louis, 1995, Mosby.
Heparin
Heparin is a suitable anticoagulant for most tests that require plasma samples, particularly blood chemistry analyses. Heparin anticoagulant should never be used for differential blood film analysis because the anticoagulant interferes with the staining of WBCs. Heparin is available as a sodium, potassium, lithium, or ammonium salt. Heparin acts by preventing conversion of prothrombin to thrombin during the clotting processes. Because heparin can cause clumping of WBCs and interferes with the normal staining pattern of the WBCs, it should not be used for analyses of WBCs.
Heparin should be used at a ratio of 20 U/ml of blood to be collected. For small sample volumes, a convenient method for using heparin is to coat the inside walls of a syringe with liquid heparin before the sample is drawn from the patient. Vacuum collection tubes containing the proper amount of heparin are commercially available. These tubes are most convenient when many heparinized samples are needed.
Ethylenediamine Tetraacetic Acid
Ethylenediamine tetraacetic acid (EDTA) is the preferred anticoagulant for hematologic studies because it does not alter cell morphology. It should not be used if plasma samples are to be used for chemical assays. EDTA is available as sodium or potassium salt and prevents clotting by forming an insoluble complex with calcium, which is necessary for clot formation. EDTA tubes are available in either liquid or powder forms. The liquid form creates some dilution of the sample. To prevent clotting, EDTA is added at 1 to 2 mg/ml of blood to be collected. Vacuum collection tubes containing the proper amount of EDTA are commercially available. Excess EDTA causes cells to shrink and invalidates most cell counts performed with automated analyzers.
Oxalates and Citrates
Oxalates are available as sodium, potassium, ammonium, or lithium salts. Citrates are available as sodium or lithium salts. They prevent clotting by forming insoluble complexes with calcium, which is necessary for clot formation. Potassium oxalate is the most commonly used oxalate salt. To prevent clotting, it is used at 1 to 2 mg/ml of blood to be collected. Sodium citrates are also commonly used, especially in transfusion medicine. Vacuum collection tubes containing the proper amount of oxalate and citrate anticoagulants are commercially available. Unfortunately oxalates also may bind metallic ions necessary for enzyme activity. Potassium oxalate may inhibit lactate dehydrogenase and alkaline phosphatase activity. Also, because it is a potassium salt, it cannot be used with blood samples to be assayed for potassium. Sodium citrates similarly interfere with sodium assays, as well as many of the commonly performed blood chemistry tests.
Sodium Fluoride
Sodium fluoride, best known as a glucose preservative, also has anticoagulant properties. As an anticoagulant it is used at 6 to 10 mg/ml of blood to be collected. Vacuum collection tubes containing the proper amount of sodium fluoride for anticoagulation are commercially available. Sodium fluoride also may be added to other samples as a glucose preservative even if a different anticoagulant is present. For glucose preservation, sodium fluoride is used at 2.5 mg/ml of blood. Sodium fluoride interferes with many of the enzymatic tests performed on blood serum.
SAMPLE VOLUME
The amount of blood collected from an animal depends on the quantity of serum or plasma required for the assay and the hydration status of the patient. For example, a well-hydrated animal with a packed cell volume (PCV) of 50% should yield a blood sample that is 50% cells and 50% fluid. A 10-ml blood sample should yield 5 ml of fluid. In dehydrated animals, hemoconcentration results in a smaller ratio of fluid to cells. A dehydrated animal with a PCV of 70% yields a blood sample that is 70% cells and 30% fluid. This means that only 3 ml of fluid is obtained from a 10-ml blood sample.
As a rule of thumb, enough blood should be collected to yield enough serum, plasma, or whole blood to run all the planned assays three times. This allows for technician error, instrument failure, or the need to dilute a sample without having to collect another sample from the animal.
Blood samples must be adequately mixed before the performance of any tests; inadequate mixing results in erroneous data. For example, RBCs in horses start to settle within seconds, and a PCV performed on an unmixed sample may be erroneous. Tubes of blood may be mixed by gentle inversion for several seconds by hand or by placement of the tube on a commercially available tilting rack or rotator.
THE COMPLETE BLOOD COUNT
A CBC provides a minimum set of values that may be determined reliably and cost-effectively in the hospital setting. The CBC can be performed manually or by automated analyzers. A variety of procedures are available for both methods.
The CBC should consist of the following basic information:
• Plasma protein concentration
• Blood film examination: differential WBC count, erythrocyte and leukocyte morphology, platelet estimation
Quality Control
Automated analyzers can provide accurate and cost-effective results. However, care should be taken in choosing the most appropriate instrument for a clinic. Hematology analyzers for use in veterinary facilities employ impedance methods, buffy coat analysis, or laser methods when evaluating a sample. Each method has specific advantages and disadvantages. Regardless of which analyzer is used, an understanding of the test principles for the specific analyzer is essential. Knowing the limitations of the analytical system enhances the validity of the test results. Regular quality control is also essential for ensuring the accuracy of test results.
In addition to the routine care and maintenance of equipment used in hematology testing, the test results themselves can be used as a type of quality control. Hematology tests often overlap somewhat in the information they provide. The test results can then be used to confirm that other results are accurate. For example, if the PCV is low, the total RBC count should also be low and evidence of decreased total RBCs should be present on the differential blood film. Similarly, if the mean corpuscular volume (MCV) calculation indicates that cells are microcytic, this should also be evident on the blood film. Recall from Chapter 1 that cell counters often use the size of the particles passing through the apparatus as a method of counting cells. If significant macrocytosis is present in a sample, this could lead to a decreased RBC count because some cells may be counted as other cell types rather than as RBCs. All these tests serve as a type of internal quality control in hematology testing.
Cell Counts
Counting of erythrocytes and leukocytes is a routine part of the CBC. Cell counts can be performed by manual or automated methods. The total WBC (leukocyte) count is one of the most useful values determined in a CBC. Total RBC (erythrocyte) and platelet (thrombocyte) counts, although more difficult and less accurate, may also be performed manually with a hemacytometer or by automated methods. Manual cell count methods usually use the Unopette system (Becton, Dickinson and Co., Franklin Lakes, NJ) (Fig. 2-3). This system includes a pipette that holds a predetermined amount of blood and a reservoir that contains a diluting and lysing agent.
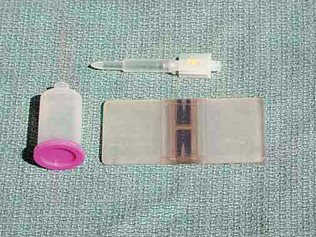
Figure 2-3 The hemocytometer and Unopette reservoir and pipette used for counting of WBCs and platelets.
The most commonly used WBC counting Unopette system uses a 20-μl (microliter) pipette and 3% acetic acid as a diluent. The RBC counting system uses a 10-μl sample pipette and 0.85% saline as a diluent (the RBCs are not lysed in this count). Unopette systems contain a premeasured volume of diluent and provide a specific dilution ratio. The appropriate amount of blood is added to the diluent, or lysing solution. After approximately 10 minutes, the reservoir is inverted several times to mix the cells evenly and is converted to a dropper assembly. Once filled with the appropriate volume of blood and mixed, a small amount of the blood-diluent mixture is placed on a hemocytometer. This is commonly called “charging” the hemacytometer. Proper filling is important for accurate cell counts. The area under the cover glass should be filled completely without the sample overflowing into the moat around the grid area. If the sample overflows, the hemacytometer should be cleaned and refilled with the sample.
Hemacytometers are counting chambers used to determine the number of cells per microliter (μl, sometimes referred to as cubic centimeters) of blood. Several models are available, but the most common type used has two identical sets of fine grids of parallel and perpendicular etched lines called Neubauer rulings (Fig. 2-4). Each grid is divided into nine large squares. The four-corner squares are divided into 16 smaller squares, and the center square, referred to as the “super square,” is divided into 400 tiny squares (25 groups of 16 each). The area of each grid (Neubauer ruling) is designed to hold a precise amount of sample (0.9 μl). Each of the nine squares on the Neubauer grid holds 0.1 μl. Knowing the number of cells in set parts of the grid and the amount of sample in that area is the basis for calculating the number of cells per microliter of blood. Mechanical counters are available to track of the number of each cell observed.
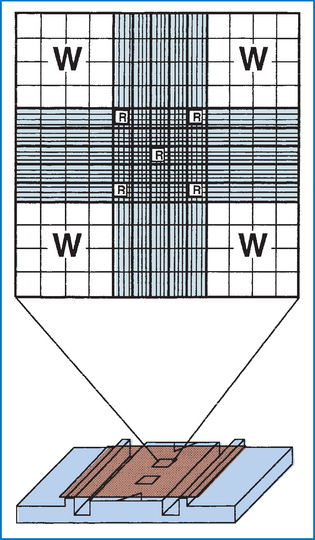
Figure 2-4 Neubauer hemacytometer. The large Ws indicate the squares that are counted for a total white blood cell (WBC) count with the 1:20 dilution WBC Unopette system. The small Rsindicate the squares that are counted for a red blood cell (RBC) count with the RBC Unopette system. (From McCurnin DM and Bassert JM: Clinical textbook for veterinary technicians, ed 6, St Louis, 2006, Saunders.)
The iris diaphragm of the microscope must be closed to a point at which the cells are most visible. The hemacytometer and cover slip are composed of optical-quality glass and must be free of dust and grease. The hemacytometer, with cover slip applied, is loaded with the diluted solution and placed on the microscope, and the counting grid is found by using the 40× or 43× objective lens. For WBC counts, cells are counted in the nine primary squares with the 10× objective. The count should proceed in an orderly fashion, starting at one end of the square, going across to the other side, then down one microscopic field and back across until all cells within the square are counted. Cells that are touching the line between two squares are counted with that square if they are touching either the top or left line. Do not count cells touching the bottom or right lines.
The number of cells counted from both sides of the hemacytometer are added and divided by two. The average number obtained is then divided by dilution and volume factors; counts are expressed as cells per microliter of blood. Cell counts should not vary more than 10% among the individual grid squares. Variations of more than 10% usually indicate improper filling of the hemacytometer.
For WBC counts using the standard 1/100 dilution, the cells in all nine squares on both sides of the hemacytometer are counted and averaged. For example, if a WBC count is performed and 80 and 76 cells are counted on all nine squares on each side of the hemacytometer, respectively, the average number is 78 cells. This is divided by the dilution ratio (1/100) and the volume factor that represents the volume of nine squares. For this example, the final cell count would be reported as 8.6 × 10³/μl (78 divided by 1/100 × 0.9). A mathematic approximation of this calculation involves simply multiplying the average number of cells by 110. An alternate method involves counting the four corner squares and center square on each side of the hemacytometer and multiplying the total number of cells by 100. This method is less accurate when the usual 1/100 dilution is used but can be accomplished more quickly.
For RBC counts, the center and four corner squares within the super square are counted. The number counted is divided by the dilution and volume factors. The standard dilution for RBC counts is 1/200; the volume factor is 0.02. This can be mathematically manipulated to a multiplication factor of 10,000. For example, if an average of 450 cells is counted, the RBC count would be recorded as 4,500,000, or 4.5 × 10⁶/μl.
RBC counts may also be estimated by dividing the PCV by six. For example, if the PCV is 36, the estimated RBC count is 36/6 = 6 million RBCs/μl. The Unopette system also provides a method for manually counting platelets, as described later.
Packed Cell Volume (PCV)
The PCV (also called microhematocrit) is the percentage of whole blood composed of erythrocytes or RBCs. Whole blood is collected in an anticoagulant, such as EDTA or heparin, and placed in a capillary tube (75 mm). Microhematocrit tubes should be filled approximately three fourths full, with one end plugged with clay sealant (Fig. 2-5), placed in a centrifuge with the plugged end facing outward, and then centrifuged in a microhematocrit centrifuge for 2 to 5 minutes (Fig. 2-6). Of the blood cells, RBCs have the highest specific gravity and gravitate to the bottom of the tube, appearing as a dark red layer. Any measuring device, such as a ruler, can be used to determine the PCV. Special hematocrit tube reader cards are available, many of which have a linear scale, so the amount of blood in the tube need not be exact. The bottom of the RBC layer should be at the zero line and the top of the plasma on the top line. The percentage can then be read as the line level with the top of the RBC layer (Fig. 2-7).
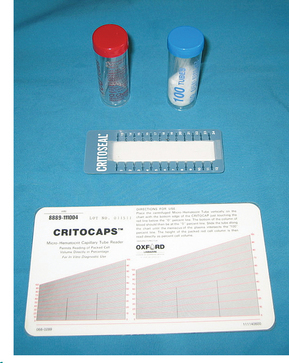
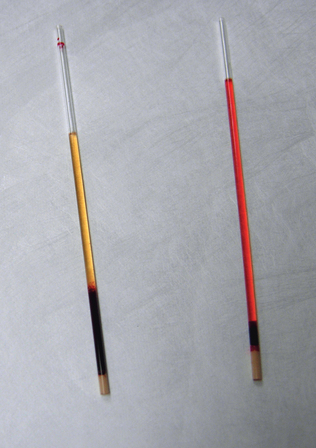
Figure 2-5 Heparinized (red) and plain (blue) microhematocrit tubes, PCV card reader, and clay used to seal the microhematocrit tube. (From Busch SJ: Small Animal Surgical Nursing: Skills and Concepts, St. Louis, 2006, Mosby.)
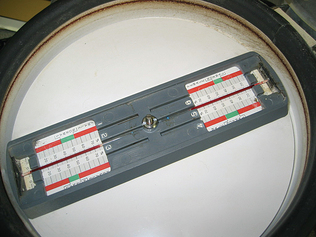
Figure 2-6 Microhematocrit tubes are placed with the clay plug toward the outside of the centrifuge. Two tubes placed opposite each other are required to balance the centrifuge. (From Busch SJ: Small Animal Surgical Nursing: Skills and Concepts, St. Louis, 2006, Mosby.)
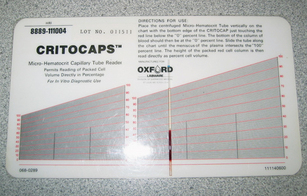
Figure 2-7 The PCV is determined by aligning the top of the clay plug on the zero line and locating the intersecting line where the packed red cells and buffy coat meet. (From Busch SJ: Small Animal Surgical Nursing: Skills and Concepts, St. Louis, 2006, Mosby.)
A whitish-gray layer just above the RBC layer is termed the buffy coat and consists of WBCs and platelets. The height of the buffy coat layer can provide a rough estimate of the total WBC count. The presence of increased numbers of nucleated RBCs imparts a reddish tinge to the buffy coat. The plasma is the clear-to-yellow fluid at the top. Plasma obtained by this method can be used to determine the plasma protein concentration by refractometry. Plasma color and transparency may be helpful in the determination of a diagnosis and should be recorded. Normal plasma is clear and a pale straw-yellow color (Fig. 2-8). Serum that appears cloudy is described as lipemic. This may be the result of a pathologic condition or may be seen as an artifact if the patient was not properly fasted before blood collection. A reddish-tinged plasma layer is described as hemolyzed. This may also be an artifact if the blood sample was not properly collected and handled or can be evidence of a pathologic condition, such as hemolytic anemia. Plasma that appears deep yellow is described as icteric and can be seen in animals with liver disease or hemolytic anemia. Abnormal plasma colors must be noted because the color can interfere with the chemical analyses if photometric methods are used for evaluation of plasma constituents.
The macrohematocrit method for determining PCV is not commonly performed because it requires a large amount of blood, generally a minimum of 10 ml. The blood is placed in a Wintrobe tube and centrifuged for 10 minutes at 18,000 rpm. The scale on the Wintrobe tube is read at the level of the packed RBCs, and that number is multiplied by 10 to determine the PCV.
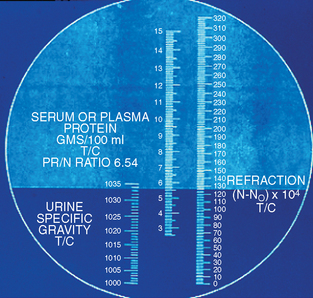
Plasma Protein Concentration
Although not specifically considered a hematologic test, the materials needed for plasma protein concentration are already available as the result of performing the PCV. Plasma protein concentration estimation by refractometry is an important component of the CBC in all species. The plasma used to determine the PCV is collected by breaking the hematocrit tube just above the buffy coat–plasma interface. The plasma is allowed to flow onto the refractometer prism (Fig. 2-9). The refractometer is then held to a bright light and the reading is made at the dividing line between the bright and dark field. The protein value (in grams per deciliter) is read directly from a scale inside the refractometer. Lipemic plasma contains chylomicrons that cause the light to diffract in many different directions and usually results in a false increase in the total protein reading.
Hemoglobin Testing
The protein molecule hemoglobin is the functional unit of the erythrocyte. The molecule consists of two main components: the heme portion, which contains iron, and the globin portion, which is composed of paired chains of amino acids. The synthesis of hemoglobin occurs during maturation of the RBCs in the bone marrow. Once in circulation, different forms of hemoglobin can exist. Hemoglobin bound to oxygen is referred to as oxyhemoglobin. When the oxygen is delivered to the tissues by the RBCs, carbon dioxide binds in place of the oxygen. The carbon dioxide is then replaced again by oxygen during respiration. Other forms of hemoglobin that may also be present include methemoglobin and sulfhemoglobin. Both of these forms are inefficient at oxygen transport. Sulfhemoglobin results from normal RBC aging processes. Methemoglobin occurs naturally both in plasma and within RBCs but can be converted to hemoglobin and used for oxygen delivery. Carboxyhemoglobin results from exposure to carbon monoxide. Hemoglobin and methemoglobin have a much higher affinity for carbon monoxide than for oxygen or carbon dioxide. Therefore the reaction that creates carboxyhemoglobin is irreversible.
A variety of methods are available for determination of hemoglobin. The oldest methods use color matching of lysed RBCs (Fig. 2-10). Some automated analyzer types provide only an estimate of the hemoglobin concentration based on the RBC count.
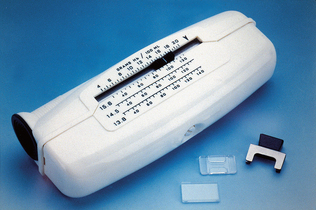
Figure 2-10 The hemoglobinometer uses a color-matching method for determining hemoglobin concentration in a sample of lysed RBCs.
Most automated analyzers determine hemoglobin concentration by mixing a small amount of blood with a solution to lyse the blood cells and then comparing the color of the sample with a standard. Exposure to cyanide converts all forms of hemoglobin to cyanmethemoglobin. Lysing solutions that contain small amounts of cyanide function to convert all forms of hemoglobin to cyanmethemoglobin and therefore provide a measure of all forms of hemoglobin in the sample. A number of automated and semiautomated analyzers are dedicated to hemoglobin measurement. Most of these use a modification of the cyanmethemoglobin photometric procedure and are quite accurate if properly maintained. Small dedicated analyzers are also available. Some of these provide results only for oxyhemoglobin and use simple color-matching technology. Other types use photometric procedures calibrated to approximate the cyanmethemoglobin procedure.
Erythrocyte Indices
Determination of erythrocyte indices is helpful in the classification of certain types of anemia. The erythrocyte indices include the mean corpuscular volume (MCV), mean corpuscular hemoglobin (MCH), and MCH concentration mean corpuscular hemoglobin concentration (MCHC). The indices can provide an objective measure of the size of the RBCs and their average hemoglobin concentration. The accuracy of the calculation depends on the accuracy of the individual measurements of total RBC count, PCV, and hemoglobin concentration. Values for erythrocyte indices should always be compared with the morphologic features of the cells on the blood smear. For example, a low value for MCH should be evident as erythrocytes that appear more pale than normal (hypochromic) on the blood smear.
Mean Corpuscular Volume
MCV is the measure of the average size of the erythrocytes. MCV is calculated by dividing the PCV by the RBC concentration and multiplying by 10. The unit of volume is the femtoliter (fl).
For example, if a dog has a PCV of 42% and an RBC count of 6.0 million/μl, the MCV is 70 fl.
Many of the automated hematology analyzers determine the MCV electronically and use that measurement to calculate the PCV.
Mean Corpuscular Hemoglobin
MCH is the mean weight of hemoglobin (Hb) contained in the average RBC. It is calculated by dividing the hemoglobin concentration by the RBC concentration and multiplying by 10:
Mean Corpuscular Hemoglobin Concentration
MCHC is the concentration of hemoglobin in the average erythrocyte (or the ratio of weight of hemoglobin to the volume in which it is contained). The MCHC (in grams per deciliter) is calculated by dividing the hemoglobin concentration (in grams per deciliter) by the PCV (percentage) and multiplying by 100.
For example, if a dog has a hemoglobin concentration of 14 g/dl and a PCV of 42%, the MCHC is 33.3 g/dl. The normal range for MCHC is 30 to 36 g/dl for all mammals, with the exception of some sheep and all members of the family Camellidae (camels), which have MCHC values of 40 to 45 g/dl.
Histograms
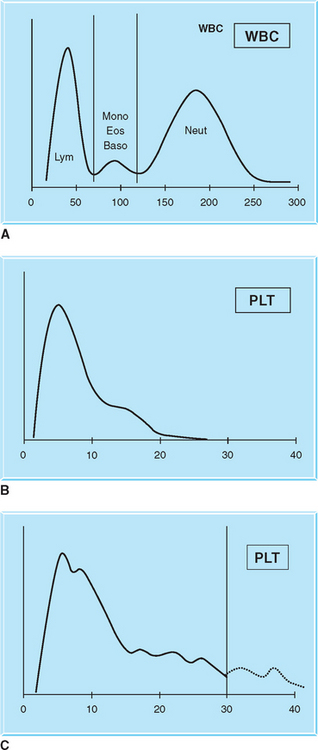
Many automated analyzers offer histograms of the cell counts and platelet counts. A histogram is a graph that provides a visual report of the sizes (on the x-axis) and numbers (on the y-axis) of the various cellular components. The histogram can be used to verify results of the differential blood cell film and provide an indication of any problem with test results. For example, when megathrombocytes or platelet aggregates are present, the WBC count performed on most automated analyzers will be falsely elevated because those large platelets are usually counted as leukocytes. The histogram can provide evidence of this anomaly because the WBC curve on the histogram will be altered (Fig. 2-11).
Preparation of Blood Films
The blood film is used to perform the differential WBC count; estimate platelet numbers; and evaluate the morphologic features of WBCs, RBCs, and platelets.
Peripheral blood films can be prepared by using either a wedge smear technique or a cover slip technique.
Wedge smears are prepared by placing a small drop of blood on a clean glass microscope slide. The end of a second slide is placed against the surface of the first slide at a 30-degree angle and drawn back into the drop of blood. The angle of the second slide can be modified to account for changes in consistency of blood from an anemic patient (Fig. 2-12 and Procedure 2-1). When the blood has spread along most of the width of the spreader slide, it is then pushed forward with a steady, even, rapid motion. The slide should be gently waved in the air to allow it to air dry quickly. A properly prepared blood film is thin, with even distribution of cells.
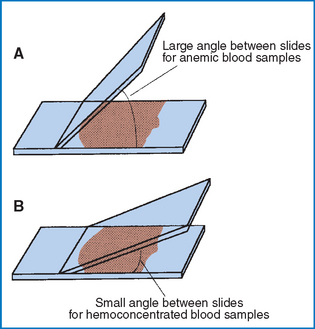
Figure 2-12 Difference in slide angle necessary for making blood films from anemic or hemoconcentrated blood. A, Large angle for anemic blood. B, Small angle for hemoconcentrated blood. (From McCurnin DM and Bassert JM: Clinical textbook for veterinary technicians, ed 6, St Louis, 2006, Saunders.)
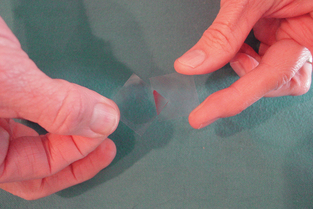
Coverslip smears are made by putting one drop of blood in the center of a clean square cover slip. Place a second cover slip diagonally on top of the first, causing the blood to spread evenly between the two surfaces. Then pull the cover slips apart in a single smooth motion before the blood has completely spread (Fig. 2-13 and Procedure 2-2). Wave the smears gently in the air to promote drying.
Staining Blood Films
After they air dry, the films must be stained to clearly distinguish the individual cells and identify any abnormal cellular characteristics. Blood films can be stained with any of the Romanowsky-type stains. The commonly available Romanowsky stains include Wright’s stain and Wright-Giemsa stain. Romanowsky stains are available either in one-step or three-step formulations. The components of the stain may vary somewhat but usually include a fixative and buffered solutions of eosin and methylene blue. The fixative used is usually 95% methanol. The eosin component is buffered at an acidic pH and stains the basic components of the cells, such as hemoglobin and eosinophilic granules. The methylene blue component is buffered to an alkaline pH and stains the acidic components of the cell, such as leukocyte nuclei. A one-step stain that gives acceptable results is Diff-Quik (Dade Behring, Deerfield, IL). When a three-step stain is used, the slide is rinsed with distilled water between each of the three components. Care must be taken to avoid dripping water into any of the stain components or the stain will become degraded. A final rinse with distilled water should be done on all slides and then the slides allowed to dry before microscopic examination of the smear.
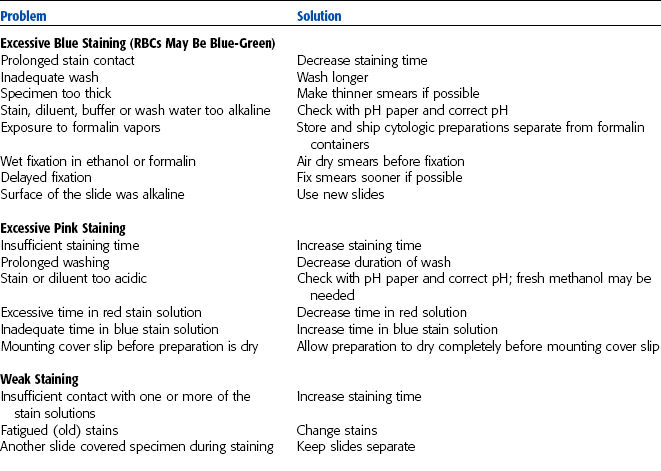
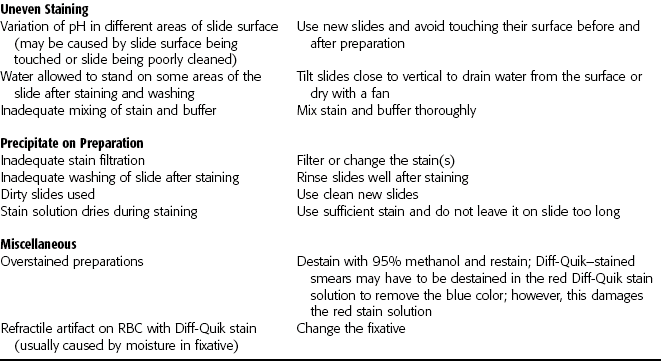
Table 2-3 lists problems related to staining. Cells appear dark if overstained, whereas extensive rinsing may cause them to look faded. Changing stains regularly is necessary for consistent results and the prevention of stain precipitation on the film. Stains can also be filtered to remove excess debris. Refractile artifacts on RBCs are another common problem. These are usually caused by moisture in the fixative solution. Take care not to confuse these artifacts with cellular abnormalities.
Performing the Differential Cell Count
Although most veterinary hematology analyzers provide at least a partial differential WBC count, a blood film must still be prepared and evaluated. A large number of abnormalities will not be routinely reported by automated analyzers, including the following:
| Nucleated RBCs | Toxic granulation |
| Megaplatelets | Platelet clumps |
| Heinz bodies | Polychromasia |
| Target cells | Hemoparasites |
| Lupus erythematosus cells | Bacteria |
| Left shift | Hypersegmentation |
| Lymphoblasts | Basophils |
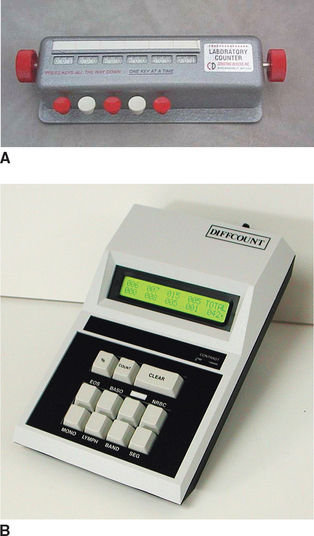
Examining the slides the same way each time is important to avoid making mistakes in counting cells or missing important observations. Always begin the examination by scanning the slide under low power magnification (100×). A general assessment of overall cell numbers can be obtained. The entire slide should then be scanned for the presence of platelet clumps, large abnormal cells, and microfilariae. Locating the feathered edge and monolayer is performed next at high power magnification (Fig. 2-14). The feathered edge area of the blood film contains cells that are usually greatly distorted and erratically distributed. The monolayer is the area of the blood film where the cells are evenly and randomly distributed and not distorted. Once these two areas are identified, the technician focuses on one microscopic field in the monolayer just adjacent to the feathered edge. The differential count is performed in the smear monolayer by using oil-immersion (1000×) magnification. A minimum of 100 WBCs are counted, identified, and recorded during this count. Because 100 WBCs are counted, the number of each WBC type observed is recorded as a percentage. This is called the relative WBC count. Various counting devices are available to help perform the differential WBC count (Fig. 2-15).
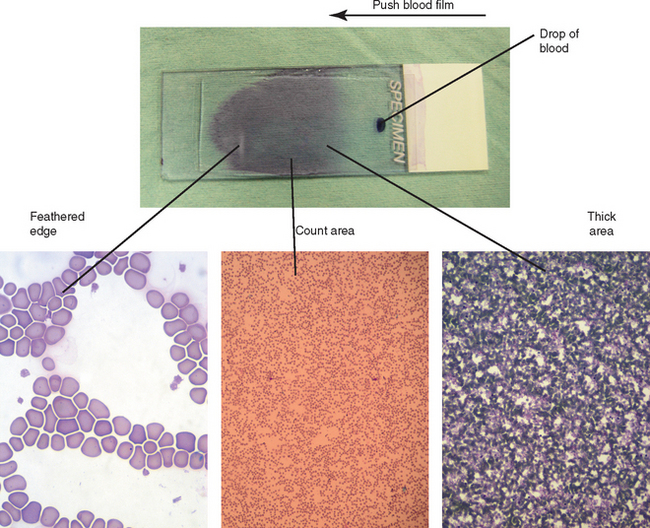
Figure 2-14 Gross and microscopic views of different areas on a blood film. The blood film on the glass slide at the top was made by pushing the blood from the drop (indicated drop of blood) at the right to the left (large arrow). The three major areas of the blood film (feathered edge, count area, thick area) are indicated by the lines connected to the respective microscopic views.
Quantifying Morphologic Changes
In addition to enumerating each type of WBC, the differential blood count requires that the morphologic features of the cells be evaluated and the platelet count be estimated. The presence of any abnormal cells or toxic changes should be semiquantified. Two methods are commonly used for assessing the degree of morphologic changes. One method uses a scale of 1+, 2+, 3+, and 4+ to indicate the relative percentage of cells with the morphologic change. The designation 1+ generally equates to 5% to 10% of the cells being affected, 2+ indicates 10% to 25%, 3+ indicates approximately 50%, and 4+ indicates more than 75% of the cells are affected. These are subjective assessments. Another method uses the designations “slight,” “moderate,” or “marked” to indicate approximately 10%, 25%, and more than 50% of cells as affected, respectively.
Absolute Values
Once the relative percentages of each cell type have been determined, the absolute value of each cell type must be calculated. This is accomplished by multiplying the total WBC count by the percentage of each cell type. For example, if 80% neutrophils are counted on the differential blood film and the total WBC count was 6000/μl, the absolute value for neutrophils is 4800 neutrophils/μl of blood.
White Blood Cells: Mature and immature neutrophils, lymphocytes, monocytes, eosinophils, and basophils make up the leukocytes (WBCs) found in the blood of most mammals. Each type of cell plays an important role in the body’s defense system, and the total concentration of each type is extremely valuable in the diagnosis of various diseases.
Definitions: The following are some definitions of hematologic terms used in this section:
-penia: Decreased number of cells in the blood. For example, neutropenia refers to decreased numbers of neutrophils in the blood. Lymphopenia describes decreased numbers of lymphocytes in the blood.
-philia or -cytosis: Increased number of cells in the blood. For example, neutrophilia refers to increased numbers of neutrophils in the blood. Leukocytosis refers to increased numbers of leukocytes in the blood.
Left shift: Increased numbers of immature neutrophils in the blood.
Leukemia: Neoplastic cells in the blood or bone marrow. Leukemias are often described as leukemic, subleukemic, or aleukemic, indicating the variation in the tendency for neoplastic cells to be released in the blood.
Leukemoid response: Condition that can be mistaken for leukemia. It is characterized by marked leukocytosis (more than 50,000/μl) and is usually the result of inflammatory disease.
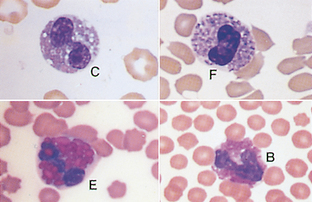
Morphologic Features of Mammalian Leukocytes in Peripheral Blood:
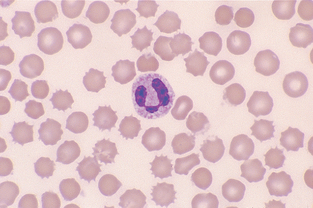
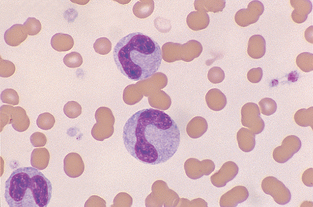
Neutrophil.: The nucleus of neutrophils is irregular and elongated; true filaments between nuclear lobes are rare (Fig. 2-16). The presence of three to five nuclear lobes is characteristic of mammalian neutrophils. The nucleus of equine neutrophils has heavily clumped, coarse chromatin. The cytoplasm stains pale pink with fine, diffuse granules. Bovine neutrophils have darker-pink cytoplasm.
In avian, reptile, some fish, and some small mammal species (e.g., rats, rabbits, guinea pigs), the cell that is functionally equivalent to the neutrophil is referred to as a heterophil. Heterophils have distinct eosinophilic granules in their cytoplasm (Fig. 2-17). They are sometimes referred to as pseudoeosinophils.
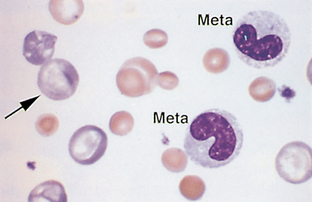
Band Neutrophil.: The nucleus of band neutrophils is horseshoe shaped, with large round ends (Fig. 2-18). Although slight indentations may be present in the nucleus, if the constriction is greater than one third the width of the nucleus, the cell is usually classified as a segmented neutrophil. The designation of a neutrophil as a band or a mature segmented cell is somewhat subjective. Each facility should clearly state the criteria for which a neutrophil will be designated a band and apply that criteria consistently to all samples. If in doubt over whether a particular cell is a band or a mature segmented cell, the cell is best classified as a mature cell. More immature neutrophils (myelocytes, metamyelocytes) are rare in peripheral blood (Fig. 2-19).
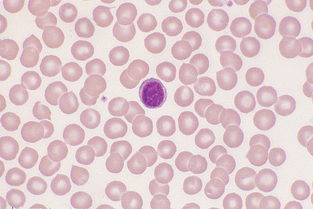
Lymphocyte.: Small lymphocytes are approximately 7 to 9 μm in diameter and have a slightly indented nucleus (Fig. 2-20). The chromatin is coarsely clumped, and the cytoplasm is light blue and quite scanty. Chromocenters, or areas of condensed chromatin, should not be confused with nucleoli; chromocenters appear as dark clumps within the nucleus. Medium-size to large lymphocytes are 9 to 11 μm in diameter, with more abundant cytoplasm. The cytoplasm may contain pink-purple granules. Normal bovine lymphocytes may contain nucleolar rings and may be large and difficult to distinguish from neoplastic lymphoid cells (Fig. 2-21).
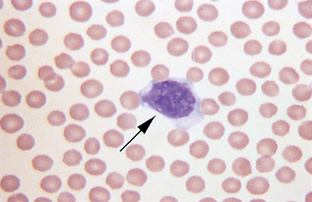
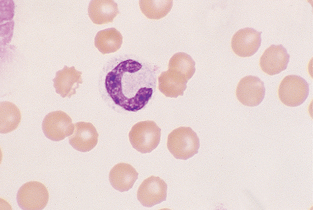
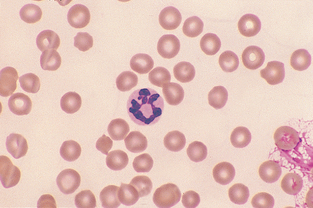
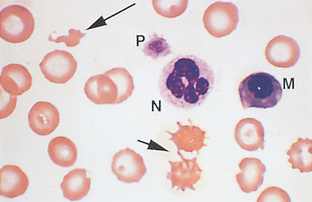
Monocyte.: Monocytes are large cells that contain variably shaped nuclei (Fig. 2-22). The nucleus is occasionally the shape of a kidney bean but is often elongated and lobulated. The nuclear chromatin is more diffuse in monocytes than in neutrophils, in which it is coarsely clumped. The cytoplasm of monocytes is blue-gray and may contain vacuoles and/or small, fine, pink granules. Monocytes may be difficult to distinguish from band neutrophils, large lymphocytes, or metamyelocytes that are toxic. If a left shift is not present, the cells in question are probably monocytes.
Eosinophil.: Eosinophils contain a nucleus similar to that of neutrophils, but the chromatin is usually not as coarsely clumped. The shape of the eosinophilic granules varies considerably among species (Fig. 2-23). The granules in canine eosinophils often vary in size with small and large granules within the same cell, and stain less intensely than those of other species; they usually are hemoglobin colored. Feline eosinophils contain granules that are small, rod shaped, and numerous. Equine eosinophil granules are large and round to oval, staining an intense orange-red. Eosinophil granules in cattle, sheep, and pigs are round and much smaller than those in horses. They are large, round, uniform in size, and stain an intense pink.
Basophil.: The nucleus of basophils is similar to that of monocytes. Basophil granules in dogs are few in number and stain purple to blue-black (Fig. 2-24). Equine and bovine basophil granules are usually more numerous and may completely pack the cytoplasm. Feline basophil granules are round, stain light lavender (Fig. 2-25), and rarely contain dark granules.
Morphologic Abnormalities Seen in WBCs.:
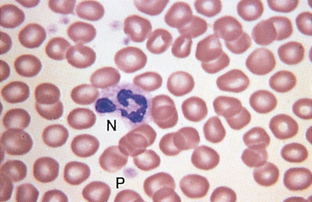
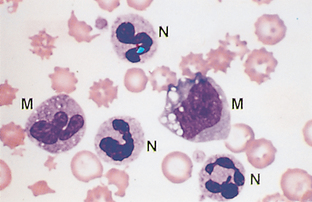
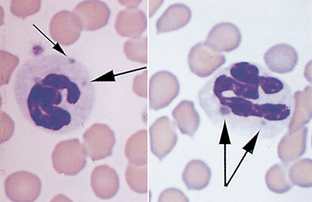
Nuclear Hyposegmentation.: Pelger-Huët anomaly is a congenital defect characterized by hyposegmentation of all granulocyte nuclei. Nuclear chromatin appears condensed but unsegmented. Cytoplasm of affected cells appears normal (Fig. 2-26).
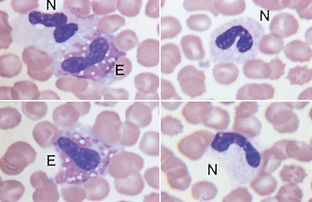
Figure 2-26 Nuclear hyposegmentation in neutrophils (N) and eosinophils (E) from a dog with Pelger-Huët anomaly (Wright’s stain).
Hyposegmentation may simply reflect early release of band neutrophils. Pseudo–Pelger-Huët anomaly has been reported and is either a variant of a normal inflammatory response or may be caused by an idiosyncratic drug reaction. In general, in pseudo–Pelger-Huët anomaly, fewer neutrophils are hyposegmented than in the congenital anomaly.
Nuclear Hypersegmentation.: Canine and feline neutrophils with five or more lobes are considered hypersegmented (Fig. 2-27). This is usually attributable to aging of neutrophils, either in vivo—as would be seen with endogenous or exogenous glucocorticoids, which prolong the half-life of circulating neutrophils—or in vitro, as a result of prolonged storage of blood before making blood films. Hypersegmented neutrophils also are seen in blood films from poodles with poodle macrocytosis.
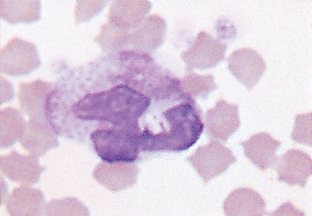
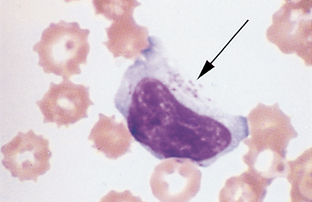
Toxic Change.: The most common disease-induced cytoplasmic changes in neutrophils are referred to as toxic changes and are associated with conditions such as inflammation, infection, and drug toxicity. These changes are more significant when they occur in dogs; if severe they often suggest bacterial infection. However, toxic changes are seen quite commonly in cats that are not severely ill. Types of toxic change include cytoplasmic basophilia; Döhle’s bodies; vacuoles, or “foaminess” (Fig. 2-28) and, rarely, intensely stained primary granules, referred to as toxic granulation (Fig. 2-29). Affected cells may also appear much larger than normal segmented neutrophils (Fig. 2-30). These “toxic” changes are thought to be caused by decreased time of neutrophil maturation within the marrow.
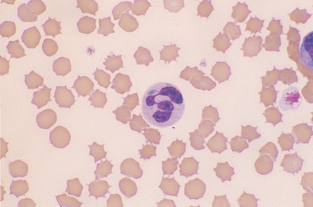
Figure 2-28 A toxic neutrophil showing cytoplasmic basophilia and a large Döhle’s body. The RBCs are crenated. (From Cowell RL, Tyler RD, and Meinkoth JH: Diagnostic Cytology and Hematology of the Dog and Cat, ed 2, St. Louis, 1999, Mosby.)
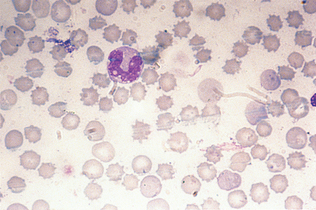
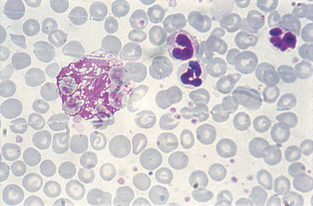
Intracytoplasmic Neutrophil Inclusions in Infectious Diseases.: Canine distemper inclusions may appear in RBCs or neutrophils and are pale blue to magenta. Rickettsial inclusions (Ehrlichia species) may be seen within the cytoplasm of neutrophils (Fig. 2-31), as are the gametocytes of Hepatozoon canis.
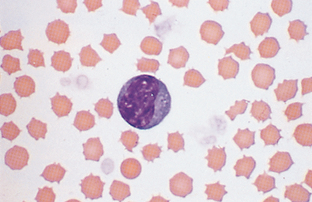
“Atypical” and “Reactive” Lymphocytes.: Azurophilic granules in the cytoplasm of lymphocytes (Fig. 2-32) are often associated with chronic antigenic stimulation, especially in canine ehrlichiosis. Azurophilic granules may be present in normal bovine lymphocytes. Atypical lymphocytes may also have cleaved nuclei and/or show evidence of asynchronous maturation of the nucleus and cytoplasm. “Reactive” lymphocytes (Fig. 2-33) have increased basophilia in the cytoplasm; may have more abundant cytoplasm; and sometimes contain a larger, more convoluted nucleus. These changes are usually caused by antigenic stimulation secondary to vaccination or infection.
Lysosomal Storage Disorders.: In this group of rare inherited diseases a substance is abnormally stored within cells, usually because of an intracellular enzyme deficiency. Numerous types have been reported in animals. Clinical signs vary depending on the specific enzyme deficiency. Most types have either skeletal abnormalities or progressive neurologic disease. Because most cells of the body are affected, the stored substance often may be seen in leukocytes, usually monocytes, lymphocytes, or neutrophils. The appearance of the leukocytes varies depending on the type of lysosomal storage disease. Lymphocytes may be vacuolated or contain granules; neutrophils may also contain granules (Fig. 2-34).
Birman Cat Neutrophil Granulation Anomaly.: Neutrophils from affected cats contain fine eosinophilic to magenta granules. This anomaly is inherited as an autosomal-recessive trait. Neutrophil function is normal and affected cats are healthy. This granulation must be distinguished from toxic granulation and the granulation seen in neutrophils of cats with mucopolysaccharidosis and GM2 gangliosidosis, two of the lysosomal storage disorders.
Chédiak-Higashi Syndrome.: Neutrophils in cats with Chédiak-Higashi syndrome have large, fused 0.5- to 2-μm lysosomes within the cytoplasm and stain lightly pink or eosinophilic (Fig. 2-35). Approximately one in three or four neutrophils contains fused lysosomes. Granules of eosinophils appear slightly plump and large. These cats have a slight tendency to bleed because platelet function is abnormal. Although neutrophil function is also abnormal, affected cats are generally healthy.
Smudge Cells.: Smudge cells, sometimes referred to as basket cells, are degenerative leukocytes that have ruptured (Fig. 2-36). Their presence is not considered significant unless large numbers are present. Small numbers of smudge cells can be produced as an artifact when blood is held too long before making the smear or excess pressure is used when making the smear. Large numbers of smudge cells are associated with leukemia.
Morphology of Mammalian Erythrocyte in Peripheral Blood.: Normal erythrocyte morphologic features vary among different species of domestic animals. Normal canine erythrocytes are a biconcave disk shape and have a distinct area of central pallor. Feline erythrocytes are round with no central pallor. Unlike the RBCs of mammals, avian RBCs are nucleated. The morphologic characteristics of erythrocytes can be categorized according to cell arrangement on the blood film, size, color, shape, and presence of structures in or on erythrocytes.
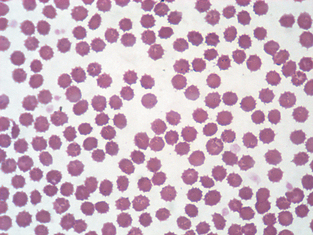
Cell Arrangement.: Rouleaux formation is a grouping of erythrocytes in stacks (Fig. 2-37). Increased rouleaux formation is seen with increased fibrinogen or globulin concentrations. Rouleaux is accompanied by an increase in the erythrocyte sedimentation rate. Marked rouleaux formation is seen in healthy horses. Rouleaux may be seen as an artifact in blood that is held too long before preparing the blood film and in blood that has been refrigerated.
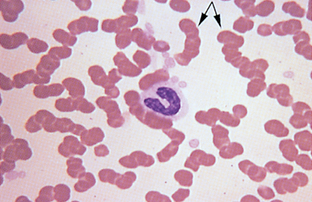
Figure 2-37 Marked rouleaux in a normal equine blood film. A neutrophilic band cell is also present.
Agglutination of erythrocytes must be distinguished from rouleaux formation (Fig. 2-38). Agglutination occurs in immune-mediated disorders in which antibody coats the erythrocyte, resulting in bridging and clumping of RBCs. It is sometimes observed macroscopically and microscopically. To differentiate rouleaux from agglutination, add a drop of saline to a drop of blood and examine the sample microscopically for agglutination. Rouleaux will disperse in saline.
Size.: Anisocytosis is a variation in the size of RBCs (Fig. 2-39) and may indicate the presence of macrocytes (large cells) or microcytes (small cells) or both. Anisocytosis is a common finding in normal bovine blood. Macrocytes are RBCs that are larger than normal, with an increased MCV. Macrocytes are usually young, polychromatophilic erythrocytes (reticulocytes). Microcytes are RBCs with a diameter less than that of normal erythrocytes, with a decreased MCV. Microcytic cells may be seen with iron deficiency.
Color.: Polychromasia or polychromatophilic erythrocytes are RBCs exhibiting a bluish tint when stained with Romanowsky (Wright’s type) stain (Fig. 2-40). The blue tint is due to the presence of organelles remaining within the cytoplasm; therefore these are young cells. This is the same cell that, when stained with new methylene blue or brilliant cresyl blue, may appear as a reticulocyte.
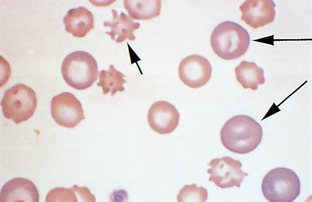
Figure 2-40 Macrocytic polychromatophilic RBCs (long arrows) and acanthocytes (small arrow) are present in this canine blood film.
Hypochromasia is a decreased staining intensity caused by insufficient hemoglobin within the cell (Fig. 2-41). The cell will normally appear more darkly stained along the periphery gradually tapering to a much paler central region. Iron deficiency is the most common cause, although macrocytic erythrocytes often appear hypochromic because of their large diameter. Hypochromic cells should be distinguished from bowl-shaped or “punched-out” cells, which are produced as an artifact with improper smear technique (Fig. 2-42). Animals with true hypochromasia almost always have microcytosis, as determined by a decreased MCV. Normochromia is a normal staining intensity.
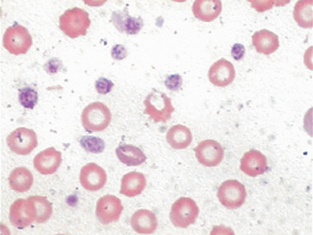
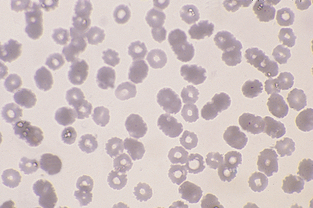
Figure 2-42 The punched-out appearance to many of these RBCs is an artifact caused by inadequate drying of the blood film.
Hyperchromatophilic refers to cells that appear more darkly stained than normal cells. This gives the appearance that the cells are oversaturated with hemoglobin. Because the RBC has a fixed maximum capacity for hemoglobin, oversaturation cannot occur. These cells are usually microcytes or spherocytes.
Shape.: Abnormally shaped erythrocytes are called poikilocytes. This terminology is not helpful because it does not suggest a specific diagnosis. The origin of the abnormal shape depends in part on the species being examined. Shape and color changes are considered important when they are associated with specific disorders. The term poikilocytosis should be used only when the morphologic abnormality cannot be described using more specific terms.
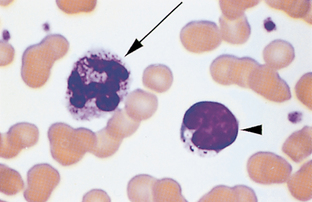
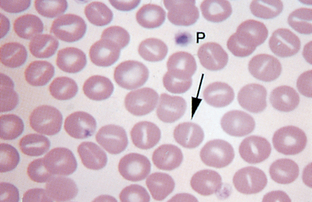
Schistocytes (Fig. 2-43), which are RBC fragments, are usually formed as a result of shearing of the red cell by intravascular trauma. Schistocytes may be observed with disseminated intravascular coagulopathy (DIC) when erythrocytes are broken by fibrin strands, with vascular neoplasms (e.g., hemangiosarcoma), and with iron deficiency. Animals with DIC usually have concurrent thrombocytopenia.
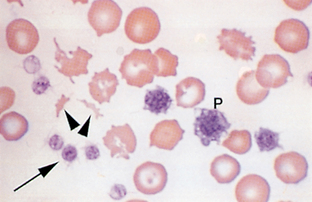
Figure 2-43 Schistocytes (arrowheads), platelets (arrow), and giant platelets (P) are seen on this blood film from a dog with iron-deficiency anemia.
Acanthocytes, or spur cells, are irregular, spiculated red cells with a few unevenly distributed surface projections of variable length and diameter (Fig. 2-40) and are seen in patients with altered lipid metabolism, such as may occur in cats with hepatic lipidosis and, occasionally, in dogs with liver disease. They are seen quite consistently in dogs with hemangiosarcoma of the liver. The presence of acanthocytes in middle-age to old large-breed dogs with concurrent regenerative anemia is suggestive of hemangiosarcoma.
Echinocytes (burr cells) are spiculated cells with numerous short, evenly spaced, blunt to sharp surface projections of uniform size and shape. Echinocyte formation can be an artifactual, in vitro process associated with slow drying of blood films; it is then termed crenation. Echinocytes can also be produced as an artifact if the EDTA tube is underfilled. Echinocytes have also been associated with renal disease and lymphosarcoma in dogs, after exercise in horses, and with rattlesnake envenomation in dogs (Fig. 2-44).
Drepanocytes, or sickle cells, are observed in the blood of normal deer and angora goats. This is thought to be an in vitro phenomenon resulting from low oxygen tension (Fig. 2-45).
Keratocytes are commonly referred to as “helmet cells,” “blister cells,” or “bite cells.” The presence of keratocytes has been associated with hemangiosarcoma, neoplasia, glomerulonephritis, and various hepatic diseases. The cell may appear to contain a vacuole. Keratocytes are believed to form from intravascular trauma involving bisection of the cell by fibrin strands. The opposing sides of the cell may then adhere to each other and form a pseudovacuole (Fig. 2-46).
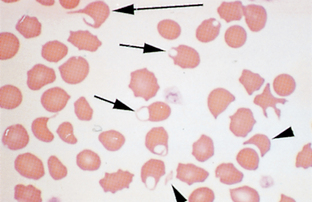
Figure 2-46 Numerous keratocytes (arrows) and a schistocyte (arrowhead) are present in this blood film from a cat with iron-deficiency anemia.
Spherocytes are darkly staining red cells with reduced or no central pallor (Fig. 2-47). Spherocytes are not easily detected in species other than dogs. They have a reduced amount of membrane surface area as a result of partial phagocytosis by macrophages, which occurs because of antibody and/or complement on the surface of the RBC. Spherocytes are significant in that they suggest immune-mediated destruction of RBCs, resulting in hemolytic anemia. They also may be seen after transfusion with mismatched blood. Immune-mediated hemolytic anemia is usually a regenerative anemia, with marked polychromasia and high reticulocyte count. However, in some instances the anemia is nonregenerative as a result of antibodies against RBC precursors within the bone marrow. In these cases, spherocytes are often difficult to detect because the presence of large polychromatophilic cells facilitates recognition of the small spherocytes. Although spherocytes have a decreased diameter and appear small, their volume is normal, and dogs with immune-mediated hemolytic anemia do not have decreased MCV.
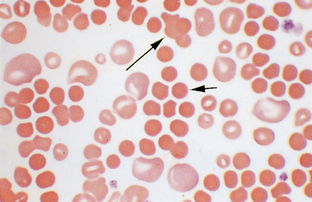
Figure 2-47 Anisocytosis and spherocytes (short arrow) are present in this canine blood film. A cluster of agglutinated cells (long arrow) is also present.
Codocytes are also referred to as leptocytes. This group of cells is characterized by an increased membrane surface area relative to the cell volume. They may take a variety of shapes. Target cells are leptocytes with a central area of pigment surrounded by a clear area and then a dense ring of peripheral cytoplasm (see Fig. 2-39). A few may be seen in normal blood smears and may also be associated with anemias, liver diseases, and some inherited disorders. Leptocytes may also appear as folded cells and stomatocytes. Folded cells have a transverse, raised fold extending across the center of the cell and a clear, slitlike pale region in the center of the cell (Fig. 2-48). Folded cells and stomatocytes are considered an artifact if the areas of pallor are all perpendicular to the feathered edge. Barr cells are also referred to as knizocytes. This type of leptocyte appears to have a bar of hemoglobin across the center of the cell.
Anulocytes are bowl-shaped erythrocytes that form as a result of loss of membrane flexibility that does not allow the cell to return to a normal shape after passing through a capillary. These cells may be seen in any acute disease.
Dacryocytes are teardrop-shaped cells seen in myelofibrosis and certain other myeloproliferative diseases. These may be produced as an artifact but can be identified by the direction of the elongated tail. Dacryocytes produced as artifact have their tails pointing in the same direction.
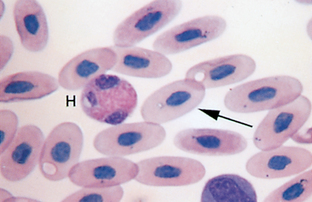
Oval, elliptical, or elongated erythrocytes may be seen in various types of anemia. These are sometimes referred to as pencil cells. In the llama and other members of the camel family, these are the predominant cell type and do not indicate a pathologic condition. Normal goat and sheep blood may also contain oval-shaped erythrocytes. Hemoglobin pigment may appear evenly disbursed throughout the cell or concentrated at each end of the oval, with a central area of pallor (Fig. 2-49).
Nucleated erythrocytes.: In mammals, nucleated erythrocytes represent early release of immature cells during anemia but also may be occasionally observed in nonanemic animals (Fig. 2-50). All RBCs of nonmammalian species, such as birds and reptiles, contain nuclei (see Fig. 2-17). Nucleated RBCs (NRBCs) are included in the total WBC count performed by hemacytometers and electronic cell counters. When performing a differential cell count, NRBCs may be counted separately and reported as NRBCs/100 WBCs. The number of NRBCs encountered while counting 100 WBCs is incorporated into the following equation to calculate a corrected leukocyte count:

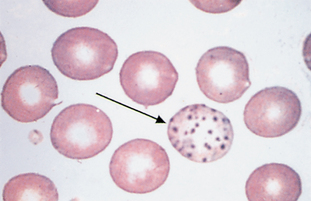
Basophilic stippling, or the presence of small, dark-blue bodies within the erythrocyte, is observed in Wright’s-stained cells and represents residual RNA. It is common in immature RBCs of ruminants and occasionally in cats during a response to anemia and is usually characteristic of lead poisoning when seen in dogs (Fig. 2-51).
Howell-Jolly bodies are basophilic nuclear remnants seen in young erythrocytes during the response to anemia (Fig. 2-52). As cells containing nuclear remnants pass through the spleen, phagocytic cells remove the remnants. Consequently, increased numbers may be seen after removal of the spleen or with splenic disorders.
Heinz bodies are round structures representing denatured hemoglobin caused by certain oxidant drugs or chemicals. The denatured hemoglobin becomes attached to the cell membrane and appears as a pale area with Wright’s stain (Fig. 2-53). When stained with new methylene blue (same technique used for reticulocytes), the Heinz bodies appear blue (Fig. 2-54). In dogs, they are 1 to 2 μm in diameter. Unlike other domestic animals, normal cats have Heinz bodies in as many as 5% of their RBCs, and Heinz bodies are often increased in concentration with diseases such as lymphosarcoma, hyperthyroidism, and diabetes mellitus in cats.
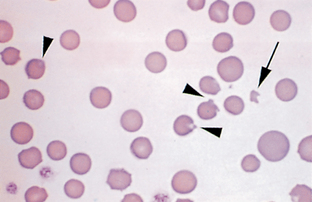
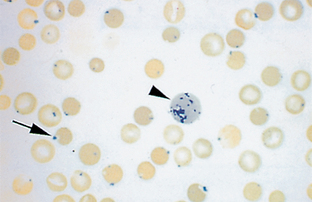
Figure 2-54 Heinz bodies (arrow) on a feline blood film stained with new methylene blue. A reticulocyte (arrowhead) is also present.
Reticulocytes are immature erythrocytes that contain organelles (ribosomes) that are lost as the cell matures (Fig. 2-55). These organelles account for the diffuse blue-gray or polychromatophilic staining of immature cells with Wright’s stain. Romanowsky stain does not stain these cellular components. A supravital stain, such as new methylene blue or brilliant cresyl blue, must be used. Supravital stains contain no fixatives. When reticulocytes are stained with supravital stain, the organelles clump into visible granules referred to as reticulum. This reticulum is present as aggregates or chains of blue granules. The stain must be fresh and should be filtered before use. This will help minimize artifacts such as stain precipitate and bacteria that are present in these supravital stains.
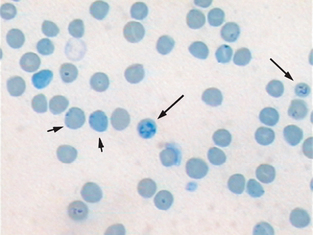
Figure 2-55 Feline blood smear with both punctuate (short arrows) and aggregate reticulocytes (long arrows). (From McCurnin DM, Bassert JM: Clinical Textbook for Veterinary Technicians, ed 6, St. Louis, 2006, Saunders.)
Several methods can be used to prepare reticulocyte smears. Special reticulocyte kits are available, or blood can be stained by placement of a few drops of blood and an equal number of drops of new methylene blue or brilliant cresyl blue stain in a small test tube. The mixture is allowed to stand for approximately 15 minutes. Alternatively, the stain can also be added to a drop of blood directly on a glass slide. The stain and blood should be well mixed and allowed to stand for several minutes before creating the blood film. A drop of the mixture is then used to prepare a conventional air-dried blood film, which can then be examined or counterstained with Wright’s stain. Staining intensity of reticulocytes may be enhanced by placing the prepared reticulocyte slide in 95% methanol for a few seconds followed by 5 seconds in the methylene blue component of Diff-Quick Stain.
Cats, unlike other species, have two morphologic forms of reticulocytes. The aggregate form contains large clumps of reticulum, is similar to reticulocytes in other species, and is the same cell that stains polychromatophilic with Wright’s stain. The punctate form, unique to cats, contains two to eight small, singular, basophilic granules. These cells do not stain polychromatophilic with Wright’s stain. In normal, nonanemic cats, approximately 0.4% of the RBCs are aggregate reticulocytes, whereas 1.5% to 10% of the RBCs are punctate reticulocytes. For a meaningful reticulocyte count in cats, only the aggregate form of reticulocyte should be counted.
A reticulocyte count is an expression of the percentage of RBCs that are reticulocytes. The percentage of reticulocytes per 1000 erythrocytes is determined using the oil-immersion lens. A reticulocyte count should be performed on the blood of all anemic domestic animals except horses, which do not release reticulocytes from the bone marrow even in the face of regenerative anemia. Reticulocyte concentration is useful in assessing the bone marrow’s response to anemia.
Reticulocyte counts should be interpreted according to the degree of anemia because fewer mature erythrocytes are present in anemic animals, and reticulocytes are released earlier and persist longer than in normal animals. Higher percentages may be seen in hemolytic than in hemorrhagic types of anemia. Although reticulocytes are often reported as a percentage, a more useful method is to calculate a corrected reticulocyte count and a reticulocyte production index.
A corrected reticulocyte count is calculated by multiplying the observed reticulocyte percentage by the observed hematocrit/normal hematocrit. For dogs, 45% is used as the normal hematocrit; 35% is used for cats. For example, if a dog has a PCV of 15% and an observed reticulocyte count of 15%, the corrected reticulocyte count is as follows:

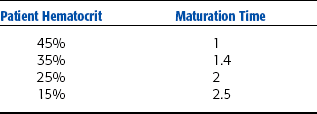
A reticulocyte production index is calculated by dividing the corrected reticulocyte percentage by the maturation time of the reticulocyte for the observed patient’s hematocrit. Maturation time values are based on the patient hematocrit (Table 2-4). For the previous example, if the dog corrected reticulocyte count is 5%, the reticulocyte production index is 5/2.5 = 2.5, indicating that the patient is producing reticulocytes at a rate 2.5 times more quickly than normal.
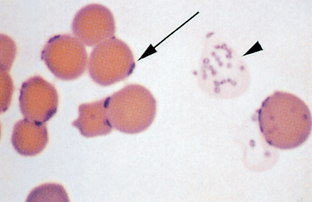
Parasites.: Parasites may be present in or on erythrocytes. Stain precipitate and drying artifacts are sometimes confused with red cell parasites. Drying artifact usually appears refractile (Fig. 2-56). The most commonly seen blood parasites in small animals are Ehrlichia and Haemobartonella. Occasionally a microfilaria of Dirofilaria immitis may be seen on a peripheral blood film (Fig. 2-57).
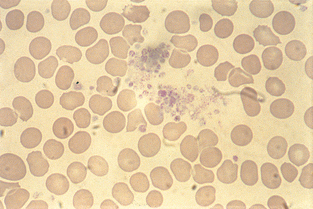
Haemobartonella felis is a fairly common parasite of feline erythrocytes. The disease is referred to as hemobartonellosis, or feline infectious anemia. Recent information derived from DNA sequence analysis has shown that these bacteria are most closely related to the genus Mycoplasma, and many authors now classify the organism as Mycoplasma haemofelis. The organisms appear as small (0.2 to 0.5 μm), coccoid, rod-shaped, or ringlike structures that stain dark purple with Wright’s stain (Fig. 2-58). They most frequently appear as short rods on the periphery of RBCs. The parasitemia is cyclic; if hemobartonellosis is suspected, the blood should be examined several times at different times of the day before the infection is ruled out. Whole blood that has not been in contact with anticoagulant is preferred for examination of suspected hemobartonellosis. The organisms often detach from the surface of the RBC when in anticoagulant. Haemobartonella canis infection is rare in dogs and usually is observed only in splenectomized or immunosuppressed dogs. The organism most commonly appears as a chain of small cocci or rods that stretch across the surface of the erythrocyte. The chains may appear to branch.
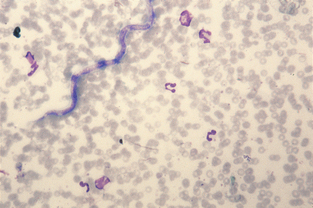
A variety of species of Ehrlichia are capable of infecting dogs. Ehrlichia platys affects only platelets and causes infectious cyclic thrombocytopenia. Other Ehrlichia species may infect any of the leukocytes. Ehrlichia canis commonly infects monocytes and neutrophils (Fig. 2-59). Ehrlichia parasites belong to a group of rickettsial organisms. Nomenclature of the various species has changed significantly in recent years as additional information on the biochemistry of the organisms is uncovered. Many authors refer to some Ehrlichia species as Anaplasma. The organism is transmitted by the brown dog tick and appears as small clusters, called morulae (3 to 6 μm), in the cytoplasm. The disease may result in neutropenia, thrombocytopenia, and anemia. Chronically affected animals may be severely anemic, with marked leukopenia and thrombocytopenia, but sometimes the only hematologic abnormality is lymphocytosis. The total plasma protein level usually is increased. The organisms are best demonstrated during the acute phase but usually are present in small numbers. Films made from the buffy coat may aid diagnosis. However, in most cases organisms are not seen and the diagnosis is made by immunologic testing.
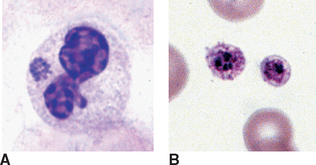
Figure 2-59 A, Ehrlichia equi morula in the cytoplasm of a neutrophil. B, Two platelets containing Ehrlichia platys morulae, (From Harvey JW: Atlas of Veterinary Hematology: Blood and Bone Marrow of Domestic Animals, St. Louis, 2001, Saunders.)
Eperythrozoonosis in swine, cattle, and llamas is quite similar to hemobartonellosis; the organisms are closely related. Eperythrozoa appear as small (0.8 to 1.0 μm) cocci, rods, or rings on the RBC surface or free in the plasma. The ring form is most common (see Fig. 2-49).
Anaplasma marginale is an intracellular blood parasite that causes anaplasmosis in cattle and wild ruminants. It appears as small, dark-staining cocci at the margin of RBCs and must be differentiated from Howell-Jolly bodies because their sizes are similar. Early in the course of the disease as many as 50% of RBCs may contain parasites. By the time the anemia is severe, usually less than 5% of RBCs are affected.
Cytauxzoon felis is a rare cause of hemolytic anemia in cats. The organism appears as small (1.0 to 2.0 μm), irregular ring forms within erythrocytes, lymphocytes, and macrophages.
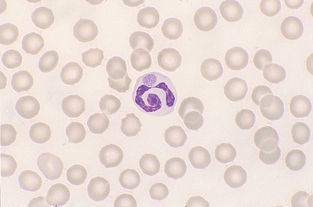
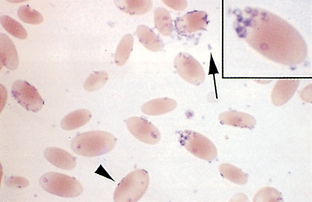
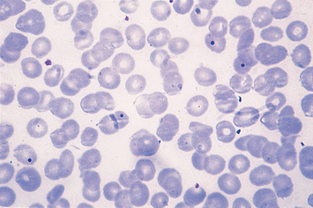
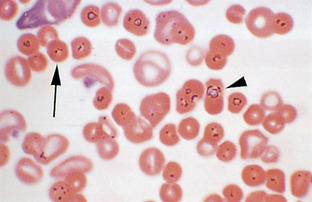
Babesiosis of cattle is caused by Babesia bigemina and B. bovis. The disease is also called Texas fever, redwater fever, and cattle tick fever. Babesia spp. appear as large (3 to 4 μm), pleomorphic, teardrop-shaped intracellular organisms, frequently seen in pairs (Fig. 2-60). Babesiosis in horses (piroplasmosis) is caused by B. equi and B. caballi, which are similar to B. bigemina. Babesiosis is rare in horses, and the few cases reported in the United States have been seen in the South, especially Florida. Babesiosis in dogs is caused by B. canis and B. gibsoni. They are also similar in appearance to B. bigemina, but B. gibsoni is slightly smaller and appears as rings. Only a small percentage of erythrocytes may be affected. The organisms are more commonly observed in RBCs at the feathered edge.
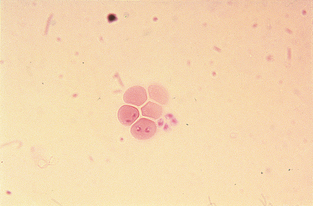
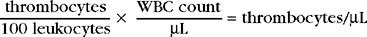
Platelet Estimate: Platelets (thrombocytes) are an important component of hemostasis. One procedure for platelet evaluation is examination of the blood film. When platelet numbers appear decreased, determining platelet concentration by a more quantitative procedure is appropriate. Platelet numbers should be evaluated in the counting area of the blood film. The numbers of platelets in a minimum of 10 microscopic fields should be counted. The size of the oil-immersion field depends on the type of microscope used. With the use of older microscopes, an average of three to five or more platelets per oil-immersion field is considered adequate. When using newer models, 8 to 10 platelets per oil-immersion field are more common in normal patients. Platelet estimates can also be reported as the average number seen in 10 microscopic fields or as the range seen in 10 fields. The presence of an average of seven or range of 7 to 21 platelets is reported as adequate. To get an indirect measure of platelet number, count the number of platelets seen per 100 WBCs on the differential blood film. This number is then used to calculate the platelet estimate with the following equation:
Platelet clumping is common in cats. If clumps are observed (Fig. 2-61), platelets are probably adequate in number. The presence of unusually large platelets (megathrombocytes) (Fig. 2-62), may suggest early release of platelets from the bone marrow and should be noted. Platelets, especially in cats, may be larger than erythrocytes. If decreased platelet numbers are suspected on the basis of the blood film examination, a platelet count is indicated.
Erythrocyte Osmotic Fragility
The osmotic fragility (OF) test provides a measure of the RBC ability to withstand hemolysis in varying concentrations of saline solution. The OF test measures the amount of hemolysis that occurs in varying concentrations of saline solution compared with a normal control. This test may add some useful information in the differentiation among some forms of anemia in the dog and cat. It is not routinely performed in veterinary medicine except at veterinary research and referral centers. OF is commonly measured by the Unopette RBC OF test kit. The kit contains reservoirs with differing concentrations of buffered saline solutions. RBCs that are lysed in the hypertonic solutions release hemoglobin. The amount of hemoglobin released is measure by photometric techniques. The percent hemolysis in each of the saline solutions is calculated. The mean OF is expressed as the concentration of saline in which 50% hemolysis occurs. Although the exact relationship between the OF result and the cell’s ability to survive in vivo is not well characterized, a relationship exists between abnormal OF test results and decreased survival time for red cells. Increased resistance to hemolysis is noted in a variety of conditions that cause an increase in the surface-to-volume ratio of the red cell (e.g., some forms of liver disease, iron deficiency). Reticulocytes are also more resistant to hemolysis because of their greater surface area. Decreased resistance to hemolysis is seen in patients with autoimmune hemolytic anemia and parasitic infections such as haemobartonellosis, babesiosis, and infection with hookworms.
BONE MARROW EVALUATION
Collection of Bone Marrow Samples
Bone marrow evaluation is a valuable tool in diagnosis and prognosis in specific cases. The need for bone marrow evaluation is usually determined by the findings of the differential count from a peripheral blood cell sample. When the differential blood cell count demonstrates ambiguous or unexplained abnormal results, bone marrow evaluation is usually needed to provide sufficient detail for the diagnostician. Specific indications for bone marrow evaluation include persistent, unexplained pancytopenia, neutropenia or thrombocytopenia, and/or nonregenerative anemia. Less-common indications for bone marrow evaluation include the presence of cells with abnormal morphologic features or the unexplained presence of immature cells on the differential blood film (e.g., nucleated RBCs, left shift). Bone marrow evaluation is also used to stage neoplastic disease and diagnose specific parasitic diseases (e.g., leishmaniasis, ehrlichiosis). Bone marrow evaluation may be contraindicated in some cases, particularly when hemostatic defects are present.
Samples may be collected by aspiration or removal of a bone marrow core. Proper restraint is crucial for biopsy of the bone marrow in dogs and cats. Sedation or local anesthesia may be needed when the patient is resistant to manual restraint. General anesthesia may be used but is complicated because patients undergoing bone marrow evaluation are usually compromised and represent a significant anesthetic risk. Aseptic technique is vital throughout the procedure.
All necessary equipment and supplies should be gathered before beginning the procedure. For collection of bone marrow aspirate samples, prepare syringes with EDTA solution by drawing 0.5 ml saline into the syringe and dispensing it into an empty small EDTA blood collection tube. Withdraw the mixture and then repeat the procedure. This creates a diluted EDTA flush to use on the syringe and bone marrow needle. Gather slides and set them on an incline. Usually, about 10 slides should be prepared. Other equipment needed includes a #11 scalpel blade, sterile skin preparation supplies, and suture material (if needed). Special bone marrow needles are preferred, although an 18-gauge hypodermic needle may be used in cats with thin bones. Bone marrow needles have a stylet that serves to prevent occlusion of the needle with bone and surrounding tissue as it is inserted into the marrow cavity. Needle types used for bone marrow collection include the Rosenthal, Illinois sternal, and Jamshidi needles (Fig. 2-63). Bone marrow needles are available as disposable products.
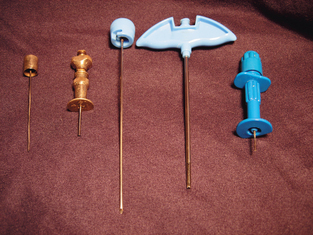
Figure 2-63 Bone marrow needles (left to right): Rosenthal stylet, Rosenthal needle, Jamshidi needle and stylet, Illinois needle.
Aspiration Biopsy
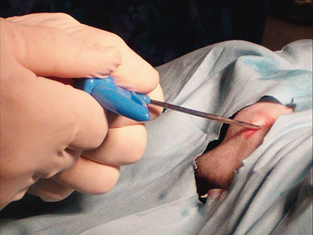
Several sites can be used for an aspiration biopsy, including the head of the humerus, iliac crest, or femoral canal. The most common collection site in cats is the femoral head. The easiest site to localize in dogs is the humeral head. Even in obese dogs and cats this site is easily identified because little overlying muscle or fat is present. The site of entry is the craniolateral side of the proximal humerus, distal to the greater tubercle. An obvious flat surface lies just subcutaneously at the site of entry. The site must be asceptically prepared and draped. A stab incision is made at the site with a sterile scalpel blade, and the needle inserted with the stylet in place (Fig. 2-64). Slight pressure should be placed on the side of the needle against the stylet to avoid blockage of the needle with bony material. A slight caudoventral angle introduces the needle into the head of the humerus. The needle and stylet are then advanced until the cortex of the humerus is reached. The needle is then rotated while slight forward pressure is applied. This allows the needle to penetrate the cortical bone and keeps the needle in place. The stylet is then removed and a syringe is attached. A large syringe (10 ml) is usually preferred to allow for a greater negative pressure. The syringe plunger is rapidly and vigorously withdrawn until blood enters the hub of the needle. Firm restraint is essential at this stage because disruption of nerves in the area may cause momentary discomfort to the animal. As soon as material is present in the hub of the needle, pressure should be released to minimize hemodilution of the sample. Ideally the stylet should be replaced and the needle left in place until smears are prepared to ensure that an adequate sample has been obtained. A small suture may be needed to close the site. Bone marrow aspirate samples clot rapidly, so smears must be made immediately or the sample mixed with 0.5 ml of 2% to 3% EDTA in saline. Even when smears are made immediately, placing a small amount of EDTA in the syringe and needle before beginning the collection procedure may be helpful.
Core Biopsy
In most situations, better-quality samples and greater diagnostic information are obtained if a core sample of marrow is collected in addition to an aspiration biopsy. Always use different sites for each collection when collecting both an aspirate and a core sample. This will ensure that the procedures do not introduce artifact into the next sample. Core samples allow the architecture of the cells to remain intact, although morphologic features of individual cells are more difficult to assess than with an aspiration sample. In addition, some parasites may be visible within macrophages of the bone marrow and will be more easily seen with a core biopsy. Overall cellularity of the marrow is most accurately determined with a core sample because it is not diluted with blood. The procedure is generally the same as for aspiration biopsy, with the following exceptions. The core sample is collected with a 16 to 18 gauge Jamshidi needle. The most commonly used site for collection is the iliac crest. Once the needle is introduced into the cortical bone, it should be moved forward approximately 1 inch and rotated back and forth to cut the piece of bone from the cortex. The needle is then removed and the stylet used to expel the core sample through the proximal (hub) end of the needle. Forcing the sample back through the narrow distal end of the needle introduces pressure artifact into the sample. An impression smear (see Chapter 9) should be made from the sample before placing it in formalin. Never place smears from aspirate samples in proximity to formalin-preserved specimens. Formalin fumes interfere with staining of cytology specimens.
Preparing Marrow Smears
Bone marrow samples must be made immediately if not mixed with EDTA at the time of collection. If EDTA has been used, smears must be made within 1 hour of collection. Marrow smears of aspirate samples can be prepared in a similar manner to peripheral blood. Two to 12 slides are prepared so that additional samples are available if additional testing (e.g. immunofluorescence assay [IFA]), special staining) is needed. Aspiration samples should be pushed out of the hub of the needle by using pressure from the syringe. Bone marrow samples are thicker than blood and should contain particles or spicules. Excess blood and/or EDTA in the sample can be removed by tilting the slide to allow it to run off. Alternatively, the sample can be expelled into a Petri dish and the bone marrow spicules removed with a small plastic pipette or capillary tube.
Line smears, starfish smears, and squash preps (compression smears) can also be used for bone marrow samples. A modified compression technique may provide the most useful sample. The compression prep method has been widely used for many years for preparation of cytology specimens (see Chapter 9). The technique is similar to that used for cover slip preparation of peripheral blood films. Bone marrow smears must be rapidly air dried and stained, usually with a Romanowsky-type stain. Staining time must be increased depending on the cellularity and thickness of the sample. One slide is usually stained with hemosiderin to identify iron particles in the marrow sample. Hematoxylin-eosin stain is preferred for core biopsy samples, although Giemsa stain may also be used. Recent advances in cytochemistry and immunochemistry have also provided a large number of alternative staining techniques. These techniques use methods that can bind with surface molecules unique to specific cell types and have simplified definitive identification of cells in bone marrow.
Evaluation of Bone Marrow Films
A systematic approach should be used when evaluating a bone marrow film. Bone marrow status should never be evaluated without the results of a differential WBC count from a concurrent peripheral blood film. Stained bone marrow smears must first be examined at low power (100×) magnification. This initial examination is used to evaluate the adequacy of the preparation. If the sample is not stained properly or cells are not easily distinguished, another slide should be obtained. Assuming the preparation is adequate, the low power examination can provide an indication of overall cellularity of the bone marrow. In adult animals, normal bone marrow generally contains approximately 50% nucleated cells and 50% fat. Marrow samples from juvenile mammals are usually 25% fat, whereas geriatric animals usually have marrow consisting of approximately 75% fat. The marrow sample is described as acellular (aplasia), hypercellular (hyperplasia), or hypocellular (hypoplasia) on the basis of the proportion of nucleated cells versus fat present. Although the adipocytes are dissolved during fixation of samples, the marrow contains what appear to be large vacuoles, representing the ruptured adipocytes. Samples are then further characterized by describing the type of cells present (e.g., hypoplasia/myeloid). Neoplasia is a possibility if all the cells look alike. A systematic approach to bone marrow evaluation is summarized in Procedure 2-3.
Cells in Bone Marrow
Once overall cellularity is determined, the sample is examined at higher magnification (400× to 450×) to determine the relative percentages of erythroid and myeloid cells. One method requires counting and classifying 500 cells. Myeloid cells are relatively large and pale-staining cells, whereas erythroid cells are smaller and have clumped basophilic nuclei. Cells of the erythroid series include the rubriblast, prorubricyte, rubricyte, and metarubricyte. The rubriblast contains a nucleolus and a small amount of basophilic cytoplasm. Prorubricytes are smaller than rubriblasts, with a slightly more condensed nucleus and intensely blue cytoplasm. Cells in the rubricyte stage initially have basophilic cytoplasm and moderate clumping of the nucleus. As the cell matures, the morphologic characteristics of rubricytes are distinguished by marked nuclear clumping and pink cytoplasm because of the incorporation of hemoglobin. Metarubricytes are the smallest cells in the erythroid series and have a condensed nucleus and deep red cytoplasm. Cells in the myeloid series include the myeloblast, promyelocyte, myelocyte, and metamyelocyte. Myeloblasts are larger than rubriblasts and have a prominent nucleolus and pale blue cytoplasm. A few reddish granules may be evident in the cytoplasm. The promyelocyte is a large, pale-staining cell with prominent reddish cytoplasmic granules. Myelocytes are smaller cells with a round nucleus. Granules characteristic of the mature neutrophil, eosinophil, and basophil begin to appear during the myelocyte stage. The metamyelocyte is similar in appearance to the myelocyte except that the nucleus is indented. Band cells are also present in bone marrow and have a horseshoe-shaped nucleus with parallel sides. Mature, segmented neutrophils, eosinophils, and basophils are also present in small numbers (Fig. 2-65).
Figure 2-65 Maturation of myeloid and erythroid cells. (Drawing by Dr. Perry Bain. From Meyer DJ, Harvey JW: Veterinary Laboratory Medicine: Interpretation and Diagnosis, ed 3, St. Louis, 2004, Saunders.)
Rubricytes and metarubricytes usually comprise 80% to 90% of the erythroid cells. Metamyelocytes, bands, and segmented myeloid cells comprise approximately 80% to 90% of the myeloid cells. The ratio of myeloid cells to erythroid cells (M/E ratio) is determined by counting 500 nucleated cells and classifying them as erythroid or myeloid. Normal M/E ratios should be between 0.75:1.0 and 2.0:1.0. Normal values for differential counting of bone marrow cells vary considerably among different species. Because the complete differential count of a marrow smear is time-consuming, several modifications to the differential cell count are used. Some laboratories use a system that classifies cells into one of eight categories: immature myeloid, mature myeloid, immature erythroid, mature erythroid, eosinophilic, monocytoid, lymphocytic, and plasma cells. In this classification scheme, immature cells include the myeloblasts, promyelocytes, rubriblasts, and prorubricytes. Several alternate systems for evaluation of bone marrow cells are used. One system involves classifying cells into groups and then calculating an erythroid maturation index and myeloid maturation index. An additional system is used that calculates a left shit index for both myeloid and erythroid cell lines. The erythroid left shift index involves counting and classifying 200 cells as either immature (rubriblasts, prorubricytes, and early rubricytes) or mature (late rubricytes and metarubricytes) and dividing the percentage of immature by mature erythroid cells. The myeloid left shift index is calculated by dividing the percentage of all immature granulocytes (myeloblast through band cell) by the percentage of mature granulocytes in a 200–cell count differential.
Megakaryocytes are not evenly distributed in a bone marrow aspirate. They are very large cells containing multiple fused nuclei and are often seen in clusters, particularly at the edges of the slide (Fig. 2-66). Megakaryocytes may number 8 to 10 per low power field, although 2 to 3 per low power field is more common. Generally, more than 10 per low power field would indicate an increase in this cell line.
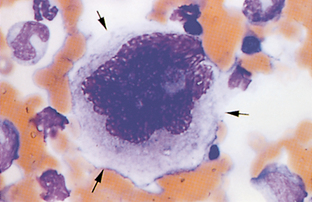
Other cell types present in bone marrow samples include macrophages, lymphocytes, plasma cells, mast cells, osteoblasts, and osteoclasts. Osteoblasts appear similar to plasma cells except that they are much larger and contain paler-appearing nuclear material. They also tend to be found in clusters when seen in samples collected by aspirate techniques. Plasma cells are slightly larger than lymphocytes with a greater nucleus-to-cytoplasm ratio. Plasma cells often have a perinuclear clear area around the eccentrically located nucleus and distinctly basophilic cytoplasm (Fig. 2-67). Inclusions containing immunoglobulin are often present. These inclusions are commonly referred to as Russell bodies and the cell referred to as a Mott cell. Osteoclasts contain multiple nuclei and may appear somewhat fused and similar in appearance to megakaryocytes except that the megakaryocyte nucleus is multilobed. Osteoclasts are seen most often in samples from young, actively growing animals. The cytoplasm is blue and may contain granular material of variable sizes that stains a deep red. Macrophages in bone marrow samples often contain phagocytized material that may aid in diagnosis. In core biopsy samples, macrophages are seen in the center of clusters of erythropoietic areas. These erythropoietic “islands” are usually disrupted during aspiration biopsy. Lymphocytes are produced in the bone marrow but are usually present in low numbers. Immature stages (lymphoblasts and prolymphocytes) are difficult to distinguish from rubriblasts and prorubricytes. Reactive lymphocytes and normal, mature lymphocytes may also be present and appear as they would if seen in peripheral blood samples. Mast cells are characterized by abundant, small, metachromatic cytoplasmic granules (Fig. 2-68).
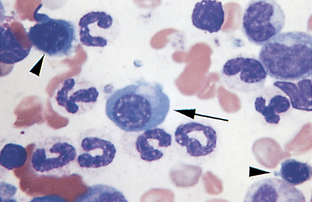
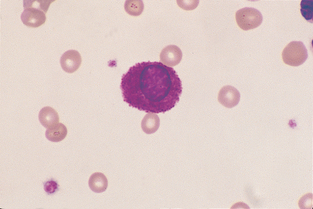
Figure 2-68 A mast cell in a feline blood film. (From Cowell RL, Tyler RD, and Meinkoth JH: Diagnostic Cytology and Hematology of the Dog and Cat, ed 2, St. Louis, 1999, Mosby.)
Hemosiderin is present in macrophages in bone marrow and is also found free of cells. It is easily identifiable as small gray to black granules when traditional blood film stains are used. Prussian blue stain may also be used to demonstrate the presence of this iron store. Hemosiderin is almost always absent in bone marrow preparations from cats. A decrease or absence of hemosiderin is significant in most other species.
Reporting of Results
Results of bone marrow evaluation include at minimum the overall cellularity and either M/E ratio, maturation index, or left shift index. If a complete differential count of marrow cells is not possible, the sample is usually described in narrative form and any unique patterns or morphologic abnormalities described. When present, stainable iron (hemosiderin), increased presence of mitotic figures, increased presence of osteoblasts, osteoclasts, mast cells, presence of phagocytized material, and metastatic cells from other organs should also be recorded. The data are then reported along with the concurrent differential count from a peripheral blood film.
Disorders of Bone Marrow
Abnormalities seen in bone marrow samples can be classified as changes in cell numbers or in cell morphologic features and maturation. Samples can be characterized as either increased or decreased cellularity of all cell types, or increased or decreased cellularity of one cell type. In addition, abnormal hematopoiesis when cellularity is normal can also occur. A glossary of terms used to describe these abnormalities is presented in Table 2-5.
TABLE 2-5
Terminology of Bone Marrow Aspirate
| Term | Definition |
| Aplasia | Less than 25% myeloid cells |
| Basophilic hyperplasia | Basophilia in bone marrow and peripheral blood |
| Dyserythropoiesis | Abnormal erythrocyte morphology |
| Dysgranulopoiesis (Dysmyelopoiesis) | Abnormal granulocyte morphology |
| Dysmegakaryopoiesis (Dysthrombopoiesis) | Increased megakaryocytes in bone marrow with thrombocytopenia |
| Emperipolesis | Presence of intact, viable blood cells within the cytoplasm of megakaryocytes |
| Eosinophilic hyperplasia | Eosinophilia in bone marrow and peripheral blood |
| Erythroid hyperplasia | Normal or increased cellularity with normal or increased absolute neutrophil count |
| Erythroid hypoplasia | Normal or decreased cellularity with normal or decreased absolute neutrophil count |
| Granulocytic hyperplasia | Normal or increased cellularity with normal or increased PCV and high M/E ratio |
| Hyperostosis | Thickening of cortical bone |
| Hypocellular | Decrease in overall cellularity |
| Megakaryocytic hyperplasia | Increase in numbers of megakaryocytes in bone marrow |
| Monocytic hyperplasia | Increased presence of precursors cells of the monocyte series |
| Myelodysplasia | Atypical cells with less than 30% blast cells present |
| Myelofibrosis | Increased presence of fibrous tissue that displaces hematopoietic tissue |
| Neoplasia | Atypical cells with greater than 30% blast cells present |
| Neutrophilic hyperplasia, effective | Neutrophilia in bone marrow and peripheral blood |
| Neutrophilic hyperplasia, ineffective | Neutrophilia in bone marrow concurrent with neutropenia in peripheral blood |
| Osteosclerosis | Thickening of the trabecular bone |
| Reactive macrophage hyperplasia | Increased presence of active macrophages, often containing phagocytized material |
Inflammatory conditions may also be evident on examination of a bone marrow aspirate. These conditions are classified according to the primary cell type(s) present as one of four types: fibrinous, chronic, chronic granulomatous, and chronic pyogranulomatous. Fibrinous inflammation typically involves infiltration of the bone marrow with fibrin exudate without the presence of inflammatory cells. Chronic inflammation is a hyperplastic condition characterized by increased numbers of plasma cells, mature lymphocytes, and/or mast cells. Chronic granulomatous inflammation is characterized by increased numbers of macrophages. If both macrophages and neutrophils are present, the condition is described as pyogranulomatous.
Neoplasia
Neoplastic disorders of hematopoiesis are classified as either lymphoproliferative or myeloproliferative. The common term used to describe the presence of neoplastic blood cells in bone marrow and peripheral blood is leukemia. When blast cells comprise more than 30% of marrow cells, the condition is often described as acute. Chronic forms of leukemia are characterized by the presence of more mature cells (fewer than 30% blast cells) that have neoplastic characteristics in blood and bone marrow. Chronic myeloid leukemia can develop into a condition called myelofibrosis. In this condition, much of the bone marrow is replaced by scar tissue incapable of producing blood cells.
Myeloproliferative disease is a progressive leukemic disorder that can be of the following types: acute myeloid leukemia, chronic granulocytic leukemia, chronic eosinophilic leukemia, chronic basophilic leukemia, chronic myelomonocytic leukemia, essential thrombocythemia, or primary erythrocytosis (polycythemia vera). Acute myeloid leukemia is further classified according to the types of cells and their relative differentiation as one of nine subtypes (Table 2-6). The classification involves determination of the percentage of nucleated cells and the degree of differentiation, or commitment toward development into a specific cell type. Forms of chronic myeloid leukemia are less common than acute myeloid leukemia. They are classified according to the primary cell type involved and are often accompanied by a left shift. Essential thrombocythemia is extremely rare. This chronic condition is characterized by significant increases in platelet count and marked increases in megakaryoblasts and megakaryocytes in the bone marrow. Primary erythrocytosis is unique in that the maturation patterns and mature cells produced appear normal, although their numbers are greatly increased. This disorder is thought to result from mutation of erythroid stem cells that causes the cells to be hyperresponsive to EPO or capable of proliferation independent of EPO concentration.
TABLE 2-6
Classification of Acute Myeloid Leukemias
| Traditional Terminology | Subtype | Characteristics |
| Reticuloendotheliosis | AML-AUL | Predominance of undifferentiated blast cells |
| Granulocytic leukemia | AML-M1 | Myeloblastic leukemia with differentiation to the granulocytic series |
| Granulocytic leukemia | AML-M2 | Myeloblastic leukemia with neutrophilic differentiation |
| Myelomonocytic leukemia | AML-M4 | Combination of myeloblasts and monoblasts |
| Monocytic leukemia | AML-M5a | Monocytic leukemia with >80% monoblasts and promonocytes |
| Monocytic leukemia | AML-M5b | Monocytic leukemia with 30%-80% monoblasts and promonocytes |
| Erythroleukemia | AML-M6 | Combination of myeloblasts and rubriblasts |
| Erythremic myelosis | AML-M6Er | Erythroid leukemia |
| Megakaryoblastic leukemia | AML-M7 | Increased megakaryoblasts in peripheral blood and bone marrow |
Lymphoproliferative disease, or lymphocytic leukemia, comprises nearly 10% of hematopoietic tumors diagnosed in dogs. Lymphoproliferative disorders include acute lymphocytic leukemia, chronic lymphocytic leukemia, and plasma cell myeloma. Increased numbers of plasma cells seen in bone marrow samples are also referred to as multiple myeloma. Acute lymphocytic leukemia is characterized by the presence of lymphoblasts and/or prolymphocytes in blood and/or bone marrow. Chronic lymphocytic leukemia is characterized by the presence of greater than 30% mature lymphocytes in the bone marrow. Leukemia can also arise from other cell lines, causing myelogenous or monocytic disease. Primary bone tumors are those that originate in the bone. The most common type of primary bone tumor is osteosarcoma. Osteosarcoma arises from osteoblasts and can spread rapidly to other parts of the body. Malignant histiocytosis is a malignant condition characterized by increased proliferation of neoplastic macrophages. Erythrophagocytosis may be seen with this condition. Mast cell leukemia is seen in dogs and cats, although it is not common.
Classification of Anemia
The function of RBCs, or erythrocytes, is to transport and protect hemoglobin, the oxygen-carrying pigment. Daily production of erythrocytes equals the daily loss from destruction of aged cells in a healthy animal. If RBC production is decreased or destruction and/or loss is increased, anemia results. Anemia is a condition of reduced oxygen carrying capacity of erythrocytes. It may result from a reduced number of circulating RBCs, reduced PCV, or a reduced concentration of hemoglobin. Anemia may be classified according to bone marrow response as either regenerative or nonregenerative or according to RBC size and hemoglobin concentration (MCV, MCHC).
Classification by Bone Marrow Response
This classification is most clinically applicable because it distinguishes between regenerative and nonregenerative anemia. In regenerative anemia, the bone marrow responds to anemia by increasing erythrocyte production and releasing immature erythrocytes. These immature RBCs, that is, polychromatophilic RBCs or reticulocytes, can be observed on the blood film and indicate that the marrow is responsive. The ability of bone marrow to respond indicates that the cause of the anemia is probably either blood loss (hemorrhage) or blood destruction (hemolysis). In nonregenerative anemia, the bone marrow is unable to respond to the anemic state and reticulocytes are absent on blood films, suggesting bone marrow dysfunction. A bone marrow aspiration biopsy is then indicated once common endocrine and metabolic causes of nonregenerative anemia are excluded.
Classification by RBC Size and Hemoglobin Concentration
Anemia can be classified as normocytic (RBCs of normal size), macrocytic (RBCs larger than normal), or microcytic (RBCs smaller than normal). Normocytic anemia is characterized by RBCs of normal size and is secondary to a variety of chronic disorders. In domestic animals, the most common cause of macrocytic anemia is the transitory increase in RBC size seen with regenerative anemia (reticulocytosis). In human beings, macrocytic anemia is frequently associated with vitamin B12 and folic acid deficiencies. These conditions are rarely, if ever, seen in domestic animals.
Microcytic anemia is almost always the result of iron deficiency. Division of immature erythrocytes stops when a critical concentration of hemoglobin is reached. With inadequate iron for hemoglobin synthesis, extra division may occur, resulting in smaller erythrocytes. Although chronic blood loss is the most common cause of iron deficiency in adult animals, inadequate dietary iron results in iron-deficiency anemia in young nursing animals such as kittens and baby pigs.
Anemia may be hypochromic (reduced hemoglobin concentration) or normochromic (normal hemoglobin concentration). A hyperchromic state is not possible. Newly released polychromatophilic erythrocytes (reticulocytes) are hypochromic because the full concentration of hemoglobin is not yet attained. Macrocytic hypochromic anemia suggests regeneration. Iron deficiency also results in hypochromic anemia but is also characterized by microcytosis. Most other types of anemia are normochromic.
EVALUATION OF COAGULATION
Hemostasis is the ability of the body’s systems to maintain the integrity of the blood and blood vessels. It involves a number of complex pathways, platelets, and coagulation factors. Any alteration in these parameters can result in a bleeding disorder. Coagulation of blood proceeds through a mechanical phase and a chemical phase. The mechanical phase is initiated when a blood vessel is ruptured or torn. The exposed blood vessel subendothelium is a charged surface, and platelets are attracted to this surface. As platelets congregate at the site, they undergo morphologic and physiologic changes. These changes cause the platelets to adhere to each other as well as the blood vessel endothelium. This also causes platelets to release the initiating factor for the chemical phase of hemostasis. The chemical phase is referred to as the coagulation cascade and involves a number of coagulation factors (Table 2-7). Each factor participates in a chemical reaction that serves to initiate the next reaction in the pathway. The end result of the coagulation cascade is the formation of a mesh of fibrin strands that forms the clot. The final phase of hemostasis involves degradation of the fibrin clot.
TABLE 2-7
| Designation | Synonym |
| Factor I | Fibrinogen |
| Factor II | Prothrombin |
| Factor III | Tissue thromboplastin |
| Factor IV | Calcium |
| Factor V | Proaccelerin |
| Factor VI | Proconvertin |
| Factor VII | Antihemophilic factor |
| Factor VIII | Christmas factor, plasma thromboplastin |
| Factor IX | Smart-Prower factor |
| Factor X | Plasma thromboplastin antecedent |
| Factor XI | Hageman factor |
| Factor XII | Fibrin-stabilizing factor |
Reprinted from Sirois M: Veterinary clinical laboratory procedures, St Louis, 1995, Mosby.
Various coagulation tests have been developed to evaluate specific portions of the hemostatic mechanisms. Some tests measure just the mechanical phase of hemostasis. Others can measure specific parts of the chemical phase. All patients should be evaluated for coagulation defects before undergoing surgery. Most coagulation tests can be completed with minimal time and equipment and are relatively inexpensive. Figure 2-69 summarizes the chemical phase of the blood coagulation process.
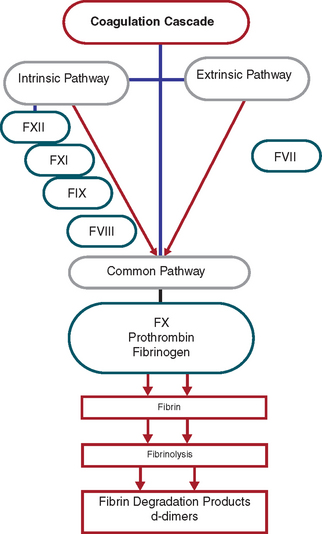
Coagulation Tests
Blood samples for coagulation tests should be collected carefully, with minimal tissue damage and minimal venous stasis. Samples should never be collected through indwelling catheters. The preferred anticoagulant for coagulation tests is sodium citrate. Samples for whole blood clotting time and activated coagulation time do not require an anticoagulant.
Platelet Counting Methods
Platelets counts are best performed by manual methods (e.g., Unopette 5855). Some automated analyzers also perform platelet counts. If a coagulation disorder is suspected, a manual platelet count should be performed because automated counts can be highly inaccurate as a result of platelet clumping and platelet/RBC overlap. Always use a freshly collected blood sample to perform manual platelet counts. Morphologic changes in platelets include aggregation and giant platelets. These abnormalities will not be evident with automated analyzers and must therefore be detected using the differential blood film.
The procedure is similar to counting WBCs. A 20-μl pipette is used with 1% ammonium oxalate as a diluent. The ammonium oxalate hemolyzes the RBCs but preserves the WBCs and platelets. The platelets are counted at 400× magnification in the 25 small squares located in the large center square of the grid. The number of platelets counted is then multiplied by 1000 to calculate the number of platelets per μl of blood. Counting platelets is especially difficult because of their small size and tendency to clump together. Platelets are counted after the WBCs because it takes approximately 10 minutes for the platelets to settle within the hemacytometer counting chamber. The hemacytometer should be placed in a moist chamber while the platelets settle to avoid dehydration of the sample. An inverted petri dish containing damp paper towels may be used for this purpose.
Activated Clotting Time
This test can evaluate every clinically significant clotting factor except factor VII. The test requires a Vacutainer tube that contains diatomaceous earth. The diatomaceous earth causes the activation of the coagulation pathways. The tube must be prewarmed in a 37° C (98.6° F) water bath or heat block. Venipuncture is performed and 2 ml of blood is collected directly into the tube. A timer is started as soon as the blood enters the tube. The tube is mixed once by gentle inversion and placed in a 37° C incubator or water bath. The tube is observed at 60 seconds and then at 5-second intervals for the presence of a clot. Normal values are approximately 60 to 90 seconds. Severe thrombocytopenia (fewer than 10,000 platelets/μl) and abnormalities associated with the intrinsic coagulation cascade prolong the activated clotting time.
Whole Blood Clotting Time
The whole blood clotting time (Lee-White method) is a test of the intrinsic clotting mechanism. The whole blood clotting time tests are not commonly performed because the activated clotting time is more sensitive. The test is performed by collecting 3 ml of blood in a plastic syringe, noting the time blood first appears in the syringe (by using a stopwatch). Immediately place 1 ml of blood in each of three 10- × 75-mm tubes that have been rinsed with saline. The tubes are then placed in a 37° C (98.6° F) water bath. The first and then the second tubes are tilted at 30-second intervals until coagulation occurs. The third tube is tilted in a similar manner. The time elapsed between the appearance of blood in the syringe and clot formation in the third tube is the clotting time. The normal whole blood clotting time for dogs is 2 to 10 minutes, horses 4 to 15 minutes, and cattle 10 to 15 minutes.
Buccal Mucosa Bleeding Time
This is a primary assay for the detection of abnormalities in platelet function. The test requires a Simplate I or II (Organon Teknika, Durham, NC) spring-loaded lancet, blotting paper or filter paper, stopwatch, and tourniquet. The patient should be anesthetized and placed in lateral recumbency. A strip of gauze is used to tie the upper lip back to expose the mucosal surface and act as a tourniquet. A 1-mm-deep incision is made with the Simplate device. Standard blotting paper or filter paper is used to blot the incision site (Fig. 2-70). This is done by lightly touching the paper to the drop of blood and allowing the blood to be absorbed without touching the incision. Blotting is repeated every 5 seconds until bleeding has stopped. The normal bleeding time for domestic animals is 1 to 5 minutes. A prolonged bleeding time occurs with most platelet dysfunction syndromes. It will also be prolonged in thrombocytopenia, so a platelet count must also be performed.
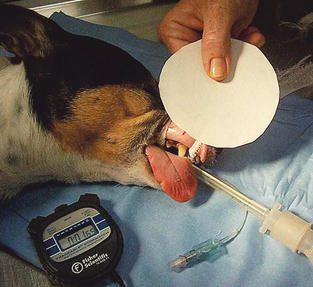
Clot Retraction Test
This procedure allows the evaluation of platelet number and function and intrinsic and extrinsic pathways. Blood is drawn into a plain sterile tube and incubated at 37° C. The tube is examined at 60 minutes and reexamined periodically over a 24-hour period. A clot should be evident in 60 minutes, retracted in approximately 4 hours, and markedly compact at 24 hours.
Fibrinogen Determination
Automated methods for fibrinogen determination involve photometric analysis. These are not commonly performed in veterinary practice. One manual method that may be used for fibrinogen determination involves the use of two hematocrit tubes. The tubes are centrifuged as for a PCV and the total solids on one tube are determined, usually with a refractometer. The second tube is then incubated at 58° C for 3 minutes. The second tube is recentrifuged and the total solids measured. Multiply the total solids in grams per deciliter by 1000 to obtain the concentration in milligrams per deciliter. Fibrinogen is then calculated by the following equation (with all values in milligrams per deciliter):
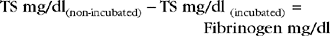
One-Stage Prothrombin Time (OSPT) Test
Prothrombin tests are usually performed by automated analyzers. This test evaluates the extrinsic coagulation pathway. The test uses a citrated plasma sample to which tissue thromboplastin reagent is added. A reagent designed to recalcify the sample is then added. Under normal conditions, a clot should form within 6 to 20 seconds. The normal range for dogs is 7 to 10 seconds. A prolonged OSPT may be associated with severe liver disease, DIC, or hereditary or acquired deficiencies of any factors of the extrinsic coagulation cascade. The test is sensitive to vitamin K deficiency or antagonism, such as warfarin toxicity.
Activated Partial Thromboplastin Time (APTT)
The activated partial thromboplastin time is another test of the intrinsic clotting mechanism. Some methods require multiple reagents. The SCA 2000 (Synbiotics Corporation, San Diego, CA.) is a handheld analyzer that performs both the prothrombin time and activated partial thromboplastin time (Fig. 2-71). Citrated plasma is incubated with an activator of factor XII, platelet substitute (cephaloplastin). After addition of calcium, the time to form fibrin is determined. A variety of acquired and hereditary disorders, in addition to administration of heparin, can reduce one or more factors necessary for the normal intrinsic coagulation cascade.
PIVKA
The acronym PIVKA refers to proteins induced (invoked) by vitamin K absence. Vitamin K is required to activate coagulation factors II, VII, IX, and X. When vitamin K is deficient, precursor proteins of factors II, VII, IX, and X build up and can be detected by PIVKA or Thrombotest (Axis-Shield PoC Norton, MA). The test can differentiate rodenticide toxicity from primary hemophilia when activated clotting time is prolonged. It is a more sensitive test than prothrombin when time these factors are depleted. PIVKA may become prolonged within 6 hours of ingestion of anticoagulant rodenticides, whereas prothrombin time prolongs within 24 hours and activated partial thromboplastin time within 48 hours.
d-Dimer and Fibrin Degradation Products
Both of these tests are used to evaluate tertiary hemostasis. d-Dimers and fibrin degradation products (or fibrin split products) are formed as a clot is degraded. These tests are therefore useful in identifying the presence of DIC and also provide diagnostic information in cases of liver failure, trauma, and hemangiosarcoma. A canine in-house test is available for d-Dimer analysis.
HEMOSTATIC DEFECTS
Bleeding disorders may be caused by congenital or acquired defects in coagulation proteins, platelets, or the vasculature. Most bleeding disorders found in veterinary species are secondary to some other disease process. Primary coagulation disorders are rare and are usually the result of an inherited defect in production of coagulation factors. Signs of congenital or acquired deficiencies in coagulation proteins usually involve delayed deep tissue hemorrhage and hematoma formation. Clinical signs associated with congenital or acquired defects or deficiencies of platelets include superficial petechial and ecchymotic hemorrhages, epistaxis, melena, and prolonged bleeding at injection and incision sites. With functional defects or deficiencies in concentration of coagulation proteins, clinical signs usually appear before the animal reaches 6 months of age. The majority of congenital coagulation factor disorders in veterinary species involve a deficiency or abnormality of a single factor.
The most common inherited coagulation disorder of domestic animals is von Willebrand’s disease, which is the result of decreased or deficient production of von Willebrand’s factor. Von Willebrand’s factor circulates with Factor VIII and functions to aid platelet aggregation at the initiation of the coagulation pathways. The disease occurs with relative frequency in Dobermans and has been reported in other canine breeds, as well as rabbits and swine. Several distinct forms of the disease have been identified on the basis of their patterns of inheritance. Other common inherited coagulation factor disorders of veterinary species are listed in Table 2-8.
TABLE 2-8
Common Inherited Coagulation Disorders of Dogs
| Disorder | Breeds Affected |
| Prothrombin deficiency | Cocker spaniel, beagle |
| Factor VII deficiency | Beagle, malamute |
| Factor VIII deficiency (hemophilia A) | Many breeds |
| Factor IX deficiency (hemophilia B) | Many breeds |
| Factor X deficiency | Cocker spaniel |
| Factor XI deficiency | Great Pyrenees, English Springer spaniel |
| Factor XII deficiency | Poodle, Shar Pei |
Secondary coagulation disorders can result from decreased production or increased destruction of platelets, as well as nutritional deficiencies, liver disease, and ingestion of certain medications or toxic substances. Thrombocytopenia refers to a decreased number of platelets and is the most common coagulation disorder seen in small animal veterinary practice. The causes of platelet deficiencies are often unknown. However, infection with certain bacterial, viral, and parasitic agents can result in thrombocytopenia. Thrombocytopenia can also occur as a result of bone marrow depression that reduces the production of platelets or autoimmune disease that increases the rate of platelet destruction. Because the liver is the site of production of most coagulation factors, any condition that affects liver function can result in a coagulation disorder. Ingestion of toxic substances such as warfarin can also create bleeding disorders. Warfarin inhibits vitamin K function. Because vitamin K is required for synthesis and activation of some coagulation factors, this can create a deficiency in several necessary components of the coagulation cascade. Ingestion of medications such as aspirin can also cause bleeding disorders.
Disseminated Intravascular Coagulation
Although not a disease entity on its own, DIC is associated with many pathologic conditions. DIC is often seen in trauma cases, as well as in a large number of infectious diseases. A large number of events can trigger DIC. The resulting hemostatic disorder may manifest as systemic hemorrhage or microvascular thrombosis. Because the triggering event and the resulting disorder are diverse, the laboratory findings are highly variable. Most patients with DIC have prolonged activated partial thromboplastin time and elevated fibrinogen, as well as significant thrombocytopenia.
Recommended Reading
Cowell, R, Tyler, R, Meinkoth, J. Diagnostic cytology and hematology of the dog and cat, ed 2. St Louis: Mosby, 1999.
Meyer, DJ, Harvey, JW. Veterinary laboratory medicine: interpretation and diagnosis. St Louis: Saunders, 2004.
Sirois, M. Hematology and hemostasis. In: Sirois M, ed. Principles and practice of veterinary technology. St Louis: Mosby, 2004.
Thrall, MA, Baker, DC, Lassen, ED. Veterinary hematology and clinical chemistry. Philadelphia: Lippincott Williams & Wilkins, 2004.