Chapter 19 Ultrasonography
Understanding the Principles and Recognizing Normal and Abnormal Findings
 Ultrasound (US) occupies an acoustical frequency on the electromagnetic spectrum that is hundreds of times greater than humans can hear. Ultrasonography is the medical imaging modality that utilizes that acoustical energy to localize and characterize human tissues.
How it Works
The creation of a sonographic image (sonogram) depends on three major components: the production of a high frequency sound wave, the reception of a reflected wave or echo, and the conversion of that echo into the actual image. The sound wave is produced by a probe that contains one of more transducers, which send out extremely short bursts of acoustical energy at a given frequency.
Like all sound waves, the pulses produced by the transducer travel at different speeds depending on the density of the medium through which they are traveling. Where the wave strikes an interface between tissues of differing densities, some of the sound will be transmitted forward while some will be reflected back to the transducer.
 How much sound is transmitted versus how much is reflected is a property of the tissues that make up the interface and is called the acoustical impedance. Large differences in acoustical impedance will result in greater sound reflection; small differences will result in greater transmission.
If the pulse encounters fluid, most of the acoustical energy is transmitted. If the pulse encounters gas or bone, so much of the acoustical energy is reflected back that it is usually not possible to define deeper structures. When the echo arrives back at the transducer (a matter of microseconds), it is converted from sound into electrical pulses that are then sent to the scanner itself. Using an on-board computer, the scanner determines the length of time it took for the echo to be received, the frequency of the reflected echo, and the magnitude or amplitude of the signal. With this information, a sonographic image of the scanned body part can be generated by the computer and recorded digitally, on film, or sometimes on videotape. A tissue that reflects many echoes is said to be echogenic (hyperechoic) and is usually depicted as bright or white on the sonogram; a tissue that has few or no echoes is said to be sonolucent (hypoechoic or anechoic) and is usually depicted as being dark or black.
Images can be produced in any plane by adjusting the direction of the probe. By convention, two common imaging planes utilized are those along the long axis of the body or body part being scanned, called the sagittal or longitudinal plane, or perpendicular to the long axis of the body or body part being scanned, called the transverse plane.
Also by convention, sonographic images are viewed with the patient’s head to your left and the patient’s feet toward your right; anterior is up and posterior is down.TABLE 19-1 TYPES OF ULTRASOUND
| A-Mode | Simplest; spikes along a line represent the signal amplitude at a certain depth; used mainly in ophthalmology. |
| B-Mode | Mode most often used in diagnostic imaging; each echo is depicted as a dot and the sonogram is made up of thousands of these dots; can depict real-time motion. |
| M-Mode | Used to show moving structures such as blood flow or motion of the heart valves. |
| Doppler | Uses the Doppler effect to assess blood flow; used for vascular ultrasound. Pulsed Doppler devices emit short bursts of energy that allow for an accurate localization of the echo source and has replaced continuous wave Doppler. |
| Duplex ultrasonography | Utilized in vascular studies; refers to the simultaneous use of both gray-scale or color Doppler to visualize the structure of and flow within a vessel and spectral waveform Doppler to quantitate flow. |
Doppler Ultrasonography
You are probably familiar with the common examples of a passing train whistle or police siren as illustrations of the Doppler effect, which generally states that sound changes in frequency as the object producing the sound approaches or recedes from your ear. Sonography makes use of the Doppler effect to determine if an object, usually blood, is moving toward or away from the transducer and at what velocity it is moving.
The direction of flow of blood is represented sonographically by the colors red and blue. By convention, red indicates flow toward and blue indicates flow away from the transducer.
Adverse Effects and Safety Issues
The procedure is well tolerated. Scans can be obtained quickly, done at the bedside if necessary, and, for the most part, require no patient preparation other than eating no food before abdominal studies (Table 19-2). Ultrasound has the short-term potential to cause minor elevation of heat in the area being scanned, though not at levels used in diagnosis.
TABLE 19-2 ADVANTAGES AND DISADVANTAGES OF ULTRASONOGRAPHY
| Advantages | Disadvantages |
|---|---|
| No ionizing radiation No known long-term side effects “Real-time” images Produces little or no patient discomfort Small, portable, inexpensive, ubiquitous |
Difficulty penetrating through bone Gas-filled structures reduce its utility Obese patients may be difficult to penetrate Dependent on the skills of the operator scanning |
There are no known long-term side effects that have been scientifically demonstrated from the use of medical ultrasound in humans. Nevertheless, like all medical procedures, it should be utilized only when medically necessary. The U.S. Food and Drug Administration warns against the use of ultrasound during pregnancy to produce “keepsake photos or videos.”
Medical Uses of Ultrasonography
Ultrasound is widely used in medical imaging. It is usually the study of first choice in imaging the female pelvis and in pediatric patients, in differentiating cystic versus solid lesions in all patients, in noninvasive vascular imaging, imaging of the fetus and placenta during pregnancy, and in real-time, image-guided fluid aspiration and biopsies. Other common uses are evaluation of cystic versus solid breast masses, thyroid nodules, tendons, and in assessing the brain, hips, and spine in newborns. Ultrasound is used everywhere from intraoperative scanning in the surgical suite to the medical unit in the battlefield and in locations as remote as the South Pole.Biliary System
Ultrasound is the study of first choice for abnormalities of the biliary system. Patients who present with the relatively common complaint of right upper quadrant pain usually undergo an ultrasound examination first. CT may be helpful in cases with difficult or unusual anatomy, for detecting masses, or in determining the extent of disease already diagnosed, but CT is less sensitive than ultrasound in detecting gallstones.Normal Ultrasound Anatomy
The gallbladder is an elliptical sac that lies inferior and medial to the right lobe of the liver. Although different layers of its wall have different echogenic properties, the gallbladder overall consists of a fluid-filled sonolucent lumen surrounded by an echogenic wall. In the fasting patient, the gallbladder is about 4 × 10 cm in size and the wall is normally no thicker than 3 mm (Fig. 19-1).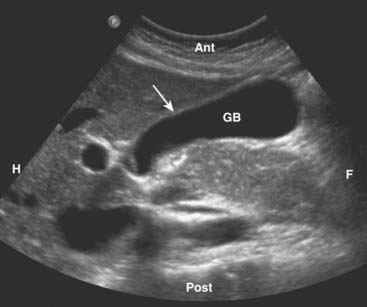
Figure 19-1 Normal gallbladder, sagittal view.
The gallbladder (GB) is normally filled with bile and is sonolucent. The wall of the gallbladder is less than 3 mm in size and slightly echogenic (solid white arrow). By convention on a sagittal view, the patient’s head is to your left (H), feet to your right (F), anterior is up (Ant), and posterior is down (Post).
Gallstones and Acute Cholecystitis
Cholelithiasis is estimated to affect more than 20 million Americans. In almost all cases, acute cholecystitis starts with a gallstone impacted in the neck of the gallbladder or cystic duct. The presence of gallstones does not, by itself, mean that the patient’s pain is from the gallbladder because asymptomatic gallstones are common. Cholecystitis can also occur less commonly in the absence of stones (acalculous cholecystitis). Gallstones usually fall to the most dependent part of gallbladder, which will depend on the patient’s position at the time of the scan. This helps to differentiate gallstones from polyps or tumors, which may be attached to a nondependent surface. Gallstones are characteristically echogenic and produce acoustical shadowing because they reflect most of the signal (Fig. 19-2).
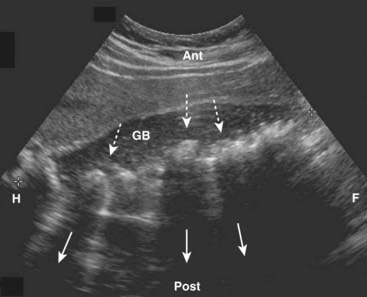
Figure 19-2 Cholelithiasis, sagittal view.
There are numerous echogenic stones (dotted white arrows) in the gallbladder (GB). The stones cast acoustical shadows as they reflect most of the sound waves (solid white arrows).
Acoustical shadowing describes a band of reduced echoes behind an echo-dense object (e.g., a gallstone) that reflects most, but not all, of the sound waves. While acoustical shadowing reduces the diagnostic effectiveness of ultrasound through such tissues as bone and bowel gas, its presence can have diagnostic value in identifying the presence of calculi, such as in the gallbladder and kidney (Fig. 19-3).
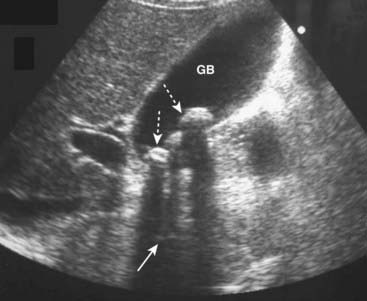
Figure 19-3 Acoustical shadowing.
There is a band of reduced echoes (solid white arrow) behind echogenic gallstones (dotted white arrows) that reflect most, but not all, of the sound waves. The presence of acoustical shadowing can have diagnostic value in identifying the presence of calculi in the gallbladder (GB).
 Biliary sludge can be found in the lumen of the gallbladder and is an aggregation that may contain cholesterol crystals, bilirubin, and glycoproteins. It is often associated with biliary stasis. While it may be echogenic, sludge does not produce acoustical shadowing like gallstones (Fig. 19-4).
In the presence of gallstones and gallbladder wall thickening, ultrasound has a positive predictive value for acute cholecystitis as high as 94%. Radionuclide scans (HIDA scans) are also used in the diagnosis of acute cholecystitis.
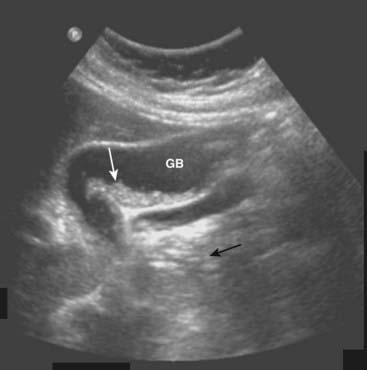
Figure 19-4 Sludge in the gallbladder.
Sludge (solid white arrow) in the gallbladder (GB) is associated with biliary stasis. While it may be echogenic, sludge does not produce acoustical shadowing like gallstones (the absence of shadowing is shown by solid black arrow).
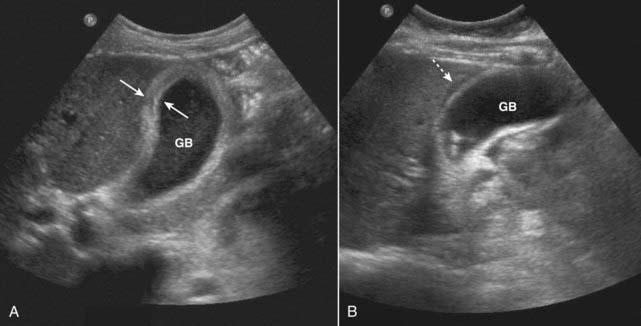
Figure 19-5 Acute cholecystitis, sagittal views, two patients.
A, Thickening of gallbladder (GB) wall. The wall should be 3 mm or less. This wall is markedly thickened at 6 mm (solid white arrows). B, There is an echo-free crescent (dotted white arrow) surrounding a thickened gallbladder (GB) wall representing pericholecystic fluid. The patient had a positive sonographic Murphy sign.
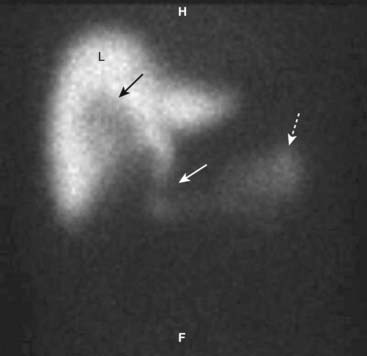
Figure 19-6 HIDA scan in cystic duct obstruction.
HIDA, a radioactive labeled isotope, concentrates in the liver (L) and is then excreted into the biliary ducts. On this delayed image, the common bile duct (solid white arrow) and small bowel (dotted white arrow) fill normally because the common bile duct is patent. The cystic duct and gallbladder do not fill because the cystic is obstructed, by a stone in this case. There is a tracer-free (photopenic) area in the gallbladder fossa because the nuclide cannot fill the gallbladder lumen (solid black arrow).
Bile Ducts
Ultrasound plays a key role in evaluation of the intrahepatic and extrahepatic bile ducts and pancreatic duct. The intrahepatic biliary radicals drain into the left and right hepatic ducts, which join to form the common hepatic duct (CHD). Where the cystic duct from the gallbladder joins the CHD is the origin of the common bile duct (CBD), which drains either within or adjacent to the head of the pancreas via the ampulla of Vater into the second portion of the duodenum. The CBD lies anterior to the portal vein and lateral to the hepatic artery in the porta hepatis (Fig. 19-7).
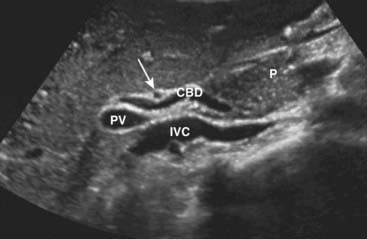
Figure 19-7 Normal common bile duct, portal vein, and hepatic artery, sagittal view.
The common bile duct (CBD) measures 3 mm (normal <6 mm). The solid white arrow points to the hepatic artery, seen on end. The portal vein (PV) is posterior to the common duct, and the inferior vena cava (IVC) is seen posterior to the portal vein. The pancreas (P) is anterior to the CBD.
The CHD and proximal CBD can be visualized normally on virtually all ultrasound studies of the right upper quadrant. The CHD measures no more than 4 mm (inner wall to inner wall) and the CBD measures no more than 6 mm in diameter. The pancreatic duct measures <2 mm.
Normal intrahepatic bile ducts are not visible. When the CBD is obstructed, the extrahepatic ducts dilate before the intrahepatic ducts. Over time, both the intrahepatic and extrahepatic ducts will be dilated (Fig. 19-8). Causes of bile duct obstruction include gallstones, pancreatic carcinoma, strictures, sclerosing cholangitis, cholangiocarcinoma, and metastatic disease.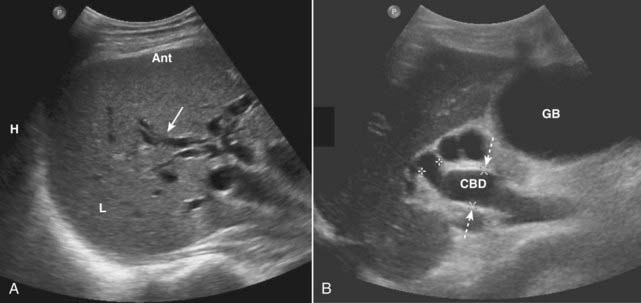
Figure 19-8 Dilated intrahepatic and extrahepatic ducts in two different patients, sagittal images.
A, The intrahepatic (L = liver) biliary ducts are normally not visible by ultrasound. In this case, they are dilated (solid white arrow) from obstruction by a pancreatic carcinoma (not shown). B, The CBD is dilated at 15 mm (dotted white arrows) and the gallbladder (GB) is distended from an obstructing stone (not shown).
Urinary Tract
Normal Ultrasound Anatomy
The kidneys normally measure 9-12 cm in length, 4-5 cm in width, and are 3-4 cm thick. The renal sinus is home to the renal pelvis and the major branches of the renal artery and vein. Because the renal sinus contains fat, it normally appears brightly echogenic. The calyces are normally not visible. The medullary pyramids are hypoechoic. The renal parenchyma has uniformly low echogenicity, which is usually less than that of the adjacent liver and spleen (Fig. 19-9).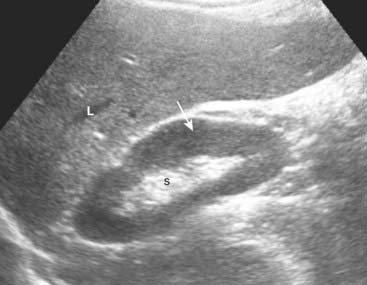
Figure 19-9 Normal right kidney, sagittal view.
The renal sinus (S) is home to the renal pelvis and the major branches of the renal artery and vein. Because the renal sinus contains fat, it normally appears brightly echogenic. The normal renal pelvis is not visible in the renal sinus. The renal parenchyma (solid white arrow) has uniformly low echogenicity and is usually less echogenic than the adjacent liver (L) or spleen.
Hydronephrosis
In patients experiencing renal colic, ultrasound is used primarily to evaluate for the presence of hydronephrosis since the ureters are difficult to visualize with US. The stone search itself is almost always carried out by CT scanning (see Chapter 16). The typical appearance of obstructive uropathy is a dilated calyceal system. The echogenic renal sinus contains a dilated, fluid-filled, and therefore anechoic renal pelvis. The ureter may be dilated to the level of the obstructing stone. Severe hydronephrosis may distort the appearance of the kidney (Fig. 19-10).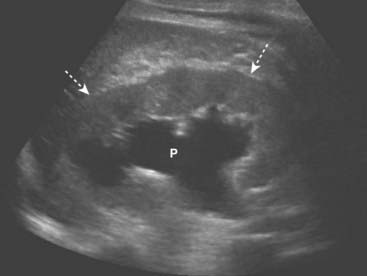
Figure 19-10 Hydronephrosis, sagittal view, right kidney.
The renal sinus now contains a markedly dilated, fluid-filled and anechoic renal pelvis (P) in this patient with hydronephrosis. The renal parenchyma remains normal in size and echogenicity (dotted white arrows). The patient had an obstructing stone at the ureteropelvic junction.
Medical Renal Disease
Medical renal disease refers to a host of diseases that primarily affect the renal parenchyma. They include such diseases as glomerulonephritis, diseases that cause nephrotic syndrome, and renal involvement in collagen vascular diseases. In the early stages of medical renal disease, the kidneys may appear normal. Later, changes in the echo architecture occur but these are usually nonspecific as to the actual etiology. The renal parenchyma becomes more echogenic (brighter) than the liver and spleen, the reverse of the normal echo pattern. Renal size is also an important reflection of the chronicity of a disease, the renal parenchyma almost always decreasing in size with chronic disease. A biopsy may be performed to determine the etiology of the disease (Fig. 19-11).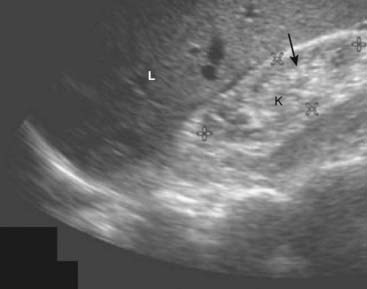
Figure 19-11 Chronic medical renal disease, sagittal view.
The right kidney (K) is small, measuring 6 × 3 cm between cursor marks. The renal parenchyma (solid black arrow) is more echogenic (brighter) than the adjacent liver (L), the reverse of the normal echo pattern. This patient had chronic glomerulonephritis from long-standing diabetes.
Abdominal Aortic Aneurysms
An aneurysm is defined as a localized dilation of an artery by at least 50% over its normal size. Most aortic aneurysms occur in the abdominal aorta inferior to the origin of the renal arteries and frequently extend into one or both iliac arteries.
The size of an aneurysm is directly related to its risk of rupture. For aneurysms less than 4 cm in diameter, there is less than a 10% chance of rupture, but for aneurysms 4-5 cm in diameter, the risk of rupture increases to almost 25%. Recognizing an abdominal aortic aneurysm
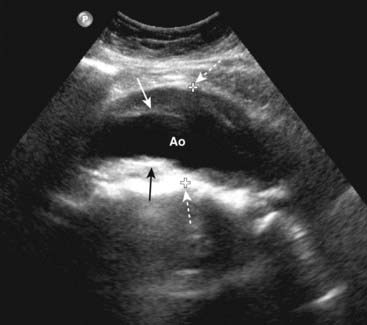
Figure 19-12 Abdominal aortic aneurysm, sagittal view.
There is fusiform dilatation of the abdominal aorta (Ao) measuring 4.9 cm between marks (dotted white arrows). Hypoechoic thrombus is seen in the aneurysm (solid black and white arrows). Ultrasonography is the screening study of choice when an asymptomatic, pulsatile abdominal mass is palpated. For aneurysms 4-5 cm in diameter, the risk of rupture increases to almost 25%.
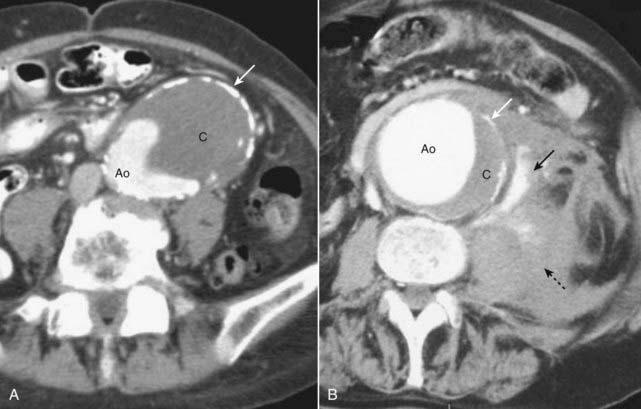
Figure 19-13 Abdominal aortic aneurysms on CT: mural thrombus and rupture.
A, The aorta is enlarged. Contrast is present in the lumen (Ao) along with a large clot (C). Calcification is seen in the wall of the aorta (solid white arrow). The aneurysm is almost in contact with the anterior abdominal wall. B, This aneurysm, in another patient, has ruptured. Contrast is seen in the lumen (Ao) along with a crescentic clot (C), and there is calcification present in the wall (solid white arrow), just as in the previous case. The major finding here is active extravasation of contrast-containing blood outside of the aorta (solid black arrow) producing a large retroperitoneal hematoma (dotted black arrow).
Female Pelvic Organs
Ultrasonography is the imaging study of choice in evaluating a pelvic mass or pelvic pain in the female. Leiomyomas confined to the myometrium are the most common tumors of the uterus. Endometrial carcinomas are usually confined to the uterus at the time of discovery. The most common mass in the ovary is a functional cyst. Generally, uterine masses are solid and ovarian masses are cystic.Normal Ultrasound Anatomy of the Uterus
The uterus is made up of a thick muscular layer (myometrium) and a mucous surface (endometrium). It is divided into a body, with cornu to receive the fallopian tubes, and the cervix. Anterior to the uterus is the peritoneal space called the anterior cul-de-sac. The posterior cul-de-sac is also called the rectouterine recess. The uterus is usually anteverted (axis of the cervix relative to the vagina) and anteflexed (position of the uterine body relative to the cervix). In the adult, the uterus has a pear shape with maximum dimensions of approximately 8 cm in length, 5 cm in width, and 4 cm in AP dimension. The size of the normal uterus increases with multiparity; with aging, the uterus regresses in size (Fig. 19-14). The normal endometrial cavity forms a thin echogenic stripe or line between the opposing surfaces of the endometrium. By convention it is measured as a double thickness on a sagittal view of the mid-uterus. The appearance of both the endometrium and the ovaries varies depending on the phase of the menstrual cycle.
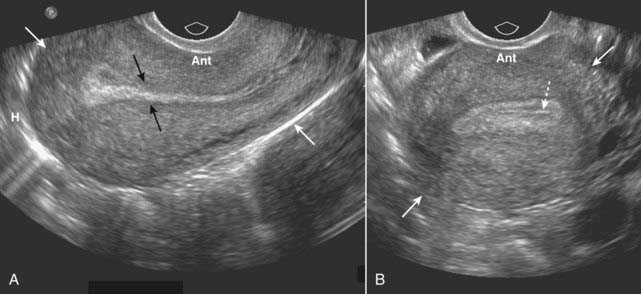
Figure 19-14 Normal uterus, sagittal (A) and transverse (B).
The uterus (solid white arrows) has a pear shape with maximum dimensions of approximately 8 cm in length, 5 cm in width, and 4 cm in AP dimension. A, The endometrium lines the uterine cavity and is measured in the sagittal view (solid black arrows). B, The collapsed uterine cavity is within the center of the endometrium and is visualized as a thin, echogenic line (dotted white arrow).
The standard transabdominal (through the abdominal wall) study of the uterus is done with a full urinary bladder. The full bladder provides an acoustical window to the uterus by pushing bowel loops out of the pelvis and also helps to delineate the bladder itself.
Transvaginal studies are done with higher frequency probes and thus provide better resolution images and are done with the bladder empty. Transabdominal and transvaginal studies are considered complementary techniques. Sonohysterography is a procedure in which saline is instilled in the uterine cavity in conjunction with images obtained using transvaginal ultrasound. It provides excellent visualization of the uterine cavity and fallopian tubes and can be used to detect small uterine polyps, submucosal myomas, and adhesions.Uterine Leiomyomas (Fibroids)
Leiomyomas are benign smooth muscle tumors of the uterus that occur in up to 50% of women over the age of 30. Although most women with fibroids are asymptomatic, fibroids can cause pain, infertility, menorrhagia, and urinary or bowel symptoms if they grow large enough. Ultrasound (transabdominal and transvaginal) is the imaging study of choice in evaluating uterine fibroids. MRI is used mainly to evaluate complicated cases or in surgical planning. Fibroids are also frequently visualized on CT scans of the pelvis, usually performed for other reasons. Recognizing uterine leiomyomas on US
Recognizing uterine leiomyomas on CT
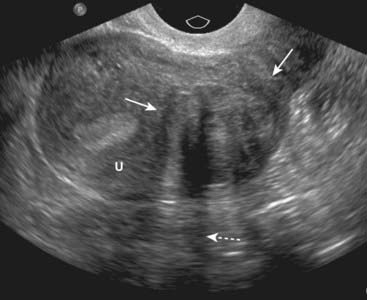
Figure 19-15 Leiomyoma of the uterus, sagittal view.
There is a heterogeneously hypoechoic mass (solid white arrows) in the uterus (U). Uterine leiomyomas may display some areas that contain many echoes and others that demonstrate few echoes. They frequently absorb enough sound to produce acoustical shadowing (dotted white arrow). Where they are necrotic, they may be cystic. If they contain calcium, the calcium will produce acoustical shadowing.
Normal Ultrasound Anatomy of the Ovaries
Normal ovarian anatomy and physiology
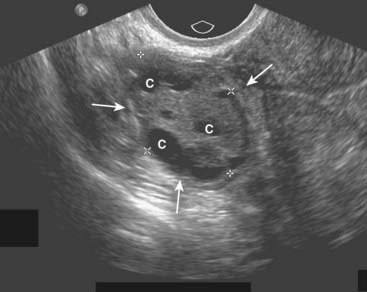
Figure 19-16 Normal right ovary, sagittal view.
In premenopausal women, the ovaries are approximately 2 × 3 × 4 cm in size (solid white arrows), usually containing small cystic follicles (C) as shown here.
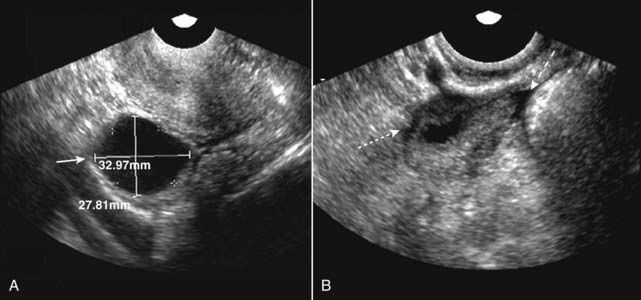
Figure 19-17 Dominant follicle ruptures during scan.
Under normal hormonal stimulation, one egg-containing follicle becomes dominant and attains a size of about 2.5 cm at the time of ovulation. A, The dominant follicle is 3.3 × 2.8 cm at the start of the study (solid white arrow). B, A few minutes later, during the study, the follicle ruptures (ovulation occurs) and the follicle shrinks dramatically in size (dotted white arrow). A small, physiologic amount of free fluid appears in the peritoneal cavity (dashed white arrow).
If one of the nondominant follicles fills with fluid and does not rupture, a follicular cyst is formed. Follicular cysts are unilateral, usually asymptomatic, and usually involute during the next menstrual cycle or two. If they persist or enlarge, they are pathologic.
A corpus luteum is the structure that forms after expulsion of an egg from the dominant ovarian follicle. If the corpus luteum fills with fluid, a corpus luteal cyst will develop. Though less common than follicular cysts, corpus luteal cysts are more symptomatic (pain) and can be larger. Still, most usually involute in 6-8 weeks.Ovarian Cysts
Follicular cysts and corpus luteum cysts are called functional cysts of the ovary because they occur as a result of the hormonal stimuli associated with ovulation. Both are characteristically well-defined, thin-walled, anechoic structures with homogeneous internal fluid density. They may contain echogenic material if hemorrhage occurs into the cyst (Fig. 19-18). Nonfunctional cysts of the ovary include dermoid cysts, endometriomas, and polycystic ovaries.
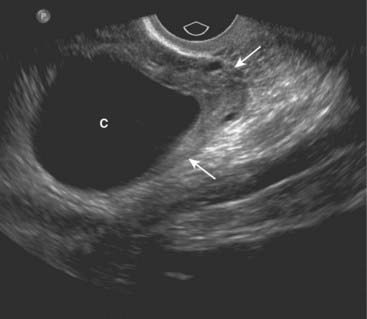
Figure 19-18 Simple ovarian cyst, sagittal view.
Contained within the left ovary (solid white arrows) is a well-defined, thin-walled, anechoic structure representing a simple ovarian cyst (C). Ovarian cysts may contain echogenic material if hemorrhage occurs into the cyst.
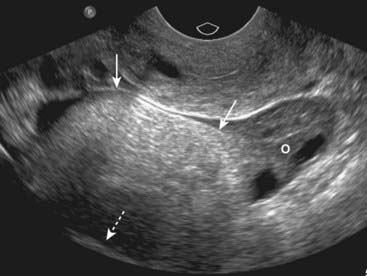
Figure 19-19 Ovarian dermoid cyst.
There is a large, solid echogenic mass (solid white arrows) in the right ovary (O) with acoustical shadowing (dotted white arrow). Dermoid cysts of the ovary are most commonly found in women of reproductive age and are bilateral in up to 25% of cases.
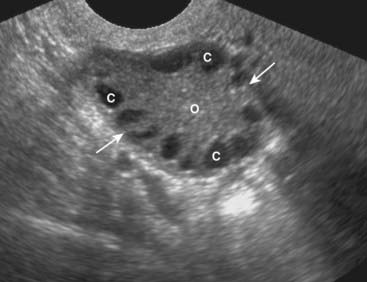
Figure 19-20 Polycystic ovarian disease.
Polycystic ovarian disease is an endocrine abnormality that allows for numerous ovarian follicles (>12 per ovary) to develop in various stages of hormonal growth and atresia. This ovary (O) is enlarged (solid white arrows) and contains multiple peripheral cysts, some of which are labeled (C). When associated with oligomenorrhea, hirsutism, and obesity, polycystic ovarian disease is called Stein-Leventhal syndrome.
Ovarian Tumors
Most ovarian tumors arise from the surface epithelium that covers the ovary, serous tumors being more common (serous cystadenomas, adenocarcinomas) than mucinous tumors (mucinous cystadenomas, adenocarcinomas). Most serous tumors, and the overwhelming number of mucinous tumors, are benign.
On ultrasound, primary tumors of the ovary are usually cystic in nature. Keys to differentiating ovarian cysts from tumors include thick and irregular walls and internal septations seen in tumors (Fig. 19-21).
The primary route of spread for ovarian cancer is throughout the peritoneal cavity. Omental cake is the term that applies to metastatic implants in the omentum and on the peritoneal surface frequently producing an elongated nodular mass. Ascites usually indicates peritoneal spread.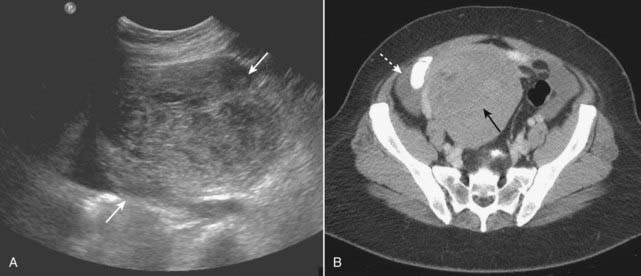
Figure 19-21 Ovarian tumor, US and CT.
A, A transverse scan through the right adnexa demonstrates a large, solid ovarian mass (solid white arrows). B, CT on the same patient shows a large heterogeneous mass arising from the right adnexa (solid black arrow). A small amount of ascites is seen (dotted white arrow). This patient had a fibroma of the ovary, a tumor sometimes associated with ascites and pleural effusion (Meig syndrome).
Pelvic Inflammatory Disease
Pelvic inflammatory disease (PID) is a term used to describe a group of infectious diseases affecting the uterus, fallopian tubes, and ovaries. Most cases of PID begin as a transient endometritis and ascend to infection of the tubes and ovaries. Patients can have pain, vaginal discharge, adnexal tenderness and elevated white blood cell counts. Complications include infertility, chronic pain, or ectopic pregnancy. CT can be used for cases of complicated PID or those in whom the history may not suggest that diagnosis. Recognizing PID on CT requires the use of intravenous contrast material. Findings include:
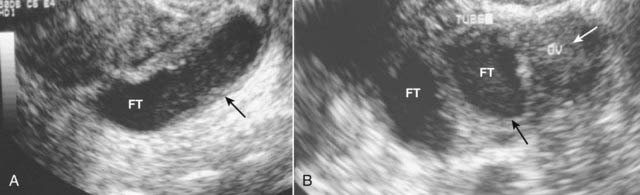
Figure 19-22 Pelvic inflammatory disease, sagittal and transverse views, US.
A, A fluid-filled and dilated fallopian tube (FT) containing pus and debris (solid black arrow) representing a pyosalpinx is demonstrated. B, Due to progressive inflammation, there is fusion of a dilated and tortuous fallopian tube (solid black arrow, FT) and the adjacent ovary (solid white arrow, OV) producing a tubo-ovarian complex.
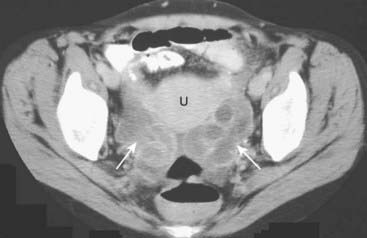
Figure 19-23 Bilateral pyosalpinges in pelvic inflammatory disease, CT.
There are dilated, serpiginous, and fluid-filled tubular structures bilaterally (solid white arrows) representing pyosalpingitis of both fallopian tubes on this scan of the pelvis in a young female with pelvic inflammatory disease. (U = uterus.)
Ascites
Ascites is the abnormal accumulation of fluid in the peritoneal cavity. In the recumbent position, ascitic fluid flows up the right paracolic gutter to the right subphrenic space so ascites is generally easier to detect by ultrasound in the right upper quadrant between the liver and the diaphragm.
Ascitic fluid that is a transudate is primarily sonolucent. Fluid collections that are exudates or contain hemorrhage or pus may contain echoes (Fig. 19-24). Ultrasound is frequently used to identify the best location to perform a paracentesis to remove ascitic fluid. The ultrasonographer may place a mark on the patient’s skin indicating the best portal from which to withdraw fluid while avoiding any visceral organ.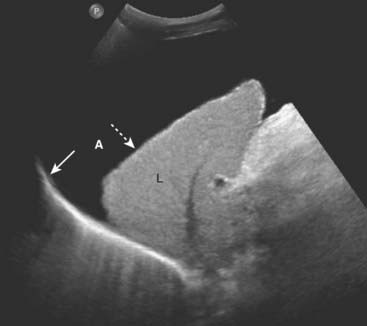
Figure 19-24 Ascites, sagittal US.
Ascitic fluid flows up the right paracolic gutter to the right subphrenic space so ascites (A) is generally easier to detect by ultrasound in the right upper quadrant between the liver (L) and the diaphragm (solid white arrow). The liver is contracted and has a nodular margin (dotted white arrow), both features of cirrhosis. If the fluid is a transudate, as in this case of ascites due to cirrhosis, the fluid will be anechoic. Exudates will produce internal echoes.
Appendicitis
The normal appendix may not be visualized on ultrasound. The diameter of the appendix is usually less than 6 mm. When visible, the normal appendix compresses when pressure is applied with the transducer. The pathophysiology of acute appendicitis begins with obstruction of the appendiceal lumen followed by progressive distension of the obstructed appendix until perforation occurs and a periappendiceal abscess forms.
In acute appendicitis, the appendix may be recognized on ultrasound as a blind-ending, aperistaltic tube with a diameter of 6 mm or more. The appendix is noncompressible (using a technique called graded compression). It may be tender when palpated with the probe. In about a third of the cases of appendicitis, a fecalith will be present (Fig. 19-25).
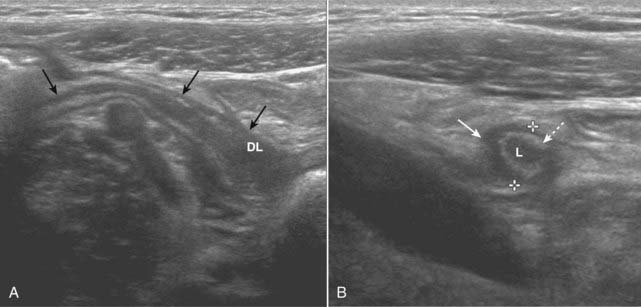
Figure 19-25 Acute appendicitis, sagittal and transverse views.
A, There is a blind-ending tubular structure (solid black arrows) that has a thick wall and a distended lumen (DL) representing an inflamed and distended appendix. B, In this transverse view, the appendix (solid white arrow) measures 7 mm between marks (normal <6 mm). The lumen (L) contains fluid, and there is an echogenic ring that represents the mucosa (dotted white arrow) surrounding it. The appendix may be tender when palpated with the probe.
Pregnancy
Ultrasound has provided a safe and reliable means of visualizing the fetus in utero and the ability to do so repeatedly during the course of a pregnancy, if necessary. The overwhelming majority of mothers in North America and Western Europe undergo at least one ultrasound evaluation sometime during pregnancy. Even before pregnancy, ultrasound can be used for assessing the time of ovulation to aid in the process of successful fertilization. The goals of sonography during pregnancy may differ depending on the timing of the scan. During the first trimester, goals are to exclude an ectopic pregnancy, estimate the age of the pregnancy, determine fetal viability, and determine if there are multiple fetuses present. During the second and third trimesters, goals may include estimates of amniotic fluid volume, detection of fetal anomalies, determination of placental and fetal positioning, or guidance for invasive studies to determine the likelihood of fetal viability in the event of a premature birth. A discussion of all of the ultrasound findings during pregnancy is beyond the scope of this text. We’ll look at three important uses of ultrasound.Ectopic Pregnancy
Most ectopic pregnancies are tubal in location and occur near the fimbriated (ovarian) end. The classical clinical findings of pain, abnormal vaginal bleeding, and a palpable adnexal mass are seen in only about half of cases. The incidence of ectopic pregnancies is increasing, most likely because of increasing risk factors, but the mortality rate has declined, in part because of their early diagnosis by ultrasound.
Using transvaginal scanning, ultrasound is best at identifying the presence of a normal, intrauterine pregnancy; ultrasound does less well at directly visualizing an ectopic pregnancy.
If a gestational sac (the earliest sonographic finding in pregnancy, appearing at about 4-5 weeks gestational age), yolk sac (first structure to be seen normally in gestational sac), or viable fetus is identified in the uterine cavity, an ectopic pregnancy is effectively excluded. Endovaginal examinations are usually performed to find the gestational sac (Fig. 19-26).
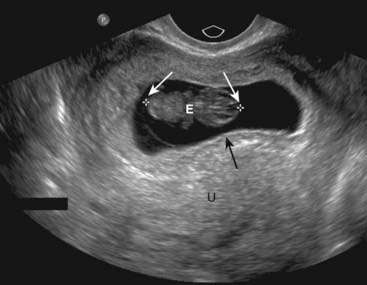
Figure 19-26 Early intrauterine pregnancy.
There is a single live intrauterine pregnancy (solid white arrows) contained within the gestational sac (solid black arrow) inside the uterus (U). Using a measurement called the crown-rump length, (between the white arrows) the embryo (E) was estimated at 9 weeks of age. Sonographic gestational age begins on the first day of the last normal menstrual cycle because, for most individuals, that is a more certain date than the actual date of ovulation.
While it is possible to have simultaneous intrauterine and extrauterine pregnancies, such heterotopic pregnancies are extremely rare, other than in fertility patients, so that identification of an intrauterine pregnancy effectively excludes an ectopic pregnancy.
Conversely, the demonstration of a live embryo outside of the uterus is diagnostic of an ectopic pregnancy. This is not a common occurrence with most ectopic pregnancies (Fig. 19-27). Most often, an ectopic location is diagnosed by a combination of findings that includes the demonstrated absence of an identifiable intrauterine pregnancy while the quantitative serum human chorionic gonadotropin hormone (β-HCG) rises above the discriminatory level, at which point a normal intrauterine pregnancy should almost always be identified. If those two criteria are met, an ectopic pregnancy is presumed present. The beta (β) subunit of HCG is specific for the hormone produced by placental tissue shortly after the implantation of a fertilized ovum in the uterus. The levels of HCG roughly double every 2-3 days in a normal pregnancy. At a β-HCG level of around 1,500 milli-international units per milliliter (mIU/mL), a normal intrauterine pregnancy should be visible with transvaginal ultrasound.
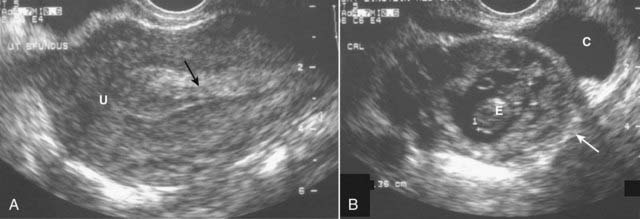
Figure 19-27 Ectopic pregnancy.
A, A normal endometrial stripe (solid black arrow) is present with no evidence of a pregnancy in the uterus (U). B, There is an adnexal mass (solid white arrow) containing an embryo (E). There is fluid in the cul-de-sac (C). The demonstration of an embryo outside of the uterus is diagnostic of an ectopic pregnancy.
Serial β-HCG determinations may help in differentiating an ectopic pregnancy from an early abortion, both of which may display similar sonographic findings. Patients with an early abortion will display falling β-HCG levels on serial serum studies, while ectopic pregnancies will rise, though usually more slowly than normal intrauterine pregnancies.
Fetal Abnormalities
Certain fetal anomalies can be recognized by ultrasound in utero that are known to be universally fatal after birth, such as anencephaly or complete ectopia cordis. The accurate interpretation of sonograms by someone trained and accredited in obstetric ultrasound is critical in detecting such anomalies. Many fetal anomalies may be diagnosed by ultrasound in utero. Among them:
In detecting fetal anomalies, ultrasound has played a major role in obstetrical management of pregnancy. Ultrasound’s role should increase as more reliable markers for chromosome abnormalities that can be quickly assessed without prolonged waiting periods become more available.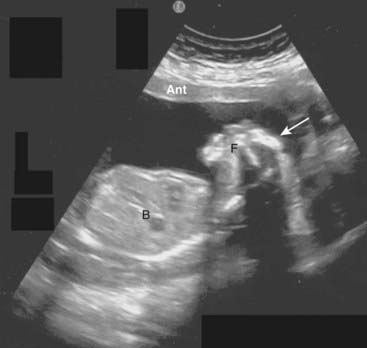
Figure 19-28 Anencephaly, sagittal view.
There is a single live intrauterine pregnancy. The body (B) and face (F) are present, but the cranium and all of the cerebrum and cerebellum are absent (solid white arrow). Anencephaly involves a failure of closure of the neural tube during the 3rd-4th weeks of development. It virtually always leads to fetal demise, stillbirth, or neonatal death.
Molar Pregnancy
Molar pregnancy is the most common of a group of disorders of the placenta that also includes invasive mole and choriocarcinoma. Pathologically, molar pregnancies feature cystic (grapelike or hydatidiform) degeneration of chorionic villi and proliferation of the placental trophoblast. A molar pregnancy is suggested by uterine size that is disproportionately large for the dates of gestation, β-HCG levels in excess of 100,000 mIU/mL (normal pregnancies are less than 60,000 mIU/mL), vomiting, vaginal bleeding, and toxemia. Therapy is uterine evacuation. About 20% of those with complete molar pregnancies may harbor persistent trophoblastic tissue, so follow-up is carried out with serial HCG determinations.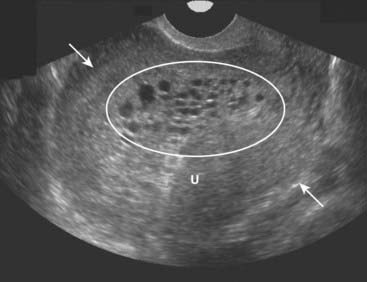
Figure 19-29 Molar pregnancy, sagittal view.
The uterus (U) is enlarged and filled with echogenic tissue (solid white arrows). There are innumerable, relatively uniform-sized cystic spaces that represent hydropic villi (oval) in this complete molar pregnancy. In a complete molar pregnancy, there is no fetus.
Vascular Ultrasound
Vascular ultrasound studies combine morphologic images of the vessels with the simultaneous recording of the velocity of flow displayed by the Doppler spectral waveform.
The Doppler spectral waveform is a graphic representation of the velocity of flow over time within a focused area. It is depicted along an x (time) and y (velocity) axis. Flow toward the transducer is displayed above the baseline; flow away below the baseline. Different arteries have distinctive spectral waveforms depending, in part, on whether there is normally a high or low resistance to flow within them.
Color flow Doppler imaging adds the dimension of superimposing moving blood (shown in color) over a gray-scale image of the anatomic structure enabling a more rapid identification of potential abnormalities. The Doppler spectral waveform quantitates the flow. Carotid ultrasonography has become the study of choice for the noninvasive assessment of extracranial atherosclerotic disease. Extracranial carotid occlusive disease accounts for more than one half of strokes. Carotid ultrasound is also used to evaluate bruits, as preoperative screening prior to other major vascular surgery and to assess the patency of the vessel after endarterectomy (Fig. 19-30).
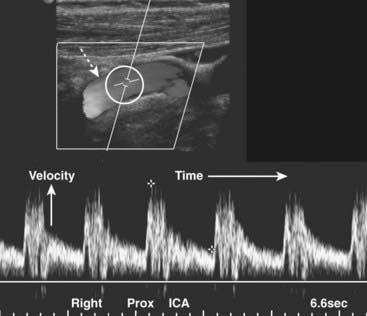
Figure 19-30 Normal proximal right internal carotid artery, duplex sonogram.
The upper display (dotted white arrow) depicts flow in the artery (the original displayed the flow in color). Within the white circle is the Doppler sampler volume, the measurements for which are shown on the lower graphical display, called the Doppler spectral waveform. The x axis represents time; the height of the waveforms represents the velocity of blood flow within the Doppler sampler volume. The velocity normally increases with each systole and decreases with each diastole.
Carotid stenosis begins to cause elevations in the velocity of flow when there is greater than 50% narrowing of the lumen. Significant stenosis alters the Doppler waveform proximal, at, and distal to the point of stenosis.
Ultrasound is used to assess the thickness of the vessel wall (it gets thicker with atherosclerosis), the presence and nature of plaque, and analysis of the Doppler spectral waveform. Any vessel in the body of large enough size which is accessible to the ultrasound transducer can be studied. Besides the carotid arteries, the jugular veins, vertebral artery, renal arteries, and peripheral arteries are commonly studied. CT-angiography may also be used for vascular studies, but it requires ionizing radiation and intravenous contrast. Arterial flow in the extremities produces a high resistance waveform due to the downstream high resistance of the arterial bed. With significant arterial disease, there is a focal increase in the velocity of flow at the point of stenosis. A normal high resistance flow becomes low resistance when the scan sample is distal to the point of obstruction (Fig. 19-31).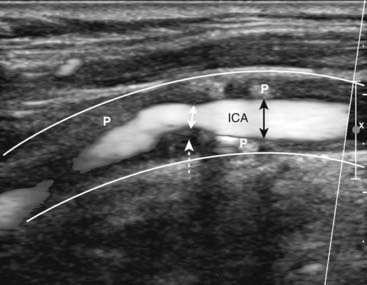
Figure 19-31 Stenotic right internal carotid artery, sagittal view.
The white lines indicate the normal location of the wall of the right internal carotid artery (ICA). The lumen is narrowed (double black arrows) due the presence of plaque (P) throughout the wall. At the site of the dotted white arrow, the lumen narrows to less than 50% of its normal diameter (double white arrow) from thicker plaque.
Deep Vein Thrombosis
The majority of patients with deep venous thrombosis are asymptomatic. The most serious complication of deep vein thrombosis (DVT) is pulmonary embolism. The highest yield sonographic examination for DVT using US occurs in the symptomatic patient who has symptoms above the knee. US has a much lower sensitivity in asymptomatic patients. The ultrasound examination for deep venous thrombosis is performed by examining the leg along the course of certain anatomical landmarks: the common femoral vein, proximal deep femoral vein, greater saphenous vein, and the popliteal vein.
Sonographic evaluation for DVT of the leg is mainly based on the principle that normal venous structures will easily be compressed and completely collapsed by the transducer, whereas veins harboring thrombi will not compress. Sonographic evaluation also seeks to visualize the echogenic thrombus itself (Fig. 19-32).
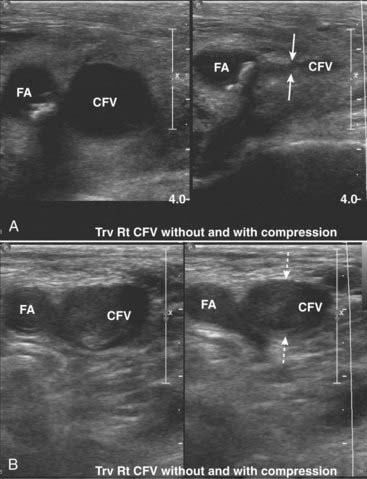
Figure 19-32 Normal common femoral vein (CFV) and deep venous thrombosis (DVT).
Normal veins will compress and collapse by pressure from the transducer, whereas veins harboring thrombi will not compress. Arteries will also not collapse. These are paired images done both without and with compression of the CFV in two different patients. A, In this normal patient, the CFV collapses normally with compression (solid white arrows). The femoral artery, as expected, (FA) does not. B, In this patient with a DVT, the CFV does not collapse with compression (dotted white arrows) implying the presence of a clot contained within it.
 Weblink
Registered users may obtain more information on Ultrasonography: Understanding the Principles and Recognizing Normal and Abnormal Findings on StudentConsult.com.
 Take-Home Points
Ultrasonography: Understanding the Principles and Recognizing Normal and Abnormal Findings
Creation of a sonographic image (sonogram) depends on three major components: the production of a high frequency sound wave, the reception of a reflected wave or echo, and the conversion of that echo into the actual image.
A tissue that reflects many echoes is said to be echogenic (hyperechoic) and is usually depicted as bright or white on the sonogram; a tissue that has few or no echoes is said to be sonolucent (hypoechoic or anechoic) and is usually depicted as being dark or black.
Sonography makes use of the Doppler effect to determine if an object, usually blood, is moving toward or away from the transducer and at what velocity it is moving.
There are no known long-term side effects that have been scientifically demonstrated from the use of medical ultrasound in humans.
Gallstones are characteristically echogenic and produce acoustical shadowing because they reflect most of the signal.
Biliary sludge can be found in the lumen of the gallbladder and is often associated with biliary stasis. While it may be echogenic, sludge does not produce acoustical shadowing like gallstones.
The typical appearance of obstructive uropathy is a dilated calyceal system. The normally echogenic renal sinus contains a dilated, fluid-filled, and anechoic renal pelvis.
In medical renal disease, the renal parenchyma becomes more echogenic (brighter) than the liver and spleen, the reverse of the normal echo pattern.
Ultrasonography is the screening study of choice when an asymptomatic, pulsatile abdominal mass is palpated. The normal abdominal aorta measures <3 cm in diameter.
Leiomyomas confined to the myometrium are the most common tumors of the uterus. The most common mass in the ovary is a functional cyst. Generally, uterine masses are solid and ovarian masses are cystic.
Follicular cysts and corpus luteum cysts are called functional cysts of the ovary. Follicular cysts are more common. Functional cysts are characteristically well-defined, thin-walled, anechoic structures with homogeneous internal fluid density. They may contain echogenic material if hemorrhage occurs into the cyst.
Nonfunctional cysts of the ovary include dermoid cysts, endometriomas, and polycystic ovaries.
Tumors of the ovaries most often arise from the surface covering and are either serous or mucinous. Most serous tumors and the overwhelming number of mucinous tumors are benign.
Pelvic inflammatory disease (PID) is a term used to describe a group of infectious diseases affecting the uterus, fallopian tubes, and ovaries, most beginning as a transient endometritis.
In the recumbent position, ascitic fluid flows up the right paracolic gutter to the right subphrenic space so ascites is generally easier to detect by ultrasound in the right upper quadrant between the liver and the diaphragm.
In acute appendicitis, the appendix may be a blind-ending, aperistaltic tube with a diameter of 6 mm or more. It is noncompressible and may be tender when palpated with the probe. In about a third of the cases of appendicitis, a fecalith will be present.
Ultrasound has provided a safe and reliable means of visualizing the fetus in utero and the ability to do so repeatedly during the course of a pregnancy, if necessary.
Most ectopic pregnancies are tubal in location and occur near the fimbriated (ovarian) end. An ectopic pregnancy can be effectively excluded if an intrauterine pregnancy is present and included if an extrauterine pregnancy is seen. Most often, an ectopic pregnancy is diagnosed by a combination of absence of an identifiable intrauterine pregnancy while the β-HCG rises above a certain level.
A molar pregnancy is suggested by a uterine size that is disproportionately large for the dates of gestation and β-HCG levels in excess of 100,000 mIU/mL (normal pregnancies are less than 60,000 mIU/mL).
Vascular ultrasound studies combine morphologic images of the vessels with the simultaneous recording of the velocity of flow displayed by the Doppler spectral waveform. Carotid stenosis begins to cause changes in the velocity of flow when there is greater than 50% narrowing of the lumen.
Sonographic evaluation for DVT of the leg is mainly based on the principle that normal venous structures will be easily compressed and collapsed by the transducer, whereas veins harboring thrombi will not compress. Sonographic evaluation also seeks to visualize the echogenic thrombus itself.