Chapter 1 The atmosphere
 The mass of the Earth and its distance from the sun provide optimal conditions of gravity and temperature for long-term liquid surface water and the retention in its atmosphere of oxygen, nitrogen and carbon dioxide. Primitive life-forms generated energy by photosynthetic reactions, producing oxygen, and so facilitating the development of an oxygen-containing atmosphere and aerobic organisms.
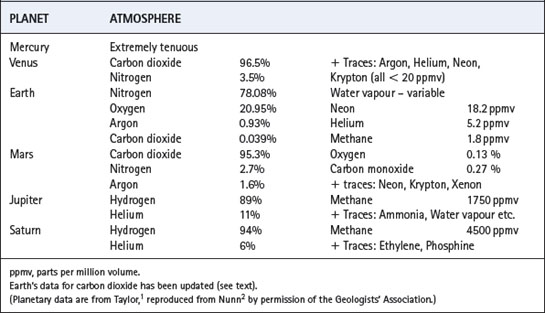
The atmosphere of Earth is radically different from that of any other planet in the solar system (Table 1.1) and may well be rare on planets of other stars in the universe as a whole. The unique character of our atmosphere is because of two main reasons. First, temperature has permitted the existence of liquid surface water for at least 3800 million years (Ma), and this has resulted in weathering of silicate rocks, reducing the concentration of carbon dioxide far below the levels still pertaining in the rocky planets Venus and Mars. Secondly, the existence of liquid surface water enabled living organisms to appear at a very early stage: life forms then evolved to undertake oxygenic photosynthesis. When oxygen sinks were saturated, oxygen appeared in the atmosphere and some organisms began to utilise highly efficient oxidative metabolic pathways. An atmosphere containing oxygen is in inorganic chemical disequilibrium, and is an indication of the existence of life.
Evolution of the Atmosphere
Formation of the Earth and the Pre-Biotic Atmosphere
The earth was formed by a relatively short lived, but intense, gravitational accretion of rather large planetesimals, orbiting the newly formed sun some 4560 Ma ago. The kinetic energy of the impacting bodies was sufficient to raise the temperature to a few thousand degrees Celsius. This would have melted the entire Earth, resulting in loss of the primary atmosphere.
Earth cooled rapidly by radiation when the initial bombardment abated, and the very high temperature (Hadean) phase is not thought to have lasted longer than a few hundred Ma. The crust solidified, but massive outgassing continued, resulting in an atmosphere mainly comprising carbon dioxide and steam (Table 1.2) as probably occurred on Venus and Mars.1,2 In the case of Earth, the water vapour condensed to surface water, and there is good evidence that oceans existed about 3800 Ma ago and perhaps even earlier.3 Once Earth’s crust was cool, and surface water was in existence, it was possible for comets and meteorites to leave a secondary veneer of their contents, including water and a wide range of organic compounds.4
Table 1.2 Average composition of gas evolved from Hawaiian volcanoes
| CONSTITUENT | PERCENT |
|---|---|
| Water vapour | 70.75 |
| Carbon dioxide | 14.07 |
| Sulphur dioxide | 6.40 |
| Nitrogen | 5.45 |
| Sulphur trioxide | 1.92 |
| Carbon monoxide | 0.40 |
| Hydrogen | 0.33 |
| Argon | 0.18 |
| Sulphur | 0.10 |
| Chlorine | 0.05 |
(Data are from reference 5, reproduced from reference 2 by permission of the Geologists’ Association.)
Important physico-chemical changes occurred in the early secondary atmosphere. Helium and hydrogen tended to be lost from the Earth’s gravitational field. Ammonia dissociated to nitrogen and hydrogen, the former retained and the latter lost from the atmosphere. Some carbon dioxide might have been reduced by hydrogen to form traces of methane, but very large quantities slowly reacted with surface silicates to become trapped as carbonates, while forming silica (weathering). Traces of water vapour underwent photodissociation to hydrogen and oxygen. However, oxygen from this source was present in only minimal quantities, and the early atmosphere is no longer thought to have been as strongly reducing as was formerly believed.6
The initial very high partial pressure of carbon dioxide, and probably some methane, would have provided a powerful greenhouse effect to offset the early minimal weak solar radiation, which was some 30% less than today (Figure 1.1). However, the Sun commenced its main sequence of thermo-nuclear fusion of hydrogen to helium about 3000 Ma ago. Since then solar radiation has been increasing steadily as the Sun proceeds remorselessly towards becoming a red giant, which will ultimately envelop the inner planets. It is fortunate that increasing solar radiation has been approximately offset by a diminishing greenhouse effect, due mainly to decreasing levels of carbon dioxide (see below). As a result, Earth’s temperature has remained relatively stable, permitting the existence of surface water for the last 3800 Ma.
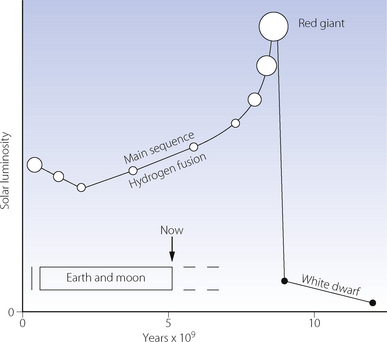
Fig. 1.1 Solar luminosity plotted against the age of the Sun, with the open circles giving a qualitative impression of the diameter of the Sun. Superimposed is an indication of the life of the Earth and Moon, which is now about half way through the main sequence of the Sun deriving its energy from hydrogen fusion to helium. The times can only be very approximate.
(After reference 7 with kind permission of Springer Link and Business Media.)
Significance of Mass of Earth and Distance from Sun
Small bodies, such as Mercury and most of the planets’ satellites, have a gravitational field which is too weak for the retention of any significant atmosphere (Figure 1.2). The gas-giants (Jupiter, Saturn, Uranus and Neptune) have a gravitational field which is sufficiently strong to retain all gases, including helium and hydrogen, thereby ensuring the retention of a reducing atmosphere. The gravitational field of the Earth is intermediate, resulting in a differential retention of the heavier gases (oxygen, carbon dioxide and nitrogen), while permitting the escape of hydrogen and helium. This is essential for the development of an oxidising atmosphere and life as we know it. Water vapour (molecular weight only 18) would be lost from the atmosphere were it not for the cold trap at the tropopause.
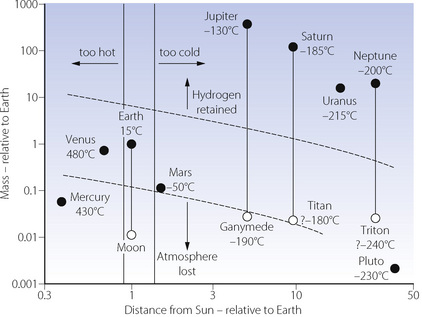
Fig. 1.2 The planets and some of their larger satellites, plotted according to distance from the Sun (abscissa), and mass (ordinate), both scales being logarithmic and relative to Earth. Mean surface temperatures are shown. Potential for life as we know it exists only within the parallelogram surrounding the Earth.
Surface temperature of a planetary body is crucial for the existence of liquid water, which is essential for life and therefore the composition of our atmosphere. To a first approximation, temperature is dependent on the distance of a planet from the Sun, and the intensity of solar radiation (Figure 1.2). The major secondary factor is the greenhouse effect of any atmosphere which the planet may possess. Mercury and Venus have surface temperatures far above the boiling point of water. All planets (and their satellites) which are further away from the Sun than Earth have a surface temperature too cold for liquid water to exist today. However, there is now evidence that Mars had liquid surface water in the past,8 now present only as ice.9
Earth is the only planet in the solar system which has both a mass permitting retention of an oxidising atmosphere, and a distance from the Sun at which the temperature permits liquid water to exist on its surface. It is difficult to see how there could be life as we know it anywhere in the solar system outside the small parallelogram in Figure 1.2. However, an environment similar to that of the earth may well exist on some planets of the 1022 other sun-like stars in the universe.
Origin of Life and the Development of Photosynthesis
Amino acids and a wide range of organic compounds are found in a type of meteorite known as carbonaceous chondrites.4 Therefore, whether or not such compounds were actually synthesised on the early Earth, as Stanley Miller had proposed,6 it is highly likely that a wide range of organic compounds were available on the pre-biotic Earth when liquid oceans were formed.
It is less easy to explain the next stage in the evolution of life. An essential feature of all life is the synthesis of proteins using a ribonucleic acid (RNA) template, usually transcribed from the genetic code carried on deoxyribonucleic acid (DNA). There would appear to have been a classical ‘chicken and egg’ situation. Useful proteins could not be formed without the appropriate sequences in RNA or DNA: RNA and DNA could not be polymerised without appropriate enzymes which are normally proteins. Nevertheless, life did appear, perhaps in the first instance with the genetic code carried only on RNA, or even the much simpler peptide nucleic acid (PNA).10
An essential requirement for life is the availability of bio-usable forms of energy. The forms of available energy and their location at the dawn of life remain a mystery. However, one cannot ignore the possibility of hydrothermal vents, such as the black smokers along the mid-ocean ridges at great depths, which still support very simple life forms on the basis of chemoautotrophy. They are totally independent of sunlight, and exploit the profound chemical disequilibrium between the emerging hot, reducing and acid water, containing hydrogen sulphide, methane, ammonia, phosphorus and a range of metals, and the surrounding sea water.11 It is likely that there have been hydrothermal vents on Earth for as long as surface water has coexisted with volcanic activity. Chemoautothrophs might, therefore, have appeared as early as 3800 Ma ago.
Hydrothermal vents provide an extremely constrained and hazardous environment for life, dependent on the continued existence of the energy supply. A much more attractive alternative was to utilise the limitless availability of energy in the form of solar visible light. The most familiar of such reactions is the oxygenic photosynthesis of glucose summarised as follows:

The biochemical adaptation from thermal detection in hydrothermal vents to photosynthesis does not seem to have been insuperable,12 and it was thought that photosynthesising cyanobacteria (blue-green algae) may have existed 2700 Ma ago.13 However, it has recently been suggested that this crucial development may have occurred later, closer to 2400 Ma ago when oxygen first appeared in the atmosphere.14 At a later date, cyanobacteria underwent symbiotic incorporation into the cells of certain eukaryotes to become chloroplasts, which then conferred the biochemical benefits of photosynthesis on their hosts, which include all plants.
The Appearance of Oxygen in the Atmosphere
Oxygenic photosynthesis releases oxygen, apparently as a waste product. Initially it accumulated in the surface waters of the oceans, where it oxidised soluble ferrous iron (Fe2+), leached from basalt, which was then deposited as insoluble ferric iron oxide (Fe3+) in the vast so-called banded iron formations. This process prevented concentrations of oxygen in the atmosphere reaching 10−5 bar until about 2320 Ma ago.15 After the atmosphere attained a higher but critical level of oxygen about 1800 Ma ago, banded iron formations seldom appeared, and iron was thereafter deposited in red (ferric) beds.2
Oxygen continued to accumulate in the oceans and atmosphere, probably reaching a peak of 25–35% of an atmosphere 300 Ma ago16 (Figure 1.3). It then decreased to about 14%, contributing to the end-Permian mass extinction at the end of the Palaeozoic Era, about 250 Ma ago.2 Thereafter it rose slightly above the present atmospheric level for about 100 Ma.
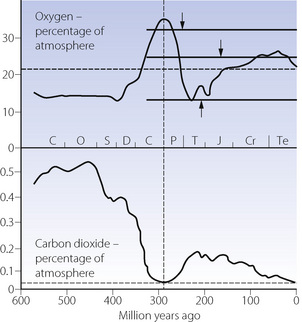
Fig. 1.3 Long-term changes in oxygen and carbon dioxide concentrations during the last 600 Ma. Broken horizontal lines show present atmospheric levels. The vertical broken line shows the Carboniferous/Permian boundary. The continuous horizontal lines with arrows show some oxygen limits suggested by the geological record of forest fires.2 Geological periods shown by their capital letters are: Cambrian, Ordovician, Silurian, Devonian, Carboniferous and Permian (Palaeozoic Era), and Triassic, Jurassic, Cretaceous (Mesozoic Era) and Tertiary. Recent research suggests levels of carbon dioxide may be slightly less than shown, but the nature of the changes is not in doubt.
(From Nunn,2 reproduced by permission of the Geologists’ Association).
Biological Consequences of an Oxidising Environment
It seems likely that the appearance of molecular oxygen in their environment would have been unwelcome to anaerobic organisms. Chapter 26 describes the toxicity of oxygen and its derived free radicals, against which primitive anaerobes would probably have had no defences. Three lines of response can be identified. Some anaerobes sought an anaerobic micro-environment in which to remain and survive. Others developed defences in depth against oxygen and its derived reactive species (page 385). The best response was the development of aerobic metabolism, which gave enormous energetic advantages over organisms relying on anaerobic metabolism (page 200). This required the symbiotic incorporation of purple bacteria which became mitochondria, and the increased availability of biological energy was essential for the evolution of all forms of life more complex than micro-organisms.
Photosynthesis and aerobic metabolism eventually established a cycle of energy exchange between plants and animals, with its ultimate energy input in the form of solar visible light, which was interrupted only under exceptional circumstances. Such circumstances included major meteor strikes and exceptional volcanic activity, both of which can throw vast quantities of persistent dust into the atmosphere and cause extinctions by blocking photosynthesis.
Changes in Carbon Dioxide Levels
After the major outgassing phase of the newly formed earth, the concentration of carbon dioxide in the atmosphere probably exceeded 90% of an atmosphere.17 It declined rapidly, due to weathering (CO2 + CaSiO3 → SiO2 + CaCO3) and photosynthesis, reaching about 0.5% at the time of the beginning of the overt fossil record, the Palaeozoic Era, from 570 Ma ago (Figure 1.3). A secondary major decline to near the present atmospheric level occurred during the Carboniferous Period, when the coal-forming forests involved photosynthesis and carbon burial on a massive scale. A sharp increase occurred at the end of the Permian Period (the last Period of the Palaeozoic Era) about 250 Ma ago, and carbon dioxide may have contributed to the end-Permian mass extinction. This coincided with the decrease in oxygen concentration mentioned above. Carbon dioxide concentrations rose to about 0.2% of an atmosphere just before 200 Ma ago, and then declined until about 20 Ma ago, when it entered a range of the order of 180–300 parts per million, volume (ppmv), which was not seriously exceeded until the last few decades.18
Carbon Dioxide and the Ice Ages
Carbon dioxide is a greenhouse gas, with a doubling of atmospheric concentration causing an increase in global average surface temperature ‘… likely to be in the range 2 to 4.5°C … values substantially higher than 4.5°C cannot be excluded.”19 DeConto cites the carbon dioxide threshold for Antarctic glaciation as 750 ppmv and for the northern hemisphere as 280 ppmv.18 However, there is also a periodicity in solar insolation (Milankovitch cycles) which initiates glacial and interglacial cycles. For the last 500 ka, the dominant cycle has been the degree of ellipticity of the Earth’s orbit, with a periodicity of about 100 ka, and its effect is very clear in the mean global temperature record for the last 420 ka derived from Antarctic ice cores (Figure 1.4).20
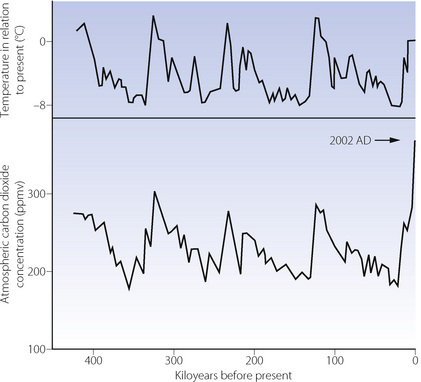
Fig. 1.4 General trends for temperature and atmospheric carbon dioxide concentration, obtained from ice cores from Vostok, Antarctica, for the last 420 000 years. In 2009 the atmospheric carbon dioxide concentration is expected to reach 387 ppmv (see Table 1.3).
(Data from Petit et al.20 and reproduced in part from reference 21, with the permission of the Editor of the Optimum Population Trust Journal.)
Figure 1.4 also shows a remarkably close correlation between temperature and the atmospheric concentration of carbon dioxide. Detailed analysis of time relations shows that the start of end-glacial warming usually preceded the start of the increase in carbon dioxide by a few thousand years. The initial warming released carbon dioxide from stores and then the increased carbon dioxide concentration provided powerful positive feed-back to temperature. The resultant warming is far greater than can be accounted for simply by the change in insolation.
Casual inspection of Figure 1.4 suggests that the next glacial period is overdue. However, it appears that the rhythmic changes in global mean temperature shown for the last 420 ka will not continue, as we now enter a long phase when the Earth’s orbit will remain almost circular. The 100 ka cycle will be in virtual abeyance for about 50 ka, during which there will be a prolonged interglacial.22 However, it is highly unlikely that mean global temperature will remain constant, due to the current increase in the atmospheric carbon dioxide concentration, unprecedented in the last 20 Ma.
Recent Changes in Carbon Dioxide Levels
Atmospheric carbon dioxide remained close to 280 ppmv from the beginning of the current interglacial until the start of the industrial revolution (AD 1750). In the next 200 years it increased to 310 ppmv which averaged 0.155 ppmv/yr (Table 1.3). The annual rate of increase rose progressively and, from AD 2000 to 2009, reached 1.89 ppmv/yr, which is nearly 200 times the rate during the rapid rewarming after the last glacial period (Figure 1.4).
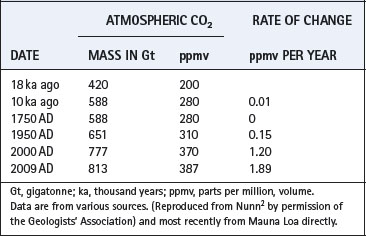
On this basis, extrapolation of trends from AD 1750 to the present suggests that the concentration might reach 1000 ppmv by the year AD 2100. This prediction is similar to computed predictions based on analysis of the many primary factors governing atmospheric CO2 concentrations.23 Thus we may expect to reach the highest concentration since 24 Ma ago, and above the threshold for Antarctic glaciations.18 Whether the rate of change continues its present exponential course is critically dependent on the continued efficiency of the global carbon sinks, and attempts to control emissions with all its current political uncertainty. The only certain limitation on emissions would seem to be exhaustion of the world’s fossil fuels. Global warming may have disturbing short term effects on ocean currents, particularly a weakening of the north Atlantic conveyor (including the Gulf Stream).24 This could result in a substantial cooling of north-western Europe.
The Greenhouse Effect
The balance of heat gain from solar radiation is the difference between incoming radiation, mainly in the visible wave lengths, and outgoing radiation which is largely infra-red. The latter is partially trapped in the troposphere, mainly by water vapour (60%) and carbon dioxide (25%). Atmospheric water vapour concentration increases with rising global temperature and therefore provides positive feed-back to global warming. It is estimated that the present greenhouse effect raises the mean surface temperature of the Earth by some 30°C. Carbon dioxide makes a major contribution to the very high surface temperature of Venus (480°C), hotter than Mercury but further from the Sun.
Other Greenhouse Gases
There are no infra-red absorption bands for water vapour and carbon dioxide between 7 and 13 μm wavelength, and heat loss in this band is considerable. It follows that any gas or vapour with strong infra-red absorption in this range will have a disproportionate greenhouse effect. Such a gas could be considered not so much as thickening the panes in the greenhouse as replacing a missing pane.
After water and carbon dioxide, the most important greenhouse gases are ozone (8% of total effect) and methane (3% of total effect) which is present in the atmosphere at a concentration of only 2 ppmv, but rapidly increasing: it absorbs infra-red some 25 times as effectively as carbon dioxide. Dissolved methane is currently escaping from lakes in the melting tundra, but of greater concern is the vast quantity of buried methane held at high pressure and low temperature in cages of water molecules, known as hydrates or clathrates. Massive escape from hydrates is thought to have been a major factor in the Palaeocene/Eocene Thermal Maximum, 55 Ma before present, with temperature rises of 5–6°C.25 Fortunately the half-life of methane in the atmosphere is only about six years. The chlorofluorocarbons (2% of total effect) absorb infra-red some 10 000 times as effectively as carbon dioxide, but present atmospheric concentrations are only of the order of 0.003 ppmv. However, with their long half life, they cannot be ignored. Nitrous oxide, mainly of biological origin, also makes a small contribution.
With Earth in an approximately circular orbit for the next 50 ka and solar gain likely to remain reasonably constant,22 greenhouse gases are now the major factors governing global temperature. Carbon dioxide is rising rapidly towards the highest levels in the last 24 Ma and water vapour will increase with rising temperature. The mean global temperature is predicted to increase to within 90% confidence limits of 1.5–4.5°C by AD 2100. Temperature has already increased by 0.6°C in the last century, mostly since 1950.26 Not the least serious consequence will be melting of polar ice which has the ultimate potential to raise sea level by 67 m. Sea level has been rising at about 1.8 mm/year since AD 1850 but, since 2004, there have been several reports of increased sea level rise up to 3.0 mm/year and predictions for 2100 indicate a total sea level rise for this century of 0.35–0.5 m.27
Turnover Rates of Atmospheric Gases
Biological and geological turnover rates of carbon dioxide are quantitatively totally different.2 Living organisms, the atmosphere and surface waters of the oceans contain about 2200 Gt (gigatonnes) of carbon. The annual exchange between photosynthesis and aerobic metabolism is approximately 100 Gt annually, with anthropogenic burning of fossil fuels and deforestation currently releasing about 8 Gt/year in 2002 as shown in Figure 1.5. The total release of carbon from burning and flaring of fossil fuels has now risen from 5 Gt/yr in 1983 to 7.7 Gt/yr in 2005, most of the increase since AD 2002 being attributable to China.
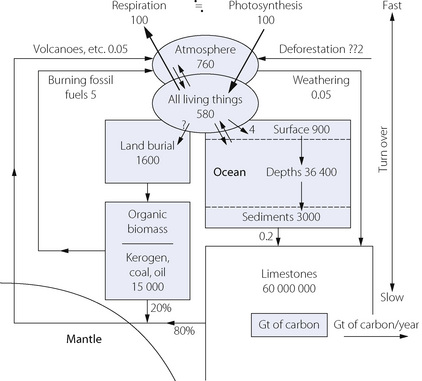
Fig. 1.5 Stores and turnover of carbon dioxide. Stores are in Gt (gigatonnes) and turnover in Gt per year. For recent increases in the burning of fossil fuels see text.
(After reference 2, where sources are cited. Reproduced by permission of the Geologists’ Association.)
In stark contrast, geological stores (ocean depths, organic biomass and limestone) have a carbon content in excess of 30 000 000 Gt, but with an annual turnover (volcanoes, weathering, etc.) of less than 0.1 Gt per year. Thus, long term changes are governed by the geological stores, while very rapid atmospheric changes can occur as a result of anthropogenic activity. Fossil fuels were buried over the course of 350 Ma, and probably all that is recoverable will be burned in 300 years.
Atmospheric stores of oxygen are almost 600 times greater than those for carbon dioxide. If oxygen decreases at the same rate as the current increase in carbon dioxide, it would take 40 000 years for sea level Po2 to fall to the level which pertains in Denver today.
Oxygen, Ozone and Ultraviolet Screening
In addition to its toxicity and potential for more efficient metabolism, oxygen had a profound effect on evolution by ultraviolet screening. Oxygen itself absorbs ultraviolet radiation to a certain extent, but ozone (O3) is far more effective. It is formed in the stratosphere from oxygen which undergoes photo-dissociation producing free oxygen atoms. The oxygen atoms then rapidly combine with oxygen molecules to form ozone thus:
The absolute quantity is very small, being the equivalent of a layer of pure ozone only a few millimetres thick. A Dobson unit of ozone is defined as the equivalent of a layer of pure ozone 0.01 mm thick. About 10% of the total atmospheric ozone is in the troposphere, mainly as a pollutant. This also acts as an ultraviolet screen and may become relatively more important in the years to come.
Life evolved in water which provided adequate screening from ultraviolet radiation. The first colonisation of dry land by plants and animals was in the late Silurian Period about 400 Ma years ago, and it has been suggested that this coincided with oxygen and ozone reaching concentrations at which the degree of ultraviolet shielding first permitted organisms to leave the shelter of an aqueous environment.
Ozone is in a state of dynamic equilibrium in the stratosphere and its concentration varies markedly from year to year, in addition to displaying a pronounced annual cycle. Ozone can be removed by the action of many free radicals including chlorine and nitric oxide. Highly reactive chlorine radicals cannot normally pass through the troposphere to reach the stratosphere, but the situation was disturbed by the manufacture of chlorofluorocarbons (e.g. CF2Cl2) for use as propellants and refrigerants. These compounds are highly stable in the troposphere with a half-life of the order of 100 years. This permits their diffusion through the troposphere to reach the stratosphere, where they undergo photodissociation to release chlorine radicals, which then react with ozone as follows:
Chlorine is recycled and it has been estimated that a single chlorine radical will destroy 10 000 molecules of ozone before it combines with hydrogen to form the relatively harmless hydrochloric acid. The Antarctic ‘hole’ in the ozone layer forms in October of each year, when spring sunlight initiates photo-chemical reactions. Minimal levels fell from 300 Dobson Units in 1960 to a lowest point (88) in 1995.28 Slight recovery to reach 100 had occurred by 2004.
Evolution and Adaptation
This chapter has outlined the environmental conditions and biological factors under which the atmosphere has evolved to its present composition. In the past, nothing has been permanent, and we can expect a continuation of the interaction between organisms and their environment. What is new is that one species now has the power to cause major changes in the environment, and the atmosphere in particular. These changes will affect a wide range of organisms, and result in the extinction of certain species.
References
1. Taylor SR. Solar system evolution. Cambridge: Cambridge University Press; 1992.
*2. Nunn JF. Evolution of the atmosphere. Proc Geol Assoc. 1998;109:1-13.
3. Nisbet EG, Sleep NH. The habitat and nature of early life. Nature. 2001;409:1083-1091.
4. Oró J. Early chemical stages in the origin of life. In: Bengston S, ed. Early Life on Earth. Nobel Symposium No. 84. New York: Columbia University Press; 1994:48-59.
5. MacDonald GA, Hubbard DH. Volcanoes of the National Parks in Hawaii, 6th ed. Honolulu: Hawaii Natural History Association; 1972.
6. Miller SL. A production of amino acids under possible primitive earth conditions. Science. 1953;117:528-529.
7. Chapman CR, Morrison D. Cosmic catastrophies. London: Plenum Press; 1989. 97
8. Malin MC, Edgett KS. Evidence of persistent flow and aqueous sedimentation on early Mars. Science. 2003;302:1931-1934.
9. Schorghofer N. Dynamics of ice ages on Mars. Nature. 2007;449:192-194.
10. Böhler C, Nielsen PE, Orgel LE. Template switching between PNA and RNA oligonucleotides. Nature. 1995;376:578-581.
11. Nisbet EG. Archaean ecology. In: Coward MP, Reis AC, editors. Early Precambrian Processes. London: Geological Society; 1995:27-51.
12. Nisbet EG. Origins of photosynthesis. Nature. 1995;373:479-480.
13. Kasting JF. The rise of atmospheric oxygen. Science. 2001;293:819-820.
*14. Rasmussen B, Fletcher IR, Brocks JJ, Kilburn MR. Reassessing the first appearance of eukaryotes and cyanobacteria. Nature. 2008;455:1101-1104.
15. Bekker A, Holland HD, Wang PL, et al. Dating the rise of atmospheric oxygen. Nature. 2004;427:117-120.
*16. Berner RA, Van den Brooks JM, Ward PD. Oxygen and evolution. Science. 2007;316:557-558.
17. Kaufman AJ, Xiao S. High CO2 levels in the Proterozoic atmosphere estimated from analyses of individual microfossils. Nature. 2003;425:279-282.
18. DeConto RM, Pollard D, Wilson PA, Pälike H, Lear CH, Pagani M. Thresholds for Cenozoic bipolar glaciation. Nature. 2008;455:652-656.
19. Christensen JH, Hewitson B, Busuioc A, et al. Regional climate projections, Climate Change, 2007: The Physical Science Basis. Contribution of Working group I to the Fourth Assessment Report of the Intergovernmental Panel on Climate Change. Cambridge: Cambridge University Press, 2007.
20. Petit JR, Jouzel J, Raynaud D, et al. Climate and atmospheric history of the past 420,000 years from the Vostok ice core, Antarctica. Nature. 1999;399:429-436.
21. Nunn JF. Climate change and sea level in relation to overpopulation. J Optimal Population Trust. 2004;4:3-9.
22. Loutre MF, Berger A. Future climatic changes: are we entering an exceptionally long interglacial? Climatic Change. 2000;46:61-90.
23. Jones CD. Meteorological Office, personal communication. 2005.
24. Broecker WS. Thermohaline circulation, the Achilles heel of our climate system: will man-made CO2 upset the current balance? Science. 1997;278:1582-1588.
25. Story M, Duncan RA, Swisher CC. Paleocene-Eocene thermal maximum and opening of the northeast Atlantic. Science. 2007;316:587-589.
26. Karl TR, Trenberth KE. Modern global climate change. Science. 2003;302:1719-1723.
27. Nunn JF. Climate change and rising sea level. Optimum Population Trust Journal. 2006;6:14-19.
28. Jones AE, Shanklin JD. Continued decline of total ozone over Halley, Antarctica, since 1985. Nature. 1995;376:409-411.