Chapter 11 Oxygen
 Oxygen moves down a partial pressure gradient between the inspired gas and its point of use in the mitochondria, where the oxygen partial pressure may be only 0.13 kPa (1 mmHg). Significant barriers to oxygen transfer are between inspired and alveolar gas, between alveolar and arterial oxygen partial pressures, and on diffusion from the capillary to the mitochondria. Each 100 ml of arterial blood carries 0.3 ml of oxygen in physical solution and around 20 ml of oxygen bound to haemoglobin, which reduces to around 15 ml.dl−1 in venous blood. Oxygen carriage by haemoglobin is influenced by carbon dioxide, pH, temperature and red blood cell 2,3-diphosphoglycerate; the molecular mechanism of haemoglobin is now well elucidated.
The appearance of oxygen in the atmosphere of the Earth has played a crucial role in the development of life (see Chapter 1). The whole of the animal kingdom is totally dependent on oxygen, not only for function but also for survival. This is notwithstanding the fact that oxygen is extremely toxic in the absence of elaborate defence mechanisms at a cellular level (see Chapter 26). Before considering the role of oxygen within the cell, it is necessary to bring together many strands from previous chapters and outline the transport of oxygen all the way from the atmosphere to the mitochondria.
The Oxygen Cascade
The Po2 of dry air at sea level is 21.2 kPa (159 mmHg). Oxygen moves down a partial pressure gradient from air, through the respiratory tract, the alveolar gas, the arterial blood, the systemic capillaries, the tissues and the cell. It finally reaches its lowest level in the mitochondria where it is consumed (Figure 11.1). At this point, the Po2 is probably within the range 0.5–3 kPa (3.8–22.5 mmHg), varying from one tissue to another, from one cell to another, and from one region of a cell to another.
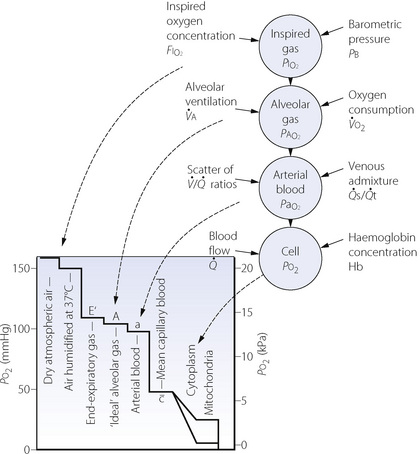
Fig. 11.1 On the left is shown the oxygen cascade with Po2 falling from the level in the ambient air down to the level in mitochondria. On the right is a summary of the factors influencing oxygenation at different levels in the cascade.
The steps by which the Po2 decreases from air to the mitochondria are known as the oxygen cascade and are of great practical importance. Any one step in the cascade may be increased under pathological circumstances and this may result in hypoxia. The steps will now be considered seriatim.
Dilution of Inspired Oxygen by Water Vapour
The normally quoted value for the concentration of atmospheric oxygen (20.94% or 0.2094 fractional concentration) indicates the concentration of oxygen in dry gas. As gas is inhaled through the respiratory tract, it becomes humidified at body temperature and the added water vapour dilutes the oxygen and so reduces the Po2 below its level in the ambient air. When dry gas at normal barometric pressure becomes fully saturated with water vapour at 37°C, 100 volumes of the dry gas take up about 6 volumes of water vapour, giving a total gas volume of 106 units but containing the same number of molecules of oxygen. The Po2 is thus reduced by the fraction 6/106. It follows from Boyle’s law that Po2 after humidification is indicated by the following expression:
(the quantity in parentheses is known as the dry barometric pressure). Therefore the effective Po2 of inspired air at a body temperature of 37°C is:
or, in mmHg:
Primary Factors Influencing Alveolar Oxygen Tension
Dry barometric pressure. If other factors remain constant, the alveolar Po2 will be directly proportional to the dry barometric pressure. Thus with increasing altitude, alveolar Po2 falls progressively to become zero at 19 kilometres where the actual barometric pressure equals the saturated vapour pressure of water at body temperature (see Table 17.1). The effect of increased pressure is complex (see Chapter 18), for example, a pressure of 10 atmospheres (absolute) increases the alveolar Po2 by a factor of about 15 if other factors remain constant (see Table 18.1).
Inspired oxygen concentration. The alveolar Po2 will be raised or lowered by an amount equal to the change in the inspired gas Po2, provided that other factors remain constant. Because the concentration of oxygen in the inspired gas should always be under control, it is a most important therapeutic tool that may be used to counteract a number of different factors that may impair oxygenation.
Figure 11.2 shows the effect of an increase in the inspired oxygen concentration from 21% to 30% on the relationship between alveolar Po2 and alveolar ventilation. For any alveolar ventilation, the improvement of alveolar Po2 will be 8.5 kPa (64 mmHg). This will be of great importance if, for example, hypoventilation while breathing air has reduced the alveolar Po2 to 4 kPa (30 mmHg), a value that presents a significant threat to life. Oxygen enrichment of inspired gas to 30% will then increase the alveolar Po2 to 12.5 kPa (94 mmHg), which is almost within the normal range. However, at this level of hypoventilation, arterial Pco2 would be about 13 kPa (98 mmHg) and might well have risen further on withdrawal of the hypoxic drive to ventilation. In fact, 30% is the maximum concentration of oxygen in the inspired gas that should be required to correct the alveolar Po2 of a patient breathing air, who has become hypoxaemic purely as a result of hypoventilation. This problem is discussed further in Chapter 27 (pages 399 et seq).
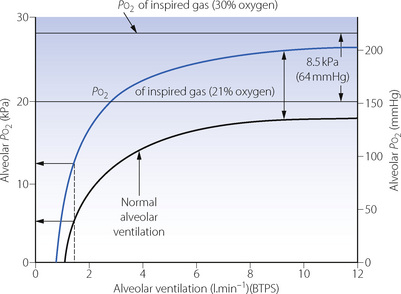
Fig. 11.2 The effect on alveolar Po2 of increasing the inspired oxygen concentration from 21% (black curve) to 30% (blue curve). In this example, the alveolar Po2 is reduced to a dangerously low level when breathing air at an alveolar minute ventilation of 1.5 l.min−1. In this situation, oxygen enrichment of the inspired gas to 30% is sufficient to raise the alveolar Po2 almost to within the normal range. Oxygen consumption is assumed to be 200 ml.min−1 (STPD).
An entirely different problem is hypoxaemia due to venous admixture. This results in an increased alveolar/arterial Po2 difference, which, within limits, can be offset by increasing the alveolar Po2. Quantitative aspects are quite different from the problem of hypoventilation and are considered later in this chapter.
Oxygen consumption. In the past there has been an unfortunate tendency to consider that all patients consume 250 ml of oxygen per minute under all circumstances. Oxygen consumption must, of course, be raised by exercise but is often well above basal in a patient supposedly ‘at rest’. This may be due to restlessness, pain, increased work of breathing, shivering or fever. These factors may well coexist with failure of other factors controlling the arterial Po2. Thus, for example, a patient may be caught by the pincers of a falling ventilatory capacity and a rising ventilatory requirement (see Figure 27.4).
Figure 11.3 shows the effect of different values for oxygen consumption on the relationship between alveolar ventilation and alveolar Po2 for a patient breathing air and clearly shows the potential for an increase in oxygen consumption to cause hypoxia. Altered oxygen consumption is very common in patients, being substantially increased with sepsis, thyrotoxicosis or convulsions, the first of which may lead to difficulties with weaning patients from artificial ventilation (page 474). Oxygen consumption is reduced with general anaesthesia, hypothyroidism or hypothermia, the last of which causes a marked reduction in oxygen consumption with values of about 50% of normal at 31°C.
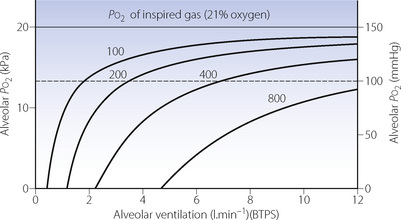
Fig. 11.3 The relationship between alveolar ventilation and alveolar Po2 for different values of oxygen consumption for a patient breathing air at normal barometric pressure. The figures on the curves indicate the oxygen consumption in ml.min−1 (STPD). A value of 100 ml.min−1 is typical of a hypothermic patient at 30°C; 200 ml.min−1 a normal subject at rest or during anaesthesia; higher values result from exercise or fever. Note that the alveolar ventilation required to maintain any particular alveolar Po2 is directly proportional to the oxygen consumption. (In calculations of this type it is important to make the correction required by the fact that oxygen consumption and alveolar ventilation values are commonly expressed at different temperatures and pressures – see Appendix C.)
Alveolar ventilation. The alveolar air equation (page 139) implies a hyperbolic relationship between alveolar Po2 and alveolar ventilation. This relationship, which is considered in Appendix E, is clinically very important. As ventilation is increased, the alveolar Po2 rises asymptomatically towards (but never reaches) the Po2 of the inspired gas (Figure 11.2). It will be seen from the shape of the curves that changes in ventilation above the normal level have comparatively little effect on alveolar Po2. In contrast, changes in ventilation below the normal level may have a very marked effect. At very low levels of ventilation, the alveolar ventilation becomes critical and small changes may precipitate severe hypoxia. Note that there is a finite alveolar ventilation at which alveolar Po2 becomes zero.
Secondary Factors Influencing Alveolar Oxygen Tension
Cardiac output. In the short term, cardiac output can influence the alveolar Po2. For example, if other factors remain constant, a sudden reduction in cardiac output will temporarily increase the alveolar Po2, because less blood passes through the lungs to remove oxygen from the alveolar gas. However, the reduced cardiac output also causes increased oxygen extraction in the tissues supplied by the systemic circulation, and before long the mixed venous oxygen level decreases. When that has happened, the removal of oxygen from the alveolar gas returns to its original level as the reduction in blood flow rate is compensated by the greater amount of oxygen that is taken up per unit volume of blood flowing through the lungs. Thus, in the long term, cardiac output does not directly influence the alveolar Po2, and therefore it does not appear in the alveolar air equation.
The ‘concentration’, third gas or Fink effect. The diagrams and equations above have ignored a factor that influences alveolar Po2 during exchanges of large quantities of soluble gases such as nitrous oxide. This effect was mentioned briefly in connection with carbon dioxide on page 169 but its effect on oxygen is probably more important. During the early part of the administration of nitrous oxide, large quantities of the more soluble gas replace smaller quantities of the less soluble nitrogen previously dissolved in body fluids. There is thus a net transfer of ‘inert’ gas from the alveoli into the body, causing a temporary increase in the alveolar concentration of both oxygen and carbon dioxide, which will thus temporarily exert a higher partial pressure than would otherwise be expected. Conversely, during recovery from nitrous oxide anaesthesia, large quantities of nitrous oxide leave the body to be replaced with smaller quantities of nitrogen. There is thus a net outpouring of ‘inert’ gas from the body into the alveoli, causing dilution of oxygen and carbon dioxide, both of which will temporarily exert a lower partial pressure than would otherwise be expected. There may then be temporary hypoxia, the direct reduction of alveolar Po2 sometimes being exacerbated by ventilatory depression due to decreased alveolar Pco2. Fortunately such effects last only a few minutes and hypoxia can easily be avoided by small increases in the inspired oxygen concentration when nitrous oxide administration is stopped.
The Alveolar/Arterial Po2 Difference
The next step in the oxygen cascade is of great clinical relevance. In the healthy young adult breathing air, the alveolar/arterial Po2 difference does not exceed 2 kPa (15 mmHg) but it may rise to above 5 kPa (37.5 mmHg) in aged but healthy subjects. These values may be exceeded in a patient with any lung disease that causes shunting or mismatching of ventilation to perfusion. An increased alveolar/arterial Po2 difference is the commonest cause of arterial hypoxaemia in clinical practice and it is therefore a very important step in the oxygen cascade.
Unlike the alveolar Po2, the alveolar/arterial Po2 difference cannot be predicted from other more easily measured quantities. There is no simple means of knowing the magnitude of the alveolar/arterial Po2 difference in a particular patient other than by measurement of the arterial blood gas tensions and calculation of alveolar Po2. Therefore, it is particularly important to understand the factors that influence the difference, and the principles of restoration of arterial Po2 by increasing the inspired oxygen concentration when hypoxia is due to an increased alveolar/arterial Po2 difference.
Factors Influencing the Magnitude of the Alveolar/Arterial Po2 Difference
In Chapter 8 it was explained how the alveolar/arterial Po2 difference results from venous admixture (or physiological shunt) which consists of two components: (1) shunted venous blood that mixes with the oxygenated blood leaving the pulmonary capillaries; (2) a component due to scatter of ventilation/perfusion ratios in different parts of the lungs. Any component due to impaired diffusion across the alveolar/capillary membrane is likely to be very small and in most circumstances can probably be ignored.
Figure 8.10 shows the derivation of the following axiomatic relationship for the first component, shunted venous blood:
 ) is, in practice, calculated on the basis of the end-capillary oxygen tension (
 ) being equal to the ‘ideal’ alveolar Po2 which is derived by means of the alveolar air equation (see page 139).
The equation may be cleared and solved for the pulmonary end-capillary/arterial oxygen content difference as follows:
(scaling factors are required to correct for the inconsistency of the units which are customarily used for the quantities in this equation).
 is the arterial/mixed venous oxygen content difference and is a function of the oxygen consumption and the cardiac output thus
Substituting for  in equation (1), we have:
This equation shows the content difference in terms of oxygen consumption ( ), the venous admixture (
 ) and the cardiac output (
 ).
).
The final stage in the calculation is to convert the end-capillary/arterial oxygen content difference to the partial pressure difference. The oxygen content of blood is the sum of the oxygen in physical solution and that which is combined with haemoglobin:

where: α is the solubility coefficient of oxygen in blood (not plasma); So2 is the haemoglobin saturation, and varies with Po2 according to the oxygen dissociation curve, which itself is influenced by temperature, pH and base excess (Bohr effect); [Hb] is the haemoglobin concentration (g.dl−1); 1.39 is the volume of oxygen (ml) that has been found to combine with 1 g of haemoglobin (page 189). Carriage of oxygen in the blood is discussed in detail on pages 187 et seq.
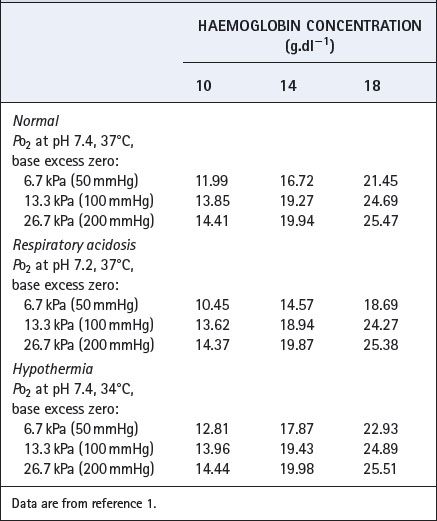
Derivation of the oxygen content from the Po2 is laborious if due account is taken of pH, base excess, temperature and haemoglobin concentration. Derivation of Po2 from content is even more laborious, as an iterative approach is required. Tables of partial pressure/content relationships therefore need to be used, and Table 11.1 is an extract from one such table to show the format and general influence of the several variables.1
The principal factors influencing the magnitude of the alveolar/arterial Po2 difference caused by venous admixture may be summarised as follows.
The magnitude of the venous admixture increases the alveolar/arterial Po2 difference with direct proportionality for small shunts, although this is lost with larger shunts (Figure 11.4). The resultant effect on arterial Po2 is shown in Figure 8.11. Different forms of venous admixture are considered on pages 133 et seq.
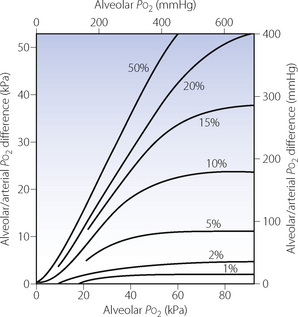
Fig. 11.4 Influence of shunt on alveolar/arterial Po2 difference at different levels of alveolar Po2. Figures in the graph indicate shunt as percentage of total pulmonary blood flow. For small shunts, the difference (at constant alveolar Po2) is roughly proportional to the magnitude of the shunt. For a given shunt, the alveolar/arterial Po2 difference increases with alveolar Po2 in a non-linear manner governed by the oxygen dissociation curve. At high alveolar Po2, a plateau of alveolar/arterial Po2 difference is reached, but the alveolar Po2 at which the plateau is reached is higher with larger shunts. Note that, with a 50% shunt, an increase in alveolar Po2 produces an almost equal increase in alveolar/arterial Po2 difference. Therefore, the arterial Po2 is virtually independent of changes in alveolar Po2, if other factors remain constant. Constants incorporated into the diagram: arterial/venous oxygen content difference, 5 ml.dl−1; Hb concentration 14 g.dl−1; temperature of blood, 37°C; pH of blood, 7.40; base excess, zero.
 scatter. It was explained in Chapter 8 that scatter in ventilation/perfusion ratios produces an alveolar/arterial Po2 difference for the following reasons:
 ratio. The smaller amount of blood flowing through areas of high
  ratio cannot compensate for this (see Figure 8.12).
 ratio tends to be greater than the rise in saturation of blood from areas of correspondingly high
  (see Figure 8.13).
These two reasons in combination explain why blood from alveoli with a high  ratio cannot compensate for blood from alveoli with a low
  ratio.
The actual alveolar Po2 has a profound but complex and non-linear effect on the alveolar/arterial Po2 gradient (see Figure 11.4). The alveolar/arterial oxygen content difference for a given shunt is uninfluenced by the alveolar Po2 (equation 3), and the effect on the partial pressure difference arises entirely in conversion from content to partial pressure: it is thus a function of the slope of the dissociation curve at the Po2 of the alveolar gas. For example, a loss of 1 ml per 100 ml of oxygen from blood with a Po2 of 93 kPa (700 mmHg) causes a fall of Po2 of about 43 kPa (325 mmHg), most of the oxygen being lost from physical solution. However, if the initial Po2 were 13 kPa (100 mmHg), a loss of 1 ml per 100 ml would cause a fall of Po2 of only 4.6 kPa (35 mmHg), most of the oxygen being lost from combination with haemoglobin. If the initial Po2 is only 6.7 kPa (50 mmHg), a loss of 1 ml per 100 ml would cause a very small change in Po2 of the order of 0.7 kPa (5 mmHg), drawn almost entirely from combination with haemoglobin at a point where the dissociation curve is steep.
The quantitative considerations outlined in the previous paragraph have most important clinical implications. Figure 11.4 clearly shows that, for the same degree of shunt, the alveolar/arterial Po2 difference will be greatest when the alveolar Po2 is highest. If the alveolar Po2 is reduced (e.g. by underventilation), the alveolar/arterial Po2 gradient will also be diminished if other factors remain the same. The arterial Po2 thus falls less than the alveolar Po2. This is fortunate and may be considered as one of the many benefits deriving from the shape of the oxyhaemoglobin dissociation curve. With a 50% venous admixture, changes in the alveolar Po2 are almost exactly equal to the resultant changes in the alveolar/arterial Po2 difference (Figure 11.4). Therefore the arterial Po2 is almost independent of changes in alveolar Po2 and administration of oxygen will do little to relieve hypoxia (see Figure 8.11).
Cardiac output changes have extremely complex effects on the alveolar/arterial Po2 difference. The Fick relationship (equation 2, page 183) tells us that a reduced cardiac output per se must increase the arterial/mixed venous oxygen content difference if the oxygen consumption remains the same. This means that the shunted blood will be more desaturated, and will therefore cause a greater decrease in the arterial oxygen level than would less desaturated blood flowing through a shunt of the same magnitude. Equation (3) shows an inverse relationship between the cardiac output and the alveolar/arterial oxygen content difference if the venous admixture is constant (Figure 11.5B). However, when the content difference is converted to partial pressure difference, the relationship to cardiac output is no longer truly inverse, but assumes a complex non-linear form in consequence of the shape of the oxyhaemoglobin dissociation curve. An example of the relationship between cardiac output and alveolar/arterial Po2 difference is shown in Figure 11.5A but this applies only to the conditions specified, with an alveolar Po2 of 24 kPa (180 mmHg).
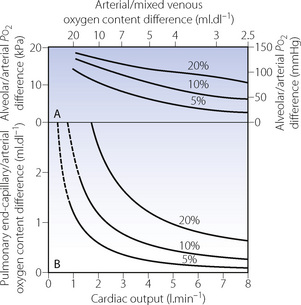
Fig. 11.5 Influence of cardiac output on the alveolar/arterial Po2 difference in the presence of shunts (values indicated for each curve). In this example it is assumed that the patient has an oxygen consumption of 200 ml.min−1 and an alveolar Po2 of 24 kPa (180 mmHg). Changes in cardiac output produce an inverse change in the pulmonary end-capillary/arterial oxygen content difference (graph B). When converted to partial pressure differences, the inverse relationship is distorted by the effect of the oxygen dissociation curve in a manner that is applicable only to the particular alveolar Po2 of the patient (graph A). (Alveolar Po2 is assumed to equal pulmonary end-capillary Po2.)
Unfortunately the influence of cardiac output is even more complicated because it has been observed that a reduction in cardiac output is almost always associated with a reduction in the shunt fraction. Conversely an increase in cardiac output usually results in an increased shunt fraction. This approximately counteracts the effect on mixed venous desaturation, so that arterial Po2 tends to be relatively little influenced by changes in cardiac output (see Chapter 8, page 134). Nevertheless, it must be remembered that, even if the arterial Po2 is unchanged, the oxygen delivery (flux) will be reduced in proportion to the change in cardiac output.
Temperature, pH and base excess of the patient’s blood influence the oxyhaemoglobin dissociation curve (page 192). In addition, temperature affects the solubility coefficient of oxygen in blood. Thus all three factors influence the relationship between partial pressure and content (see Table 11.1), and therefore the effect of venous admixture on the alveolar/arterial Po2 difference, although the effect is not usually important except in extreme deviations from normal.
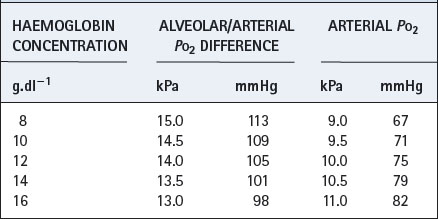
Haemoglobin concentration influences the partition of oxygen between physical solution and chemical combination. Although the haemoglobin concentration does not influence the pulmonary end-capillary/arterial oxygen content difference (equation 3), it does alter the partial pressure difference. An increased haemoglobin concentration causes a small decrease in the alveolar/arterial Po2 difference. Table 11.2 shows an example with a cardiac output of 5 l.min−1, oxygen consumption of 200 ml.min−1 and a venous admixture of 20%. This would result in a pulmonary end-capillary/arterial oxygen content difference of 0.5 ml per 100 ml. Assuming an alveolar Po2 of 24 kPa (180 mmHg), the alveolar/arterial Po2 difference is influenced by haemoglobin concentration as shown in Table 11.2. (Different figures would be obtained by selection of a different value for alveolar Po2.)
Table 11.2 Effect of different haemoglobin concentrations on the arterial Po2 under venous admixture conditions defined in the text
Alveolar ventilation. The overall effect of changes in alveolar ventilation on the arterial Po2 presents an interesting problem and serves to illustrate the integration of the separate aspects of the factors discussed above. An increase in the alveolar ventilation may be expected to have the following results.
Thus an increase in alveolar ventilation may be expected to increase both the alveolar Po2 and the alveolar/arterial Po2 difference. The resultant change in arterial Po2 will depend upon the relative magnitude of the two changes. Figure 11.6 shows the changes in arterial Po2 caused by variations of alveolar ventilation at an inspired oxygen concentration of 30% in the presence of varying degrees of venous admixture, assuming that cardiac output is influenced by Pco2 as described in the legend. Up to an alveolar ventilation of 1.5 l.min−1, an increase in ventilation will always raise the arterial Po2. Beyond that, in the example cited, further increases in alveolar ventilation will increase the arterial Po2 only if the venous admixture is less than 3 per cent. For larger values of venous admixture, the increase in the alveolar/arterial Po2 difference exceeds the increase in the alveolar Po2 and the arterial Po2 is thus decreased.
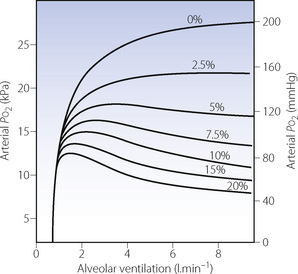
Fig. 11.6 The effect of alveolar ventilation on arterial Po2 is the algebraic sum of the effect upon the alveolar Po2 (Figure 11.2) and the consequent change in alveolar/arterial Po2 difference (Figure 11.4). When the increase in the latter exceeds the increase in the former, the arterial Po2 will be diminished. The figures in the diagram indicate the percentage venous admixture. The curve corresponding to 0% venous admixture will indicate alveolar Po2. Constants incorporated in the design of this figure: inspired O2 concentration, 30%; O2 consumption, 200 ml.min−1; respiratory exchange ratio, 0.8. It has been assumed that the cardiac output is influenced by the Pco2 according to the equation  = 0.039 × Pco2 + 2.23 (mmHg).
(After reference 2 by permission of the Editor of British Journal of Anaesthesia and Oxford University Press.)
Compensation for Increased Alveolar/Arterial Po2 Difference by Raising the Inspired Oxygen Concentration
Many patients with severe respiratory dysfunction are hypoxaemic while breathing air. The main objective of treatment is clearly to remove the cause of the hypoxaemia but, when this is not immediately possible, it is often possible to relieve the hypoxaemia by increasing the inspired oxygen concentration. The principles for doing so depend upon the cause of the hypoxaemia. As a broad classification, hypoxaemia may be due to hypoventilation or to venous admixture or to a combination of the two. When hypoxaemia is primarily due to hypoventilation, and when it is not appropriate or possible to restore normal alveolar ventilation, the arterial Po2 can usually be restored by elevation of the inspired oxygen within the range 21–30% as explained above (page 181 and Figure 11.2) and also in Chapter 27.
Quantitatively, the situation is entirely different when hypoxaemia is primarily due to venous admixture. It is then only possible to restore the arterial Po2 by oxygen enrichment of the inspired gas when the venous admixture does not exceed the equivalent of a shunt of 30% of the cardiac output, and at this level may require up to 100% inspired oxygen (page 135). The quantitative aspects of the relationship are best considered in relation to the iso-shunt diagram (see Figure 8.11).
The Carriage of Oxygen in the Blood
The preceding section has considered in detail the factors that influence the Po2 of the arterial blood. It is now necessary to consider how oxygen is carried in the blood and, in particular, the relationship between the Po2 and the quantity of oxygen that is carried. The latter is crucially important to the delivery of oxygen and is no less important than the partial pressure at which it becomes available to the tissue.
Oxygen is carried in the blood in two forms. Much the greater part is in reversible chemical combination with haemoglobin, while a smaller part is in physical solution in plasma and intracellular fluid. The ability to carry large quantities of oxygen in the blood is of great importance to the organism. Without haemoglobin the amount carried would be so small that the cardiac output would need to be increased by a factor of about 20 to give an adequate delivery of oxygen. Under such a handicap, animals could not have developed to their present extent. The biological significance of the haemoglobin-like compounds is thus immense. It is interesting that the tetrapyrrole ring, which contains iron in haemoglobin is also a constituent of chlorophyll (which has magnesium in place of iron) and the cytochromes responsible for cellular oxygen metabolism. This chemical structure is thus concerned with production, transport and utilisation of oxygen.
Physical Solution of Oxygen in Blood3
Oxygen is carried in physical solution in both red blood cells (RBCs) and plasma. There does not appear to have been any recent determination of the solubility coefficient, and we tend to rely on earlier studies indicating that the amount carried in normal blood in solution at 37°C is about 0.0232 ml.dl−1.kPa−1 or 0.00314 ml.dl−1.mmHg−1. At normal arterial Po2, the oxygen in physical solution is thus about 0.25–0.3 ml.dl−1, or rather more than 1% of the total oxygen carried in all forms. However, when breathing 100% oxygen, the level rises to about 2 ml.dl−1. Breathing 100% oxygen at 3 atmospheres pressure absolute (303 kPa), the amount of oxygen in physical solution rises to about 6 ml.dl−1, which is sufficient for the normal resting arteriovenous extraction. The amount of oxygen in physical solution rises with decreasing temperature for the same Po2.
Haemoglobin4
The haemoglobin molecule consists of four protein chains, each of which carries a haem group (Figure 11.7A), the total molecular weight being 64 458. In the commonest type of adult human haemoglobin (HbA) there are two types of chain, two of each occurring in each molecule. The two α-chains each have 141 amino acid residues, with the haem attached to a histidine residue occupying position 87. The two β-chains each have 146 amino acid residues, with the haem attached to a histidine residue occupying position 92. Figure 11.7B shows details of the point of attachment of the haem in the α-chain.
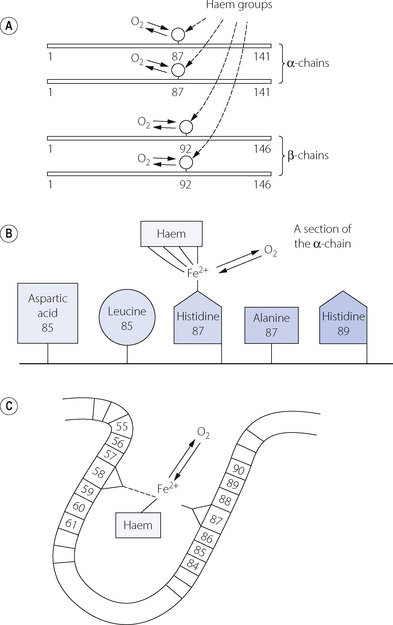
Fig. 11.7 The haemoglobin molecule consists of four amino acid chains, each carrying a haem group. (A) There are two pairs of identical chains: α-chains each with 141 amino acid residues and β-chains each with 146 amino acid residues. (B) The attachment of the haem group to the α-chain. (C) The crevice that contains the haem group.
Molecular Mechanisms of Oxygen Binding4,5
The four chains of the haemoglobin molecule lie in a ball, like a crumpled necklace. However, the form is not random and the actual shape (the quaternary structure) is of critical importance and governs the reaction with oxygen. The shape is maintained by loose (electrostatic) bonds between specific amino acids on different chains and also between some amino acids on the same chain. One consequence of these bonds is that the haem groups lie in crevices formed by electrostatic bonds between the haem groups and histidine residues, other than those to which they are attached by normal valency linkages. For example, Figure 11.7C shows a section of an alpha chain with the haem group attached to the iron atom, which is bound to the histidine residue in position 87. However, the haem group is also attached by an electrostatic bond to the histidine residue in position 58 and also by non-polar bonds to many other amino acids. This forms a loop and places the haem group in a crevice, the shape of which controls the ease of access for oxygen molecules.
In deoxyhaemoglobin, the electrostatic bonds within and between the protein chains are strong, holding the haemoglobin molecule in a tense (T) conformation, in which the molecule has a relatively low affinity for oxygen. In oxyhaemoglobin the electrostatic bonds are weaker, and the haemoglobin adopts its relaxed (R) state, in which the crevices containing the haem groups can open and bind oxygen, and the molecule’s affinity for oxygen becomes 500 times greater than in the T state. Binding of oxygen to just one of the four protein chains induces a conformational change in the whole haemoglobin molecule, which increases the affinity of the other protein chains for oxygen. This ‘cooperativity’ between oxygen binding sites is fundamental to the physiological role of haemoglobin, and affects the kinetics of the reaction between haemoglobin and oxygen, which are described below. The conformational state (R or T) of the haemoglobin molecule is also altered by other factors that influence the strength of the electrostatic bonds; such factors include carbon dioxide, pH and temperature.
The Bohr effect describes the alteration in haemoglobin oxygen affinity that arises from changes in hydrogen ion or carbon dioxide concentrations, and is generally considered in terms of its influence upon the dissociation curve (see Figure 11.10 below). Changes in pH affect the numerous electrostatic bonds that maintain the quaternary structure of haemoglobin, and so stabilises the molecule in the T conformation, reducing its affinity for oxygen. Similarly, carbon dioxide binds to the N-terminal amino acid residues of the α-chain to form carbaminohaemoglobin (page 162), and this small alteration in the function of the protein chains stabilises the T conformation and facilitates release of the oxygen molecule from haemoglobin.
Conversely, the Haldane effect describes the smaller amount of carbon dioxide that can be carried in oxygenated blood compared with deoxygenated blood (page 162). Crystallographic studies have shown that in deoxyhaemoglobin the histidine in position 146 of the β-chain is loosely bonded to the aspartine residue at position 94, and that when haemoglobin binds oxygen and changes to the R conformation the histidine 146 moves 10 Å further away from the aspartine, which is sufficient distance to change its pK value.6 Once again, this small change in one area of the β-chains has widespread effects on electrostatic bonds throughout the molecule, changing the quaternary structure of the entire molecule and altering its ability to buffer hydrogen ions and form carbamino compounds with carbon dioxide.
Oxygen-binding capacity of haemoglobin (Bo2) or Hüfner constant. Following the determination of the molecular weight of haemoglobin, the theoretical value for Bo2 of 1.39 ml.g−1 was easily derived (4 moles of oxygen of 22 414 ml STPD each bind to 1 mole of haemoglobin with molecular mass 64 458 g) and passed into general use. However, it gradually became clear that this value was not obtained when direct measurements of haemoglobin concentration and oxygen capacity were compared. Gregory in 1974 proposed the value of 1.306 ml g−1 for human adult blood,7 and just a few years later two studies8,9 reported values of 1.36 and 1.368 ml.g−1. The difference between the theoretical and in vivo values results from the presence of dyshaemoglobins,3,10 which includes any form of haemoglobin that lacks oxygen binding capacity, the most common being methaemoglobin (metHb) and carboxyhaemoglobin (COHb). If the dyshaemoglobins are taken into account, then the theoretical value for Hüfner’s constant may be used and the oxygen binding capacity for the blood sample (Bo2) calculated as:

where tHb = total haemoglobin present in the sample.
Current blood gas analysers routinely measure all four forms of haemoglobin that make up the majority of tHb in blood i.e. oxyhaemoglobin (O2Hb), deoxyhaemoglobin (HHb), metHb and COHb. If the first two of these have been measured, then the dyshaemoglobins can be excluded completely and the calculation of Bo2 becomes even simpler:

Kinetics of the Reaction of Oxygen with Haemoglobin
Adair first proposed in 1925 that the binding of oxygen to haemoglobin proceeds in four separate stages:11
For each of the four reactions there are two velocity constants with small k indicating the reverse reaction (towards deoxyhaemoglobin) and small k prime (k′) indicating the forward reaction. Large K is used to represent the ratio of the forward and reverse reactions, thus for example K1 = k′1/k1. In this way, the dissociation between deoxy- and oxyhaemoglobin may be represented by the four velocity constants K1–K4.
The Adair equation described assumes that the α- and β-chains of haemoglobin behave identically in their chemical reactions with oxygen, which is unlikely in vivo. When α- and β-chains are taken into account there are many different reaction routes that may be followed between deoxy- and oxy-haemoglobin, in theory giving rise to 16 different reversible reactions (Figure 11.8).12 However, the multiple separate forward and reverse reactions can again be combined to give a single value for K, which does not differ significantly from those obtained using the simpler Adair equation.
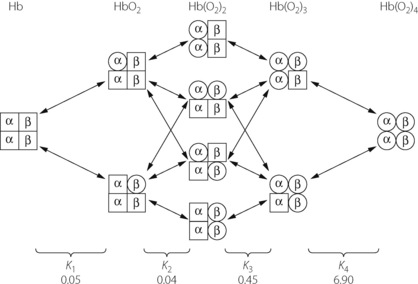
Fig. 11.8 Oxygenation of tetrameric haemoglobin. If chemical interactions with oxygen differ between α- and β-chains then the transition from deoxyhaemoglobin to fully oxygenated haemoglobin can take a variety of routes as shown. Arrows indicate the 16 possible separate dissociation equilibria, which must be combined to derive the four Adair constants K1–K4, the values of which are indicated. It can be clearly seen that the final stage of oxygenation is considerably faster than the previous three.12
In both cases, the separate velocity constants have been measured12 and values for K1–K4 are shown in Figure 11.8. It can be seen that the last reaction has a forward velocity that is many times higher than that of the other reactions. During the oxygenation of the final 25% of deoxyhaemoglobin, the last reaction will predominate and the high velocity constant counteracts the effect of the ever-diminishing number of oxygen binding sites that would otherwise slow the reaction rate by the law of mass action. The magnitude of the forward reaction for K4 also explains why the dissociation of oxyhaemoglobin is somewhat slower than its formation.
The velocity constant of the combination of carbon monoxide with haemoglobin is of the same order, but the rate of dissociation of carboxyhaemoglobin is extremely slow by comparison.
The Oxyhaemoglobin Dissociation Curve
As a result of the complex kinetics of the chemical reaction between oxygen and haemoglobin, the relationship between Po2 and percentage saturation of haemoglobin is non-linear, and the precise form of the non-linearity is of fundamental biological importance. It is shown, under standard conditions, in graphical form for adult and fetal haemoglobin and also for myoglobin and carboxyhaemoglobin in Figure 11.9.
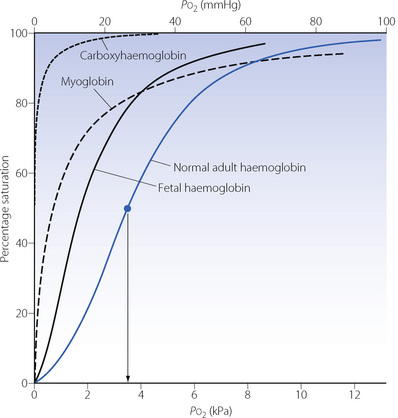
Fig. 11.9 Dissociation curves of normal adult and fetal haemoglobins. Curves for myoglobin and carboxyhaemoglobin are shown for comparison. The arrow shows the P50 for this curve which is the oxygen tension at which the Hb saturation is 50%. Note: (1) Fetal haemoglobin is adapted to operate at a lower Po2 than adult blood. (2) Myoglobin approaches full saturation at Po2 levels normally found in voluntary muscle (2–4 kPa, 15–30 mmHg); the bulk of its oxygen can only be released at very low Po2 during exercise. (3) Carboxyhaemoglobin can be dissociated only by the maintenance of very low levels of Pco.
Equations to represent the dissociation curve. An ‘S’ shaped oxyhaemoglobin dissociation curve was first described by Bohr in 1904 (page 241, Figure 13.11). Adair11 and Kelman13 subsequently developed equations that would reproduce the observed oxygen dissociation curve, using a variety of coefficients. Kelman’s equation, which uses seven coefficients, generates a curve indistinguishable from the true curve above a Po2 of about 1 kPa (7.5 mmHg) and this has remained the standard. Calculation of Po2 from saturation requires an iterative approach, but saturation may be conveniently determined from Po2 by computer, a calculation that is automatically carried out by most blood gas analysers in clinical use. The following simplified version of the Kelman equation is convenient to use and yields similar results at Po2 values above 4 kPa (30 mmHg):14
(Po2 values here are in kilopascals; So2 is percentage)
This equation takes no account of the position of the dissociation curve as described in the next section, so must be used with caution in clinical situations.
Factors Causing Displacement of the Dissociation Curve
Several physiological and pathological changes to blood chemistry cause the normal dissociation curve to be displaced in either direction along its x axis. A convenient approach to quantifying a shift of the dissociation curve is to indicate the Po2 required for 50% saturation and, under the standard conditions shown in Figure 11.9, this is 3.5 kPa (26.3 mmHg). Referred to as the P50 this is the usual method of reporting shift of the dissociation curve.
The Bohr effect, as a result of changes in blood pH, is shown in Figure 11.10. Shifts may be defined as the ratio of the Po2 that produces a particular saturation under standard conditions, to the Po2 which produces the same saturation with a particular shift of the curve. Standard conditions include pH 7.4, temperature 37°C and zero base excess. In Figure 11.10, a saturation of 80% is produced by Po2 6 kPa (45 mmHg) at pH 7.4 (standard). At pH 7.0 the Po2 required for 80% saturation is 9.4 kPa (70.5 mmHg). The ratio is 0.64 and this applies to all saturations at pH 7.0.
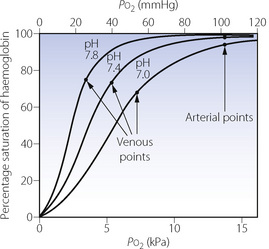
Fig. 11.10 The Bohr effect and its effect upon oxygen partial pressure. The centre curve is the normal curve under standard conditions; the other two curves show the displacement caused by differing blood pH as indicated, other factors remaining constant. The venous points have been determined on the basis of a fixed arterial/mixed venous oxygen saturation difference of 25%. They are thus 25% saturation less than the corresponding arterial saturation, which is equivalent to a Po2 of 13.3 kPa (100 mmHg) in each case. Under the conditions shown, alkalosis lowers venous Po2 and acidosis raises venous Po2. Temperature, 37°C; base excess, zero.
The Bohr effect has an influence on oxygen carriage under normal physiological conditions. As blood moves along a capillary, either pulmonary or systemic, the transfer of CO2 alters the pH of the blood and therefore the dissociation curve is shifted. Though the effect may seem to be small, for example the arteriovenous pH difference is only around 0.033, the effect on oxygen saturation at the venous point, where the dissociation curve is steep, will be significant. It has been suggested that 25% of oxygen release and uptake by haemoglobin as it traverses systemic and pulmonary capillaries respectively is due to the Bohr effect.
Temperature has a large influence on the dissociation curve with a left shift in hypothermia and vice versa.
Base excess is a parameter derived from blood pH and Pco2 to quantify the metabolic (as opposed to respiratory) component of an observed change in blood pH. Compared with pH itself, alterations in base excess have only a small effect on the position of the dissociation curve but must be taken into account for accurate results.
Quantifying displacement of the haemoglobin dissociation curve. Estimation of haemoglobin saturation from Po2 using the modified Kelman equation has been shown above. However, this equation assumes a normal P50, so will yield erroneous results in all but the most ‘normal’ physiological circumstances. In clinical practice, the type of patient who requires blood gas measurement invariably also has abnormalities of pH, temperature and base excess. Automated calculation of saturation from Po2 by blood gas analysers routinely takes these factors into account, using a variety of equations to correct for dissociation curve displacement of which one example is:15

where Po2 is in kPa and temperature (T) in °C. The corrected Po2 may then be entered into any version of the haemoglobin dissociation curve equation as shown above (page 191).
Clinical significance of displacement of the haemoglobin dissociation curve. The important effect is on tissue Po2, and the consequences of a shift in the dissociation curve are not intuitively obvious. It is essential to think quantitatively. For example, a shift to the right (caused by low pH or high temperature) impairs oxygenation in the lungs but aids release of oxygen in the tissues. Do these effects in combination increase or decrease tissue Po2? An illustrative example is set out in Figure 11.10. The arterial Po2 is assumed to be 13.3 kPa (100 mmHg) and there is a decrease in arterial saturation with a reduction of pH. At normal arterial Po2 the effect on arterial saturation is relatively small, but at the venous point the position is quite different, and the examples in Figure 11.10 show the venous oxygen tensions to be very markedly affected. Assuming that the arterial/venous oxygen saturation difference is constant at 25% it will be seen that at low pH the venous Po2 is raised to 6.9 kPa (52 mmHg), while at high pH the venous Po2 is reduced to 3.5 kPa (26 mmHg). This is important as the tissue Po2 equates more closely to the venous Po2 than to the arterial Po2 (page 155). Thus, in the example shown, the shift to the right is beneficial for tissue oxygenation.
It is a general rule that a shift to the right (increased P50) will benefit venous Po2, provided that the arterial Po2 is not critically reduced. Below an arterial Po2 of about 5 kPa (38 mmHg), the arterial point is on the steep part of the dissociation curve, and the deficiency in oxygenation of the arterial blood would outweigh the improved off-loading of oxygen in the tissues. Thus, with severe arterial hypoxaemia, the venous Po2 would tend to be reduced by a shift to the right and a leftward shift would then be advantageous. It is therefore of great interest that a spontaneous leftward shift occurs at extreme altitude when arterial Po2 is critically reduced (see below).
2,3-Diphosphoglycerate
For many years it has been known that the presence of certain organic phosphates in the RBC has a pronounced effect on the P50. The most important of these compounds is 2,3-diphosphoglycerate (DPG),16 one molecule of which becomes bound by electrostatic bonds between the two β-chains, stabilising the T conformation of haemoglobin,4 reducing its oxygen affinity, and so displacing the dissociation curve to the right. The percentage of haemoglobin molecules containing a DPG molecule governs the overall P50 of a blood sample within the range 2–4.5 kPa (15–34 mmHg).
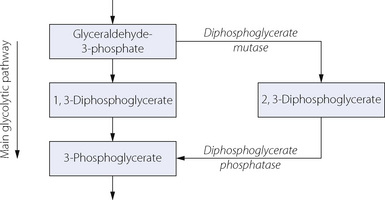
DPG is formed in the Rapoport–Luebering shunt off the glycolytic pathway, and its level is determined by the balance between synthesis and degradation (Figure 11.11). Activity of DPG mutase is enhanced and DPG phosphatase diminished at high pH, which thus increases the level of DPG.
The relationship between DPG levels and P50 suggested that DPG levels would have a most important bearing on clinical practice. Much research effort was devoted to this topic, which mostly failed to substantiate the theoretical importance of DPG for oxygen delivery. In fact, the likely effects of changes in P50 mediated by DPG seem to be of marginal significance in comparison with changes in arterial Po2, acid–base balance and tissue perfusion.17
DPG levels with blood storage and transfusion remains the only area where red cell DPG levels may have significant effects in clinical practice. Storage of blood for transfusion at below 6°C reduces glycolysis to less than 5% of normal rates, and so reduces DPG production by a similar amount. Thus, after one to two weeks of storage, red cell DPG levels are effectively zero. Blood preservation solutions have evolved through the years to include the addition of dextrose to encourage glycolytic activity, citrate to buffer the resulting lactic acid and adenine or phosphate to help maintain ATP levels. Thus storage of blood with citrate-phosphate-dextrose (CPD) reduces the rate of DPG depletion when compared with older preservation solutions,18 but levels still become negligible within two weeks.
Once transfused, the red blood cells are quickly warmed and provided with all required metabolites, and the limiting factor for return to normal DPG levels will be reactivation of DPG mutase (Figure 11.11). In vivo studies in healthy volunteers indicate that red cell DPG levels in transfused red cells are approximately 50% of normal 7 hours after transfusion, and pretransfusion levels are not achieved until 48 hours (Figure 11.12).19 This ingenious study involved the administration of 35 day old CPD-Adenine preserved type O blood to type A volunteers, and then in repeated venous samples red cells were separated according to their blood group before measuring DPG levels. In this way, DPG levels of both the recipients, own cells and the transfused cells could be monitored separately (Figure 11.12).
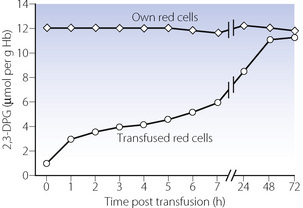
Fig. 11.12 Restoration of red cell 2,3-diphosphoglycerate (DPG) levels following blood transfusion. The Type O transfused red cells were stored for 35 days in CPD-A preservative solution before being given to type A volunteers. Red cells were subsequently separated into the transfused cells and the volunteer’s own cells before analysis. The clinical implications of this slow return to normal DPG levels are unclear; see text for details.
(After reference 19 with permission of the authors and the publishers of British Journal of Haematology.)
The clinical significance of the slow return to normal DPG levels is uncertain, and in most cases likely to be minimal, as the proportion of the patient’s haemoglobin that consists of transfused blood will usually be small. However, rapid transfusion of large volumes of DPG depleted blood does result in a reduced P50, which will in theory impair tissue oxygenation (page 192). However, in humans, little evidence has been found of tissue hypoxia under these circumstances, with no changes in cardiac output or oxygen consumption following transfusion with DPG depleted blood.20 Changes in the P50 of a patient do not usually exceed 0.5 kPa (3.8 mmHg), and it is possible that changes in the haemoglobin dissociation curve are compensated for by changes in blood flow at a capillary level.21
Other causes of altered DPG levels. Anaemia results in a raised DPG level, with P50 of the order of 0.5 kPa (3.8 mmHg) higher than control levels.22 The problem of oxygen delivery in anaemia is considered in Chapter 25.
Altitude causes an increased red cell concentration of DPG. However, there is a progressive respiratory alkalosis with increasing altitude, which has an opposite and much more pronounced effect on displacement of the dissociation curve. There is now a firm consensus that there is a leftward displacement of the haemoglobin dissociation curve at high altitude (see Chapter 17).
Normal Arterial Po2
In contrast to the arterial Pco2, the arterial Po2 shows a progressive decrease with age. Using the pooled results from 12 studies of healthy subjects, one review suggested the following relationship in subjects breathing air:23
About this regression line there are 95% confidence limits of ± 1.33 kPa (10 mmHg) (Table 11.3) so 5% of normal patients will lie outside these limits and it is therefore preferable to refer to this as the reference range rather than the normal range.
Table 11.3 Normal values for arterial Po2
| AGE (YEARS) | MEAN (95% CONFIDENCE INTERVALS) | |
|---|---|---|
| kPa | mmHg | |
| 20–29 | 12.5 (11.2–13.8) | 94 (84–104) |
| 30–39 | 12.1 (10.7–13.4) | 90 (80–100) |
| 40–49 | 11.6 (10.3–13.0) | 87 (77–97) |
| 50–59 | 11.2 (9.9–12.5) | 84 (74–94) |
| 60–69 | 10.7 (9.4–12.1) | 81 (71–91) |
| 70–79 | 10.3 (9.0–11.6) | 77 (67–87) |
| 80–89 | 9.9 (8.5–11.2) | 74 (64–84) |
Figures derived from reference 23.
Nitric Oxide and Haemoglobin24,25,26
The enormous interest over recent years in both endogenous and exogenous nitric oxide (NO) has inevitably led to intensive research into its interaction with haemoglobin. It has been known for some time that NO binds to haemoglobin very rapidly, and this observation is fundamental to its therapeutic use when inhaled NO exerts its effects in the pulmonary vasculature but is inactivated by binding to haemoglobin before it reaches the systemic circulation (page 111). There are two quite separate chemical reactions between NO and the haemoglobin molecule:27
These reactions are so rapid that there is doubt that endogenous NO itself can exert any effects within blood (e.g. on platelets) before being bound by haemoglobin, and must therefore act via an intermediate substance.
Thus in vivo NO in arterial blood is predominantly in the form of SNO-Hb, whilst in venous blood haem bound HbNO predominates.27 It has been proposed that as haemoglobin passes through the pulmonary capillary, changes in oxygenation, Pco2 and pH drive the change from the deoxygenated T conformation to the oxygenated R conformation, and this change in quaternary structure of haemoglobin causes the intramolecular transfer of NO from the haem to cysteine bound positions. In the peripheral capillaries, the opposite sequence of events occurs, which encourages release of NO from the RSNO group, where it may again bind to the haem group, or be released from the RBC to act as a local vasodilator, effectively improving flow to vessels with the greatest demand for oxygen.30 Export of NO activity from the RBC is believed to occur via a complex mechanism. Deoxygenated T conformation haemoglobin binds to one of the cytoplasmic domains of the RBC transmembrane Band 3 protein (Figure 10.4),31 which may act as a metabolon (page 166) and directly transfer the NO, via a series of nitrosothiol reactions, to the outside of the cell membrane where it can exert its vasodilator activity. The biological implications of this series of events are yet to be determined. The suggestion that haemoglobin is acting as a nitric oxide carrier to regulate capillary blood flow and oxygen release from the RBC represents a fundamental advance in our understanding of the delivery of oxygen to tissues.25,32 One role postulated for these interactions between haemoglobin and NO is to modulate the vascular response to changes in oxygen availability,33 for example during haemorrhage when NO activity from RBCs may be involved in overcoming the catecholamine mediated vasoconstriction in vital organs.32
Abnormal forms of Haemoglobin
There are a large number of alternative amino acid sequences in the haemoglobin molecule. Most animal species have their own peculiar haemoglobins while, in humans, γ- and δ-chains occur in addition to the α- and β-monomers already described. γ- and δ-chains occur normally in combination with α-chains. The combination of two γ-chains with two α-chains constitutes fetal haemoglobin (HbF), which has a dissociation curve well to the left of adult haemoglobin (Figure 11.9). The combination of two δ-chains with two α-chains constitutes A2 haemoglobin (HbA2), which forms 2% of the total haemoglobin in normal adults. Other variations in the amino acid chains can be considered abnormal, and, although over 600 have been reported and named, only one third of these have any clinical effects.34 Some abnormal haemoglobins (such as San Diego and Chesapeake) have a high P50 but it is more common for the P50 to be lower than normal (such as Sickle and Kansas). In the long term, a reduced P50 results in excessive production of RBCs (erythrocytosis), presumed to result from cellular hypoxia in the kidney leading to erythropoietin production.35 However, many abnormal haemoglobins also have deranged quaternary protein structure and so are unstable, a situation that leads to haemoglobin chains becoming free within the RBC cytoplasm and membrane causing cell lysis.35 These patients therefore have a higher than normal rate of RBC production but are generally anaemic because of even greater degrees of RBC destruction. This combination of abnormalities results in severe long-term problems with body iron metabolism.
Sickle cell disease36 is caused by the presence of HbS in which valine replaces glutamic acid in position 6 on the β-chains. This apparently trivial substitution is sufficient to cause critical loss of solubility of reduced haemoglobin, resulting in polymerisation of HbS within the RBC causing red cells to take on the characteristic ‘sickle’ shape and be more prone to haemolysis. It is a hereditary condition and in the homozygous state is a grave abnormality, with sickling occurring at an arterial Po2 of less than 5.5 kPa (40 mmHg), which is close to the normal venous Po2. Thus any condition that increases the arterio-venous oxygen difference, such as infection, risks precipitating a sickle ‘crisis’. Sickle cells cause damage in two ways. First, the sickled cells are crescent shaped and rigid, so can more easily occlude small blood vessels, usually venules. Secondly, haemolysis releases free haemoglobin into the circulation which binds NO released from the vascular endothelium causing vasoconstriction, further impairing the ability of the sickle cells to pass through the microcirculation. In the long term these effects cause widespread microvascular damage, including pulmonary hypertension.37
Patients with sickle cell disease have varying degrees of compensatory production of HbF, and the amount of HbF found in RBCs is inversely related to the severity of clinical symptoms of sickle cell disease. Thus most therapies in recent years have focussed on increasing HbF synthesis by the bone marrow with cytotoxic drugs such as hydroxyurea.38 Heterozygous carriers of the disease only sickle below an arterial Po2 of 2.7 kPa (20 mmHg) and so are usually asymptomatic.
Thalassaemia is another hereditary disorder of haemoglobin. It consists of a suppression of formation of HbA, again with a compensatory production of HbF, which persists throughout life instead of falling to low levels after birth. The functional disorder thus includes a shift of the dissociation curve to the left (Figure 11.9).
Methaemoglobin is haemoglobin in which the iron has been oxidised and assumes the trivalent ferric form. One way in which methaemoglobin forms is when oxyhaemoglobin acts as a nitric oxide scavenger, a process that occurs physiologically to limit the biological activity of endogenous NO, or pharmacologically during treatment with inhaled NO. Other drugs may cause methaemoglobinaemia, most notably some local anaesthetics39 (prilocaine, benzocaine) but also nitrites and dapsone.40 Methaemoglobin is unable to combine with oxygen but is slowly reconverted to haemoglobin in the normal subject by the action of four different systems:
Elevated methaemoglobin levels of whatever cause may be treated by the administration of either ascorbic acid or methylene blue.39 The latter is extremely effective and brings about methaemoglobin reduction by activation of NADPH-dehydrogenase.
Abnormal Ligands
The iron in haemoglobin is able to combine with other inorganic molecules apart from oxygen. Compounds so formed are, in general, more stable than oxyhaemoglobin and therefore block the combination of haemoglobin with oxygen. The most important of these abnormal compounds is COHb, but ligands may also be formed with nitric oxide (see above), cyanide, sulphur, ammonia and a number of other substances. In addition to the loss of oxygen-carrying power, there is also often a shift of the dissociation curve to the left.
Carboxyhaemoglobin. Carbon monoxide is well known to displace oxygen from combination with haemoglobin, its affinity being approximately 300 times greater than the affinity for oxygen. Thus in a subject with 20% of their haemoglobin bound to carbon monoxide, blood oxygen content will be reduced by a similar amount (the small contribution from dissolved oxygen will be unchanged). However, the presence of carboxyhaemoglobin also causes a leftward shift of the dissociation curve of the remaining oxyhaemoglobin, partly mediated by a reduction in DPG levels. Tissue oxygenation is therefore impaired to an even greater extent than simply reducing the amount of haemoglobin available for oxygen carriage. This situation contrasts with that of anaemia, where P50 is increased so the reduced oxygen carrying capacity is partially alleviated by an improved unloading of oxygen in the tissues (page 192).
Blood Substitutes41
There are obvious advantages in the provision of an artificial oxygen-carrying solution that would avoid the infectious and antigenic complications seen with transfusion of another individual’s red cells. The search for a blood substitute has followed two quite different parallel paths.
Perfluorocarbons.42 Oxygen is highly soluble in these hydrophobic compounds, which with an 8–10 carbon chain are above the critical molecular size to act as anaesthetics. Perfluorooctyl bromide (Perflubron) is a 60% emulsion, which will carry about 50 ml of oxygen per 100 ml on equilibration with 100% oxygen at normal atmospheric pressure. Since oxygen is in physical solution in fluorocarbons, its ‘dissociation curve’ is a straight line, with the quantity of dissolved oxygen being directly proportional to Po2. Because of the requirement to maintain adequate blood constituents apart from red cells (e.g. platelets, clotting factors, blood chemistry and oncotic pressure) the proportion of blood that may be replaced by Perflubron is small, so that even when breathing 100% oxygen the additional oxygen carrying capacity is limited. Even so, clinical uses for intravenous Perflubron have been identified, for example its administration may delay the need for blood transfusion.43
Flow resistance is considerably less than that of blood, and as it is virtually unaffected by shear rate, the rheological properties are particularly favourable at low flow rates. Fluorocarbons may therefore be useful in partial obstruction of the circulation, for example in myocardial infarction and during percutaneous transluminal coronary angioplasty.44 Successful use of perflubron in the lungs for liquid or partial liquid ventilation is now widely reported in premature babies (page 255), children and adults (page 458).
Perfluorocarbons are cleared from the circulation into the reticuloendothelial system where they reside for varying lengths of time before being excreted unchanged from the lungs.
Haemoglobin-based oxygen carriers.45,46 Early attempts at using RBC haemolysates resulted in acute renal failure due to the stroma from the RBC rather than the free haemoglobin. Development of stroma free haemoglobin solutions failed to solve the problem because although relatively stable in vitro, the haemoglobin tetramer dissociates in the body into dimers, which are excreted in the urine within a few hours. Other problems include the absence of DPG resulting in a low P50, and a high colloid oncotic pressure limiting the amount that can be used. The short half life and high oncotic pressure can be improved by either polymerisation or cross-linking of haemoglobin molecules. The P50 of the solution can be improved by using recombinant human haemoglobin rather than animal haemoglobin, and by choosing a specific variant of human haemoglobin (Presbyterian Hb) which has a naturally higher P50.47 Unfortunately, despite these advances, haemoglobin based oxygen carriers all have significant drawbacks in clinical use, mostly due to the haemoglobin scavenging NO and so causing vasoconstriction, release of inflammatory mediators and inhibition of platelet function. These effects are not theoretical: a meta-analysis of studies shows haemoglobin based blood substitutes cause an increased number of deaths and myocardial infarctions compared with controls.46
These limitations of free haemoglobin molecules have led to attempts to encapsulate haemoglobin within liposomes or artificial cell membranes.45 Haemoglobin can be incorporated into a lipid vesicle, sometimes even including reducing agents and oxygen-affinity modifiers to produce a more functional oxygen carrying unit. Animal studies show these solutions have the potential to deliver useful quantities of oxygen to hypoxic tissues.48
The latest attempt at producing a haemoglobin-based oxygen carrier without relying on blood donation uses stem cell technology.49 With the application of suitable growth factors human stem cells can be developed in vitro to produce mature RBCs with all the physiological characteristics of a normal RBC.
The Role of Oxygen in the Cell
Dissolved molecular oxygen (dioxygen) enters into many metabolic processes in the mammalian body. Quantitatively much the most important is the cytochrome c oxidase system, which is responsible for about 90% of the total oxygen consumption of the body. However, cytochrome c oxidase is only one of more than 200 oxidases, which may be classified as follows.
Electron transfer oxidases. As a group, these oxidases involve the reduction of oxygen to superoxide anion, hydrogen peroxide or water, the last being the fully reduced state (see Chapter 26, Figure 26.2). The most familiar of this group of enzymes is cytochrome c oxidase. It is located in the mitochondria and is concerned in the production of the high energy phosphate bond in adenosine triphosphate (ATP), which is the main source of biological energy. This process is described in greater detail below.
Oxygen transferases (dioxygenases). This group of oxygenases incorporate oxygen into substrates without the formation of any reduced oxygen product. Familiar examples are cyclo-oxygenase and lipoxygenase, which are concerned in the first stage of conversion of arachidonic acid into prostaglandins and leukotrienes (see Chapter 12).
Mixed function oxidases. These oxidases result in oxidation of both a substrate and a co-substrate, which is most commonly NADPH. The best known examples are the cytochrome P-450 hydroxylases, which play an important role in detoxification.
Energy Production
Most of the energy deployed in the mammalian body is derived from the oxidation of food fuels, of which the most important is glucose:

The equation accurately describes the combustion of glucose in vitro, but is only a crude, overall representation of the oxidation of glucose in the body. The direct reaction would not produce energy in a form in which it could be utilised by the body so biological oxidation proceeds by a large number of stages with phased production of energy. This energy is not immediately released but is stored mainly by means of the reaction of adenosine diphosphate (ADP) with inorganic phosphate ion to form ATP. The third phosphate group in ATP is held by a high energy bond that releases its energy when ATP is split back into ADP and inorganic phosphate ion during any of the myriad of biological reactions requiring energy input. ADP is thus recycled indefinitely, with ATP acting as a short-term store of energy, available in a form that may be used directly for work such as muscle contraction, ion pumping, protein synthesis and secretion.
There is no large store of ATP in the body and it must be synthesised continuously as it is being used. The ATP/ADP ratio is an indication of the level of energy that is currently carried in the ADP/ATP system, and the ratio is normally related to the state of oxidation of the cell. The ADP/ATP system is not the only short-term energy store in the body but it is the most important.
Complete oxidation of glucose requires a three-stage process, the first of which, glycolysis, is independent of oxygen supply.
Glycolysis and Anaerobic Energy Production
Figure 11.13 shows detail of the glycolytic (Embden–Meyerhof) pathway for the conversion of glucose to lactic acid. Glycolysis occurs entirely within the cytoplasm, and under normal conditions proceeds only as far as pyruvic acid, which then enters the citric acid cycle (see below). In RBCs, where there is an absence of the respiratory enzymes located in the mitochondria, or in other cells when cellular Po2 falls below its critical level, lactic acid is produced. Figure 11.13 shows that, over all, four molecules of ATP are produced, but two of these are consumed in the priming stages prior to the formation of fructose-1,6-diphosphate. The conversion of glyceraldehyde-3-phosphate to 3-phosphoglyceric acid produces a hydrogen ion, which becomes bound to extramitochondrial nicotinamide adenine dinucleotide (NAD). This hydrogen cannot enter the mitochondria for further oxidative metabolism so is taken up lower down the pathway by the reduction of pyruvic acid to lactic acid.
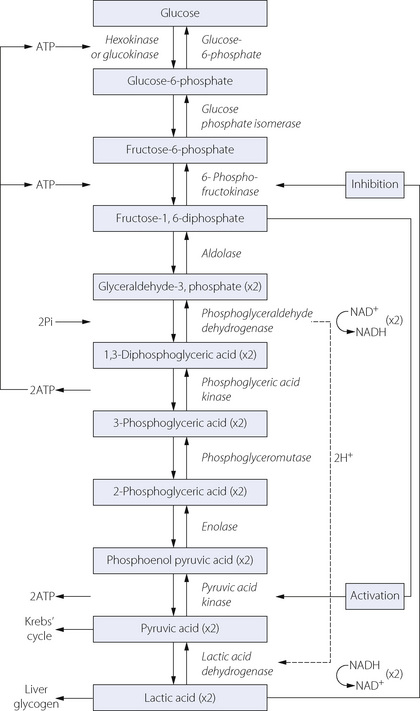
Fig. 11.13 The glycolytic (Embden–Meyerhof) pathway for anaerobic metabolism of glucose. From glyceraldehyde-3-phosphate downwards, two molecules of each intermediate are formed from one of glucose. Note the consumption of two molecules of ATP in the first three steps. These must be set against the total production of four molecules of ATP, leaving a net gain of only two molecules of ATP from each molecule of glucose. All the acids are largely ionised at tissue pH.
This series of changes is therefore associated with the net formation of only two molecules of ATP from one of glucose:
(Pi = inorganic phosphate)
However, considerable chemical energy remains in the lactic acid which, in the presence of oxygen, can be reconverted to pyruvic acid and then oxidised in the citric acid cycle, producing a further 36 molecules of ATP. Alternatively, lactic acid may be converted into liver glycogen to await more favourable conditions for oxidation.
In spite of their inefficiency for ATP production, anaerobic metabolism is of great biological importance and was universal before the atmospheric Po2 was sufficiently high for aerobic pathways (Chapter 1). Anaerobic metabolism is still the rule in anaerobic bacteria and also in the mammalian body when energy requirements outstrip oxygen supply as, for example, during severe exercise or during hypoxia.
Aerobic Energy Production
The aerobic pathway permits the release of far greater quantities of energy from the same amount of substrate and is therefore used whenever possible. Under aerobic conditions, most reactions of the glycolytic pathway remain unchanged, with two very important exceptions. The conversion of glyceraldehyde-3-phosphate to 3-phosphoglyceric acid occurs in the mitochondrion, when the two NADH molecules formed may enter oxidative phosphorylation (see below) rather than producing lactic acid. Similarly, pyruvate does not continue along the pathway to lactic acid but diffuses into the mitochondria and enters the next stage of oxidative metabolism.
The citric acid (Krebs’) cycle occurs within the mitochondria as shown in Figure 11.14. It consists of a series of reactions to reduce the length of the carbon chain of the molecules before adding a new 2-carbon chain (acetyl CoA) derived from glycolysis. During these reactions, six molecules of carbon dioxide are produced (for each molecule of glucose) along with a further 8 molecules of NADH and one molecule of FADH2. Therefore in total, each glucose molecule yields 12 hydrogen ions bound to either NAD or FAD carrier molecules.
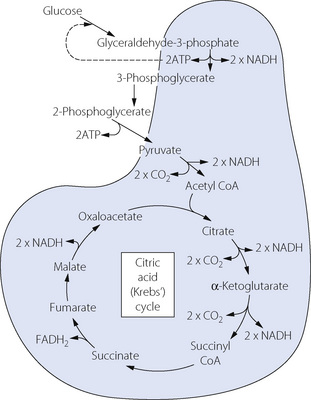
Fig. 11.14 Oxidative metabolic pathway of glucose by the citric acid cycle. The shaded area represents the mitochondrion and indicates the reactions that can take place only within them. Substances shown straddling the shaded area are capable of diffusion across the mitochondrial membrane. Many stages of the glycolytic pathway (Figure 11.13) have been omitted for clarity. Note that one molecule of glucose will produce two molecules of all the other intermediate substances. Only 2 molecules of ATP are produced, along with 12 molecules of NADPH2, each of which enters oxidative phosphorylation within the mitochondria producing 3 molecules of ATP (Figure 11.15).
The scheme shown in Figure 11.14 also accounts for the consumption of oxygen in the metabolism of fat. After hydrolysis, glycerol is converted into pyruvic acid while the fatty acids shed a series of 2-carbon molecules in the form of acetyl CoA. Pyruvic acid and acetyl CoA enter the citric acid cycle and are then degraded in the same manner as though they had been derived from glucose. Amino acids are dealt with in similar manner after deamination.
Oxidative phosphorylation is the final stage of energy production and again occurs in the mitochondria. The hydrogen ions from NADH or FADH2 are passed along a chain of hydrogen carriers to combine with oxygen at cytochrome a3, which is the end of the chain. Figure 11.15 shows the transport of hydrogen along the chain, which consists of structural entities just visible under the electron microscope and arranged in rows along the cristae of the mitochondria. Three molecules of ATP are formed at various stages of the chain during the transfer of each hydrogen ion. The process is not associated directly with the production of carbon dioxide, which is formed only in the citric acid cycle.
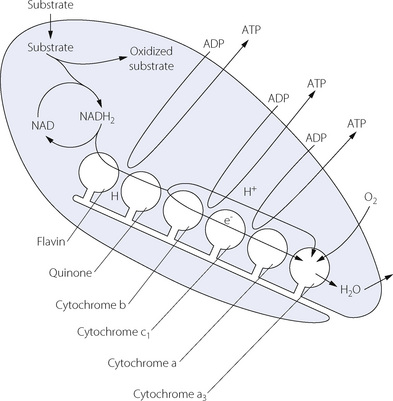
Fig. 11.15 Diagrammatic representation of oxidative phosphorylation within the mitochondrion. Intramitochondrial NADH2 produced from glycolysis and the citric acid cycle provides hydrogen to the first of a chain of hydrogen carriers that are attached to the cristae of the mitochondria. When the hydrogen reaches the cytochromes, ionisation occurs; the proton passes into the lumen of the mitochondrion while the electron is passed along the cytochromes where it converts ferric iron to the ferrous form. The final stage is at cytochrome a3 where the proton and the electron combine with oxygen to form water. Three molecules of ADP are converted to ATP at the stages shown in the diagram. ADP and ATP can cross the mitochondrial membrane freely while there are separate pools of intra- and extra-mitochondrial NAD that cannot interchange.
Cytochromes have a structure similar to haemoglobin with an iron containing haem complex bound within a large protein. Their activity is controlled by the availability of oxygen and hydrogen molecules, the local concentration of ADP and by some unidentified cytosolic factors.50 Different cytochromes have different values for P50 and so may act as oxygen sensors in several areas of the body (page 71). There is evidence for an interaction between NO and several cytochromes, with NO forming nitrosyl complexes in a similar fashion to its reaction with haemoglobin (page 194).30 It is postulated that NO, or NO derived nitrosyl compounds, may play an important role in controlling oxygen consumption at a mitochondrial level. High levels of endogenous NO, for example during sepsis, may produce sufficient inhibition of cytochrome activity and therefore oxygen consumption to contribute to the impaired tissue function seen in vital organs such as the heart.30 The reduction of oxygen to water by cytochrome a3 is inhibited by cyanide.
Significance of aerobic metabolism. Glycolysis under aerobic conditions and the citric acid cycle yields a total of 12 hydrogen molecules for each glucose molecule used. In turn, each hydrogen molecule enters oxidative phosphorylation to yield 3 ATP molecules. These, along with the two produced during glycolysis result in a total production of 38 ATP molecules.
In simplified form, the contrasting pathways can be shown as follows:
| ANAEROBIC PATHWAY Glucose ↓ Pyruvic acid ↓ Lactic acid + 2 ATP (67 kJ of energy) |
AEROBIC PATHWAY Glucose ↓ Pyruvic acid ↓ CO2 + H2O + 38 ATP (1270 kJ of energy) |
In vitro combustion of glucose liberates 2820 kJ.mol−1 as heat. Thus, under conditions of oxidative metabolism, 45% of the total energy is made available for biological work, which compares favourably with most machines.
Use of anaerobic pathways must therefore either consume very much larger quantities of glucose or, alternatively, yield less ATP. In high energy consuming organs such as brain, kidney and liver it is not, in fact, possible to transfer the increased quantities of glucose and therefore these organs suffer ATP depletion under hypoxic conditions. In contrast, voluntary muscle is able to function satisfactorily on anaerobic metabolism during short periods of time and this is normal in the diving mammals.
The critical oxygen tension for aerobic metabolism. When the mitochondrial Po2 is reduced, oxidative phosphorylation continues normally down to a level of about 0.3 kPa (2 mmHg). Below this level, oxygen consumption falls and the various members of the electron transport chain tend to revert to the reduced state. NADH/NAD+ and lactate/pyruvate ratios rise and the ATP/ADP ratio falls. The critical Po2 varies between different organs and different species but, as an approximation, a mitochondrial Po2 of about 0.13 kPa (1 mmHg) may be taken as the level below which there is serious impairment of oxidative phosphorylation and a switch to anaerobic metabolism. This level is, of course, far below the critical arterial Po2, because there normally exists a large gradient of Po2 between arterial blood and the site of utilisation of oxygen in the mitochondria, as part of the oxygen cascade (Figure 11.1). Tissue hypoxia is discussed further on page 367. The critical Po2 for oxidative phosphorylation is also known as the Pasteur point and has applications beyond the pathophysiology of hypoxia in man. In particular, it has a powerful bearing on putrefaction, many forms of which are anaerobic metabolism resulting from a fall of Po2 below the Pasteur point in, for example, polluted rivers.
Tissue Po2
It is almost impossible to quantify tissue Po2. It is evident that there are differences between different organs, with the tissue Po2 influenced not only by arterial Po2 but also by the ratio of tissue oxygen consumption to perfusion. However, even greater difficulties arise from the regional variations in tissue Po2 in different parts of the same organ, which are again presumably caused by regional variations in tissue perfusion and oxygen consumption. Nor is this the whole story. As described on page 155, movement of oxygen from capillaries into the tissue is by simple diffusion, with complex radial and longitudinal gradients in Po2 around individual capillaries (see Figure 9.4). For a single cell, the capillary Po2 will be that of the nearest section of capillary and so anywhere between the local arterial and venous values, and the final tissue Po2 will also depend on the distance between the capillary and the cell, which may be up to 200 μm. These factors explain why the largest drop in Po2 of the oxygen cascade is the final stage between capillary and mitochondrial Po2 (Figure 11.1). In spite of this sometimes long diffusion path, and low value for mitochondrial Po2, oxygen supply is extremely efficient, and it is believed to be the supply of metabolic substrates (fatty acids and glucose) that normally limit cellular energy production.51 Tissue Po2 is thus an unsatisfactory quantitative index of the state of oxygenation of an organ, and indirect assessments must be made (page 210).
Transport of Oxygen from the Lungs to the Cell
The Concept of Oxygen Delivery
The most important function of the respiratory and circulatory systems is the supply of oxygen to the cells of the body in adequate quantity and at a satisfactory partial pressure. The quantity of oxygen made available to the body in one minute is known as oxygen delivery ( ) or oxygen flux, and is equal to cardiac output × arterial oxygen content.
At rest, the numerical values are approximately:
Of this 1000 ml.min−1, approximately 250 ml.min−1 are used by the conscious resting subject. The circulating blood thus loses 25% of its oxygen and the mixed venous blood is approximately 70% saturated (i.e. 95 − 25). The 70% of unextracted oxygen forms an important reserve that may be drawn upon under the stress of such conditions as exercise, to which additional extraction forms one of the integrated adaptations (see Figure 15.3).
Oxygen consumption must clearly depend upon delivery but the relationship is non-linear. Modest reduction of oxygen delivery is well tolerated by the body, which is, within limits, able to draw on the reserve of unextracted venous oxygen without reduction of oxygen consumption. However, below a critical value for delivery, consumption is decreased and the subject shows signs of hypoxia. The important quantitative aspects of the relationship between oxygen consumption and delivery are considered below.
Quantification of Oxygen Delivery
The arterial oxygen content consists predominantly of oxygen in combination with haemoglobin, and this fraction is given by the following expression:

where Cao2 is the arterial oxygen content, Sao2 is the arterial oxygen saturation (as a fraction) and [Hb] is the haemoglobin concentration of the blood; 1.39 is the volume of oxygen (ml) which has been found to combine with 1 g of haemoglobin (excluding dyshaemoglobins: see page 189).
To the combined oxygen must be added the oxygen in physical solution which will be of the order of 0.3 ml.dl−1, and the expression for total arterial oxygen concentration may now be expanded thus:
Since oxygen delivery is the product of cardiac output and arterial oxygen content:
 is cardiac output (right-hand side is multiplied by a scaling factor of 10).
By combining equations (4) and (5) the full expression for oxygen delivery is as follows:
(right-hand side is multiplied by a scaling factor of 10).
For comparison between subjects, values for oxygen delivery must be related to body size, which is done by relating the value to body surface area. Oxygen delivery divided by surface area is known as oxygen delivery index and has units of ml.min−1.m−2.
Interaction of the Variable Factors Governing Oxygen Delivery
Equation (6) contains, on the right hand side, three variable factors that govern oxygen delivery.
The classification of ‘anoxia’ into stagnant, anoxic and anaemic was proposed by Barcroft in 192052 and has stood the test of time. The three types of ‘anoxia’ may be conveniently displayed on a Venn diagram (Figure 11.16), which shows the possibility of combinations of any two types of anoxia or all three together. For example, the combination of anaemia and low cardiac output, which occurs in untreated haemorrhage, would be indicated by the overlapping area of the stagnant and anaemic circles (indicated by ×). If the patient also suffered from lung injury, he might then move into the central area, indicating the addition of anoxic anoxia. On a more cheerful note, compensations are more usual. Patients with anaemia normally have a high cardiac output; subjects resident at altitude have polycythaemia, and so on.
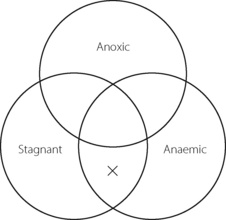
Fig. 11.16 Barcroft’s classification of causes of hypoxia displayed on a Venn diagram to illustrate the possibility of combinations of more than one type of hypoxia. The lowest overlap, marked with a cross, shows coexistent anaemia and low cardiac output. The central area illustrates a combination of all three types of hypoxia (e.g. a patient with sepsis resulting in anaemia, circulatory failure and lung injury).
The Relationship between Oxygen Delivery and Consumption
The relationship between  and oxygen consumption (
 ) is best illustrated on the coordinates shown in Figure 11.17. The abscissa shows oxygen delivery as defined above, while consumption is shown on the ordinate. The fan of lines originating from the zero point indicate different values for oxygen extraction
  expressed as a percentage. Because the mixed venous oxygen saturation is the arterial saturation less the extraction, it is a simple matter to indicate the mixed venous saturation, which corresponds to a particular value for extraction. The black dot indicates a typical normal resting point, with
  of 1000 ml.min−1,
  of 250 ml.min−1 and extraction 25%.
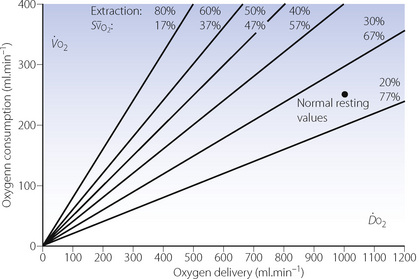
Fig. 11.17 Grid relating oxygen delivery and consumption to extraction and mixed venous oxygen saturation, on the assumption of 97% saturation for arterial blood. The spot marks the normal resting values.
When oxygen delivery is moderately reduced, for whatever reason, oxygen consumption tends to be maintained at its normal value by increasing oxygen extraction and therefore decreasing mixed venous saturation. There should be no evidence of additional anaerobic metabolism, such as increased lactate production. This is termed ‘supply-independent oxygenation’, a condition that applies provided that delivery remains above a critical value. This is shown by the horizontal line in Figure 11.18. Below the critical level of oxygen delivery, oxygen consumption decreases as a linear function of delivery. This is termed ‘supply-dependent oxygenation’ and is usually accompanied by evidence of hypoxia, such as increased blood lactate and organ failure.
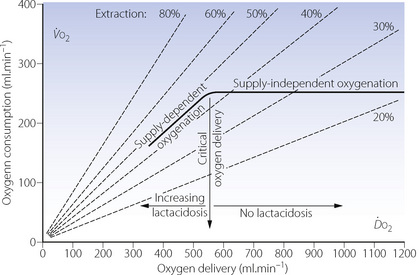
Fig. 11.18 This diagram is based on the grid shown in Figure 11.17. For an otherwise healthy subject, the thick horizontal line shows the extent to which oxygen delivery can be reduced without reducing oxygen consumption and causing signs of cellular hypoxia (supply-independent oxygenation). Below the postulated critical delivery, oxygen consumption becomes supply-dependent and there are signs of hypoxia. There is uncertainty of the exact values for critical delivery in otherwise healthy subjects.
Pathological supply dependency of oxygen consumption has been a source of controversy for many years.53 In critically ill patients, the transition between supply-dependent and supply-independent oxygen consumption (critical oxygen delivery, see Figure 11.18) was thought to move to the right, such that increasing oxygen delivery continued to increase oxygen consumption even at levels greater than those seen in normal healthy subjects.54 Early work in critical care units claimed better survival in patients in whom oxygen delivery, and therefore consumption, was increased above normal values.53,55 Sadly, larger randomised studies failed to confirm the benefits of this aggressive management of oxygen delivery.56 Furthermore, a value for the critical oxygen delivery in ill patients remained elusive,57 mostly due to the considerable difficulties in assessing the relationship between oxygen consumption and delivery in this group. It is therefore possible that the value for critical oxygen delivery is unchanged in critically ill patients, and that pathological supply dependency may not exist at all, with much of the earlier data resulting from methodological problems and mathematical coupling of the variables being measured. Outcome benefits to patients from deliberately increasing  seem to be minimal or non-existent,56,58 and current advice is to concentrate more closely on achieving normal values for cardiac output, haemoglobin and blood volume, rather than pursuing supra-normal targets.
Oxygen Stores
In spite of its great biological importance, oxygen is a very difficult gas to store in a biological system. There is no satisfactory method of physical storage in the body. Haemoglobin is the most efficient chemical carrier, but more than 0.5 kg is required to carry 1 g of oxygen. The concentration of haemoglobin in blood far exceeds the concentration of any other protein in any body fluid. Even so, the quantity of oxygen in the blood is barely sufficient for three minutes’ metabolism in the resting state. It is a fact of great clinical importance that the body oxygen stores are so small and, if replenishment ceases, they are normally insufficient to sustain life for more than a few minutes. The principal stores are shown in Table 11.4.
Table 11.4 Principal stores of body oxygen
| WHILE BREATHING AIR (ml) | WHILE BREATHING 100% OXYGEN (ml) | |
|---|---|---|
| In the lungs (FRC) | 450 | 3000 |
| In the blood | 850 | 950 |
| Dissolved in tissue fluids | 50 | ?100 |
| Combined with myoglobin | ? 200 | ? 200 |
| Total | 1550 | 4250 |
FRC, functional residual capacity.
While breathing air, not only are the total oxygen stores very small but also, to make matters worse, only part of the stores can be released without an unacceptable reduction in Po2. Half of the oxygen in blood is still retained when the Po2 is reduced to 3.5 kPa (26 mmHg). Myoglobin is even more reluctant to part with its oxygen and very little can be released above a Po2 of 2.7 kPa (20 mmHg).
Breathing oxygen causes a substantial increase in total oxygen stores. Most of the additional oxygen is accommodated in the alveolar gas from which 80% may be withdrawn without causing the Po2 to fall below the normal value. With 2400 ml of easily available oxygen after breathing oxygen, there is no difficulty in breath holding for several minutes without becoming hypoxic.
The small size of the oxygen stores means that changes in factors affecting the alveolar or arterial Po2 will produce their full effects very quickly after the change. This is in contrast to carbon dioxide where the size of the stores buffers the body against rapid changes (page 170). Figure 11.19 compares the time course of changes in Po2 and Pco2 produced by the same changes in ventilation. Figure 10.11 showed how the time course of changes of Pco2 is different for falling and rising Pco2.
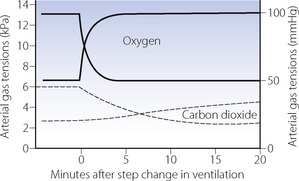
Fig. 11.19 The upper pair of curves indicate the rate of change of arterial Po2 following a step change in ventilation. Half of the total change occurs in about 30 seconds. The rising curve could be produced by an increase of alveolar ventilation from 2 to 4 l.min−1 while breathing air (see Figure 11.2). The falling curve could result from the corresponding reduction of alveolar ventilation from 4 to 2 l.min−1. The lower pair of broken curves indicate the time course of changes in Pco2, which are much slower than for oxygen (these changes are shown in greater detail in Figure 10.11).
Factors that reduce the Po2 always act rapidly, but two examples of changes that produce anoxia illustrate different degrees of ‘rapid’.
Circulatory arrest. When the circulation is arrested, hypoxia supervenes as soon as the oxygen in the tissues and stagnant capillaries has been exhausted. In the case of the brain, with its high rate of oxygen consumption, there is only about 10 seconds before consciousness is lost. Circulatory arrest also differs from other forms of hypoxia in the failure of clearance of products of anaerobic metabolism (e.g. lactic acid) which should not occur in arterial hypoxaemia.
Apnoea. The rate of onset of anoxia depends on the initial alveolar Po2, the lung volume and the rate of oxygen consumption. It is, for example, more rapid while swimming underwater than while breath holding at rest in the laboratory. Generally speaking, after breathing air, 90 seconds of apnoea results in a substantial fall of Po2 to a level that threatens loss of consciousness. If a patient has previously inhaled a few breaths of oxygen, the arterial Po2 should remain above 13.3 kPa (100 mmHg) for at least 3 minutes of apnoea, and this is the basis of the usual method of protection against hypoxia during any deliberate interference with ventilation, as for example during tracheal intubation.
In view of the rapid changes shown in Figure 11.19, it follows that, for a patient breathing air, a pulse oximeter will probably give an earlier indication of underventilation than will a carbon dioxide analyser. However, if the patient is protected from hypoxia by the inhalation of a gas mixture enriched with oxygen, then the carbon dioxide will give the earlier indication of hypoventilation. It should be remembered that oxygen levels change quickly and are potentially much more dangerous. Carbon dioxide levels change only slowly (in response to a change in ventilation) and are usually less dangerous.
Control of the Inspired Oxygen Concentration59
Much of this chapter has been concerned with the theoretical basis for selection of the optimal inspired oxygen concentration for a particular pathophysiological state. In clinical practice the administration of oxygen to ill patients has become almost ubiquitous, both in the hospital and community settings. Recently published guidelines59 have sought to challenge this “oxygen culture”60 by recommending that oxygen therapy should, wherever possible, by guided by the patient’s oxygen saturation. Also, where oxygen is being used to treat tissue hypoxia treatment should also encompass correcting anaemia and low cardiac output states. Numerous systems exist for increasing the inspired oxygen concentration, and an understanding of these is crucial for effective therapy.
Fixed Performance Systems
These allow the delivery of a known concentration of oxygen, independent of the patient’s respiratory system – that is, the oxygen concentration delivered is unaffected by respiratory rate, tidal volume and inspiratory flow rate. Methods may be divided into low flow (closed) or high flow (open) delivery systems.
Closed delivery systems. A crucial factor in oxygen therapy is the nature of the seal between the patient’s airway and the external breathing apparatus. Airtight seals may be obtained with cuffed tracheal or tracheostomy tubes or, at low airway pressures, with a tight fitting facemask or laryngeal mask airway. These devices should give complete control over the composition of the inspired gas. Any closed delivery system requires the use of a breathing system that provides suitable separation of inspired and expired gases to prevent rebreathing, and does not present significant resistance to breathing.
Open delivery systems. Most disposable oxygen masks do not attempt to provide an airtight fit. An alternative solution to the problem of the airtight seal is to provide a high flow of gas, which can vent to atmosphere between the mask and the face, thus preventing the inflow of air. The required flow of air/oxygen mixture needs to be in excess of the peak inspiratory flow rate. For normal resting ventilation this is approximately 30 l.min−1 but in patients with respiratory distress may be considerably greater.
Oxygen may be passed through the jet of a Venturi to entrain air. Venturi based devices are a convenient and highly economical method of preparing high flows of oxygen mixtures in the range 25–40% concentration. For example, 3 l.min−1 of oxygen passed through the jet of a Venturi with an entrainment ratio of 8:1 will deliver 27 l.min−1 of 30% oxygen. Higher oxygen concentrations require a lower entrainment ratio and therefore a higher oxygen flow in order to maintain an adequate total delivered flow rate. Commercially available Venturi masks now have a variety of colour coded Venturi attachments that indicate the required oxygen flow rate, the inspired oxygen concentration achieved and the total gas flow rate. With an adequate flow rate of the air/oxygen mixture, the Venturi mask need not fit the face with an airtight seal. The high flow rate escapes round the cheeks as well as through the holes in the mask, and room air is effectively excluded. Numerous studies have indicated that the Venturi mask gives excellent control over the inspired oxygen concentration that is mostly unaffected by variations in the ventilation of the patient except at high oxygen concentrations.61 There is no doubt that this is the most satisfactory method of controlling the inspired oxygen concentration of a patient who is breathing spontaneously without tracheal intubation.
Control of the patient’s gaseous environment. The popularity of oxygen tents declined because of their large volume and high rate of leakage, which made it difficult to attain and maintain a high oxygen concentration unless the volume was reduced and a high gas flow rate used. In addition, the fire hazard cannot be ignored. These problems are minimised when the patient is an infant, and oxygen control within an incubator is a satisfactory method of administering a precise oxygen concentration.
Variable Performance Devices61
Simple disposable oxygen masks and nasal catheters aim to blow oxygen at or into the air passages. The oxygen is mixed with inspired air to give an inspired oxygen concentration that is a complex function of the geometry of the device, the oxygen flow rate, the patient’s ventilation and whether the patient is breathing through his mouth or nose. The effective inspired oxygen concentration is impossible to predict and may vary between very wide limits. These devices cannot be used for oxygen therapy when the exact inspired oxygen concentration is critical (e.g. ventilatory failure), but are useful in less critical situations such as recovery from routine anaesthesia. With simple oxygen masks a small inspiratory reservoir will store fresh gas during expiration for use during inspiration, which will tend to increase the inspired oxygen concentration but, again, in a somewhat unpredictable fashion.
With a device such as a nasal catheter or prongs, the lower the ventilation, the greater will be the fractional contribution of the fixed flow of oxygen to the inspired gas mixture. There is thus an approximate compensation for hypoventilation, with greater oxygen concentrations being delivered at lower levels of ventilation. Arterial Po2 may then be maintained in spite of a progressively falling ventilation. However, this will do nothing to prevent the rise in Pco2, which may reach a dangerous level without the appearance of cyanosis to warn that all is not well.62
Cyanosis
Cyanosis describes a blue discoloration of a subject’s skin and mucous membranes, and is almost universally caused by arterial hypoxaemia. Though now regarded as a sign of rather advanced hypoxia, there must have been countless occasions in which the appearance of cyanosis has given warning of hypoventilation, pulmonary shunting, stagnant circulation or decreased oxygen concentration of inspired gas. Indeed, it is interesting to speculate on the additional hazards to life if gross arterial hypoxaemia could occur without overt changes in the colour of the blood.
Central and Peripheral Cyanosis
If shed arterial blood is seen to be purple, this is a reliable indication of arterial desaturation. However, when skin or mucous membrane is inspected, most of the blood which colours the tissue is lying in veins (i.e. sub-papillary venous plexuses) and its oxygen content is related to the arterial oxygen content as follows:

The last term may be expanded in terms of the tissue metabolism and perfusion:
In normal circumstances, the oxygen consumption by the skin is low in relation to its circulation, so the second term on the right hand side of the second equation is generally small. Therefore, the cutaneous venous oxygen content is close to that of the arterial blood and inspection of the skin usually gives a reasonable indication of arterial oxygen content. However, when circulation is reduced in relation to skin oxygen consumption, cyanosis may occur in the presence of normal arterial oxygen levels. This occurs typically in patients with low cardiac output or in cold weather. Vigorous coughing, particularly when lying flat, or placing a patient in the Trendelenburg position causes the skin capillaries of the upper body to become engorged with venous blood, once again causing the appearance of cyanosis with normal arterial oxygen content.
Sensitivity of Cyanosis as an Indication of Hypoxaemia
Two factors may affect the ability to detect cyanosis. Anaemia will inevitably make cyanosis less likely to occur, and it is now generally accepted that cyanosis can be detected when arterial blood contains greater than 1.5 g.dl−1 of reduced haemoglobin,63 or at an arterial oxygen saturation of 85–90%, although there is much variation. Such levels would probably correspond to a ‘capillary’ reduced haemoglobin concentration of about 3 g.dl−1. The source of illumination can also affect the perceived colour of a patient’s skin.64 Some fluorescent tubes tend to make the patient look pinker and others impart a bluer tinge to the patient. The former gives false negatives (no cyanosis in the presence of hypoxaemia), while the latter gives false positives (cyanosis in the absence of hypoxaemia). However, the total number of false results is approximately the same with all tubes and provided all areas of the same hospital are illuminated with the same type of tube this effect is unlikely to adversely affect the assessment of a patient’s colour.
Thus the appearance of cyanosis is considerably influenced by the circulation, patient position, haemoglobin concentration and lighting conditions. Even when all these are optimal, cyanosis is by no means a precise indication of the arterial oxygen level and it should be regarded as a warning sign rather than a measurement. Cyanosis is detected in about half of patients who have an arterial saturation of 93%, and about 95% of patients with a saturation of 89%.64 In other words, cyanosis is not seen in 5% of patients at or below a saturation of 89% (arterial Po2 ≈ 7.5 kPa or 56 mmHg). It is quite clear that absence of cyanosis does not necessarily mean normal arterial oxygen levels.
Non-hypoxic cyanosis has several causes, all of which are rare, but worth considering in a patient who appears cyanosed but displays no other evidence of hypoxia. Sulph-haemoglobin, and more importantly methaemoglobin (at concentrations of 1.5 g.dl−1) cause a blue-grey appearance, and chronic use of drugs or remedies that include gold or silver have been reported to cause ‘pseudo-cyanosis’.65
Principles of Measurement of Oxygen Levels
Oxygen Concentration in Gas Samples
Para-magnetic analysers rely on the fact that oxygen will influence an electrically generated magnetic field in direct proportion to its concentration in a mixture of gases. A particularly attractive feature of the method for physiological use is the complete lack of interference by other gases likely to be present as significant paramagnetic properties are unique to oxygen. Early paramagnetic analysers were cumbersome, delicate and had slow response times, but technological progress has led to the availability of inexpensive, accurate and robust analysers that are now found in a whole range of anaesthetic and intensive care equipment. Measurement of breath-to-breath changes in oxygen concentrations of respired gases requires an instrument with a response time of less than about 300 ms and current paramagnetic analysers are easily capable of this.
Fuel cells have similarities to the polarographic electrode described below. An oxygen permeable membrane covers a cell made up of a gold cathode and lead anode separated by potassium hydroxide, which generates a current in proportion to the oxygen concentration. The response time is many seconds, so these analysers are not suitable for measuring inspired and expired oxygen concentrations. No electrical input is needed, the fuel cell acting like a battery generating its own power from the absorption of oxygen. However, the cell therefore also has a limited lifespan, depending on the total amount of oxygen to which it is exposed over time, but in normal clinical use, fuel cells last several months.
Blood Po2
Previous chemical based analyses have now been completely replaced by a single method:
Polarographic electrodes may now be made small enough to facilitate continuous intra-arterial monitoring of Po2, and a photochemical Po2 sensor has also been developed.67 Along with pH and Pco2 sensors (page 174) the intra-arterial catheter remains less than 0.5 mm in diameter.
Oxygen Saturation10
Blood oxygen saturation is measured photometrically. Near infra-red absorption spectra for different forms of haemoglobin69 are shown in Figure 11.20. Methods are based on the fact that the absorption of monochromatic light of certain wavelengths is the same (isobestic) for reduced and oxygenated haemoglobin (800 nm). At other wavelengths there is a marked difference between the absorption of transmitted or reflected light by the two forms of haemoglobin. Use of a greater number of different wavelengths also allows the detection and quantification of other commonly present haemoglobins. For example current generations of co-oximeter measure absorption at 128 different wavelengths and from the spectra obtained can calculate the quantities of O2Hb, HHb, COHb and metHb.
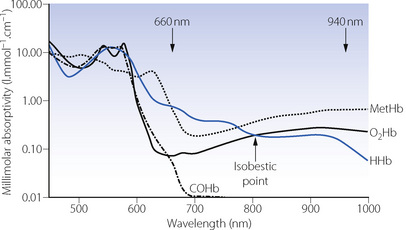
Fig. 11.20 Near infra-red absorption spectra for the four common types of haemoglobin seen in vivo. The isobestic point for oxyhaemoglobin (O2Hb) and deoxyhaemoglobin (HHb) is shown. To measure oxygen saturation, pulse oximeters use two wavelengths at around 660 and 940 nm, where the absorptivities of O2Hb and HHb differ significantly. If measurement of carboxyhaemoglobin and methaemoglobin is also required, a greater number of wavelengths must be used, and current generations of co-oximeter use over 100 different wavelengths.
(Data from reference 69.)
Oxygen saturation (So2) may be derived from Po2, a process which is performed automatically by some blood gas analysers (page 191). This is reasonably accurate above a Po2 of about 7.3 kPa (55 mmHg) but is inaccurate at lower tensions because, on the steep part of the curve, the saturation changes by 3% for a Po2 change of only 0.13 kPa (1 mmHg).
Pulse oximetry.70 Saturation may be measured photometrically in vivo as well as in vitro. Light at two different wavelengths is either transmitted through a finger or an ear lobe or else is reflected from the skin, usually on the forehead. The usual wavelengths used are 660 nm, where there is a large difference between the oxy- and deoxyhaemoglobin spectra (Figure 11.20), and 940 nm, close to the isobestic point. With the original techniques, most of the blood that was visualised was venous or capillary rather than arterial, and the result therefore depended on there being a brisk cutaneous blood flow to minimise the arterial/venous oxygen difference. The older techniques have now been completely replaced by pulse oximeters, which relate the optical densities at the two wavelengths to the pulse wave detected by the same sensor. The signal between the pulse waves is subtracted from the signal at the height of the pulse wave, the difference being due to the inflowing arterial blood and so reflecting the saturation of the arterial blood.
In the same manner as for the measurement of Hüfner’s constant (page 189), the presence of dyshaemoglobins (COHb and metHb) has caused controversy regarding the terminology used when discussing pulse oximetry.10 Oxygen saturation, as originally defined by Christian Bohr, is the ratio of O2Hb to active, oxygen binding, Hb (= O2Hb + HHb), rather than the more commonly used definition of the ratio of O2Hb to total Hb. The original definition is the more relevant as the COHb and metHb do not carry oxygen and do not affect pulse oximeter readings.10 Pulse oximeter So2 values are therefore a good assessment of pulmonary oxygenation, but not necessarily of oxygen carriage. Provided the dyshaemoglobins are only present in small quantities, as is usually the case, this distinction is of minor clinical importance. However, when larger quantities of dyshaemoglobins are present, particularly with carbon monoxide poisoning, the pulse oximeter will give falsely reassuring readings. For example, if 30% of the total haemoglobin present is bound to CO and Po2 is normal, the pulse oximeter will read normal values despite the oxygen content of the blood being reduced by 30%. With metHb a more complex situation results because its absorption spectrum is more similar to O2Hb and HHb than that of COHb (Figure 11.20) so it causes a slight reduction in So2 readings up to about 20% metHb. At higher levels of metHb pulse oximeter readings tend to become fixed at about 85%.
There are many other sources of error with pulse oximetry. Currently available pulse oximeters continue to function even in the presence of arterial hypotension, although there may be a delayed indication of changes in So2,71 and readings become less accurate below a systolic blood pressure of 80 mmHg.72 Anaemia tends to exaggerate desaturation readings: at a haemoglobin concentration of 8 g.dl−1 normal saturations were correctly recorded but there was a mean bias of −15% at a true So2 of 53.6%.73 Patients with dark skin were previously reported to have accurate readings with pulse oximetry, but some bias has been demonstrated at lower So2 values (<80%).74 If fingers or toes are used for pulse oximetry then nail polish should be removed. Different coloured polishes cause variable decreases in So2 values, with red/purple colours having less effect and darker or green/blue colours causing an average of between 1.6 and 5.5% fall in So2 values.75,76 Acrylic nails have also been shown to cause minor inaccuracies in pulse oximeter readings with some, but not all, instruments.77
Calibration of pulse oximeters presents a problem. Optical filters may be used for routine calibration, but the gold standard is calibration against arterial blood Po2 or saturation, which is seldom undertaken. When oxygenation is critical, there is no substitute for direct measurement of arterial Po2.
Tissue Po2
Clearly the tissue Po2 is of greater significance than the Po2 at various intermediate stages higher in the oxygen cascade. It would therefore appear logical to attempt the measurement of Po2 in the tissues, but this has proved difficult both in technique and in interpretation. For experimental procedures needle electrodes may be inserted directly into tissue, and Po2 measured on the tip of a needle. Difficulties of interpretation arise from the fact that Po2 varies immensely within the tissue, so even if a mean tissue Po2 can be measured this may not represent Po2 in the more relevant ‘lethal corner’ region (page 156).
Tissue surface electrodes. A miniaturised polarographic electrode may be placed on or attached to the surface of an organ to indicate the Po2. Interpretation of the reading is subject to many of the same limitations as with the needle electrode. Nevertheless, tissue surface Po2 may provide the surgeon with useful information regarding perfusion and viability in cases of organ ischaemia.
Near infra-red spectroscopy.78 In tissues that are relatively translucent the biochemical state of tissue oxidation may be determined by the use of transmission spectroscopy in the near infra-red (700–1000 nm). The state of relative oxidation of haemoglobin and cytochrome a3 may be determined within this wave band. At present it is feasible to study transmission spectroscopy over a path length up to about 9 cm, which is sufficient to permit monitoring of the brain of newborn infants. Use in adults requires reflectance spectroscopy and does allow assessment of oxygenation in, for example, an area of a few cubic centimetres of brain tissue. This is useful, for example, during surgery on the carotid arteries when changes in oxygenation in the area supplied by the artery concerned can be followed. However, the technique has failed to gain widespread acceptance because of interference from extracranial tissue, particularly scalp blood flow, and difficulties with calibrating the readings and defining any ‘normal’ values.
Indirect assessment of tissue oxygenation.79 Such are the difficulties of measurements of tissue Po2 that in clinical practice it is more usual simply to seek evidence of anaerobic tissue metabolism. In the absence of this, tissue perfusion and oxygenation can be assumed to be acceptable. Indirect methods that assess global (i.e. whole body) tissue perfusion include mixed venous oxygen saturation, measured either by sampling pulmonary arterial blood or using a fibreoptic catheter to measure oxygen saturation continuously in the pulmonary artery. Blood lactate levels also provide a global indication of tissue perfusion. However, acceptable global tissue oxygenation provides no reassurance about function either of regions in an individual organ or in an entire organ. Methods of assessing oxygenation in a specific tissue have focused on the gut because of ease of access and the observation that gut blood flow is often the first to be reduced when oxygen delivery is inadequate. Gastric intramucosal pH measurement allows an assessment to be made of cellular pH within the stomach mucosa, which has been shown to correlate with other assessments of tissue oxygenation and patient well-being during critical illness.
Measurement of Oxygen Consumption and Delivery
Oxygen Consumption
There are three main methods for the measurement of oxygen consumption:
Oxygen loss from a closed breathing system. Probably the simplest method of measuring oxygen consumption is by observing the loss of volume from a closed-circuit spirometer, with expired carbon dioxide absorbed by soda lime. It is essential that the spirometer should initially contain an oxygen enriched mixture so that the inspired oxygen concentration does not fall to a level that is dangerous for the subject or patient. Alternatively, a known flow rate of oxygen may be added to maintain the volume of the spirometer and its oxygen concentration constant: under these conditions, the oxygen inflow rate must equal the oxygen consumption. The technique may be adapted to the conditions of artificial ventilation (Figure 11.21), but the technique, although accurate, is cumbersome.80
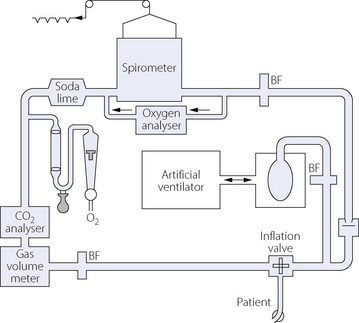
Fig. 11.21 A closed circuit spirometer system for measurement of oxygen consumption of a patient ventilated artificially by means of a box-bag system. When the system is in equilibrium, oxygen consumption is indicated by the oxygen added to the system, and carbon dioxide output is measured as the product of expired minute volume and mean carbon dioxide concentration in the expired gas. BF, bacterial filter.
(Reproduced from reference 81 by permission of the Editor and publishers of Critical Care Medicine.)
Subtraction of expired from inspired volume of oxygen. The essence of the technique is subtraction of the volume of oxygen breathed out (expired minute volume × mixed expired oxygen concentration) from the volume of oxygen breathed in (inspired minute volume × inspired oxygen concentration). The difference between the inspired and expired minute volumes is a very important factor in achieving accuracy with the method, particularly when a high concentration of oxygen is inhaled. Inspired and expired minute volumes differ as a result of the respiratory exchange ratio, and also any exchange of inert gas (e.g. nitrogen) that might occur. On the assumption that the patient is in equilibrium for nitrogen, and the mass of nitrogen inspired is the same as that expired, it follows that the ratio of inspired/expired minute volumes is inversely proportional to the respective ratios of nitrogen concentrations. Therefore:
This is the basis of the classical Douglas bag technique, in which expired gas is measured for volume, and analysed for oxygen and carbon dioxide concentrations. The expired nitrogen concentration is determined by subtraction and the inspired minute volume derived. The approach has been automated by several manufacturers and their systems can be used satisfactorily during artificial ventilation.81
Multiplication of cardiac output by arterial/mixed venous oxygen content difference. This approach is the reverse of using the Fick principle for measurement of cardiac output (see page 113) and is commonly known as the reversed Fick technique:
where  is the oxygen consumption,
  is the cardiac output, CaO2 is the arterial oxygen content and
  is the mixed venous oxygen content.
The technique is essentially invasive as the cardiac output must be measured by an independent method (usually thermodilution), and it is also necessary to sample arterial and mixed venous blood, the latter preferably from the pulmonary artery. Nevertheless it is convenient in the critical care situation where the necessary vascular lines may be in place.
The method has a larger random error than the gasometric techniques described above,82 but also has a systematic error as it excludes the oxygen consumption of the lungs. Studies comparing the two methods in humans show wide variations between different patient groups. The necessity for invasive monitoring prevents the study of normal awake subjects, but results from patients in intensive care (with presumed lung pathology) do not seem to differ from patients with normal lungs undergoing cardiac surgery. The contribution of the lungs to total oxygen consumption therefore remains to be fully elucidated, but studies so far indicate that the pulmonary contribution may be very variable depending on many physiological and pathological factors.82,83,84
Oxygen Delivery
Oxygen delivery is measured as the product of cardiac output and arterial oxygen content. This excludes oxygen delivered for consumption within the lung. In the intensive care situation, cardiac output is now commonly measured by thermal dilution and simultaneously an arterial sample is drawn for measurement of oxygen content by any of the methods described above. If oxygen delivery is determined at the same time as oxygen consumption is measured by the reversed Fick technique, it should be remembered that two of the variables (cardiac output and arterial oxygen content) are common to both measurements. This linking of data is a potential source of error in inferring the consequences of changes in one product on the other (see page 204).85
References
1. Kelman GR, Nunn JF. Computer Produced Physiological Tables. London and Boston, Mass.: Butterworth; 1968.
2. Kelman GR, Nunn JF, Prys-Roberts C, Greenbaum R. The influence of cardiac output on arterial oxygenation. Br J Anaesth. 1967;39:450-458.
3. Moran RF, Clausen JL, Ehrmayer S, Feil M, Van Kessel AL, Eichhorn JH. Oxygen content, hemoglobin oxygen “saturation,” and related quantities in blood: terminology, measurement, and reporting. Villanova PA: National Committee for Clinical Laboratory Standards publication C25-P; 1990.
4. Hsia CCW. Respiratory function of hemoglobin. N Engl J Med. 1998;338:239-247.
*5. Russo R, Benazzi L, Perrella M. The Bohr effect of hemoglobin intermediates and the role of salt bridges in the tertiary/quaternary transitions. J Biol Chem. 2001;276:13628-13634.
6. Ho C, Perussi JR. Proton nuclear magnetic resonance studies of haemoglobin. Methods Enzymol. 1994;232:97-139.
7. Gregory IC. The oxygen and carbon monoxide capacities of foetal and adult blood. J Physiol. 1974;236:625-634.
8. Zander R. The oxygen capacity of normal human blood. Pflügers Archiv. 1978;373(suppl 1):R43.
9. Dijkhuizen P, Buursma A, Fongers TME, Gerding AM, Oeseburg B, Zijlstra WG. The oxygen binding capacity of human haemoglobin: Hüfner’s factor redetermined. Pflügers Archiv. 1977;369:223-231.
*10. Toffaletti J, Zijlstra WG. Misconceptions in reporting oxygen saturation. Anesth Analg. 2007;105:S5-S9.
11. Adair GS. The hemoglobin system. VI. The oxygen dissociation curve of hemoglobin. J Biol Chem. 1925;63:529-545.
12. Imai K. Adair fitting to oxygen equilibration curves of hemoglobin. Methods Enzymol. 1994;232:559-576.
13. Kelman GR. Digital computer subroutine for the conversion of oxygen tension into saturation. J Appl Physiol. 1966;21:1375-1376.
14. Severinghaus JW, Stafford M, Thunstrom AM. Estimation of skin metabolism and blood flow with tcPO2 and tcPCO2 electrodes by cuff occlusion of the circulation. Acta Anaesthiol Scand Supp. 1978;68:9-15.
15. Thomas LJ. Algorithms for selected blood acid-base and blood gas calculations. J Appl Physiol. 1972;33:154-158.
16. MacDonald R. Red cell 2, 3-diphosphoglycerate and oxygen affinity. Anaesthesia. 1977;32:544-553.
17. Morgan TJ, Koch D, Morris D, Clague A, Purdie DM. Reduced red cell 2,3-diphosphoglycerate concentrations in critical illness without decreased in vivo P50. Anaesth Intensive Care. 2001;29:479-483.
18. Shafer AW, Tague LL, Welch MH, Guenter CA. 2, 3-Diphosphoglycerate in red cells stored in acid-citrate-dextrose and citrate-phosphate-dextrose: Implications regarding delivery of oxygen. J Lab Clin Med. 1971;77:430-437.
19. Heaton A, Keegan T, Holme S. In vivo regeneration of red cell 2, 3-diphosphoglycerate following transfusion of DPG-depleted AS-1, AS-3 and CPDA-1 red cells. Br J Haematol. 1989;71:131-136.
20. Sheldon GF. Diphosphoglycerate in massive transfusion and erythrophoresis. Crit Care Med. 1979;7:407-411.
21. Bowen JC, Fleming WH. Increased oxyhaemoglobin affinity after transfusion of stored blood: evidence for circulatory compensation. Ann Surg. 1974;180:760-764.
22. Torrance J, Jacobs P, Restrepo A, Eschbach J, Lenfant C, Finch CA. Intraerythrocytic adaptation to anemia. N Engl J Med. 1970;283:165-169.
23. Marshall BE, Whyche MQ. Hypoxemia during and after anesthesia. Anesthesiology. 1972;37:178-209.
24. Hobbs AJ, Gladwin MT, Patel RP, Williams DLH, Butler AR. Haemoglobin: NO transporter, NO inactivator or none the above. Trends Pharmacol Sci. 2002;23:406-411.
25. Gross SS. Targeted delivery of nitric oxide. Nature. 2001;409:577-578.
*26. Gaston B, Singel D, Doctor A, Stamler JS. S-nitrosothiol signaling in respiratory biology. Am J Respir Crit Care Med. 2006;173:1186-1193.
27. Jia L, Bonaventura C, Bonaventura J, Stamler JS. S-nitrosohaemoglobin: a dynamic activity of blood involved in vascular control. Nature. 1996;380:221-226.
28. Hogg N. The biochemistry and physiology of S-nitrosothiols. Annu Rev Pharmacol Toxicol. 2002;42:585-600.
29. Stamler JS, Simon DL, Osborne JA, et al. S-Nitrosylation of proteins with nitric oxide: Synthesis and characterisation of biologically active compounds. Proc Natl Acad Sci USA. 1992;89:444-448.
30. Shen W, Hintze TH, Wolin MS. Nitric oxide: An important signaling mechanism between vascular endothelium and parenchymal cells in the regulation of oxygen consumption. Circulation. 1995;92:3505-3512.
31. Pawloski JR, Hess DT, Stamler JS. Export by red blood cells of nitric oxide bioactivity. Nature. 2001;409:622-626.
32. Atkins JL, Day BW, Handrigan MT, Zhang Z, Pamnani MB, Gorbunov NV. Brisk production of nitric oxide and associated formation of S-nitrosothiols in early hemorrhage. J Appl Physiol. 2006;100:1267-1277.
33. Cabrales P, Tsai AG, Intaglietta M. Nitric oxide regulation of microvascular oxygen exchange during hypoxia and hyperoxia. J Appl Physiol. 2006;100:1181-1187.
34. Huisman TH. The structure and function of normal and abnormal haemoglobins. Baillière’s Clin Haematol. 1993;6:1-30.
35. Wajcman H, Galacteros F. Abnormal haemoglobins with high oxygen affinity and erythrocytosis. Hematol Cell Ther. 1996;38:305-312.
36. Gladwin MT, Vichinsky E. Pulmonary complications of sickle cell disease. N Engl J Med. 2008;359:2254-2265.
37. McLaughlin VV, Channick R. Sickle cell disease-associated pulmonary hypertension. A coat of many colors. Am J Respir Crit Care Med. 2007;175:1218-1219.
38. Platt OS. Hydroxyurea for the treatment of sickle cell anemia. N Engl J Med. 2008;358:1362-1369.
39. Guay J. Methemoglobinemia related to local anesthetics: A summary of 242 episodes. Anesth Analg. 2009;108:837-845.
40. Choi A, Sarang A. Drug-induced methaemoglobinaemia following elective coronary artery bypass grafting. Anaesthesia. 2007;62:737-740.
41. Goodnough LT, Shander A, Brecher ME. Transfusion medicine: looking to the future. Lancet. 2003;361:161-169.
42. Spiess BD. Perflurocarbon emulsions: One approach to intravenous artificial respiratory gas transport. Int Anesthesiol Clin. 1995;33:103-113.
43. Spahn DR, van Brempt R, Theilmeier G, et al. Perflubron emulsion delays blood transfusions in orthopaedic surgery. European Perflubron emulsion study group. Anesthesiology. 1999;91:1195-1208.
44. Tobias MD, Longnecker DE. Recombinant haemoglobin and other blood substitutes. Baillières Clin Anaesth. 1995;9:165-179.
*45. Chang TMS. Future generations of red blood cell substitutes. J Intern Med. 2003;253:527-535.
46. Natanson C, Kern SJ, Lurie P, Banks SM, Wolfe SM. Cell-free hemoglobin-based blood substitutes and risk of myocardial infarction and death. A meta-analysis. JAMA. 2008;299:2304-2312.
47. Looker D, Abbott-Brown D, Kozart P, et al. A human recombinant hemoglobin designed for use as a blood substitute. Nature. 1992;356:258-260.
48. Awasthi V, Yee S-H, Jerabek P, Goins B, Phillips WT. Cerebral oxygen delivery by liposome-encapsulated hemoglobin: a positron-emission tomographic evaluation in a rat model of hemorrhagic shock. J Appl Physiol. 2007;103:28-38.
49. Lu S-J, Feng Q, Park JS. Biologic properties and enucleation of red blood cells from human embryonic stem cells. Blood. 2008;112:4475-4484.
50. Korzeniewski B. Theoretical studies on the regulation of oxidative phosphorylation in intact tissues. Biochim Biophys Acta. 2001;1504:31-45.
51. Weibel ER, Taylor CR, Weber J-M, Vock R, Roberts TJ, Hoppeler H. Design of the oxygen substrate pathways. VII Different structural limits for oxygen and substrate supply to muscle mitochondria. J Exp Biol. 1996;199:1699-1709.
52. Barcroft J. Physiological effects of insufficient oxygen supply. Nature. 1920;106:125-129.
53. Hinds C, Watson D. Manipulating hemodynamics and oxygen transport in critically ill patients. N Engl J Med. 1995;333:1074-1075.
54. Pinsky MR. Beyond global oxygen supply-demand relations: in search of measures of dysoxia. Intensive Care Med. 1994;20:1-3.
55. Shoemaker WC, Bland RD, Apel PL. Therapy of critically ill postoperative patients based on outcome prediction and prospective clinical trials. Surg Clin North Am. 1985;65:811-833.
56. Gattinoni L, Brazzi L, Pelosi P, et al. A trial of goal-oriented hemodynamic therapy in critically ill patients. N Engl J Med. 1995;333:1025-1032.
57. Steltzer H, Hiesmayr M, Mayer N, Krafft P, Hammerle AF. The relationship between oxygen delivery and uptake in the critically ill: is there a critical or optimal therapeutic value? A meta-analysis. Anaesthesia. 1994;49:229-236.
58. Kem JW, Shoemaker WC. Meta-analysis of haemodynamic optimization in high-risk patients. Crit Care Med. 30, 2002. 1686–1672
59. O’Driscoll BR, Howard LS, Davison AG. BTS guideline for emergency oxygen use in adult patients. Thorax. 2008;63(suppl VI):1-68.
60. Leach RM, Davidson AC. Use of emergency oxygen in adults. BMJ. 2009;338:366-367.
61. Wagstaff TAJ, Soni N. Performance of six types of oxygen delivery devices at varying respiratory rates. Anaesthesia. 2007;62:492-503.
62. Davies RJO, Hopkin JM. Nasal oxygen in exacerbations of ventilatory failure; an underappreciated risk. BMJ. 1989;299:43-44.
63. Goss GA, Hayes JA, Burdon JAW. Deoxyhaemoglobin in the detection of central cyanosis. Thorax. 1988;43:212-213.
64. Kelman GR, Nunn JF. Clinical recognition of hypoxaemia under fluorescent lamps. Lancet. 1966;1:1400-1403.
65. Timmins AC, Morgan GAR. Argyria or cyanosis. Anaesthesia. 1988;43:755-756.
66. Clark LC. Monitor and control of tissue oxygen tensions. Trans Am Soc Artif Inter Organs. 1956;2:41-48.
67. Ganter M, Zollinger A. Continuous intravascular blood gas monitoring: development, current techniques, and clinical use of a commercial device. Br J Anaesth. 2003;91:397-407.
68. Severinghaus JW. A combined transcutaneous Po2-Pco2 electrode with electrochemical HCO3− stabilization. J Appl Physiol. 1981;51:1027-1032.
69. Zijlstra WG, Buursma A, Meeuwsen-van der Roest WP. Absorption spectra of human fetal and adult oxyhemoglobin, de-oxyhemoglobin, carboxyhemoglobin, and methemoglobin. Clin Chem. 1991;37:1633-1638.
70. Severinghaus JW, Kelleher JF. Recent developments in pulse oximetry. Anesthesiology. 1992;76:1018-1038.
71. Severinghaus JW, Spellman MJ. Pulse oximeter failure thresholds in hypotension and vasoconstriction. Anesthesiology. 1990;73:532-537.
72. Hinkelbein J, Genzwuerker HV, Fiedler F. Detection of a systolic pressure threshold for reliable readings in pulse oximetry. Resuscitation. 2005;64:315-319.
73. Severinghaus JW, Koh SO. Effect of anemia on pulse oximeter accuracy at low saturation. J Clin Monit. 1990;6:85-88.
74. Feiner JR, Severinghaus JW, Bickler PE. Dark skin decreases the accuracy of pulse oximeters at low oxygen saturation: the effects of oximeter probe. Anesth Analg. 2007;105:S18-S23.
75. Coté CJ, Goldstein A, Fuchsman WH, Hoaglin DC. The effect of nail polish on pulse oximetry. Anesth Analg. 1988;67:683-686.
76. Hinkelbein J, Genzwuerker HV, Sogl R, Fiedler F. Effect of nail polish on oxygen saturation determined by pulse oximetry in critically ill patients. Resuscitation. 2007;72:82-91.
77. Hinkelbein J, Koehler H, Genzwuerker HV, Fiedler F. Artificial acrylic finger nails may alter pulse oximetry measurement. Resuscitation. 2007;74:75-82.
78. Harris DNF. Near infra-red spectroscopy. Anaesthesia. 1995;50:1015-1016.
79. Vincent JL. Monitoring tissue perfusion. Can J Anaesth. 1996;43:R55-R57.
80. Nunn JF, Makita K, Royston B. Validation of oxygen consumption measurements during artificial ventilation. J Appl Physiol. 1989;67:2129-2134.
81. Makita K, Nunn JF, Royston B. Evaluation of metabolic measuring instruments for use in critically ill patients. Crit Care Med. 1990;18:638-644.
82. Smithies MN, Royston B, Makita K, Konieczko K, Nunn JF. Comparison of oxygen consumption measurements: indirect calorimetry versus the reversed Fick method. Crit Care Med. 1991;19:1401-1406.
83. Jolliet P, Thorens JB, Nicod L, Pichard C, Kyle U, Chevrolet JC. Relationship between pulmonary oxygen consumption, lung inflammation, and calculated venous admixture in patients with acute lung injury. Intensive Care Med. 1996;22:277-285.
84. Saito H, Minamiya Y, Kawai H, et al. Estimation of pulmonary oxygen consumption in the early postoperative period after thoracic surgery. Anaesthesia. 2007;62:648-653.
85. Walsh TS, Lee A. Mathematical coupling in medical research: lessons from studies of oxygen kinetics. Br J Anaesth. 1998;81:118-120.