Chapter 3 Cardiopulmonary function testing
ADULTS
ASSESSMENT OF PULMONARY FUNCTION
Introduction
In health the human cardiorespiratory system has enormous reserve capacity to cope with the demands of exercise or illness. We are not normally aware of breathlessness or fatigue as a feature of resting activity. Furthermore, unless we harbour athletic ambitions, we are unlikely to explore the boundaries of our physiological limitations and assure ourselves that spare capacity would be present if it ever became necessary. The measurement of physiological capacity in health is, therefore, a matter of relevance only to the curious or the serious competitor who wishes to improve his performance. In patients with heart or lung disease the erosion of physiological reserve eventually imposes limitations upon the activities of daily life. Under these circumstances the measurement of cardiopulmonary function allows the accurate assessment of disability and of the effect of therapeutic intervention. This chapter examines the scientific basis of clinical measurement and its relevance to physiotherapy.
It is reasonable and conventional to consider the function of the cardiovascular system in three compartments. First the lungs themselves, second the effectiveness of the integrated activity of gas exchange and acid–base balance, and finally the capacity of the circulatory system to deliver.
Lung function
The apparently simple function of the lung is to deliver oxygen to the gas-exchanging surface and exhaust carbon dioxide to the atmosphere. To achieve this, air is drawn by conductive flow into the alveoli and presented to the gas-exchanging surface where diffusion effects the process of exchange. The carriage of air through the airways depends on the patency of the tubes as well as on the consistency of the lung and the power of the respiratory muscles. These aspects of pulmonary function are commonly measured in lung function laboratories.
General principles of measurement
Lung function measurements are made to describe the lung for diagnostic purposes and subsequently in monitoring change. Accuracy and consistency are therefore very important and conventions exist for the procedures of measurement and expression of results. In general, a measurement will only be accepted after multiple attempts have been scrutinized and expressed under standard conditions. These are usually body temperature and atmospheric pressure (BTPS). To guarantee accuracy, laboratory practice should include regular physical and biological calibration of the equipment. Standards for good laboratory conduct have been described (British Thoracic Society/Association of Respiratory Technologists and Physiologists 1994). In health there are several factors that influence the magnitude of lung function. These include height, sex and age and to a lesser degree weight and ethnic origin (Anthonisen 1986, Cotes 1993). As a result, assessment of normality can only be made by comparison with reference values. The latter are obtained from the study of large numbers of normal people from the relevant population (European Community for Coal and Steel 1983). Once obtained, results can be expressed as percentage predicted or, more correctly, by comparison with the 95% confidence interval for that value.
Airway function
For the purposes of measurement the lung has only one portal of entry and exit, i.e. through the mouth, and airway function is assessed by quantification of gas flow or volume. The calibre of the airways reduces through their generations and the major resistance to gas flow is normally in the upper airway. The larger airways are supported by cartilage, while the smaller airways are held patent by the radial traction of the surrounding lung so that their calibre increases with the volume of the lung. The diameter of these airways is also controlled by neural tone, which is predominantly parasympathetic.
The disruption of airway function can occur through physical or rigid obstruction to a large airway by, for example, a tracheal tumour. It may also occur because of more widespread disease in asthma, when large numbers of smaller airways are affected by episodic alteration of their calibre by smooth muscle contraction, mucosal oedema and intraluminal secretions. In chronic bronchitis, obstruction occurs by mucosal thickening and mucus secretion but in emphysema the mechanism is different. Though seldom occurring in isolation from other forms of airway obstruction, the result of parenchymal emphysema is to weaken the elastic structure which maintains radial traction on the airways and allows them to close too early in expiration.
Tests of airway function measure airway calibre and are now well established in clinical practice. Most tests of airway patency examine expiratory function. There are three common methods:
Production of the spirogram from a maximal forced expiration following a full inspiration is reliable and provides the forced expiratory volume in 1 second (FEV1) and the forced vital capacity (FVC) (Fig. 3.1). The measurement is usually made using a spirometer, which measures volume, or is derived from a flow signal obtained from a pneumotachograph or turbine. Most commonly, the FEV1 and FVC are measured during the same manoeuvre, but a greater vital capacity may be obtained in patients with airway disease if it is performed slowly. Reduction in FEV1 with relative preservation of FVC or vital capacity (VC) is known as an ‘obstructive’ pattern, which indicates and grades airway obstruction: FEV1/FVC <75% is graded as mild, <60% as moderate and <40% as severe impairment (American Thoracic Society 1986). Simultaneous reduction in both FEV1 and FVC with an increase in the FEV1/FVC ratio is called a ‘restrictive’ defect and is usually associated with a reduction in lung volume. Abnormal values are defined as those recognized to be outside the normal range of two standard deviations for sex, height and age. This usually requires a reduction of about 15% from predicted values. Thus simple spirometry can detect and quantify airway obstruction, but gives no indication of the cause.
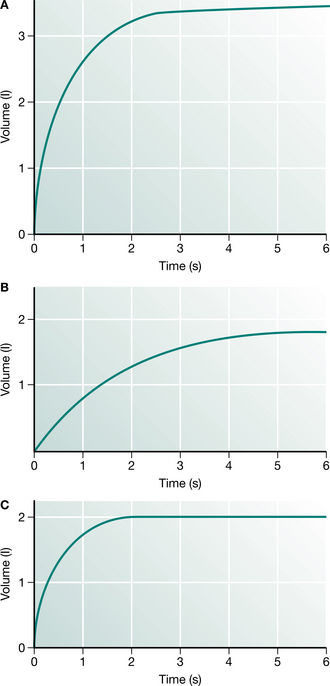
Figure 3.1 (A) In the normal spirogram the major part of the vital capacity (FVC) is expelled in 1 s (FEV1). (B) In patients with airway obstruction the FEV1 is reduced to a greater degree than the FVC. This pattern is known as ‘obstructive’. (C) When the lungs are small and empty quickly the pattern is known as ‘restrictive’.
Measurement of the flow–volume curve is now commonplace and can provide information about the nature of airway obstruction. In this test, the gas flow from a full maximum expiration is plotted against the expired volume as the lung empties (Fig. 3.2). The flow of gas from the lung reaches a peak expiratory flow (PEF) after about 100 milliseconds and then declines linearly as the lung empties. If the measurement is continued into the subsequent full inspiration, a flow–volume ‘loop’ is produced and inspiratory flow rates can be measured. The shape of the expiratory and inspiratory portions are different, since in expiration the active expulsion is assisted by the elastic recoil of the lung while inspiratory flow rates are a reflection of airway calibre and inspiratory muscle strength only. Something of the nature of the airway obstruction can be learnt from consideration of the actual and relative values of PEF, peak inspiratory flow (PIF) and the values of expiratory flow at 50% and 75% vital capacity (MEF50 and MEF75). Simple inspection of the loop is often sufficient to distinguish between rigid upper airway obstruction, intraluminal obstruction in chronic bronchitis and asthma, and the ‘pressure-dependent’ collapse seen in pure emphysema with relative preservation of inspiratory flow rates.
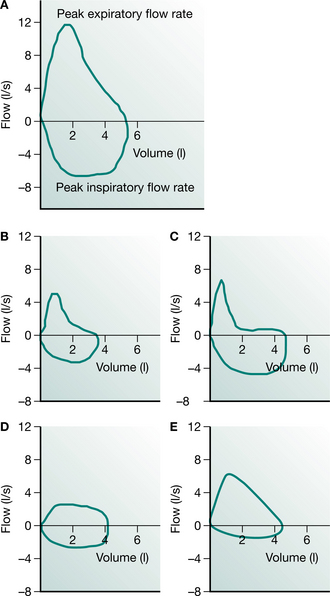
Figure 3.2 (A) The normal flow–volume loop has a characteristic shape. (B) Airway obstruction from asthma or chronic bronchitis appears as a concave expiratory limb and reduced inspiratory flows. (C) In emphysema the expiratory flows are suddenly attenuated but the inspiratory flows are relatively well preserved. (D) A rigid obstruction to a major airway can produce an oval loop. (E) Inspiratory flows are reduced in diaphragm weakness or extrathoracic tracheal obstruction.
The PEF is one component of the flow–volume manoeuvre that is widely used owing to the availability of simple devices for its measurement. Provided that the patient does not have weak respiratory muscles and has made a maximum effort, the PEF will reflect airway calibre. The absolute values obtained are not particularly helpful unless they are extremely low but the easily repeated measurements can be used to obtain valuable insight into the mechanisms of variable airway obstruction in asthma. There is a normal diurnal variation in airway calibre of about 50 ml/min, which is exaggerated in patients with poorly controlled asthma (Benson 1983). Wider variation will be seen approaching or recovering from an attack and following exposure to trigger factors.
The real value of the PEF lies in its repeatability and its portability. The issue of meters to patients with asthma allows domiciliary and occupational investigation of asthma. PEF also provides an objective measurement for patients to use to monitor their asthma as part of a self-management plan and it can be used during hospital admissions to record the progress and predict the discharge of patients with airway disease. Although this is valuable in asthma where the airway obstruction is variable, it can show no change at all in patients with chronic airflow limitation in spite of a clinical improve ment. In this case the twice-weekly measurement of FEV1 and FVC is more likely to mirror progress than will the slavish recording of the PEF chart (Gibson 1995).
Changes in spirometry are poorly related to clinical improvements after bronchodilator therapy in chronic obstructive pulmonary disease (COPD). O’Donnell et al (1999) have suggested that an increase in inspiratory capacity (a reflection of resting lung hyperinflation) may reflect improvements in exercise endurance capacity and dyspnoea more accurately than FEV1 or FVC measures. Airway responsiveness is a measure of the degree of airway narrowing to specific and non-specific stimuli. Histamine and methacholine are the most widely used non-specific stimuli in challenge tests. Using the tidal breathing method (Juniper et al 1994), doubling concentrations of methacholine (0.03 to 16 mg/ml) are nebulized via a Wright nebulizer. Airway hyperresponsiveness is defined as a >20% fall in FEV1 with a concentration of <8 mg/ml (PC20FEV1 <8 mg/ml).
Most asthmatics have a combination of eosinophilic airway, airway responsiveness and variable airflow obstruction to the extent that many definitions of asthma now include these three features. There is evidence that directing treatment at improving airway responsiveness reduces mild exacerbations of asthma. Elevated exhaled nitric oxide concentration due to increased inducible nitric oxide synthetase (INOS) expression and activity in the bronchial epithelium is a feature of untreated asthma (Kharitonov et al 1994). The relationship between nitric oxide (NO) and asthma severity or response to treatment is unclear (Sont et al 1999).
The physical properties of the lung
The two lungs contain millions of alveoli within a fibroelastic matrix. They do not have a very rigid structure and are held in contact with the rib cage by surface tension forces at the apposition of the two pleural surfaces. The resting volume of the lung (the functional residual capacity (FRC)) is thus determined by the outward spring of the rib cage and the inward elastic recoil of the lung matrix. Expansion and contraction of the lung therefore involves the controlled stretching or relaxation of the lung by the respiratory muscles away from FRC. The position of FRC can be influenced if the lung is stiffer than usual (as in interstitial disease) or if it is more compliant (as when damaged by emphysema). The measurement of the lung’s volume can therefore give some insight into these conditions.
For obvious reasons direct measures of lung volume cannot be made. The most familiar method is helium dilution, which involves rebreathing through a closed circuit a mixture of gases containing a known concentration of helium, which is not absorbed into the circula tion. The measurement of the final concentration of helium is used to calculate the gas dilution, or the ‘accessible’ volume, of the lung. An alternative method uses the Boyle’s law principle: gas in the chest is compressed and the change in pressure is used to calculate the volume of gas within the chest. This method requires a large airtight box or plethysmograph. In both the actual volume that is estimated is the FRC, and total lung capacity (TLC) and residual volume (RV) are obtained from an additional spirometric trace. A further method involves the calculation of the total volume of the lung from the dimensions of a chest radiograph. This volume includes the total volume of gas, tissue and blood. Since the techniques do measure different aspects of volume, consistency in sequential measurements is important. In normal lungs the results are very similar, but where there is airway obstruction the values may be disparate. Such disparity can be used to advantage, e.g. in calculating the degree of trapped gas as the difference between the plethysmographic and helium dilution lung volumes.
The chest wall and the respiratory muscles
To maintain their shape the lungs depend on the support of the rib cage and the patency of the airways and alveoli. The expansion of the rib cage by the respiratory muscles is responsible for the tidal flow of gas into and out of the lungs. Over the past few years there has been increasing awareness of the importance of dysfunction of the respiratory muscles and the bony rib cage in contributing to respiratory failure. Such conditions include myopathies and polio as well as skeletal mal-formations such as scoliosis, which decrease rib cage compliance and reduce the effectiveness of the musculature.
The respiratory muscles include the diaphragm as the major muscle of inspiration and the intercostal muscles and scalenes. The latter, together with the sternomastoids, are known as the ‘accessory muscles’, but actually have a stabilizing role in tidal breathing. The combination of the respiratory muscles and the bony rib cage is called the ‘chest wall’ and conceptually is considered as the organ which inflates the lungs. Weakness of the respiratory muscles will eventually lead to ventilatory failure which may first become apparent during the night as an exaggeration of the normal nocturnal hypoventilation (Shneerson 1988).
The function of the respiratory muscles is difficult to study directly since the muscles have complex origins and insertions. Furthermore, their product, which is the pressure generated within the thoracic cavity, depends on the coordinated action of many muscles, the individual functions of which may be difficult to distinguish in life. It is possible to make some assessment of both the strength and endurance of the muscles and also to separate the diaphragm from the other muscles. The simple strength that the inspiratory and expiratory muscles can generate as pressure is easy to measure. The maximum inspiratory pressure (Pimax) and expiratory pressure (Pemax) are easy to measure with a manometer or electronic gauge. The normal values of approximately −100 cmH2O and +120 cmH2O (Black & Hyatt 1971) are well in excess of that needed to inflate the lungs (5–10 cmH2O) and therefore provide a sensitive measure of developing muscle weakness. These measurements do have a learning requirement and are not suitable for monitoring of patients with rapidly developing muscle weakness, such as in Guillain–Barré syndrome. Under these circumstances the sequential measurement of the vital capacity is much more reliable, since a failure to maintain it will predict ventilatory failure.
The strength of the diaphragm can be separated from the other muscles by measuring the pressure gradient across it. This is achieved by using balloons attached to pressure transducers to estimate the pressure in the oesophagus and the stomach. The gradient across the diaphragm during a maximum inspiration or sniff is an indirect measure of the strength of the diaphragm. Normal values for sniff pressures have now been published (Uldry & Fitting 1995). If required, a value free of volition can be obtained by electrical stimulation of the phrenic nerve in the neck or even by magnetic stimulation of the cerebral cortex.
Fortunately, measurements of separate diaphragm strength are seldom required in clinical practice. A simple guide to diaphragm function can be obtained by observation of the change in vital capacity with posture. When supine, the vital capacity normally falls by 8–10%, but when diaphragm weakness is present it may fall by more than 30%. The measurement of the supine vital capacity is therefore a good screening test of diaphragm function (Green & Laroche 1990) and the measurement of sniff pressures at the mouth or nose is a reflection of pure diaphragmatic activity.
Gas exchange and oxygen delivery
The requirements of the average cell for oxygen are quite modest and a mitochondrion may need a PO2 of as little as 1 kPa (7.5 mmHg) to function effectively. At sea level the atmospheric PO2 is 20 kPa (150 mmHg) (FiO2 = 0.21) and in the process of delivering oxygen to the cell, there is a loss along this gradient. The first step is the dilution of inspired air with expired air within the alveolus. Each tidal breath VT contains a portion of gas which will remain within the airways and not come into contact with the alveoli. This is known as the ‘dead- space ventilation’ VD and must be achieved before any effective alveolar ventilation VA can take place:
Alveolar gas therefore contains a mixture of fresh gas and some expired CO2 and the alveolar PO2 is reduced to about 16 kPa (120 mmHg) before gas exchange begins.
At the alveolar level, gas exchange involves the transfer across the alveolar–capillary membrane of oxygen molecules to the blood and the reverse transfer of carbon dioxide. This is achieved by simple diffusion, which is amplified in the case of oxygen by the affinity of haemoglobin. It normally takes mixed venous blood about 300 milliseconds (ms) to traverse a capillary and complete equilibrium usually occurs in about 100 ms. This aspect of oxygen transfer from the lung to the blood can be tested using carbon monoxide. Carbon monoxide has a very strong affinity for haemoglobin, follows the same path into the blood and can be measured easily. This principle forms the basis of the carbon monoxide transfer test, which measures the amount of carbon monoxide that can be transferred to the blood in the course of a single breath (TLCO). This gives a rough indication of the gas-transferring ability of the lung as a whole and is reduced in conditions such as fibrosing alveolitis, emphysema and pneumonectomy where the quality or quantity of the gas-exchanging surface is reduced. If the total TLCO is corrected for lung volume then the subsequent value is known as the ‘coefficient of gas transfer’ (KCO) and describes the gas-exchanging quality of the lung that is available for ventilation. For example, a very large normal man and a small child should have different TLCOs but their KCO values should be identical.
The carbon monoxide transfer test can give some information about the ability of the lung to transfer gas, but there is not a direct relationship between the TLCO and arterial oxygenation. The lung contains millions of alveolar–capillary units and adequate oxygenation depends on the coordinated, satisfactory function of the whole unit. The pulmonary causes of arterial hypoxaemia have four major origins:
Hypoventilation is fairly easy to recognize because the fall in arterial PO2 is associated with a rise in arterial PCO2. This occurs in ventilatory failure associated with airway obstruction, chest wall disease and drug intoxication. Interference with pulmonary diffusion is quite rare because the process is very efficient. However, the system may be stretched at altitude or in the presence of disease such as fibrosing alveolitis. Even in this disease the hypoxia is related to increased pulmonary capillary transit time rather than to diffusion failure. The most common contribution to hypoxaemia in many diseases is ventilation/perfusion ( /
/ ) imbalance. Since effective lung function depends on the coordination of equivalent ventilation and perfusion to all units, it is not surprising that failure of the local matching mechanisms can cause trouble. The most extreme example would be a pulmonary embolus where ventilation continues in an area with no circulation. In other conditions such as asthma, the patchy distribution of airway obstruction will have similar but less dramatic effects. Some blood passes through the lung without coming into contact with the gas-exchanging surface. Normally this is a very small quantity (<5%), but effective shunts can be considerable in pneumonia and other conditions where the alveoli are blocked by inflammatory exudate although the circulation continues through the ineffective portion of the lung. This results in extreme hypoxia, which cannot easily be corrected by additional oxygen.
Oxygen carriage and arterial blood gases
Oxygen and carbon dioxide are carried in the blood in different ways. Oxygen is immediately bound to haemoglobin and released in the tissues under conditions of low oxygen tension or acidosis. Very little oxygen is carried in solution in the blood under conditions of normal pressure, although this can be increased in a hyperbaric chamber. By contrast, carbon dioxide is carried in the blood entirely in solution, mostly as bicarbonate. The difference between the two forms of carriage of the metabolic gases is fundamental to the interpretation of the measurement of arterial blood gases. The individual cell requires oxygen to survive, but the carriage of oxygen in the blood will have no effect on the body other than the delivery. By contrast, the chemistry involved in the carriage of carbon dioxide controls the short-term acid–base state of the body. When considering blood gas measurements, it is best to examine these functions separately.
The normal atmospheric PO2 is approximately 20 kPa (150 mmHg) falling to 16 kPa (120 mmHg) within the alveolus. The arterial PO2 (PaO2) is usually about 14 kPa (105 mmHg) in a healthy subject. Although we are used to these values, they are only true at sea level and really only have relevance because the partial pressure is easy to measure. What matters to the individual cell is the quantity of oxygen that it receives, not the partial pressure. Oxygen delivery to the tissues depends on other factors, including the amount of haemoglobin, the degree of saturation of haemoglobin with oxygen and the rate at which oxygenated blood is delivered to the tissues. Assuming that the haemoglobin and the cardiac output are normal, then the measurement of oxygen saturation of haemoglobin is more relevant to oxygen delivery than is the PaO2. The PaO2 is related to oxygen saturation in a complex manner determined by the properties of haemoglobin and known as the ‘oxygen dissociation curve’ (Fig. 3.3). This relationship demonstrates that, under most conditions, once PaO2 reaches 8 kPa (60 mmHg), haemoglobin is fully saturated and cannot carry more oxygen. Thus an arterial PO2 above that value is only an insurance measure.
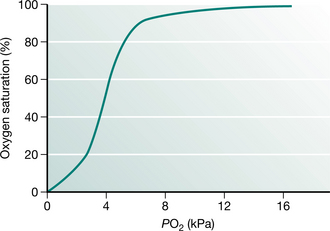
Figure 3.3 The oxygen dissociation curve relates oxygen saturation to ambient PO2. In lung disease it is important to recognize that oxygen delivery is assured if PaO2 is in excess of 8 kPa.
The availability of pulse oximeters has made the non-invasive measurement of oxygen saturation (SpO2) comm-onplace. Pulse oximeters work by transcutaneous examination of the colour spectrum of haemoglobin, which changes with its degree of saturation. These instruments are reasonably accurate over the top range of saturation, but become unreliable below about 50% (Tremper & Barker 1989). The measurement of SpO2 is an extremely valuable tool for monitoring patients’ safety. There are, however, some important aspects of interpretation of its use that may be potentially hazardous. Oximetry provides information about oxygen saturation and this will relate to ventilation only if the inspired oxygen level is normal. Monitoring oxygen saturation will not detect underventilation and a rising PaCO2. In patients who are breathing additional oxygen, a false sense of security can be given by a normal SpO2 even though the PaCO2 is rising. Furthermore, accurate recording of SaO2 requires a good peripheral circulation which may often be compromised in patients who are hypovolaemic.
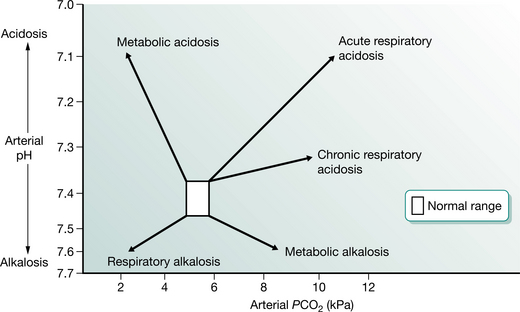
The assessment of acid–base status requires the measurement of arterial blood gas tensions. The average blood gas analyser measures PO2, PCO2 and pH. It subsequently calculates from the Henderson–Hasselbalch equation the values of bicarbonate, standard bicarbonate and base excess. The appreciation of the acid–base state requires examination of PaCO2 and pH. Abnormalities are usually described in terms of their generation (Fig. 3.4). For example, a respiratory acidosis resulting from underventilation will display a low pH and an elevated PaCO2. If this has been present for any length of time the serum bicarbonate will have become elevated and acid is excreted by the kidneys to compensate. In cases of nocturnal hypoventilation the daytime PaO2 may be normal, but the elevation of the base excess gives a clue to the ventilatory history. If an alkalosis (high pH) is associated with a low PaCO2, then this could be due to voluntary hyperventilation and is termed a ‘respiratory alkalosis’. The build-up of acid products in diabetes or renal failure will result in a low pH and bicarbonate together with a low PaCO2 in an attempt to compensate for a metabolic acidosis. Finally, the loss of acid from the stomach in prolonged vomiting can produce a metabolic alkalosis, which is characterized by high pH, high bicarbonate and normal PaCO2. These sketches of blood gas disturbance are superficial interpretations, but they provide a useful framework for clinical management under most circumstances.
Respiratory failure
Respiratory failure is defined as inadequate oxygen delivery. As we have seen, this can be due to a variety of circumstances and may or may not be accompanied by a disturbance of the CO2 level. The critical PaO2 level is approximately 8kPa (60 mmHg), since a lower pressure than this will prejudice oxygen saturation and delivery. Therefore, respiratory failure is defined by convention as PaO2 < 7.3 kPa (54.8 mmHg). If the PaCO2 is elevated above 6.5 kPa (48.8 mmHg), this is termed ‘ventilatory failure’ and is associated with chronic airflow limitation or other forms of hypoventilation.
The understanding of respiratory failure has changed in recent years with the recognition that it is seldom due to a single malfunction of the respiratory system. For example, the rise in PaCO2 and hyperinflation associated with worsening airway obstruction may adversely affect the respiratory muscles and introduce a chest wall contribution to failure. Conversely, the loss of lung volume associated with muscle weakness may lead to atelectasis and decreased pulmonary compliance, which will in turn put a greater load on the lung. Understanding of the complexities of chronic respiratory failure has helped to improve the outlook for some groups of patients, e.g. those with ventilatory failure due to chest wall disease or obstructive sleep apnoea. In these conditions there are abnormalities of breathing during sleep, which may result in nocturnal hypoventilation or transient apnoea that produce periods of oxygen desaturation which may spill over to the daytime. Recognition of this by oximetry and other more detailed somnography may result in effective treatment by nocturnal nasal intermittent positive pressure ventilation or continuous positive airway pressure (CPAP). By extension these techniques may also have a place in the acute management of selected patients with COPD who have diminished respiratory drive (Wedzicha 1996).
Oxygen prescription
The prescription of oxygen for patients with COPD is well defined for long-term (more than 15 hours/day) use. An indication for long-term oxygen therapy (LTOT) is a PaO2 less than 7.3 kPa, when breathing room air during a period of clinical stability. Clinical stability is defined as the absence of exacerbation of COPD and of peripheral oedema for the last 4 weeks. Ambulatory oxygen is defined as ‘oxygen delivered by equipment that can be carried by most patients during exercise and activities of daily living’ (Ram & Wedzicha 2004). It should be provided to individuals who are on LTOT, need to be mobile and to leave the house. Patients without chronic hypoxaemia and LTOT should be considered for ambulatory oxygen if they have demonstrable desaturation on exercise. It is suggested that the level of desaturation should be at least 4%, to a saturation below 90%, on a standard exercise test while breathing room air. An improvement of at least 10% in distance and/or breathlessness score on repeat testing with supplemental oxygen warrants the prescription of an ambulatory system. Lacasse et al (2005) found that ambulatory oxygen had no effect on the Chronic Respiratory Questionnaire or the 6-minute walk test (6MWT) distance completed after a trial of domiciliary ambulatory oxygen. A second study did, however, report modest improvements in quality of life with domiciliary ambulatory oxygen (Eaton et al 2002). The prescription of short-burst oxygen is less well defined. There is no evidence to support firm recommendation and further research is required to establish its place.
Posture and thoracic surgery
Knowledge of the effect of posture and thoracic surgery on pulmonary function is obviously very important to the physiotherapist. The circumstances of treatment make this knowledge of practical benefit. Lung function measurements are usually made sitting or standing, but the major postural effect occurs due to gravity in the supine position. There is a small fall in VC (8%) and a reduction in FRC while lying down, which results from repositioning of the diaphragm and pooling of blood in the chest. This change can be used to advantage to identify patients with covert diaphragm weakness where the VC may drop by more than 30%. Gravity also produces a change in the distribution of ventilation and perfusion within the lungs. In the supine posture, ventilation and perfusion are preferentially directed to the dependent zones (Kaneko et al 1966). This is important in adults if the lung disease is unilateral, since oxygenation will be better if the good lung is dependent.
Physiotherapists are often involved in the assessment of patients for cardiothoracic surgery and their subsequent management. Some thoracic surgery, such as lung volume reduction surgery (American Thoracic Society 1996), bullectomy or decortication, improves lung function but most procedures impair the lung. The mechanisms of impairment include the anaesthetic, the thoracotomy and pulmonary resection. Following anaesthesia there is an immediate loss of FRC and subsequently VC, which reaches a trough of about 40% at 24 hours and may take up to 2 weeks to recover (Jenkins et al 1988). This immediate loss of volume is associated with a widened gradient across the lung (A–aDO2) and potential hypoxia which is worsened by obesity, age and smoking. Thoracotomy itself, without pulmonary surgery, will reduce the VC by approximately 10%, which recovers over a period of 3 months. There are no strong arguments for the benefit of median sternotomy over thoracotomy as far as recovery of long-term lung function is concerned. In the short term the physiotherapist should be cautious during treatment as gas exchange will be impaired if the patient is lying on the thoracotomy side.
The surgical removal of lung tissue does not necessarily have the predictable effects on function that might be imagined. Following pneumonectomy the functional state of the patient is remarkably stable and in the long term the VC and total lung capacity (TLC) become slightly larger than expected for one lung. The TLCO eventually settles to 80% predicted and the KCO may be high since the whole pulmonary blood flow now travels through one lung. The changes after lobectomy are surprisingly different. The long-term effects may be small but in the postoperative phase the disruption may be unexpectedly large. The contusion of lung adjacent to the lobectomy sets up / disturbances which may in the short term be as significant as removal of the whole lung.
The physiological assessment of patients for thoracic surgery is not straightforward. There is no single test that allows a distinction to be made between success and failure. It is important to consider the nature of the operation and the preoperative function as well as general health, weight and smoking habit. If there is any doubt about the suitability of a candidate from spirometry, full lung function and oxygen saturation at rest, then some assessment of exercise capacity is advisable (British Thoracic Society and Society of Cardiothoracic Surgeons 2001).
Lung volume reduction surgery
There has been a recent resurgence of interest in this technique, which can potentially make a dramatic improvement to the function of patients with more diffuse pulmonary emphysema. The technique is a development of bullectomy, which removes approximately 30% of the substance of the lung, resulting in deflation of the chest wall. Surprisingly this operation can produce improvements in FEV1 and elastic recoil pressure while reducing hyperinflation. There appear to be promising results in selected patients with more heterogeneous emphysema who have marked symptomatic hyperinflation (Criner et al 1999, Geddes et al 2000). Selection of patients for this procedure has yet to be well defined but preliminary data suggest that exercise capacity as measured by a SWT distance >150 m (Geddes et al 2000), or a 6MWD >200 m and a resting PaCO2 <45 mmHg (Szekely et al 1997) were associated with a successful surgical outcome. A multicentre randomized controlled trial, conducted in North America, further refined the selection of patients for this procedure and suggested that upper lobe emphysema and a low baseline exercise tolerance was associated with a favorable outcome compared with other groups of patients. (Fishman et al 2003)
The effect of growth and ageing on lung function
The respiratory system reaches its peak in the third decade of life. Development of the lung continues from birth until the end of adolescence and starts to deteriorate after the age of 25 years. Fortunately, in the absence of disease there is sufficient reserve capacity to see out old age without discomfort!
The actual measurement of pulmonary function in childhood is problematic because of the obvious lack of cooperation. It is possible to measure lung volume and partial flow–volume curves in infancy by using an adapted plethysmograph. This is possible in the sedated child by producing a pneumatic ‘hug’ as an alternative to active expiration. In older children it is difficult to obtain cooperation for measurements until they are about 8 years old. After this age lung function can be measured easily, but there are difficulties in interpretation and production of reference values (see paediatric section of this chapter). The inconsistency of the timing of puberty and rapid growth spurts make comparisons difficult, but normal ranges have been produced for these age groups (Polgar & Promadhat 1971, Rosenthal et al 1993a).
The most obvious differences between children and adults lie in the development of airway function. The airways develop faster than the alveoli, which may not reach maturity until about the seventh year. As the lung matrix develops, the airway walls remain strong and relatively patent. As a result expiratory flow rates, although lower than in adulthood, are relatively high. For example, the FEV1/FVC ratio may be greater than 90% and the expiratory flow–volume curve may have a flat or convex appearance. In addition to airway patency there are also developments in the behaviour of the chest wall with growth. In childhood the musculoskeletal structures are immature and flexible. Rib cage distortion is often seen in childhood during illness, but disappears with growth and muscularization. The combination of airway patency and plasticity of the chest wall allows an interesting experiment. In childhood the residual volume (RV) is not determined by airway closure but by the strength of the expiratory muscles. Thus if children or young adults are hugged at the end of a forced expiration more air can be expelled. After the age of 25 years, RV is determined by premature airway closure and the lungs cannot be emptied further.
Life after 25 years is all downhill for the respiratory system. As with general ageing, the tissues become less elastic and the lung elastic recoil diminishes. TLC tends to remain static but RV rises as the FEV1 and FVC fall with age. Arterial PO2 and A-aDO2 worsen but do not reach critically low values. Exercise capacity, as judged by oxygen consumption, shows a decline with age but it can be retarded by regular activity. As general levels of activity reduce with age, these effects are not usually important, but smoking or disease may accelerate the changes.
Interpretation of lung function tests
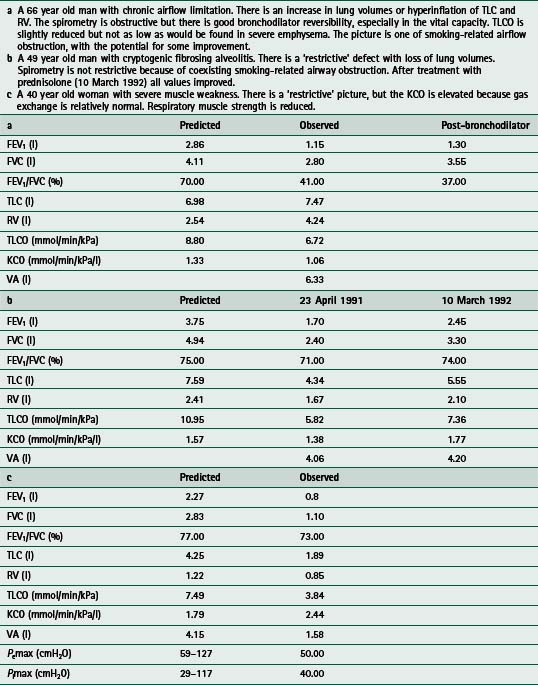
Once a baseline has been established, changes in function can be used to assess progress with natural history or treatment. Although there may be some investigations that are specific to various diseases, it is seldom possible to rely on a single investigation for the purpose. The usual description of disease requires the combination of spirometry, lung volume and gas transfer measurement. The addition of bronchodilator response, a flow–volume loop and blood gases would provide further information, while additional specific tests are requested as indicated. The additional tests may include an exercise study or respiratory muscle function test to examine the relevant aspect. Interpretation of the tests involves the comparison of the values to the reference population and a description of the pattern of abnormality, if present. A helpful report will also give some guidance on the accuracy of the clinical diagnosis and suggest confirmatory investigations if the diagnosis is unclear. Some examples of clinical cases and the patterns of abnormal lung function are given in Table 3.1.
The measurement of disability and exercise testing
Static lung function tests can describe the physical properties of the lungs, but do not always reflect the performance of the cardiopulmonary system in action. The relationship between disability and spirometry is poor. To assess disability, it must be measured by an exercise test or inferred from questioning. Exercise tests are valuable in making an objective assessment of disability and in observing the physiological response to exercise in order to assist diagnosis. Tests of exercise performance can either be performed in a complex manner in the laboratory or simply by observation of walking achievement down a hospital corridor. The former generally examines the detailed physiological response, while walking tests can give a useful and reproducible assessment of disability. A further value of exercise testing is to use the stimulus to provoke bronchoconstriction where exercise-induced asthma is suspected. In this context the exercise should be performed in an environment as close as possible to that which produces the symptoms.
Questionnaires
Most people do not ordinarily stress the lungs to their physiological limit. Furthermore, patients with exercise limitation adopt a restricted lifestyle, which may hide their disability. Sometimes simple questions can identify the disruption of normal activity. An overall picture of disability can be judged by application of a detailed questionnaire designed to cover either general features of disability or those that relate to specific examples. There are several disease-specific questionnaires available for chronic lung disease. The Chronic Respiratory Questionnaire (CRQ) (Guyatt et al 1987) and St George’s Respiratory Questionnaire (Jones 1991) have been validated for use in patients with COPD and asthma. Until recently the CRQ was an operator-led questionnaire and therefore quite time consuming. A self-reported CRQ has been described, and tested for repeatability and sensitivity (Williams et al 2001, 2003)
These questionnaires are quite good at distinguishing change after an intervention (Griffiths et al 2000, Sewell et al 2005) but not as sensitive when making comparisons between patients. This is particularly true of the CRQ, which uses individualized questions to obtain sensitivity. The Breathing Problems Questionnaire (BPQ) (Hyland et al 1994) is another self-administered, disease-specific instrument that can provide a good comparative description of disability. More recent developments include the shortened BPQ (Hyland et al 1998) developed specifically for rehabilitation and the AQ-20 (Hajiro et al 1999). The Medical Research Council (MRC) dyspnoea scale has been shown to relate reasonably well to shuttle walk test performance (Bestall et al 1999) and may give a quick and simple yet reasonably accurate measure of function in a clinical setting.
Laboratory estimation of exercise capacity
Observation of the physiological response to exercise in the laboratory is the gold standard measurement of disability. This is usually performed during a progressive maximal test, which is completed when the subject is unable to continue on either a treadmill or a cycle ergometer. The latter provides a stable platform and more accurate assessment of workload, while the walking action on the treadmill will be more familiar to most patients. In health a greater O2 is achieved on the treadmill, but this is not necessarily the case in severe COPD where the cycle may be a greater exercise stimulus (Mathur et al 1995).
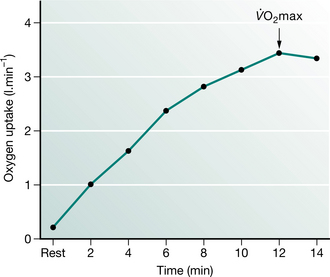
While the exercise is progressing, the basic physiological response is observed by measuring ventilation, heart rate and oxygen uptake and carbon dioxide production. Other measurements such as oxygen saturation or cardiac output can be made if necessary. The test is conducted in such a fashion as to obtain a symptom-limited duration of about 10 minutes with the increments of workload increased every minute by about 50 watts (W) for healthy subjects (10 W or less for patients with COPD). During this period the heart rate will rise linearly with workload. Ventilation also rises linearly until about 60% of maximum workload when it increases disproportionately. Oxygen uptake (O2) will also rise linearly until the same point above which the rate of uptake slows and eventually reaches a plateau at the maximum oxygen uptake (O2max) (Fig. 3.5). The O2max is determined in health by the cardiovascular delivery of oxygen to the muscles and is a crude estimate of capacity and cardiopulmonary fitness. The point of inflection of pulmonary ventilation on the E vs O2 slope is known as the ‘anaerobic threshold’. It is usually measured by the gas exchange method (O2 vs CO2 plot) or lactate accumulation. In patients with lung disease the limits to maximal exercise may be different. For example, maximal performance may be limited by low muscle mass, ventilation, respiratory muscle impairment and gas exchange. For this reason patients with COPD do not demonstrate a true O2max because performance is terminated prematurely by the ventilatory limit imposed by airway obstruction. Fatigue from limb muscle weakness may also be a significant factor in these patients.
The value of exercise testing in lung disease lies in the measurement of the degree of functional impairment by assessment of the maximal workload and O2max in comparison with reference values. If a patient fails to achieve his predicted performance the mode of failure can help to identify the mechanism. For example, in patients with lung disease the early rise of E may be characteristically in excess of expectations, but reach a premature limit imposed by the physical constraints of damaged lungs. Concurrently the heart rate response may be attenuated, in contrast to patients with cardiac disease where the test may have to be terminated because of early attainment of maximum predicted heart rate or chest pain. It is always important to determine why the subject stops at the end of a test.
Field exercise tests
Laboratory tests of performance are the most accurate but are not always available and require expensive equipment. As an alternative, several field tests have been developed which can measure performance, and their results relate quite well to laboratory estimates. There are two main categories of field test – those which are unpaced and those where the speed of activity is imposed.
One of the first unpaced tests was the 12-minute running test, which was developed to assess the fitness of military personnel. This concept was adapted to the needs of the respiratory patient by downgrading the activity to a walk along a hospital corridor. Later, a reduction of the time to 6 minutes appeared to have no disadvantages. The 12- and 6-minute walks have become familiar forms of assessment for respiratory patients (Butland et al 1982, McGavin et al 1976). The test procedure is extremely simple, with a course marked out along the corridor and the patient given the simple instruction to cover as much ground as possible in the time permitted. These tests have proven value but also have some limitations. There is quite a large learning effect and the reproducibility only becomes acceptable after two or more attempts (Knox et al 1988, Mungall & Hainsworth 1979). In addition, no two patients will attack the test in the same way and the relative stresses may not allow direct comparison. Lastly, the lack of pace constraint makes the test performance vulnerable to mood and encouragement (Guyatt et al 1984). Nevertheless, these simple tests require no equipment and, within their limitations, provide valuable information about general exercise capacity and major therapeutic changes. The minimal clinically important difference (MCID) for the 6MWT has been defined within the context of a rehabilitation programme. Redelmeier et al (1997) suggested that for a patient to notice an improvement the increase must be at least 54 metres.
The second type of field exercise test imposes a pace on the patient, which reduces the effect of motivation and encouragement. An endurance walking test instructs the patient to walk at a constant fast pace for an unlimited distance and measures the time and distance travelled. Another form of constrained exercise is the step test where the subject steps up and down a couple of steps in time to a metronome signal. Inability to continue signals the end of the test and could be due to fatigue or breathlessness. This test has the capacity for incremental progression by increasing the pacing rate, but is a rather unnatural form of exercise.
An attempt to combine the comprehensive nature of incremental laboratory tests and the flexibility of the 6MWT walk has been made in the shuttle walk test. This is an adaptation of the 20-metre shuttle running test where a subject runs between two cones 20 metres apart with the pace determined by a series of audio signals (Léger & Lambert 1982). At intervals the pace increases until the subject can continue no longer. For patients with lung disease the shuttle distance is reduced to 10 metres and the pace increments altered to provide a comfortable start and reasonable range (Singh et al 1992) (Fig. 3.6). Under these circumstances the test provides a similar physiological stimulus to an incremental tread- mill test and can be combined with measurements of heart rate and breathlessness to obtain almost as much information as provided by the laboratory standard. The standard shuttle walking test has been applied successfully in defining disability in patients with chronic respiratory disease and chronic heart failure (Keell et al 1998). The MCID for the shuttle has been explored, and for patients to notice some improvement an increase of at least 48 metres should be reported (Singh et al 2002).
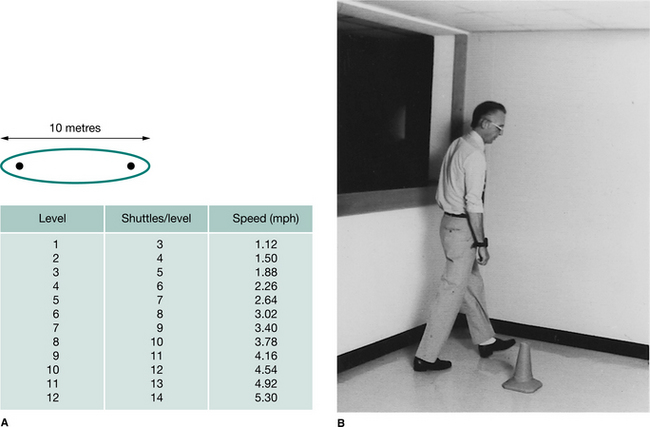
Figure 3.6 (A) The shuttle walk test involves the perambulation of an oval 10 m course. The walking speeds are increased every minute and thereby increase the number of shuttles per level. (B) The subject turns around the cone in the shuttle walk in time with an audio signal. This subject is wearing a heart rate telemeter on his wrist.
A modification of the shuttle walking test has been described by Bradley et al (1999). This modified test allows the subject to run when required and includes an additional two levels. It has been validated in patients with cystic fibrosis, who were previously unchallenged by the standard test.
The endurance shuttle walking test (Revill et al 1999) complements the incremental test; patients are required to walk around an identical course for as long as possible at a constant speed (after a short warm-up) and the test result is recorded as time.
These functional walking tests are very useful in the context of pulmonary rehabilitation where mass laboratory testing is impractical; they provide a baseline measure of disability and have been shown to be sensitive to change (Griffiths et al 2000). Rehabilitation provokes significant changes in both incremental and endurance performance (Revill et al 1999). The magnitude of change reported was far greater for the endurance shuttle walking test than the incremental, reflecting the mode of training employed in this study (Fig. 3.7).
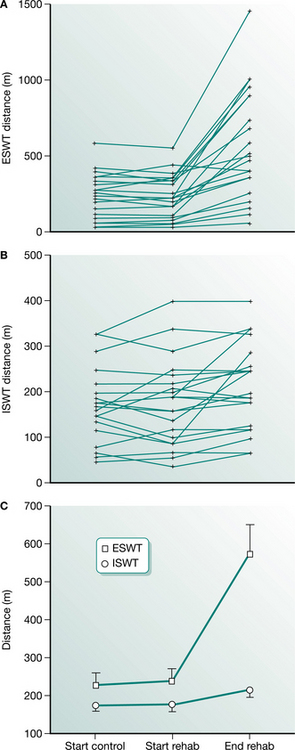
Figure 3.7 Changes observed in the endurance shuttle walking test (ESWT) (A), incremental shuttle walking test (ISWT) (B) and the mean (SE) distances for both tests after a short course of rehabilitation (C).
(Reproduced with permission from Revill et al 1999)
Muscle function and strength
Peripheral muscle dysfunction makes an important contribution to disability in patients with chronic respiratory disease (American Thoracic Society 1999). There is increasing evidence of reduced size and strength of muscles of the lower limb compared with healthy controls (Gosselink et al 1996, Gosselink & Decramer 1998). Others have shown an altered metabolic response to exercise (Maltais et al 1996). The sampling of peripheral muscle (biopsies) in healthy individuals has been undertaken both at rest and during exercise. In COPD patients, sampling at rest has been described by Maltais et al (1996). This technique may provide useful information for future therapies (Steiner & Morgan 2001).
The reduction in muscle mass (Schols et al 1993) is observed in approximately 30% of an outpatient population. The causes are thought to include inactivity, systemic inflammation, corticosteroid use and oxidative stress. Measures of muscle strength are most frequently reported as reductions in quadriceps force. This can be measured in a number of ways. A maximum volitional contraction can be measured on a sophisticated isokinetic dynameter, where a number of variables are recorded. Alternatively a measure of peak torque can be obtained from a simple hand held dynamometer or a strain gauge attached to the patient’s lower limb. A non-volitional contraction can be measured with magnetic stimulation (Pepin et al 2005).
ASSESSMENT OF CARDIAC FUNCTION
Introduction
The heart is a more straightforward organ compared with the lungs, and assessment of cardiac function can be made employing a variety of reliable and reproducible techniques. It is, however, a less forgiving organ and minor abnormalities of the coronary arteries or cardiac muscle function may have dramatic consequences.
The heart is composed of specialized muscle cells (myocytes) which together act as a coordinated pump to eject blood through the two major vascular circuits: the systemic vasculature and the pulmonary vasculature. Within the myocardium are electrical pathways, which are responsible for the coordinated and rhythmical contraction of the heart, starting with the atria and followed by the ventricles. Within the four cardiac chambers are the heart valves, which prevent the ejection of blood in the wrong direction. On the surface of the heart are the coronary arteries, which supply the myocardium with blood. Apart from congenital defects in the structure of the heart, disease processes can affect any of these components.
The symptomatic response to disease or malfunction depends very much on the individual structures affected. Angina pectoris and myocardial infarction are caused by disturbances of myocardial blood supply and usually result in the development of retrosternal chest tightness, heaviness and pain. Distinction between the two conditions can be difficult. Stable angina pectoris is more usually characterized by pain and/or dyspnoea on effort, whereas unstable angina and myocardial infarction tend to be more severe and may occur at any time, including at rest.
When left ventricular function is impaired, such as with myocardial cell death following myocardial infarction, symptoms may include breathlessness. When severe enough to cause pulmonary oedema, severe breathlessness at rest associated with sweating and severe distress may ensue. If both ventricles are damaged or impaired (congestive cardiac failure), or if there is right ventricular dysfunction in isolation – in addition to breathlessness, significant peripheral oedema or ascites may be present along with elevated pressures in the neck veins.
Rhythm disturbances of the heart (arrhythmias) can manifest in a variety of ways. The presentation depends partly on the rhythm concerned, and partly on whether there is underlying cardiac disease. Atrial fibrillation is a rhythm characterized by an irregularly irregular pulse and can produce symptoms of fatigue and breathlessness in the absence of a cardiac abnormality, but is much more likely to produce symptoms if myocardial function is already impaired. It may also be characterized by an inappropriately fast pulse with a rapid increase in rate associated with exertion. This makes assessment of function more difficult in patients with this arrhythmia. Severe slowing of the heart (bradycardia) or acceleration (tachycardia) may present with dizziness or syncope.
The chest radiograph
The simple chest radiograph can provide valuable information about the presence of heart failure and is probably the most useful clinical tool for monitoring its progress. Enlargement of the heart can be measured if the radiograph is taken in the posteroanterior (PA) projection, and the cardiothoracic ratio (CTR) documented. This is the width of the cardiac border divided by the width of the thorax and should be less than 0·5. Enlargement of the heart either represents increased muscle bulk or, more commonly, dilatation of the ventricular cavities. Pulmonary venous pooling will fill the upper lobe vessels followed by the engorgement of the interlobular lymphatics, which become visible as horizontal lines at the costophrenic angles (Kerley B lines) (Chapter 2). If the pulmonary venous pressure rises above 25 mmHg there is the risk of interstitial oedema. This is first visible as loss of definition of the hilum, but subsequently may produce widespread shadowing (bat’s wing appearance). If congestive cardiac failure is present the picture may be complicated by pleural effusions.
The electrocardiograph
The electrocardiograph (ECG) records the electrical activity of the heart (Fig. 3.8). Normally the ECG is recorded employing 12 different leads that record the activity over various aspects of the heart so that areas of abnormality can be anatomically located. For instance, if there are signs consistent with abnormality over the anterior leads (V2 to V6), then it is probable that there is a problem with the anterior wall of the heart that is composed predominantly of the left ventricle. Similarly, changes confined to the inferior leads (II, III and aVF) suggest a problem with the inferior surface of the heart that consists of both right and left ventricles.
The ECG is a well-established cardiological investigation and can provide a whole variety of information. Firstly it allows the reliable identification of the underlying cardiac rhythm. Normal rhythm is regular and called sinus rhythm. Other abnormal rhythms (arrhythmias) such as atrial flutter may also be regular but the ECG will allow ready identification. For intermittent arrhythmias a 24- or 48-hour ECG recording may be helpful. For patients with persistent symptoms of cardiac arrhythmia, but in whom no abnormality can be recorded, other techniques are available. Devices can be loaned to patients for several days that allow them to record their episodes and transmit them to a local centre via the telephone for analysis (cardiac memo recorders). For patients in whom more serious arrhythmias are suspected, devices can be implanted under the skin and activated by means of an external magnet (Reveal® device). This will automatically store the ECG for a predetermined period. This allows patients to store the event even following recovery from attacks that may have induced syncope. The device can then be interrogated via an external analyser and any abnormality of rhythm documented.
Some cardiac conditions produce characteristic abnormalities of the ECG waveform. For example myocardial infarction tends to produce elevation in the ‘ST segment’ of the waveform. In addition to helping diagnose the condition, the ECG also give the clinician an indication of the territory involved and the potential consequences of the episode (Figs 3.9, 3.10). Often the presence of a previous myocardial infarction can be determined. Episodes of ischaemia such as angina tend to produce classical appearances on the ECG such as ‘ST depression’ or ‘T wave inversion’. These appearances are looked for during exercise testing (see below). A normal ECG, however, does not exclude angina, especially if the patient was not symptomatic during the recording.
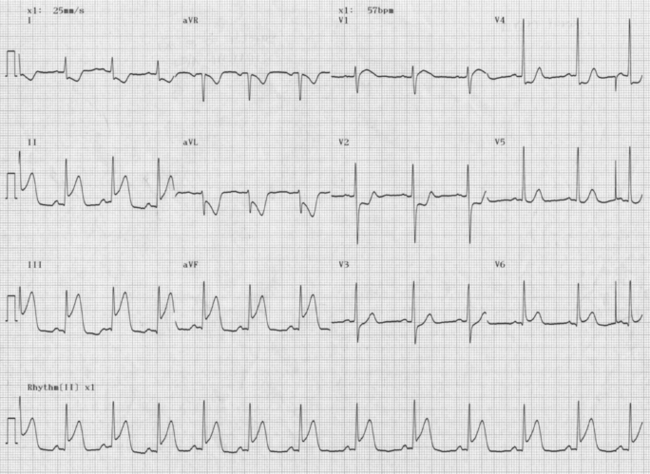
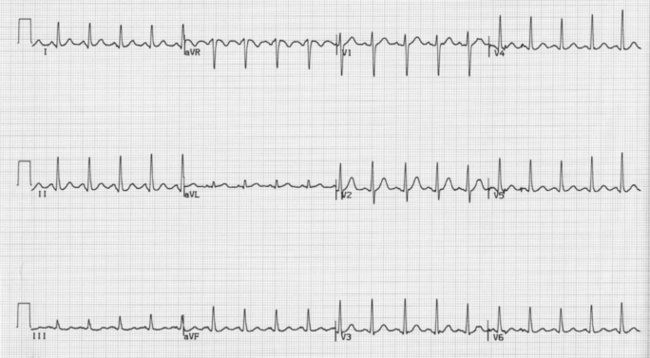
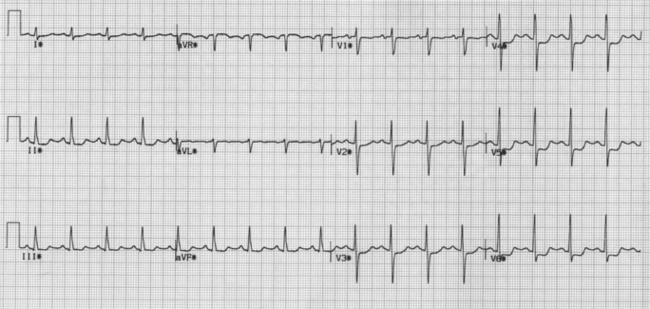
Figure 3.9 Inferior myocardial infarction. There is elevation in the ST segment of the ECG in leads II, III and aVF, which look at the inferior surface of the heart.
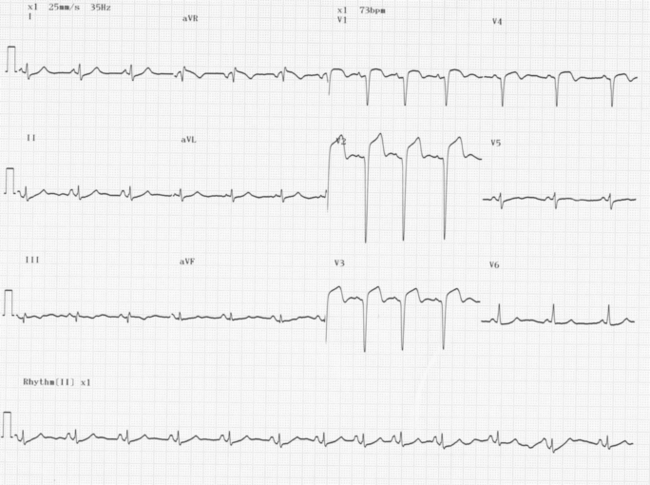
Figure 3.10 Anterior myocardial infarction. There is ST elevation of the ECG in leads V1 to V4, which look at the anterior surface of the heart.
The presence of heart failure cannot be determined from the ECG but it can be said that a completely normal ECG makes the diagnosis of heart failure very unlikely.
Exercise testing
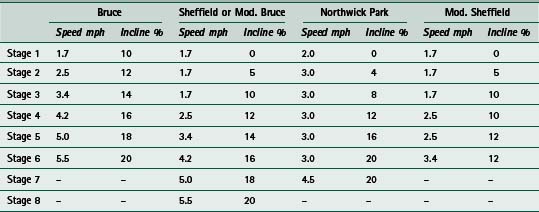
The exercise ECG is the first-line investigation in the assessment of patients with known or suspected ischaemic heart disease. In this investigation the 12-lead ECG is recorded during a progressive exercise test. This is usually by means of a treadmill, but cycle and step tests have been used for patients who cannot use a treadmill. A popular treadmill protocol is the Bruce protocol. In this test the difficulty increases in 3-minute stages:
This is a difficult protocol, especially for elderly patients or individuals of short stature. Other gentler protocols are available, such as the Sheffield, Modified Bruce, Balke, and Northwick Park protocols (Table 3.2).
The normal response to exercise is a steady increase in heart rate. This is accompanied by a gradual rise in systolic blood pressure and a small (if any) rise in diastolic pressure. A lack of rise or a fall in the systolic pressure raises the possibility of multivessel coronary disease or left ventricular dysfunction.
The exercise ECG is deliberately provocative compared with those used to assess respiratory function. The aim is to place demands on the heart and achieve an adequate level of work accompanied by a rise in heart rate. In general, achievement of 85% or greater of the target heart rate provides an adequate level of stress for diagnostic purposes. Target heart rate can be calculated by the equation:
The main indication for exercise testing is for the assessment of myocardial ischaemia and coronary artery disease, in particular the diagnosis of chest pain, assessment of ischaemic risk, prognosis and residual ischaemia following myocardial infarction, evaluation of medical or surgical therapy, evaluation of cardiac function and exercise capacity and detection of exercise-induced arrhythmias.
False-positive tests can occur, as can false-negative tests, but overall the exercise test is an extremely useful guide to the presence or absence of ischaemic heart disease, and a good predictor of prognosis. Patients who cannot exceed 3 minutes of the Bruce protocol and who have ECG changes consistent with ischaemia (Fig. 3.11) have a mortality at 1 year in excess of 5%, whereas those who exceed 9 minutes (with no ECG changes) have a mortality of less than 1%. Similarly, patients who exercise for less than 3 minutes have a 3·5 times greater risk of dying than patients who exercise for more than 6 minutes.
Electrophysiological studies
For patients with more complex cardiac arrhythmias, more invasive ECG assessment is possible. Electrophysiological studies involve the positioning of a number of electrodes within the cardiac chambers (usually via the femoral artery and/or vein) under radiological guidance. Intracardiac recordings of electrical activity can then be made. The appearance of the ECG is very different from that obtained by the standard 12-lead ECG. The procedure allows for the more accurate assessment and diagnosis of arrhythmias, and particularly allows identification of extra cardiac circuits (so-called ‘accessory pathways’), which may predispose the individual to inappropriately fast rhythms. Ultimately this may allow therapeutic procedures to be offered whereby these extra circuits can be destroyed (radiofrequency ablation).
Radioisotope studies
A variety of radioisotope investigations are available in the assessment of cardiac function. Overall myocardial function can be accurately measured using isotope studies – for example multigated acquisition (MUGA) scans – so that a reliable assessment of the ejection fraction can be made. The ejection fraction is the amount of blood ejected by the heart in each cycle and in normal individuals is in excess of 50%. In patients with left ventricular dysfunction, the ejection fraction may be anywhere between 10 and 45%. Obviously the lower the ejection fraction, the more severe the problem. The MUGA scan also allows for measurement of right ventricular function separately.
Radioisotope studies can also be used to assess myocardial perfusion (Fig. 3.12). This is particularly useful if the exercise ECG test fails to give an adequate assessment or answer. Pre-existing ECG abnormalities (such as left bundle branch block) do not allow for identification of the development of ischaemia. In some there may be a suspicion that the test was a false negative and the isotope study is more sensitive and specific for the identification of ischaemia.
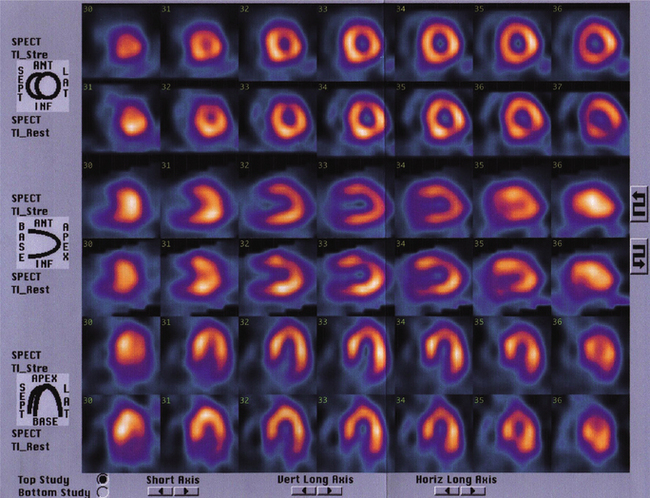
Figure 3.12 Images obtained following a stress radioisotope study comparing images taken during rest (rows 2, 4 and 6) and stress (rows 1, 3 and 5). The brighter the image, the better the blood supply to that region. This is a normal scan with no evidence of ischaemia.
Radioisotope studies also give the opportunity to assess patients who cannot walk on the treadmill, as the heart can be stressed pharmacologically using agents such as dobutamine or adenosine. Scanning patients before and after stress (be it exercise or pharmacological) allows a comparison to be made between images. Gamma cameras are employed to detect uptake of the isotope by the myocardium and areas of underperfusion can be seen. The test also allows for the identification of areas of fixed ischaemia which do not improve with rest. These often suggest the presence of scar tissue, which would not benefit from a revascularization procedure (such as bypass surgery or angioplasty). Another potential use is to assess the physiological significance of coronary artery stenoses detected by angiography (see later), and allow the clinician to determine whether revascularization is required.
Echocardiography
Ultrasound examination of the heart has become an invaluable asset to cardiac investigation and has superseded many invasive techniques. Standard transthoracic echocardiography provides an ultrasound image of the structure of the heart, while Doppler studies allow the assessment of flow patterns and pressure gradients within the chambers.
M-mode echocardiography involves a one-dimensional view of structures in the path of the ultrasound beam. This technique allows for the assessment of movement and the quantification of chamber size and a rough estimate of cardiac function. Two-dimensional echocardiography produces more anatomically pleasing images that allow the direct visualization of the myocardium, heart valves and associated structures (Fig. 3.13). Doppler echocardiography records direction and velocity of blood flow within the heart and great vessels. Superimposing colour flow Doppler on two-dimensional images (Fig. 3.14) produces clear images of flow across structures and illustrates the presence or absence of abnormal flow such as valve regurgitation and turbulence.
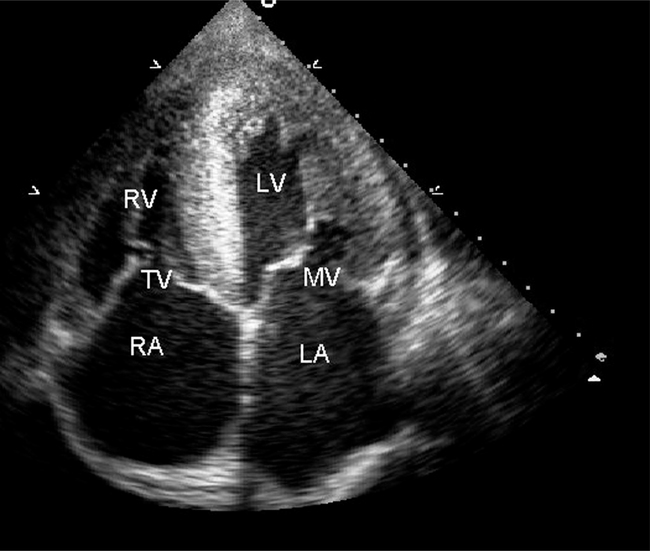
Figure 3.13 A two-dimensional echocardiography image showing all four cardiac chambers, the right atrium (RA), right ventricle (RV), the left atrium (LA) and the left ventricle (LV). The mitral (MV) and tricuspid (TV) valves are clearly seen.
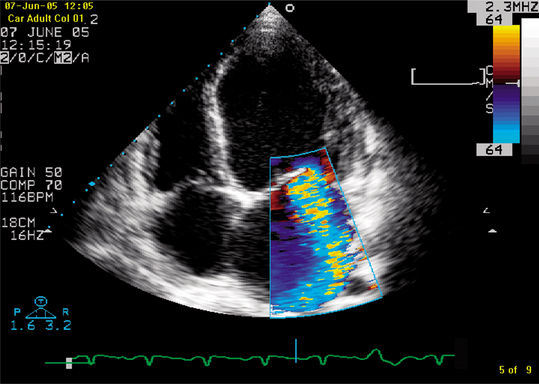
Figure 3.14 A 2D echocardiograph image with colour flow Doppler showing severe mitral regurgitation into a dilated left atrium in a patient with dilated cardiomyopathy.
Transoesophageal echocardiography is a technique that utilizes all of the features of transthoracic echocardiography, but involves the passage of an ultrasound transducer mounted at the end of an endoscope into the oesophagus. Extremely clear images of the heart and great vessels can be obtained because the oesophagus is in such close proximity to the relevant structures and there is little air or tissue interface. It is useful when transthoracic images are inconclusive because of poor image quality or when more detailed assessment is desirable (such as in mitral valve morphology or the diagnosis of endocarditis).
Stress echocardiography is a technique that involves the visualization of myocardial performance during infusion of various pharmacological stressing agents such as dobutamine. This allows the determination of ventricular performance and can give an indication of areas of underperfusion and of irreversible left ventricular damage.
Contrast echocardiography is a technique that involves the injection of microbubbles that appear as clouds of echoes on the ultrasound image. This is helpful to accurately determine the outline of the myocardium, particularly when measuring movement of the ven-tricle. Precise areas of impaired movement can be visualized.
Cardiac catheterization
Cardiac catheterization allows the accurate assessment of coronary artery anatomy. The procedure involves the insertion of catheters into the arterial circulation (usually via the femoral artery) and the selective intubation of each of the coronary arteries. The presence of narrowings (stenoses) or blockages can be determined by the injection of dye to outline the vessels (Fig. 3.15). Images are acquired in various planes because of the three-dimensional nature of the heart. In addition, the procedure allows for a variety of other assessments to be made.
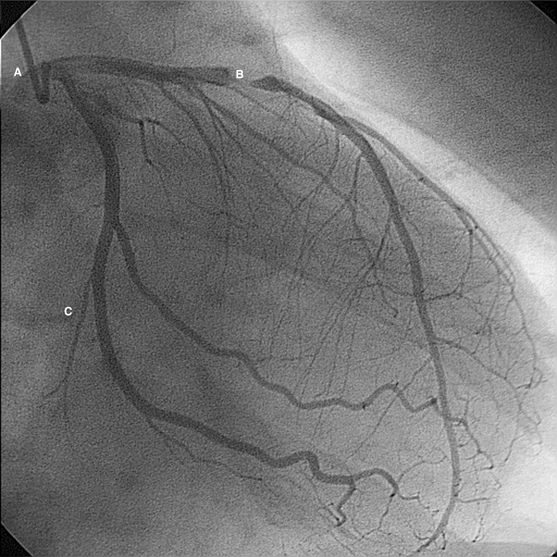
Figure 3.15 Example of cardiac catheterization of the left coronary artery. The catheter is illustrated (A), situated in the origin of the left coronary artery. A severe stenosis (narrowing) of the left anterior descending branch is seen (B). The circumflex branch is relatively healthy (C).
Continuous pressure monitoring gives the opportunity to measure pressures within the cardiac chambers, particularly the left ventricle during left heart catheter- ization. Elevation in the left ventricular end-diastolic pressure over 12 mmHg (the pressure trough immediately before ventricular contraction) suggests left ventricular dysfunction. Withdrawal of the catheter across the aortic valve also allows pressure gradients across the valve to be determined and the severity of any stenosis to be made.
Quantification of coronary stenoses is made visually and with the aid of computer programs. Other methods include the passage of tiny ultrasound probes mounted over flexible guidewires into the arteries themselves. This technique is called intravascular ultrasound (IVUS) and images of the inside of the coronary arteries and arterial wall are obtained. Recently the development of guidewires with pressure sensors has allowed the pressure within the arteries to be measured before and after a stenosis and an assessment of the severity of any given stenosis made.
Right heart catheterization (access being gained via the femoral vein) can measure pressures in the right heart chambers (right atrium and ventricle) and also the pulmonary arteries. Wedging of catheters or employing balloon-tipped catheters in the pulmonary arterial tree also enables the measurement of wedge pressure, which is an indirect measurement of left atrial pressure. Once left atrial pressure rises above 20 mmHg, pulmonary oedema can ensue, and therefore wedge pressure allows further assessment of left ventricular function.
A variety of other parameters can be assessed by the sampling of blood in various chambers and vessels which can ultimately allow very accurate measurements of cardiac output, intracardiac shunts and vascular resistance.
The major drawback of cardiac catheterization is the invasive nature of the procedure and the potential risks.
Magnetic resonance imaging
Magnetic resonance imaging (MRI) is a rapidly developing non-invasive technique for cardiac investigation. Previously, cardiac motion from patient respiration and the cyclic motion of the heart hampered imaging with this modality. However, the advent of ultrafast imaging sequences has enabled MRI to become the gold standard for evaluation of cardiac anatomy and function. The high resolution of MRI and the ability to image in any plane allows three-dimensional measurement of ejection fraction without need for geometrical assumptions. Studies have shown excellent intra- and inter-observer variability and so small changes in function over time can be estimated reliably. No ionizing radiation is required and so longitudinal (serial) patient studies are safe. First-pass contrast-enhanced imaging can be used to evaluate myocardial perfusion.
Both qualitative and quantitative parameters of myocardial blood flow can be obtained. MRI is now consid- ered the best imaging technique for the detection of myocardial infarction and assessing myocardial viability in dysfunctional myocardium. Pharmacological stress protocols can be applied in a manner analogous to echocardiography and radioisotope studies so that regional abnormalities in function and/or perfusion can be assessed at rest and during stress.
MRI also has an increasing place in the investigation of patients with congenital heart disease. Due to a large field of view, MRI has the ability to image major vessels and quantify ventricular function and shunts. Not all patients are suitable for magnetic resonance. Contraindications include patients with permanent pacing systems, metallic implants and severe claustrophobia. As scanners with cardiac specifications and trained personnel become increasingly available in the workplace, MRI is likely to become a cardiac investigation of increasing usefulness.
THE ELECTROCARDIOGRAM
The electrocardiogram (ECG) is a recording from the body surface of the electrical activity of the heart. The standard ECG has 12 leads:
 Limb leads look at the heart in a vertical plane (Fig. 3.17). Limb leads are unipolar (AVR, AVL and AVF) or bipolar (I, II, III).
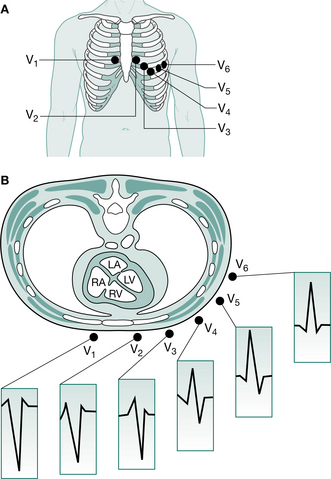
Figure 3.16 ECG chest leads. A The V leads are attached to the chest wall overlying the intercostal spaces as shown: V4 in the mid-clavicular line, V5 in the anterior axillary line, V6 in the mid-axillary line. B Leads V1 and V2 look at the right ventricle, V3 and V4 at the interventricular septum, and V5 and V6 at the left ventricle. The normal QRS complex in each lead is shown. The R wave in the chest (precordial) leads steadily increases in amplitude from lead V1 to V6 with a corresponding decrease in S wave depth, culminating in a predominantly positive complex in V6.
(Reproduced with permission from Ballinger and Patchett 2003)
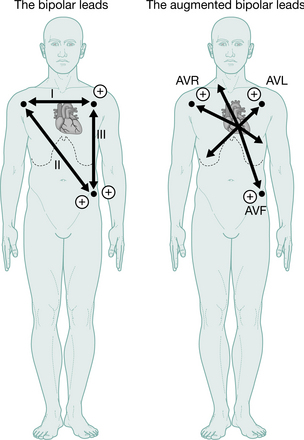
Figure 3.17 ECG limb leads. Lead I is derived from electrodes on the right arm (negative pole) and left arm (positive pole), lead II is derived from electrodes on the right arm (negative pole) and left leg (positive pole), and lead III from electrodes on the left arm (negative pole) and the left leg (positive pole).
(Reproduced with permission from Ballinger and Patchett 2003)
The ECG machine is arranged so that when a depolarization wave spreads towards a lead the needle moves upwards on the trace, and when it spreads away from the lead the needle moves downwards.
ECG waveform and definitions (Fig. 3.18)
The heart rate. At normal paper speed (usually 25 mm/s) each ‘big square’ measures 5 mm wide and is equivalent to 0.2 s. The heart rate (if the rhythm is regular) is calculated by counting the number of big squares between two consecutive R waves and dividing into 300.
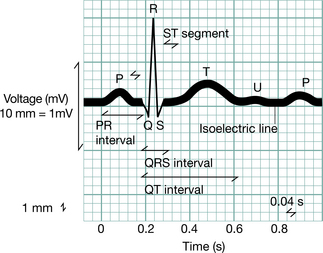
Figure 3.18 The waves and elaboration of the normal ECG.
(Modified from Goldman (1976), reproduced with permission from Ballinger and Patchett 2002)
The P wave is the first deflection and is caused by atrial depolarization. When abnormal it may be:
Broad and notched (>0.12 s, i.e. 3 small squares) in left atrial enlargement (‘P mitrale’, e.g. mitral stenosis)The QRS complex represents ventricular depolarization:
A negative (downward) deflection preceding an R wave is called a Q wave. Normal Q waves are small and narrow; deep (>2 mm), wide (>1 mm) Q waves (except in AVR and V1) indicate myocardial infarction.Ventricular depolarization starts in the septum and spreads from left to right (Fig. 3.19). Subsequently the main free walls of the ventricles are depolarized. Thus, in the right ventricular leads (V1 and V2) the first deflection is upwards (R wave) as the septal depolarization wave spreads towards those leads. The second deflection is downwards (S wave) as the bigger left ventricle (in which depolarization is spreading away) outweighs the effect of the right ventricle (see Fig. 3.16). The opposite pattern is seen in the left ventricular leads (V5 and V6), with an initial downward deflection (small Q wave reflecting septal depolarization) followed by a large R wave caused by left ventricular depolarization.
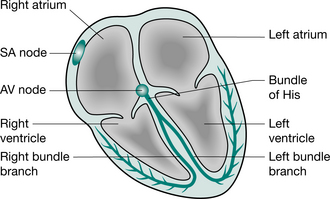
Figure 3.19 The normal cardiac conduction system. In normal circumstances only the specialized conducting tissues of the heart undergo spontaneous depolarization (automaticity), which initiates an action potential. The sinus (SA) node discharges more rapidly than the other cells and is the normal pacemaker of the heart. The impulse generated by the sinus node spreads first through the atria, producing atrial systole, and then through the atrioventricular (AV) node to the His–Purkinje system, producing ventricular systole.
(Reproduced with permission from Ballinger and Patchett 2003)
Left ventricular hypertrophy. The increased bulk of the left ventricular myocardium in left ventricular hypertrophy (e.g. with systemic hypertension) increases the voltage-induced depolarization of the free wall of the left ventricle. This gives rise to tall R waves (>25 mm) in the left ventricular leads (V5, V6) and/or deep S waves (>30 mm) in the right ventricular leads (V1, V2). The sum of the R wave in the left ventricular leads and the S wave in the right ventricular leads exceeds 40 mm. In addition to these changes there may be ST-segment depression and T wave flattening or inversion in the left ventricular leads.
Right ventricular hypertrophy (e.g. in pulmonary hypertension) causes tall R waves in the right ventricular leads.
The QRS duration reflects the time that excitation takes to spread through the ventricle. A wide QRS complex (>0.10 s, 2.5 small squares) occurs if conduction is delayed, e.g. with right or left bundle branch block, or if conduction is through abnormal pathways, e.g. ventricular ectopic.
T waves result from ventricular repolarization. In general the direction of the T wave is the same as that of the QRS complex. Inverted T waves occur in many conditions and, although usually abnormal, they are a non-specific finding.
The PR interval is measured from the start of the P wave to the start of the QRS complex whether this is a Q wave or an R wave. It is the time taken for excitation to pass from the sinus node, through the atrium, atrioventricular node and His–Purkinje system to the ventricle. A prolonged PR interval (>0.22 s) indicates heart block.
The ST segment is the period between the end of the QRS complex and the start of the T wave. ST elevation (>1 mm above the isoelectric line) occurs in the early stages of myocardial infarction and with acute pericarditis. ST segment depression (>0.5 mm below the isoelectric line) indicates myocardial ischaemia.
Exercise electrocardiography
Exercise electrocardiography is an ECG recording made during standard graded exercise treadmill testing (e.g. the Bruce protocol) and is used in the investigation of patients with known or suspected ischaemic heart disease. Contraindications include recent myocardial infarction (within 6 days), unstable angina, severe hypertrophic cardiomyopathy, severe aortic stenosis and malignant hypertension. A positive test and indications for stopping the test are:
CARDIAC ARRHYTHMIAS
An abnormality of the cardiac rhythm is called a cardiac arrhythmia. Such a disturbance may cause sudden death, syncope, dizziness, palpitations or no symptoms at all. Paroxysmal arrhythmias may not be detected on a single ECG recording. Twenty-four-hour ambulatory ECG monitoring (continuous recording for 24 hours) and event recorders (a portable device activated by the patient to record the ECG when symptoms occur) are outpatient investigations often used to detect arrhythmias causing intermittent symptoms.
There are two main types of arrhythmia:
Bradycardia, where the heart rate is slow (<60 beats/ min). The slower the heart rate, the more probable that the arrhythmia will be symptomatic. Tachycardia, where the heart rate is fast (>100 beats/ min). Tachycardias are more likely to be symptomatic when the arrhythmia is fast and sustained. They are subdivided into Supraventricular tachycardias, which arise from the atrium or the atrioventricular junction, and ventricular tachycardias, which arise from the ventricles.Sinus rhythms
Sinus arrhythmia.
Fluctuations of autonomic tone result in phasic changes in the sinus discharge rate. Thus, during inspiration parasympathetic tone falls and the heart rate quickens, and on expiration the heart rate falls. This variation is normal, particularly in children and young adults.
Sinus bradycardia.
Sinus bradycardia is normal during sleep and in well-trained athletes. During the acute phase of a myocardial infarction it often reflects ischaemia of the sinus node. Other causes include hypothermia, hypothyroidism, cholestatic jaundice, raised intracranial pressure, and drug therapy with beta-blockers, digitalis and other antiarrhythmic drugs. Patients with persistent symptomatic bradycardia are treated with a permanent cardiac pacemaker. Intravenous atropine is used in the acute situation.
Sinus tachycardia.
Sinus tachycardia is a physiological response during exercise and excitement. It may also occur with fever, anaemia, cardiac failure, thyrotoxicosis and drugs (e.g. catecholamines and atropine). Treatment is aimed at correction of the underlying cause. If necessary, beta-blockers may be used to slow the sinus rate, but not in uncontrolled heart failure.
Pathological bradycardias
There are two main forms of severe bradycardia: sinus node dysfunction and atrioventricular block.
Sinus node dysfunction (sick sinus syndrome).
Most cases of chronic sinus node dysfunction are the result of idiopathic fibrosis occurring in elderly people. Bradycardia is caused by intermittent failure of sinus node depolarization (sinus arrest) or failure of the sinus impulse to propagate through the perinodal tissue to the atria (sinoatrial block). This is seen on the ECG as intermittent long pauses between consecutive P waves (>2 s). The slow heart rate predisposes to ectopic pacemaker activity and tachyarrhythmias are common (tachy-brady syndrome).
Insertion of a permanent pacemaker is only indicated in symptomatic patients to prevent dizzy spells and blackouts. Antiarrhythmic drugs are used to treat tachycardias. Thromboembolism is common in sinus node dysfunction and patients should be anticoagulated unless there is a contraindication.
Atrioventricular block.
There are three forms: first-degree heart block, second-degree (partial) block and third-degree (complete) block. The common causes are coronary artery disease, cardiomyopathy and, particularly in elderly people, fibrosis of the conducting tissue.
First-degree atrioventricular (AV) block is the result of delayed atrioventricular conduction and reflected by a prolonged PR interval (>0.22 s) on the ECG. No change in heart rate occurs and treatment is unnecessary. Second-degree (partial) AV block occurs when some atrial impulses fail to reach the ventricles. There are three forms (Fig. 3.20):
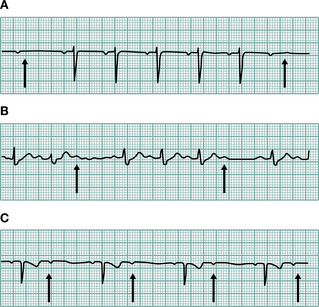
Figure 3.20 Three varieties of second-degree atrioventricular (AV) block. (A) Wenckebach (Mobitz type I) AV block. The PR interval gradually prolongs until the P wave does not conduct to the ventricles (arrows). (B) Mobitz type II AV block. The P waves that do not conduct to the ventricles (arrows) are not preceded by gradual PR interval prolongation. (C) Two P waves to each QRS complex. The PR interval prior to the dropped P wave is always the same. It is not possible to define this type of AV block as type I or type II Mobitz block and it is, therefore, a third variety of second-degree AV block (arrows show P waves), not conducted to the ventricles.
(Reproduced with permission from Ballinger and Patchett 2003)
Progression to complete heart block occurs more frequently following anterior myocardial infarction and in Mobitz type II block, and treatment with pacing is usually indicated. Patients with Wenckebach AV block or those with second-degree block following inferior infarction are usually monitored.
Third-degree AV block (complete heart block). There is no association between atrial and ventricular activity and ventricular contractions are maintained by a spontaneous escape rhythm (usually about 40/min) from an automatic centre below the site of the block. The ECG shows regular P waves and QRS complexes, which occur independently of one another. The usual symptoms are dizziness and blackouts (Stokes–Adams attacks). If the ventricular rate is very slow, cardiac failure may occur. Insertion of a permanent pacemaker is always required for sustained complete heart block. In the acute situation, e.g. myocardial infarction, recovery may be expected and intravenous atropine or a temporary pacemaker may be all that is necessary.Intraventricular conduction disturbances.
The intraventricular conduction system consists of the His bundle, the right and left bundle branches and the anterosuperior and posteroinferior divisions of the left bundle branch block (see Fig. 3.19). Complete block of a bundle branch is associated with a wider QRS complex (0.12 s or more). The shape of the QRS depends on whether the right or the left bundle is blocked.
Pathological tachycardias
The mechanisms responsible for most tachyarrhythmias are abnormal automaticity and re-entry mechanisms.
Abnormal automaticity.
Arrhythmias arise if there is enhanced automaticity of the normal conducting tissue or automaticity is acquired by damaged cells of the atria or ventricles; this causes ectopic beats and, if sustained, tachyarrhythmias.
Re-entry.
Re-entry may occur if there are two separate pathways for impulse conduction (Fig. 3.21).
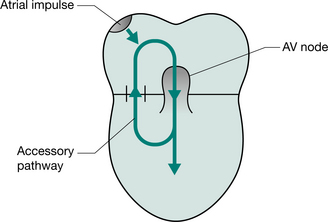
Figure 3.21 A re-entry circuit. The impulse is conducted normally through the AV node and initiates ventricular depolarization. In certain circumstances the accessory pathway is able to transmit the impulse retrogradely back into the atria, thus completing a circuit and initiating a self-sustaining re-entry tachycardia.
(Reproduced with permission from Ballinger and Patchett 2003)
Atrial tachyarrhythmias.
Ectopic beats, tachycardia, flutter and fibrillation may all arise from the atrial myocardium. They share common aetiologies, which are listed in Table 3.3.
Table 3.3 Causes of atrial arrhythmias
| Ischaemic heart disease |
| Rheumatic heart disease |
| Thyrotoxicosis |
| Cardiomyopathy |
| Lone atrial fibrillation (i.e. no cause discovered) |
| Wollf-Parkinson-White syndrome |
| Pneumonia |
| Atrial septal defect |
| Carcinoma of the bronchus |
| Pericarditis |
| Pulmonary embolus |
| Acute and chronic alcohol abuse |
| (Ballinger and Patchett 2003) |
Atrial ectopic beats.
These are caused by premature discharge of an ectopic atrial focus. On the ECG this produces an early and abnormal P wave, usually followed by a normal QRS complex. Treatment is not usually required unless they cause troublesome palpitations or are responsible for provoking more significant arrhythmias when beta-blockade may be effective.
Atrial flutter.
Atrial flutter is almost always associated with organic disease of the heart. The atrial rate is usually about 300 beats/min. The AV node usually conducts every second flutter beat, giving a ventricular rate of 150 beats/min. The ECG (Fig. 3.22A) characteristically shows ‘saw-tooth’ flutter waves (F waves), which are most clearly seen when AV conduction is transiently impaired by carotid sinus massage or drugs. Treatment of an acute paroxysm is electrical cardioversion. Prophylaxis is achieved with class Ia, Ic or III drugs (Table 3.4). Rate control of a chronic arrhythmia is with AV nodal blocking drugs, e.g. digoxin. Recurrent atrial flutter is best treated with radiofrequency catheter ablation of focal arrhythmogenic sites.
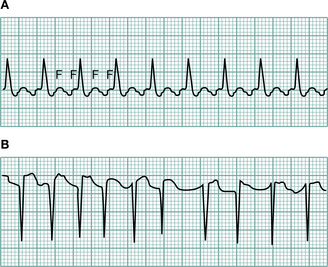
Figure 3.22 (A) Atrial flutter. The flutter waves are marked with an F, only half of which are transmitted to the ventricles. (B) Atrial fibrillation. There are no P waves; the ventricular response is fast and irregular.
(Reproduced with permission from Ballinger and Patchett 2003)
Table 3.4 Vaughan Williams’ classification of antiarrhythmic drug therapy
| Class | Mechanism of action | Individual drugs |
|---|---|---|
| Ia | Quinine, procainamide, disopyramide | |
| Ib | Membrane stabilizing action | Lidocaine, mexiletine |
| Ic | Flecainide, propafenone | |
| II | ß-Adrenergic blockers | Metoprolol, atenolol, propranolol |
| III | Increases refractory period of conducting system | Amiodarone, sotalol, bretylium |
| IV | Calcium-channel blocking agents | Verapamil, diltiazem |
Adenosine and digoxin are other antiarrhythmic drugs that do not fit into this classification. These drugs all have proarrhythmic effect (among others) and should be used with caution. All except amiodarone are negatively inotropic and may exacerbate heart failure. (Ballinger and Patchett 2003)
Atrial fibrillation (AF).
This is a common arrhythmia, occurring in 5–10% of patients over 65 years of age. It also occurs, particularly in a paroxysmal form, in younger patients. Atrial activity is chaotic and mechanically ineffective. The AV node conducts a proportion of the atrial impulses to produce an irregular ventricular response. Symptoms range from palpitations and fatigue to acute pulmonary oedema. There are no clear P waves on the ECG (Fig. 3.22B), only a fine oscillation of the baseline (so-called fibrillation or f waves).
When AF arises in an apparently normal heart it is sometimes possible to convert to sinus rhythm, either electrically (by cardioversion) or chemically (with class Ia, Ic or III drugs, see Table 3.4). When AF is caused by an acute precipitating event, such as alcohol toxicity, chest infection or thyrotoxicosis, the underlying cause should be treated initially.
Strategies for the long-term management of atrial fibrillation include:
Atrial fibrillation is associated with an increased risk of thromboembolism, and anticoagulation with warfarin should be given for at least 3 weeks before (with the exception of those who require emergency cardioversion) and 4 weeks after cardioversion. Most patients with chronic AF should also be anticoagulated (INR 2.0–3.0). The exception is young patients (<65 years) with lone AF, i.e. in the absence of demonstrable cardiac disease, diabetes or hypertension. This group has a low incidence of thromboembolism and is treated with aspirin alone.
Junctional tachycardia.
Junctional tachycardias are paroxysmal in nature and usually occur in the absence of structural heart disease. They are re-entrant arrhythmias caused by an abnormal pathway in the AV node or by an accessory pathway (bundle of Kent), as in the Wolff–Parkinson–White syndrome (Fig. 3.23). The usual history is of a sudden onset of fast (140–280/min) regular palpitations. On the ECG the P waves may be seen very close to the QRS complex, or are not seen at all. The QRS complex is usually of normal shape because, as with other supraventricular arrhythmias, the ventricles are activated in the normal way, down the bundle of His. Occasionally the QRS complex is wide, because of a rate-related bundle branch block, and it may be difficult to distinguish from ventricular tachycardia.
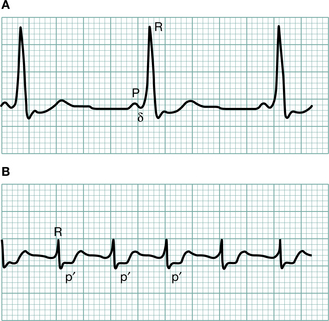
Figure 3.23 (A) An ECG showing Wolff–Parkinson–White syndrome. There is an abnormal connection, termed an accessory pathway, between the atria and ventricles. The accessory pathway has a more rapid rate of conduction from the atria to the ventricles than does the normal AV node and ventricular depolarization occurs sooner than expected. Such pre-excitation is apparent on the ECG during sinus rhythm as a short PR interval and wide QRS complex with a ‘slurred’ upstroke (d wave). (B) A trace demonstrating the paroxysmal tachycardia that may result from this syndrome. Note the tachycardia p wave visible between QRS and T wave complexes.
(Reproduced with permission from Ballinger and Patchett 2003)
Termination of an attack
Manoeuvres that increase vagal stimulation of the sinus node: carotid sinus massage, ocular pressure or the Valsalva manoeuvre. Drug treatment: adenosine is a very short-acting AV nodal blocking drug given as a 3 mg bolus dose intravenously. It will terminate most junctional tachycardias. If there is no response after 1–2 minutes, a further bolus of 6 mg is given. A third bolus of 12 mg may be given if there is still no response. Transient side effects include complete heart block, hypotension, nausea and bronchospasm. Asthma and second- or third-degree AV block are contraindications to adenosine. An alternative treatment is intravenous verapamil 10 mg i.v. over 5–10 minutes (contraindicated if the QRS complex is wide and therefore differentiation from ventricular tachycardia difficult).Ventricular arrhythmias
Ventricular ectopic beats (extrasystoles, premature beats).
Ventricular ectopic beats may be asymptomatic or patients may complain of extra beats, missed beats or heavy beats. The ectopic electrical activity is not conducted to the ventricles through the normal conducting tissue and thus the QRS complex on the ECG is widened, with a bizarre configuration (Fig. 3.24). In normal individuals ectopic beats are of no significance, but treatment is sometimes given for symptoms. In patients with heart disease they are associated with an increased risk of sudden death. Prophylaxis with amiodarone may reduce mortality by preventing arrhythmias and sudden death.
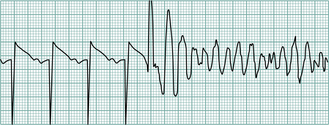
Ventricular tachycardia.
Ventricular tachycardia and ventricular fibrillation are usually associated with underlying heart disease, e.g. ischaemia, cardiomyopathy and hypertensive heart disease. Ventricular tachycardia is defined as three or more consecutive ventricular beats occurring at a rate of 120/min or more. The ECG shows a rapid ventricular rhythm with broad abnormal QRS complexes, which can sometimes be confused with a broad complex junctional tachycardia. Ventricular tachycardia may produce severe hypotension, when urgent DC cardioversion is necessary. If there is no haemodynamic compromise, treatment is usually with intravenous lidocaine (50–100 mg i.v. over 5 minutes followed by an intravenous infusion of 2–4 mg/min). Prophylaxis is with mexiletine, disopyramide, flecainide or amiodarone. Patients who are refractory to all medical treatment may need an implantable defibrillator. This is a small device implanted behind the rectus abdominis and connected to the heart; it recognizes ventricular tachycardia or ventricular fibrillation and automatically delivers a defibrillation shock to the heart.
Ventricular fibrillation.
This is a very rapid and irregular ventricular activation (see Fig. 3.24) with no mechanical effect and hence no cardiac output. Ventricular fibrillation rarely reverts spontaneously and management is immediate cardioversion.