Chapter 20 The Electrocardiogram
1. An electrocardiogram is simply a graph, made by a voltmeter that is equipped to plot voltage as a function of time.
2. Atrial depolarization, ventricular depolarization, and ventricular repolarization cause characteristic voltage deflections in the electrocardiogram.
3. The electrocardiogram reveals the timing of electrical events in the heart.
4. Six standardized electrocardiographic leads are used in veterinary medicine.
5. Abnormal voltages in the electrocardiogram are indicative of cardiac structural or electrical abnormalities.
6. Electrical dysfunctions in the heart cause abnormal patterns of electrocardiogram waves.
An Electrocardiogram Is Simply a Graph, Made by a Voltmeter That Is Equipped to Plot Voltage as a Function of Time
The electrocardiogram (ECG) is the most frequently used clinical tool for diagnosing electrical dysfunctions of the heart. In its most common application, two or more metal electrodes are applied to the skin surface, and the voltages recorded by the electrodes are displayed on a video screen or drawn onto a paper strip. How the heart produces voltages that are detectable at the body surface is extraordinarily complex. However, elementary physical principles can be used to develop an intuitive model of how electrocardiography works; this intuitive model is adequate for most clinical applications.
An intuitive understanding of the ECG begins with the concept of an electrical dipole in a conductive medium (Figure 20-1). A dipole is a pair of electrical charges (a positive charge and a negative charge) separated by a distance. A common flashlight battery is a good example of a dipole. A battery has a positive end (where excess positive charges exist) and a negative end (where excess negative charges exist), and the two ends are separated by a distance. If such a dipole is placed within a conductive medium (e.g., bowl containing sodium chloride [NaCl] solution), ionic currents will flow through the solution. Positive ions in the solution flow toward the negative end of the dipole, and vice versa. The flow of ions creates voltage differences within the salt solution. These voltage differences can be detected by placing the electrodes of a simple voltmeter at the perimeter of the salt solution. In Figure 20-1 an electrode placed at point A is closer to the positive end of the dipole, and an electrode at point B is closer to the negative end of the dipole. Therefore the voltage at point A will be positive in comparison with the voltage at point B. The voltmeter would detect a positive voltage difference between point A and point B. Using “V” as an abbreviation for voltage, we would summarize this condition by saying, “VA-B is positive.” Point C and point D are equally near the positive and negative ends of the dipole, so no voltage difference would exist between electrodes placed at points C and D. We would say, “VC-D is zero.”
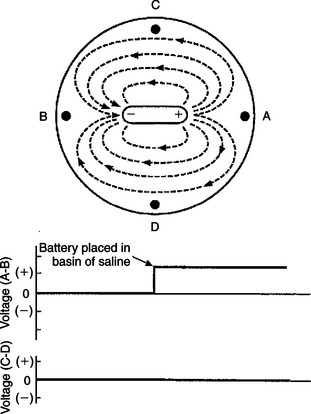
FIGURE 20-1 When an electrical dipole (e.g., a flashlight battery) is placed into a conductive medium (e.g., sodium chloride solution), the flow of ionic currents creates voltage differences within the medium. A simple voltmeter can be used to detect these voltage differences, as shown in the lower graphs. In this example the ionic currents would create a positive voltage at point A compared with point B (i.e., voltage A-B is positive). No voltage difference exists between point C and point D (i.e., voltage C-D is zero).
In Figure 20-2 the battery in the NaCl solution has been replaced with an elongated strip of cardiac muscle. Again, a voltmeter is set up to detect any voltage differences that are created at point A compared with point B, and at point C compared with point D. The voltage differences (A-B and C-D) are plotted for five different conditions. In condition 1, all the cells in the strip of cardiac muscle are at a resting membrane potential; each cell is charged negatively on its inside and positively on its outside. Because cardiac cells are electrically interconnected by gap junctions, the strip of cardiac muscle behaves electrically as if it were one large cell (a functional syncytium). From the outside, the strip of cells “looks like” one large cell that is symmetrically charged positively around its perimeter. Therefore, no dipole exists. There would be no voltage difference between point A and point B (i.e., VA-B would be zero). There would also be no voltage difference between point C and point D (i.e., VC-D would also be zero).
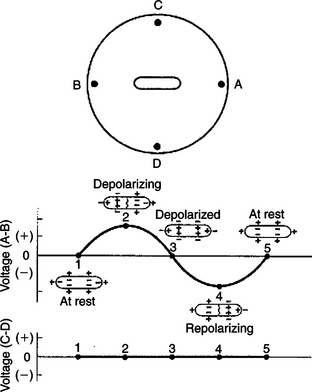
FIGURE 20-2 Strip of cardiac muscle cells in sodium chloride solution produces voltage differences between point A and point B during a phase of spreading depolarization or spreading repolarization, but not when all the cells are in a uniform state of polarization (i.e., not when all the cells are at rest or when all the cells are depolarized). No voltage difference is created between point C and point D. See text for a complete description.
In condition 2 a pacemaker cell at the left end of the muscle strip has depolarized to threshold level and formed an action potential. The action potential is propagating from cell to cell, through the muscle strip, from left to right. In other words, the cells at the left end of the strip are depolarized and are at the plateau of their action potential, whereas the cells at the right end of the strip are still at a resting membrane potential. Under these conditions the muscle strip forms an electrical dipole, in which the outside of the cells is charged positively at the right end and negatively at the left end. Therefore a positive voltage would exist at point A compared with point B. Note, however, that the voltage at point C compared with point D would still be zero, because neither of these points is closer to the positive end of the dipole. Therefore the graphs show that VA-B is positive at this time, and VC-D is zero.
In condition 3 the entire muscle strip is depolarized; that is, all the cells are at the plateau of their action potential, with a uniform negative charge outside of each cell. Therefore, no voltage differences exist around the perimeter of the muscle strip, and the recorded voltages (A-B and C-D) are both zero.
In condition 4 the muscle strip is repolarizing; cells at the left end have returned to a resting state, whereas cells at the right end are still at the plateau of their action potential. Under these conditions the voltage at point A is negative compared with point B, because the outside of the muscle strip is charged negatively at its right end and positively at its left end (VA-B is negative). VC-D is still zero.
In condition 5, all the cells in the muscle strip have returned to a resting state (same as condition 1). Once again, VA-B is zero and VC-D is zero.
Note that if the depolarization (in condition 2) had spread from right to left in the muscle strip (instead of from left to right), the voltage at point A compared with point B (VA-B) would have been negative during depolarization. Likewise, if the repolarization (in condition 4) had spread from right to left in the muscle strip, VA-B would have been positive during repolarization. Table 20-1 summarizes these relationships.
Table 20-1 Sign (Polarity) of Voltages Created at Point A Compared with Point B (VA-B)*
| Depolarization | Repolarization | |
|---|---|---|
| Approaching A | + | – |
| Going away from A | – | + |
* When a strip of muscle within a conductive medium is depolarizing or repolarizing. The arrangement of muscle and electrodes is depicted in Figure 20-2.
Figure 20-3 takes the development of the ECG one step further by picturing the entire heart (rather than a strip of cardiac muscle) in the bowl of saline. The graphs below the drawing show the voltage differences that would be detected by electrodes at the perimeter of the basin during atrial depolarization.
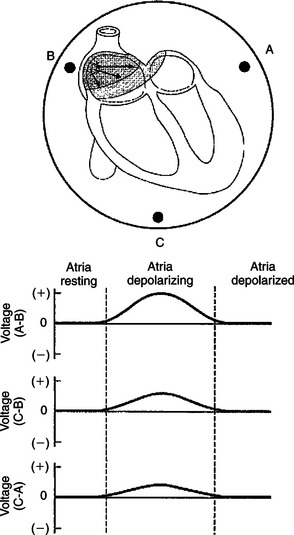
FIGURE 20-3 A resting heart, placed in sodium chloride solution, would not create voltage differences among electrodes A, B, and C. However, during depolarization of the atria, a positive voltage would be created at point A compared with point B. There would also be positive voltages at point C compared with point B and at point C compared with point A.
The plots start at a time between cardiac contractions, when all the cells in the heart are at a resting membrane potential. Every cardiac cell is charged negatively on the inside of its membrane and positively on the outside. Therefore, all around the entire heart, viewed as one large cell, the charge would be positive, and no voltage differences would exist between any of the electrodes.
When the cells in the sinoatrial (SA) node depolarize to threshold level, they initiate an action potential that propagates from cell to cell (spreads) outward from the SA node. As indicated by the arrows in the top diagram of Figure 20-3, the action potential spreads simultaneously downward in the right atrium and also leftward (across the right atrium and into the left atrium). During this spreading atrial depolarization, the right atrial cells near the SA node are at the plateau of their action potential (i.e., negatively charged on their outside), whereas the cells in the left atrium and the cells in the inferior part of the right atrium are still at rest (i.e., positively charged on their outside). Therefore the depolarizing atria create an electrical dipole with its positive end angled downward and toward the left atrium. This dipole of atrial depolarization creates a voltage that is positive at point A compared with point B. Also, a voltage is created at point C that is positive compared with point B. Similarly, there is a positive voltage at point C with regard to point A. These voltage differences are shown in the graphs.
Once the atria are completely depolarized (with every atrial cell at the plateau of its action potential), the voltage differences between all points return to zero.
Atrial Depolarization, Ventricular Depolarization, and Ventricular Repolarization Cause Characteristic Voltage Deflections in the Electrocardiogram
In Figure 20-4 the heart is pictured in its normal position in the thorax of a dog. The extracellular fluids of the body contain NaCl in solution, so the body can be imagined as a substitute for the bowl of saline shown in the previous figures. The positions of the left forelimb, right forelimb, and left hind limb in Figure 20-4 correspond with points A, B, and C in Figure 20-3. Figure 20-4, A, shows that, while atrial depolarization is in progress at the beginning of a heart beat, there would be a positive voltage in the left forelimb compared with the right forelimb. This is simply a repetition of the idea illustrated in Figure 20-3, the left forelimb being equivalent to point A and the right forelimb equivalent to point B.
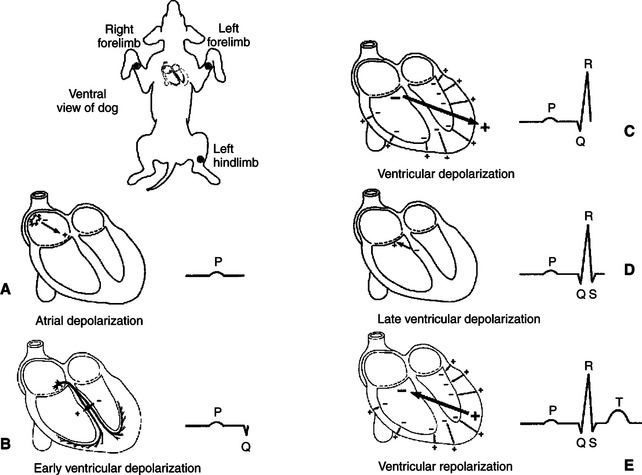
FIGURE 20-4 As a normal cardiac action potential is conducted through the atria and ventricles, a characteristic sequence of voltage differences is created between the left forelimb (analogous to point A in Figure 20-3) and the right forelimb (analogous to point B in Figure 20-3). See text for a complete description.
The deflection in the ECG trace during atrial depolarization is called the P wave. At the end of atrial depolarization (i.e., at the end of the P wave), the ECG voltage returns to zero. At this moment during the actual cardiac cycle, the action potential is propagating slowly, from cell to cell, through the atrioventricular (AV) node and the first part of the AV bundle. These tissues are so small that their depolarization generally does not create a voltage difference that is detectable at the body surface.
The next voltage differences that are detectable at the body surface are those associated with the depolarization of the ventricles. The first part of ventricular depolarization usually involves a depolarization that spreads from left to right across the interventricular septum, as shown in Figure 20-4, B. This first phase of ventricular depolarization usually causes a small voltage difference (Q wave) between the left forelimb and the right forelimb, with the left forelimb being slightly negative compared with the right.
The next event in ventricular depolarization usually causes a large, positive voltage (R wave) at the left forelimb compared with the right, as depicted in Figure 20-4, C. To understand why this R wave is large and positive, recall that during ventricular depolarization, the left and right bundle branches conduct the spreading action potential to the ventricular apex. From there, Purkinje fibers carry the action potential rapidly up the inside walls of both ventricles. From there, the depolarization spreads from cell to cell, outward through the walls of both ventricles, as pictured by the small arrows in Figure 20-4, C. Each small arrow can be considered a dipole, with its positive end pointing toward the outside wall of the ventricle (because the inside surfaces of each ventricle depolarize before the outside surface). The net electrical effect of depolarizations spreading outward through the walls of both ventricles is a large electrical dipole pointed diagonally downward (caudad) and toward the dog’s left. This net dipole is depicted by the bold arrow in Figure 20-4, C. The net dipole points toward the left for two reasons. First, the cardiac axis is tilted toward the left (i.e., the normal orientation of the heart is with the ventricular apex angled toward the left wall of the thorax). Second, the left ventricle is much more massive than the right ventricle, so the dipoles created by depolarizations spreading outward in the massive wall of the left ventricle dominate electrically over the dipoles created by depolarizations spreading outward in the thinner wall of the right ventricle. The net result is a large, positive voltage (R wave) at the left forelimb compared with the right. The R wave is the predominant feature of a normal ECG. Abnormalities in the magnitude or polarity of the R wave have great diagnostic significance, as explained later.
As the depolarizations finish spreading outward through the walls of both ventricles, the voltage in the left forelimb compared with the right forelimb returns to zero and then often becomes slightly negative for a few milliseconds (as pictured in Figure 20-4, D). The physical basis of this small, negative S wave is obscure. After the S wave, the voltage in the left forelimb compared with the right forelimb returns to zero and stays there for a time, because all the cells throughout both ventricles are uniformly at the plateau of their action potential; no dipole exists.
Altogether, the process of ventricular depolarization produces a pattern of voltages in the ECG called the QRS wave (or QRS complex). The important feature to understand about the QRS complex is why its predominant component, the R wave, is normally large and positive. Figure 20-4, E, shows the electrical events during repolarization of the ventricles. Whereas the wave of depolarization spreads outward through the walls of both ventricles, the pattern of repolarization is not as predictable. As pictured in Figure 20-4, E, the repolarization is spreading inward through the walls of both ventricles; that is, the outside surface of the ventricles was the last ventricular tissue to depolarize but the first to repolarize. The inward-going repolarization creates dipoles, as depicted by the small arrows in Figure 20-4, E, with their negative end pointed toward the inside surface of both ventricles. The net dipole during this repolarization has its negative end pointed upward (craniad) and toward the dog’s right, as depicted by the bold arrow in Figure 20-4, E. This net dipole would create a positive voltage in the left forelimb compared with the right forelimb (T wave). In many normal dogs, however, ventricular repolarization proceeds in the same direction as the depolarization (from inside the ventricles to outside). This pattern of repolarization creates a negative voltage in the left forelimb compared with the right forelimb; that is, the T wave is negative. Whether positive or negative, T waves are caused by repolarization of the ventricles.
To summarize, the P wave is caused by atrial depolarization, the QRS complex by ventricular depolarization, and the T wave by ventricular repolarization. The pattern of ventricular repolarization varies from dog to dog; the T wave may be positive or negative. No identifiable wave in the normal ECG corresponds to atrial repolarization, because atrial repolarization does not proceed in an orderly enough pattern or direction to create a significant net electrical dipole.
The Electrocardiogram Reveals the Timing of Electrical Events in the Heart
Because the predominant waves in an ECG correspond to specific electrical events in the heart, the time between these waves can be measured to determine the timing of events in the heart. Figure 20-5 indicates the conventions used to define the important intervals and segments in the ECG. The PR interval corresponds to the time between the start of atrial depolarization and the start of ventricular depolarization. The PR interval is typically about 0.1 second in a resting dog. During this time the cardiac action potential is conducted slowly through the AV node. The duration of the QRS complex corresponds to the time it takes for the ventricles to depolarize, once the cardiac action potential emerges from the AV node and AV bundle. Typically this is less than 0.1 second. The QT interval corresponds to the time from the beginning of ventricular depolarization to the end of ventricular repolarization. This approximates the duration of an action potential in ventricular tissue. Typically the QT interval is about 0.2 second. The time between successive P waves (PP interval) corresponds to the time between atrial depolarizations (and thus atrial contractions). The PP interval can be used to calculate the number of atrial contractions per minute (the atrial rate), as illustrated in Figure 20-5. Likewise, the time between successive R waves (RR interval) corresponds to the time between ventricular depolarizations (and thus ventricular contractions), so the RR interval can be used to calculate the ventricular rate. Of course, in a normal heart, the atrial rate equals the ventricular rate.
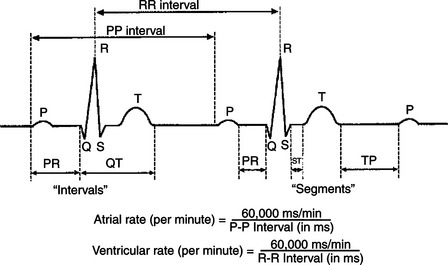
FIGURE 20-5 The time between various waves of the electrocardiogram corresponds to the timing of specific electrical events in the heart. See text for a complete description. The equations show how the atrial rate and the ventricular rate can be calculated from the P-P and R-R intervals, respectively. Of course, in a normally functioning heart, atrial rate = ventricular rate = heart rate.
Six Standardized Electrocardiographic Leads Are Used in Veterinary Medicine
Figure 20-6 shows actual ECG records obtained from a normal dog. To obtain these recordings, electrodes were placed on the left forelimb, right forelimb, and left hind limb. Electrodes on these limbs are usually envisioned as forming a triangle around the heart (just as electrodes at points A, B, and C form a triangle around the heart in Figure 20-3). The various ECG tracings in Figure 20-6 were obtained by interconnecting these electrodes in standardized combinations prescribed by Willem Einthoven, inventor of the ECG. As shown in Figure 20-6, B, the voltage in the left forelimb compared with the right forelimb is called lead I. Note that lead I corresponds to the voltage measurements discussed with Figure 20-4. The same pattern of distinct P, R, and T waves is evident in the lead I tracing in Figure 20-6, as seen in Figure 20-4 (although the T wave is negative in Figure 20-6).
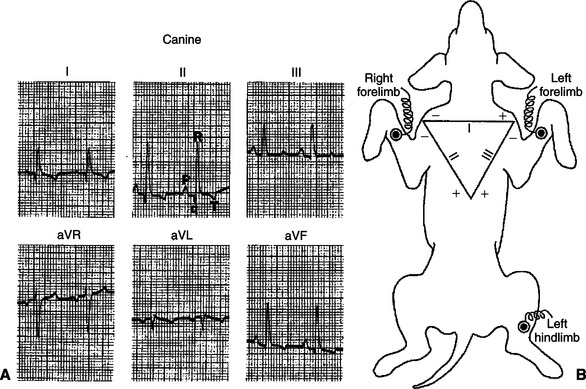
FIGURE 20-6 A, Six-lead electrocardiogram (ECG) from a normal dog. P, Q, R, and T waves (visible in all six leads) are labeled in lead II. There are no distinct S waves in these ECG recordings, and the T waves happen to be negative in leads I, II, aVL, and aVF. These are not abnormal signs. B, Einthoven’s triangle depicts the standard conventions for interconnecting the three limb electrodes to obtain lead I, lead II, and lead III ECGs. See text for additional explanation.
(From Tilley LP: Essentials of canine and feline electrocardiology: interpretation and treatment, ed 2, Philadelphia, 1985, Lea & Febiger.)
In accordance with Einthoven’s convention, the connections for the three standard limb leads are depicted in Figure 20-6 in the form of a triangle (Einthoven’s triangle). The triangle indicates that to make a lead I ECG, the voltage is recorded in the left forelimb (labeled the “+” electrode) compared with the right forelimb (called the “–” electrode). Similarly, the diagram indicates that lead II is the voltage measured in the left hind limb compared with the right forelimb, and lead III is defined as the voltage in the left hind limb compared with the left forelimb. It is important to remember that the + and − signs on Einthoven’s triangle are simply notations about how to hook up the electrodes. They indicate, for example, that lead I is obtained by measuring the voltage in the left forelimb compared with the right forelimb (not vice versa). The + and − signs on the triangle do not necessarily correspond to the orientation of the dipoles created in the heart.
As illustrated in Figure 20-6, A, the major ECG events (P, R, and T waves) are normally evident no matter whether one is looking at tracings from leads I, II, or III. These standard limb leads simply provide different “angles” for viewing the electrical dipoles created by the heart as it depolarizes and repolarizes. Three additional electrical “views” are provided by the augmented unipolar limb leads (aVR, aVL, and aVF). Lead aVR measures the voltage from the right forelimb electrode compared with the average voltage from the other two limb electrodes. Similarly, aVL and aVF measure the voltages from the left forelimb and left hind limb electrodes compared with the average voltage from the other two electrodes.
Leads I, II, and III are used routinely in veterinary electrocardiography. Recordings from the augmented unipolar limb leads (aVL, aVR, and aVF) are often included as well. Special additional leads are sometimes recorded by placing ECG electrodes at standardized sites on the thorax. These precordial (chest) leads are used more often in human medicine than in veterinary medicine. They are helpful in evaluation of very specific cardiac electrical dysfunctions.
The standardized vertical calibration on an ECG is that two major divisions equal 1 millivolt (mV). Two standard chart speeds are used: 25 millimeters per second (mm/sec), whereby five major divisions on the horizontal (time) axis equal 1 second, or 50 mm/sec, whereby 10 major divisions on the horizontal axis equal 1 second. Using the faster chart speed (50 mm/sec) helps to spread out the ECG events in an animal with a rapid heart rate (e.g., a cat).
Abnormal Voltages in the Electrocardiogram Are Indicative of Cardiac Structural or Electrical Abnormalities
The ECG in Figure 20-7 was obtained from a dog with right ventricular hypertrophy. Note that the sequence of waves in the ECG appears to be normal; that is, each heartbeat begins with an upward-going P wave, which is followed by a QRS complex and a T wave (which happens to be positive in this dog). The atrial and ventricular rates are equal, at about 100 beats per minute (beats/min). An abnormality is evident, however, because the predominant polarity of the QRS complex recorded from lead I is negative. As mentioned, the QRS complex is caused by ventricular depolarization, and its dominant feature is normally a large, positive R wave. The R wave is normally positive as recorded from lead I, because the cardiac axis is normally angled to the left side of the thorax and because the left ventricular wall is much more massive than the right ventricular wall. Therefore, reversal of this polarity suggests that the cardiac axis has shifted to the right, that the mass of the right ventricle has dramatically increased, or both. The abnormally high voltages of the QRS complex recorded from leads II and III are indicative of ventricular hypertrophy. The pronounced negative components in the QRS complexes recorded from leads II and III suggest that during part of ventricular depolarization, the predominant direction of depolarization is away from the left hind limb. This is consistent with a cardiac axis shifted to the right and a massive right ventricle. Substantial right ventricular hypertrophy is a common consequence of cardiac defects that increase the pressure that must be generated within the right ventricle during its contractions. Examples include pulmonic stenosis, patent ductus arteriosus, and ventricular septal defect (see Chapter 21).
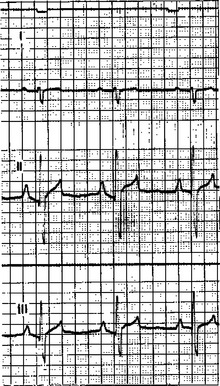
FIGURE 20-7 ECG from a dog with right ventricular hypertrophy. The chart speed is 50 mm/second; therefore, 10 major grid divisions on the horizontal axis equal 1 second. One-second timing marks are visible as small, downward deflections at the very top. Both the PP and the RR intervals are 0.6 second, so both atrial and ventricular rates are 100 per minute. The salient abnormalities are (1) predominantly negative QRS complexes recorded from lead I and (2) large-amplitude, bidirectional QRS complexes recorded from leads II and III.
(From Ettinger SJ: Textbook of veterinary internal medicine, ed 3, Philadelphia, 1989, Saunders.)
Sometimes, ECG voltages are abnormally low. One common cause of low-voltage ECGs is an accumulation of fluid in the pericardium. This condition is called cardiac tamponade. In a sense the pericardial fluid creates a short circuit for the ionic currents that would ordinarily flow outward toward the body surface. Therefore, voltages smaller than normal are created at the body surface.
An upward or downward shift of the ST segment, compared with the rest of the ECG, is often indicative of an area of ischemic or infarcted ventricular muscle. Typically, ischemic or infarcted ventricular muscle cells cannot maintain a normal, negative resting membrane potential; these cells are always more or less depolarized. Therefore, in between ventricular contractions, when normal ventricular cells are at a normal resting membrane potential, a voltage difference exists between the normal and ischemic (or infarcted) ventricular cells. This voltage difference creates an electrical dipole between normal, resting ventricular muscle and ischemic (or infarcted) ventricular muscle. Figure 20-8 (bottom left) shows the orientation of this dipole for the case of an ischemic area in the inferior (caudal) part of the ventricles. The dipole creates a negative voltage in lead II during ventricular rest (i.e., during the TP segment). When an action potential enters this ventricle, the normal ventricular tissue becomes depolarized, and a QRS complex is observed. The ischemic area cannot form action potentials; it simply remains depolarized. As a result, during the ST segment, the entire ventricle, normal and ischemic, is depolarized (Figure 20-8, bottom right). During the ST segment, there is no voltage difference (no dipole) between the injured area and the normal area. With no dipole present, the ECG voltage during the ST segment is close to a true zero level. However, the ST segment is elevated in relation to the more negative voltage during the TP segment (ventricular rest). Thus, ST segment elevation (which is actually “TP segment depression”) is indicative of an ischemic or infarcted area in the inferior (caudal) part of the ventricle. Ischemia or infarction in the anterior (cranial) ventricular area would cause ST segment depression.
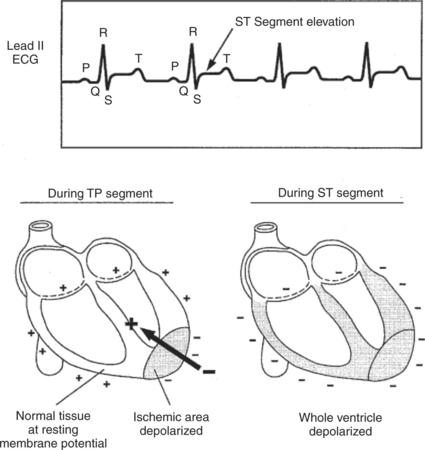
FIGURE 20-8 Voltage recorded during the ST segment is elevated compared with the baseline (TP segment) in this lead II ECG from a dog with an inferior (caudal) ventricular infarction. The drawings show why an ischemic or infarcted area of ventricle creates a net electrical dipole in the resting ventricle (during TP segment) but not in the depolarized ventricle (during ST segment).
Making a diagnosis solely on the basis of abnormal ECG voltage is risky. Theoretically, if the structural and electrical properties of a particular heart are known in detail, the appearance of the ECG can be predicted with certainty. However, the reverse situation is not strictly true. Several different cardiac defects may result in similar voltage abnormalities. Thus a voltage abnormality in an ECG cannot be ascribed with certainty to a particular cardiac defect. However, in conjunction with other clinical data (e.g., thoracic radiographs), ECG abnormalities are often strongly indicative of specific structural or electrical abnormalities in the heart.
Electrical Dysfunctions in the Heart Cause Abnormal Patterns of Electrocardiogram Waves
Figure 20-9 is an ECG from a dog with premature ventricular contractions. This lead I strip begins with five normal beats (each QRS complex is preceded by a P wave and followed by a T wave). The P waves are evenly spaced, with a PP interval of 0.5 second (so heart rate is 120 beats/min). After five normal beats, a large-voltage complex of abnormal shape occurs without a preceding P wave. This is indicative of a premature ventricular depolarization (atrial depolarization could not produce such large voltage deflections). The predominant voltage in the abnormal complex is positive in lead I, indicating that the premature ventricular depolarization spread predominantly from right to left in the ventricles. The abnormal shape and long duration of the complex indicate that the premature depolarization did not spread across the ventricles by way of the rapidly conducting bundle branches and Purkinje fibers. In other words, the ectopic site that originated the premature depolarization was not within the AV bundle or bundle branches. Instead, the ventricular depolarization must have spread through more slowly conducting pathways. The abnormally large T wave associated with the premature beat further emphasizes the abnormal pattern of spread of the premature action potential across the ventricles.
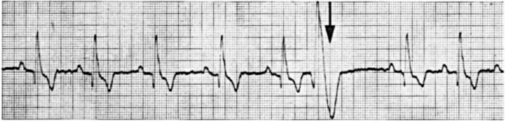
FIGURE 20-9 Lead I ECG of a dog showing five normal beats followed by one premature ventricular beat. A sixth P wave would be expected at the time marked by the arrow. This P wave is obscured by the large voltages associated with the premature ventricular beat. Also, the refractory period associated with the premature beat prevented the sixth normal ventricular beat from occurring; this creates a long pause (called the compensatory pause) between the premature beat and the next regular beat. In this and the remaining ECG examples, chart speed is 50 mm/second (10 major grid divisions equal 1 second).
(From Ettinger SJ: Textbook of veterinary internal medicine, ed 3, Philadelphia, 1989, Saunders.)
Had the premature depolarization originated from an ectopic pacemaker within the AV bundle or bundle branches, the pattern of ventricular depolarization and the pattern of ventricular repolarization would have appeared normal; that is, the QRS complex and the T wave of the premature beat would have looked like the other QRS and T waves. They would simply have occurred earlier than expected and would not be preceded by a P wave. Sometimes, premature contractions are initiated by ectopic pacemakers in the atria. In such a case the QRS complex and T wave would be expected to have a normal size and shape because normal ventricular pathways would be involved in ventricular depolarization and repolarization.
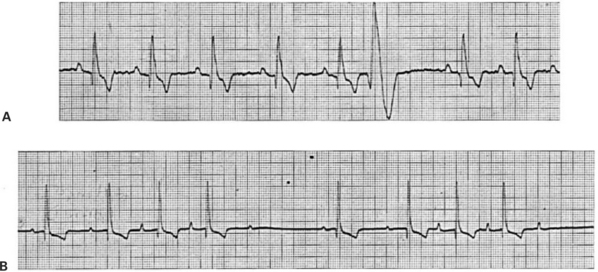
Figure 20-10 shows additional examples of cardiac electrical dysfunctions, recorded from resting dogs. In the ECG in Figure 20-10, A, the R waves are evenly spaced and indicate a ventricular rate of 235 beats/min. This is fast for a resting dog. However, the pattern of ECG waves appears to be normal; each QRS complex is preceded by a clear, positive P wave and is followed by a positive T wave (which overlaps the next P wave). The most likely diagnosis is sinus tachycardia (rapid heart rate initiated by SA node pacemakers). Figure 20-10, B, shows the opposite extreme. The pattern of ECG waves is normal, but the heart rate is only 55 beats/min. The diagnosis is sinus bradycardia (the SA node is the pacemaker, but its rate is abnormally slow).
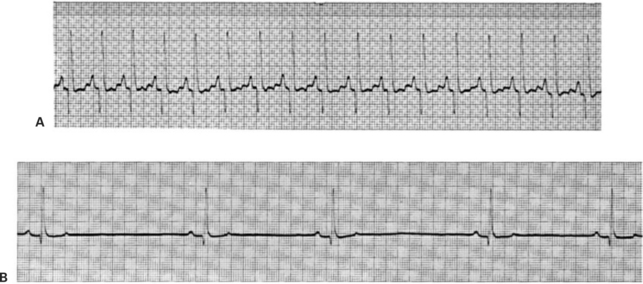
FIGURE 20-10 Sinus tachycardia (A) and sinus bradycardia (B) are evident in these otherwise-normal ECGs from two resting dogs.
(From Ettinger SJ: Textbook of veterinary internal medicine, ed 3, Philadelphia, 1989, Saunders.)
The ECG provides an easy way to diagnose AV node block. The ECG in Figure 20-11, A, looks normal, except that there is an abnormally long PR interval, which is indicative of abnormally slow conduction of the action potential through the AV node and AV bundle, and thus first-degree AV node block. In Figure 20-11, B, the P wave spacing indicates an atrial rate of 123 beats/min. Four of the P waves are followed by faintly visible QRS complexes and large, negative T waves, but the other seven P waves are not followed by QRS-T complexes. Apparently some, but not all, atrial depolarizations are conducted through the AV node, which indicates a condition of second-degree AV block. The condition is not life threatening unless there are so many missed ventricular beats that cardiac output falls to dangerously low levels.
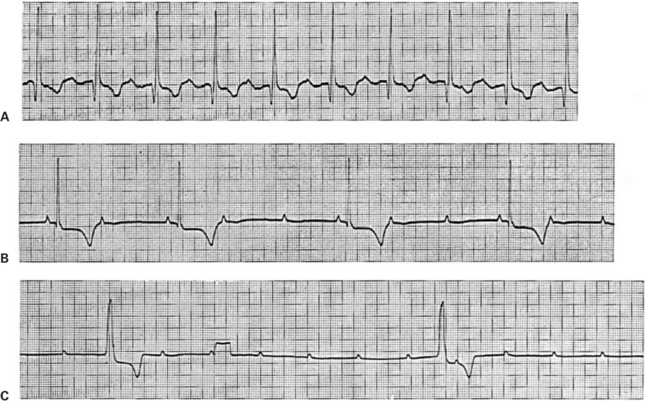
FIGURE 20-11 A, Example of first-degree AV node block (abnormally slow AV conduction). Each QRS complex is preceded by a positive P wave and followed by a negative T wave, which is normal. However, the PR interval is 0.2 second (normal for a dog is less than 0.14 second). B, Example of second-degree AV node block (sporadic AV conduction). The small, positive deflections are P waves. The broad, negative deflections are T waves, which follow the faintly visible QRS complexes. Where P waves are followed by QRS-T complexes, the PR interval is normal. However, only every second or third P wave is followed by a QRS-T complex; that is, there are two or three atrial beats for every ventricular beat. C, Example of third-degree (complete) AV node block. Regularly spaced P waves are evident (although two of them are obscured by the two large QRS-T complexes). The QRS-T complexes are not immediately preceded by P waves. ST segment depression is also evident, but this is irrelevant to the diagnosis of AV block. The rectangular deflection one third of the way through the record is a voltage calibration signal (1 mV).
(From Ettinger SJ: Textbook of veterinary internal medicine, ed 3, Philadelphia, 1989, Saunders.)
Figure 20-11, C, shows third-degree (complete) AV node block (and, incidentally, ST segment depression). Two large QRS complexes are faintly visible, followed by negative T waves. The RR interval is about 2.9 seconds, indicating that the ventricular rate is only 21 beats/min. The QRS complexes are not immediately preceded by P waves. Small, evenly spaced, positive P waves are present, indicating a constant atrial rate of 142 beats/min, but there is no synchronization between the P waves and the QRS complexes. Atrial action potentials are apparently being blocked at the AV node. The ventricles are beating slowly in response to an auxiliary pacemaker in the AV node or in the bundle of His.
Figure 20-12, A, shows an ECG record of a dog that is drifting in and out of ventricular tachycardia. The first five waves are abnormally shaped ventricular complexes, indicative of an ectopic ventricular pacemaker located outside the normal ventricular conduction system. No P waves are observed. Then there are three normal-appearing P-QRS-T sequences, which suggests that a normal rhythm is being established. However, the ectopic ventricular pacemaker usurps control again, and ventricular tachycardia returns.
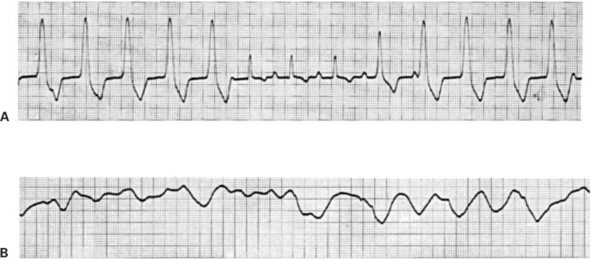
FIGURE 20-12 A, Example of ventricular tachycardia, which reverts briefly to a sinus rhythm. The ventricular rate is about 165 beats per minute. This pattern would be typical for a dog with an ectopic ventricular pacemaker functioning at almost the same rate as the SA node pacemaker; some ventricular beats would be initiated by the ectopic pacemaker, and others would be initiated in the normal way through the AV node. B, Example of ventricular fibrillation. The random voltage fluctuations generated by the fibrillating ventricles would obscure any P waves that might be present, so it is not possible to determine whether the atria are also fibrillating.
(From Ettinger SJ: Textbook of veterinary internal medicine, ed 3, Philadelphia, 1989, Saunders.)
Ventricular tachycardia degenerates frequently into ventricular fibrillation. The ECG in Figure 20-12, B, indicates ventricular fibrillation. The record shows fairly large, irregular voltage fluctuations with no discernible pattern. The atria may or may not be fibrillating; regularly occurring P waves may be present but obscured by the random electrical activity in the ventricles. However, ventricular fibrillation stops the heart from pumping blood, regardless of whether the atria continue to contract in a synchronized manner.
Atrial fibrillation, as with ventricular fibrillation, typically produces random voltage dipoles. However, because the atrial muscle mass is relatively small, the ECG voltages generated by atrial fibrillation are always much smaller than those seen in Figure 20-12, B. An ECG from an animal with atrial fibrillation would typically show normally shaped QRS and T waves against a background of low-amplitude voltage fluctuations created by the fibrillating atria. In such a case the AV node is bombarded with very frequent action potentials from the fibrillating atria. Some of these action potentials are conducted to the ventricles, and others are blocked (the long refractory period of the AV node allows it to protect the ventricles from beating too rapidly). Thus, in the case of atrial fibrillation, the QRS-T complexes would typically have normal shape but irregular spacing in time.
Sophisticated techniques are widely used in the analysis of ECGs both in human medicine and in many veterinary clinics. The purpose in this chapter is to introduce only enough complexity to illustrate the usefulness of the ECG in the diagnosis of cardiac abnormalities. In addition, this discussion of the ECG is intended to reinforce the student’s understanding of electrical dysfunction of the heart, as presented in Chapter 19.
CLINICAL CORRELATIONS
Dilative Cardiomyopathy with Paroxysmal Atrial Tachycardia
History.
An owner brings his 5-year-old male Saint Bernard to you because of a distended abdomen, weakness, coughing, and difficulty breathing. The owner believes these signs developed gradually over several weeks; however, before the last few weeks, there were occasional episodes when the dog suddenly seemed weak and very listless. The episodes lasted from a few minutes to about an hour.
Clinical Examination.
Palpation reveals that the dog has muscle wasting and marked ascites (fluid in the abdominal cavity). The jugular veins are distended. The arterial pulse is rapid and irregular; there are frequent pulse deficits (missing beats). Thoracic radiography reveals an enlarged heart and an accumulation of fluid near the lung hilus.
You record the dog’s ECG for several minutes. You note that P waves usually occur at a rate of 160 to 170 per minute and that each P wave is followed by a QRS-T complex. However, the ECG also shows frequent episodes when there are 210 to 230 P waves per minute. During these episodes, most P waves are followed by QRS-T complexes, but others are not. As a result, the QRS-T complexes occur irregularly, with about 180 per minute.
Echocardiography reveals severe dilation of all four cardiac chambers, particularly the atria. Even though the ventricles are enlarged, the ventricular walls are thinner than normal, a condition called eccentric hypertrophy. Ventricular contractions are weak.
Comment.
The ECG indicates that this dog has atrial tachycardia. The information presented does not establish whether the atrial pacemaker is located in the SA node or somewhere else in the atria. It is likely that one atrial pacemaker area is initiating depolarizations at a rate of 160 to 170 per minute and that another atrial area intermittently preempts the first pacemaker by initiating depolarizations at the more rapid rate of 210 to 230 per minute. When the atrial rate is 160 to 170 per minute, the AV node conducts every atrial action potential to the ventricles, so that the ventricles also contract 160 to 170 times/min. However, when the atrial rate is 210 to 230 per minute, some of the atrial action potentials arrive at the AV node when the nodal cells are still refractory from the preceding action potential. These atrial action potentials are not conducted into the ventricles, which is why there are only about 180 ventricular contractions per minute. This is a case in which a second-degree AV node block, created by the relatively long refractory period of AV node cells, is beneficial, because it prevents the ventricles from beating too rapidly. The problem, when an arrhythmia triggers very frequent ventricular contractions, is that the time available between contractions becomes too short for adequate ventricular refilling. As ventricular rate increases, the volume of blood pumped with each beat (stroke volume) decreases, and so does cardiac output. At ventricular rates above 180 per minute, cardiac output could fall to such a low level that the dog would collapse.
This dog’s primary problem is probably a chronic, progressive weakening of his heart muscle (cardiomyopathy). All the clinical signs, including atrial tachycardia, can be attributed to a primary cardiomyopathy. Dilative cardiomyopathy is common in giant-breed dogs, especially males, and often (as in this case) there is no discernible cause.
Even though the cause of the cardiomyopathy could not be determined from the evidence available in this case, the sequence of dysfunctions that resulted from the cardiomyopathy can be inferred with near-certainty. Ventricular weakness caused heart failure; the cardiac output fell below normal, especially during exercise. The dog’s body attempted to compensate for the heart failure by increasing blood volume, which increased both venous and atrial pressures far above normal. The elevated atrial pressure had the beneficial effect of “supercharging” the ventricles with an extra volume of blood before each contraction, which partially returned the stroke volume toward normal. However, the excessive volume and pressure of blood in the veins caused pulmonary edema (which led to coughing and difficulty breathing) and systemic edema (which led to fluid in the abdomen). Also, distention of the atria made the atrial cells more excitable electrically, which resulted in the formation of ectopic pacemakers and the onset of atrial tachycardia. The tachycardia limited the ventricular refilling time, causing further compromise in cardiac output. A vicious cycle began in which decreased cardiac output caused further venous congestion and atrial distention, which aggravated the arrhythmia, and so forth. The atrial tachycardia will likely progress to atrial fibrillation. The prognosis is poor without treatment.
This case of heart failure provides a good preview for the next several chapters, which deal in detail with the physiological mechanisms of cardiac and vascular control in both normal and heart failure states.
Treatment.
A diuretic drug (e.g., furosemide) is administered to promote an increase in urine formation. The goal is to reduce the blood volume and venous and atrial pressures, thereby reducing the signs resulting from congestion and edema. Sometimes the paroxysmal atrial tachycardia resolves after diuretic-induced reductions in atrial size. If it does not, antiarrhythmic drugs (e.g., quinidine or lidocaine, and/or a cardiac glycoside such as digitalis) can be used to try to reduce the electrical excitability of atrial tissue.
Berne RM, Levy MN. Cardiovascular physiology, ed 8. St Louis: Mosby, 2001.
Cote E, Ettinger SJ. Electrocardiography and cardiac arrhythmias. Ettinger SJ, Feldman EC. Textbook of veterinary internal medicine: diseases of the dog and cat, ed 6, St Louis: Saunders, 2005.
Lederer WJ. Cardiac electrophysiology and the electrocardiogram. In: Boron WF, Boulpaep EL. Medical physiology: a cellular and molecular approach. Philadelphia: Saunders, 2005.
Katz AM. Physiology of the heart, ed 4. Baltimore: Lippincott Williams & Wilkins, 2005.
Marr C, ed. Cardiology of the horse. London: Saunders, 1999.
Patteson MW. Equine cardiology (Library of Veterinary Practice). Oxford, UK: Blackwell Scientific, 1996.
Reece WO. Dukes’ physiology of domestic animals, ed 12. Ithaca, NY: Comstock Cornell University Press, 2004.
Tilley LP, Burtnick NL. ECG for the small animal practitioner. Jackson, WY: Teton NewMedia, 1999.
Tilley LP, Goodwin JK. Manual of canine and feline cardiology, ed 3. Philadelphia: Saunders, 2001.
PRACTICE QUESTIONS
1. In which of the following arrhythmias will the ECG characteristically show the same number of P waves and QRS complexes?
2. The time required for the conduction of the cardiac action potential through the AV node would be approximately equal to the:
3. The T wave in a normal ECG is:
4. The ECG in Figure 20-13, A, indicates:
5. The ECG in Figure 20-13, B, indicates