Chapter 21 The Heart as a Pump
1. Each heartbeat consists of ventricular systole and ventricular diastole.
2. Cardiac output equals heart rate multiplied by stroke volume.
3. Up to a point, increases in end-diastolic ventricular volume cause increases in stroke volume.
4. End-diastolic ventricular volume is determined by ventricular preload, ventricular compliance, and diastolic filling time.
5. Increases in ventricular contractility cause decreases in ventricular end-systolic volume.
6. Increasing the heart rate does not increase cardiac output substantially unless stroke volume is maintained.
7. Murmurs are abnormal heart sounds caused by turbulent flow through cardiac defects.
8. Some cardiac defects increase the heart’s workload, which causes cardiac hypertrophy.
9. The pathological consequences of cardiac defects are direct results of the abnormal pressures, volumes, and workloads created in the cardiac chambers.
Each Heartbeat Consists of Ventricular Systole and Ventricular Diastole
The heart is actually two pumps (two ventricles) that work together, side by side. Each ventricular pump works in a cycle, first relaxing and filling with blood and then contracting and ejecting some blood. In each cardiac cycle (heartbeat) the left ventricle takes in a volume of blood from the pulmonary veins and left atrium, then ejects it into the aorta. The right ventricle takes in a similar volume of blood from the systemic veins and right atrium, then ejects it into the pulmonary artery.
Figure 21-1 shows the events of a single cardiac cycle. A normal electrocardiogram (ECG) tracing is presented at the top of the figure. Atrial contraction is initiated by atrial depolarization, which is indicated by the P wave. Ventricular contraction is initiated by ventricular depolarization, which is indicated by the QRS complex. The period of ventricular contraction is called ventricular systole. Blood is ejected from the ventricles during ventricular systole. Each systole is followed by ventricular diastole, during which the ventricles relax and refill with blood before the next ventricular systole. Note that ventricular diastole corresponds to the period between a T wave and the subsequent QRS complex, when ventricular cells are at resting membrane potential.
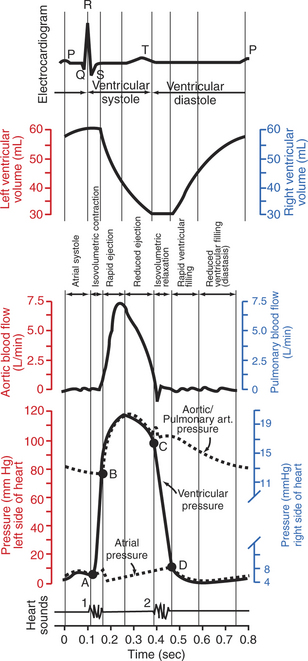
FIGURE 21-1 Events and terminology associated with one cardiac cycle (heartbeat) in a normal dog. Vertical scales on the left side of the graphs (red) are for the left side of the heart. Vertical scales on the right side of the graphs (blue) are for the right side of the heart. In the graph of ventricular pressure, point A indicates closure of the mitral and tricuspid valves (the atrioventricular valves); point B indicates opening of the aortic and pulmonic valves; point C indicates closure of the aortic and pulmonic valves; and point D indicates opening of the mitral and tricuspid valves. See text for details.
The ventricles do not empty completely during systole. As shown in the graph of ventricular volume (Figure 21-1, second from top), each ventricle of a large dog contains about 60 mL of blood at the end of diastole. This is called end-diastolic volume. During systole, about 30 mL of this blood is ejected from each ventricle, but 30 mL remains. This is called end-systolic volume. The volume of blood ejected from one ventricle in one beat is called stroke volume, expressed as follows:

The fraction of end-diastolic volume that is ejected during ventricular systole is called the ejection fraction, as follows:

In the example depicted in Figure 21-1, ejection fraction is 50%. Values between 50% and 65% are typical for resting dogs.
As shown in Figure 21-1, left ventricular pressure is low at the beginning of ventricular systole, but the powerful contraction of the ventricular muscle causes the ventricular pressure to increase rapidly. The increase in left ventricular pressure causes a momentary backflow of blood from the left ventricle to the left atrium, which closes the left atrioventricular (AV) valve (the mitral valve). Blood is not immediately ejected from the left ventricle into the aorta at the beginning of systole, because the aortic valve remains closed until the left ventricular pressure exceeds the aortic pressure. Therefore, ventricular volume remains unchanged during this first phase of systole, which is aptly named isovolumetric contraction.
When left ventricular pressure does rise above aortic pressure, the aortic valve is pushed open, and there is a rapid ejection of blood into the aorta. Rapid ejection is followed by a phase of reduced ejection of blood as both ventricular pressure and aortic pressure pass their peak (systolic) values and begin to decrease. (During the period of reduced ejection, the ventricular pressure actually falls below the aortic pressure, but ejection continues for a few moments, because the blood flowing out of the ventricle is carried along by the momentum imparted to it during rapid ejection.) As the ventricular pressure continues to decrease, ejection comes to an end. A momentary backflow of blood from the aorta into the left ventricle closes the aortic valve. The closure of the aortic valve demarcates the end of ventricular systole and the beginning of ventricular diastole.
During the first phase of ventricular diastole, the ventricular muscle relaxes, and left ventricular pressure declines from a value near aortic pressure to a value near left atrial pressure. However, no filling of the ventricle can occur because the mitral valve remains closed until left ventricular pressure drops below left atrial pressure. This first phase of ventricular diastole is called isovolumetric relaxation because there is neither filling nor emptying of the ventricle.
When left ventricular pressure does fall below left atrial pressure, the mitral valve is pushed open, and ventricular filling commences. First, there is a period of rapid ventricular filling, which is followed by a phase of reduced ventricular filling (diastasis). Diastasis persists until the sinoatrial node cells initiate an atrial action potential and atrial contraction (atrial systole). In a resting dog, as depicted in Figure 21-1, ventricular volume is nearly at its end-diastolic level even before atrial systole. Typically, 80% to 90% of ventricular filling occurs before atrial systole. Atrial systole simply “tops up” the almost-full ventricles. An important clinical consequence of this fact is that the heart in a resting animal pumps a nearly normal cardiac output even in the absence of properly timed atrial contractions (e.g., during atrial fibrillation). During exercise, however, atrial contractions make a relatively greater contribution to ventricular filling because the rapid heart rate in exercise leaves a shorter time for diastolic filling. Therefore, animals with atrial fibrillation typically exhibit exercise intolerance. Ventricular filling also becomes more dependent on atrial systole in patients with certain valve defects, such as narrowing of the mitral valve (mitral stenosis).
At the end of atrial systole, the atria begin to relax. The left atrial pressure drops slightly. The ventricles then begin to contract, and there is a momentary backflow of blood from the left ventricle to the left atrium. The mitral valve closes, which marks the end of ventricular diastole and the beginning of another left ventricular systole.
By definition, the cardiac cycle is divided into ventricular systole and ventricular diastole. Closure of the mitral valve marks the beginning of ventricular systole. Closure of the aortic valve marks the beginning of ventricular diastole. Atrial systole takes place during ventricular diastole.
The preceding six paragraphs discussed pressure changes in the left atrium, left ventricle, and aorta. However, all the events of the cardiac cycle also take place on the right side of the heart. Therefore, all the statements made about the left side of the heart also hold true for the right side of the heart; simply substitute “pulmonary artery” for “aorta,” “pulmonic valve” for “aortic valve,” and “tricuspid valve” for “mitral valve.” As indicated in Figure 21-1, the ventricular volumes are similar for the left and right sides, and so are the blood flow rates. The pressures, however, differ greatly on the two sides. Systolic (peak) pressure in the right ventricle and pulmonary artery is only about 20 mm Hg, whereas systolic pressure on the left side of the heart reaches 120 mm Hg. This explains why there are different scales on the pressure axes in Figure 21-1 for the left and right sides of the heart.
The timing of the two major heart sounds is also shown in Figure 21-1 (bottom). The first heart sound is associated with the closure of the AV valves (the mitral and tricuspid valves). The actual closure of the valves does not make this sound; the valve leaflets are so light and thin that their closing would be almost silent. However, there is a momentary backflow of blood from the ventricles to the atria at the beginning of ventricular systole. When this backflow of blood is brought to a sudden stop against the closing valves, momentary vibrations are created in the blood and in the cardiac walls. These vibrations create the heart sound.
The second heart sound is associated with closure of the aortic valve on the left side of the heart and the pulmonic valve on the right side of the heart. It is usually briefer, sharper, and higher pitched than the first heart sound. Again, what makes the sound is not the valve leaflets closing, but rather the reverberation produced when the momentary backflow of blood into the ventricles is brought to a sudden stop by closure of the valves. The closures of the aortic and pulmonic valves are normally simultaneous. Under certain circumstances, however, the two valves close at slightly different times, and the second heart sound is heard as two distinct sounds in quick succession; this condition is called a split second heart sound.
The AV valves close at the beginning of ventricular systole, and the aortic and pulmonic valves close at the end of ventricular systole. Therefore, ventricular systole is sometimes defined as the part of the cardiac cycle between the first heart sound and the second heart sound.
Cardiac Output Equals Heart Rate Multiplied by Stroke Volume
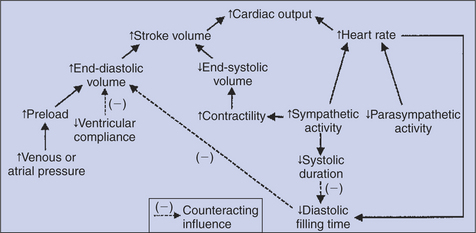
All the events diagrammed in Figure 21-1 occur during each heartbeat, and each heartbeat results in the ejection of one stroke volume of blood into the pulmonary artery and aorta. The number of heartbeats per minute is called the heart rate. Therefore, cardiac output (the total volume of blood pumped by each ventricle in 1 minute) equals stroke volume multiplied by heart rate. Cardiac output can be increased only if heart rate increases, stroke volume increases, or both increase. Therefore, to understand how the body controls cardiac output, you must understand how the body controls heart rate and stroke volume. Figure 21-2 summarizes the factors that affect heart rate and stroke volume. These factors are described in detail in the following three sections.
Up to a Point, Increases in End-Diastolic Ventricular Volume Cause Increases in Stroke Volume
Stroke volume equals end-diastolic volume minus end-systolic volume. Therefore, as shown in Figure 21-2, stroke volume can be increased only by increasing end-diastolic volume (i.e., filling the ventricles more during diastole) or by decreasing end-systolic volume (i.e., emptying the ventricles more completely during systole), or both.
The effect of increasing end-diastolic ventricular volume (EDV) on stroke volume is plotted in Figure 21-3, A. The detailed physiological mechanisms underlying this relationship are complex. Basically, however, greater ventricular filling during diastole places the ventricular muscle fibers in a more favorable geometry for the ejection of blood during the next systole. Also, stretching the ventricular muscle fibers during diastole causes a greater amount of calcium (Ca2+) to be released from the sarcoplasmic reticulum during the subsequent systolic contraction, and this enhances the force of contraction. Resting conditions in a normal animal are somewhere around the middle of this ventricular function curve. Therefore, increases or decreases from normal ventricular end-diastolic volume result in approximately proportional increases or decreases in stroke volume.
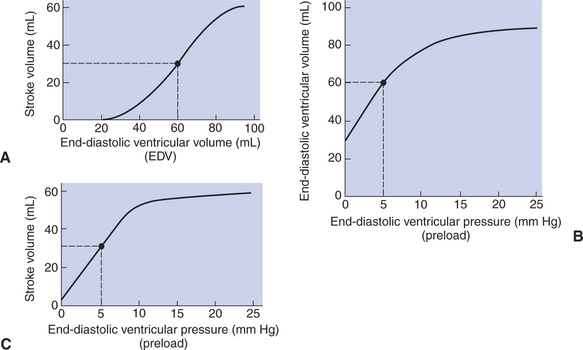
FIGURE 21-3 A, Increase in end-diastolic ventricular volume causes increased stroke volume. B, Increase in end-diastolic ventricular pressure (preload) causes increased end-diastolic ventricular volume. C, Combines the relationships of A and B to show that an increase in ventricular preload causes increased stroke volume. An upper limit is reached in each relationship (A to C) primarily because, at high levels of end-diastolic ventricular volume, the ventricular walls become stretched to their elastic limit. The numerical data are for the left ventricle of a large dog. The points and dashed lines indicate normal values for the resting state.
End-Diastolic Ventricular Volume Is Determined by Ventricular Preload, Ventricular Compliance, and Diastolic Filling Time
Ventricular preload is the pressure within a ventricle during diastolic filling. Because ventricular pressure changes throughout filling (see Figure 21-1), the value of ventricular pressure at the end of diastole is usually accepted as a singular measure of preload. Normal values of preload (end-diastolic ventricular pressure) are about 3 mm Hg for the right ventricle and 5 mm Hg for the left ventricle. In a normal heart, ventricular pressure at the end of diastole is essentially equal to atrial pressure because the AV valves are open widely up until the end of diastole. Also, because there are no valves between the veins and the atria, the atrial pressure is almost identical to the pressure within the nearby veins. Thus, pulmonary venous pressure, left atrial pressure, and left ventricular end-diastolic pressure are all essentially equivalent measures of left ventricular preload. Similarly, right ventricular end-diastolic pressure, right atrial pressure, and vena caval pressure are all essentially equivalent measures of right ventricular preload. In the clinic, right ventricular preload is measured by introducing a catheter into a peripheral vein (e.g., the jugular vein) and advancing it into the cranial vena cava (precava) or right atrium. Such a catheter is called a central venous catheter, and the pressure measured at its tip is called central venous pressure. Left ventricular preload is more difficult to measure clinically because there is no easy way to place a catheter tip into the left atrium or pulmonary veins.
Figure 21-3, B, shows that increases in preload are associated with increases in end-diastolic ventricular volume. The graph depicts a left ventricle that has a natural volume of 30 mL in a relaxed, nonpressurized state (i.e., when the preload equals 0 mm Hg). Increases in preload distend and fill the ventricle. A preload of 5 mm Hg brings about the normal left ventricular end-diastolic volume of 60 mL. However, an elastic limit is reached when the ventricular volume approaches 90 mL. Further increases in the preload do not cause much additional ventricular filling.
Increases in ventricular preload cause increases in end-diastolic volume (Figure 21-3, B), and increases in end-diastolic volume cause increases in stroke volume (Figure 21-3, A). Therefore, it follows that increases in preload cause increases in stroke volume (Figure 21-3, C). Each of these relationships reaches an upper limit. Several factors are involved, but the main one (already mentioned) is that the ventricular walls become stretched to their elastic limit at high levels of end-diastolic ventricular volume. In a resting dog the normal values of ventricular preload, end-diastolic volume, and stroke volume are about midway between their minimum and maximum values (Figure 21-3). Therefore a decrease below normal in preload will cause a decrease in both end-diastolic ventricular volume and stroke volume. This happens, for example, in response to hemorrhage (see Chapter 26).
The relationships among ventricular preload, end-diastolic volume, and stroke volume were first studied in detail by Ernest Henry Starling. The observation that changes in preload cause corresponding changes in end-diastolic ventricular volume and stroke volume is called Starling’s law of the heart. The Starling mechanism is critical for moment-to-moment adjustments of stroke volume. For example, if the right ventricle begins, for any reason, to pump an increased stroke volume, the resulting additional pulmonary blood flow causes an increase in the pulmonary venous pressure, which increases left atrial pressure, which in turn increases left ventricular preload, which, furthermore, increases the filling of the left ventricle during diastole. The resulting increase in left ventricular end-diastolic volume leads to a greater stroke volume from the left ventricle. Thus an increase in right ventricular stroke volume quickly results in a corresponding increase in left ventricular stroke volume. The reverse is also true.
The sequence just described has a potential for developing into a vicious circle, with runaway increases in stroke volume. Other control mechanisms prevent this from happening, as discussed in Chapter 25. The point here is that the Starling mechanism keeps the stroke volumes of the left and right ventricles balanced. If this equality were not maintained (and one ventricle pumped more blood than the other for several minutes), a large part of the body’s blood volume would accumulate either in the lungs or in the systemic circulation.
An alternate name for Starling’s law of the heart is heterometric autoregulation. This name implies self-control (autoregulation) of stroke volume as a result of different (hetero) initial volumes (metric); that is, heterometric refers to different end-diastolic volumes.
End-diastolic ventricular volume is determined not only by preload but also by ventricular compliance. Compliance is a measure of the ease with which the ventricular walls stretch to accommodate incoming blood during diastole. A compliant ventricle is one that yields easily to preload pressure and readily fills with blood during diastole. Compliance is more rigorously defined as the change in volume divided by the change in pressure. Ventricular compliance therefore corresponds to the slope of a ventricular volume versus pressure curve, such as the one shown in Figure 21-3, B. This figure shows that a normal ventricle is quite compliant over the range of ventricular volumes up to and including the normal end-diastolic ventricular volume. Within this range, small changes in preload result in substantial changes in end-diastolic ventricular volume. At preloads higher than about 10 mm Hg, however, the ventricle becomes less compliant (stiffer). Inelastic connective tissue in the ventricular walls prevents increases in ventricular volume above about 90 mL.
Myocardial ischemia, certain cardiac diseases, or mere advancing age can cause the ventricular walls to become stiff and noncompliant even at normal preloads. Figure 21-4 shows a comparison of volume versus pressure curves for a normal ventricle and for a noncompliant ventricle. In the noncompliant ventricle, there is a smaller increase in ventricular volume for any given increase in ventricular preload. As a consequence, a larger-than-normal preload is needed to obtain a normal end-diastolic ventricular volume and to achieve a normal stroke volume. An elevated preload necessitates elevated atrial and venous pressure, which leads to edema (detailed in Chapters 23 and 26). Thus, stiffening of the left ventricle leads to elevated pressure in pulmonary veins and pulmonary edema; stiffening of the right ventricle leads to elevated pressure in the systemic veins and systemic edema.
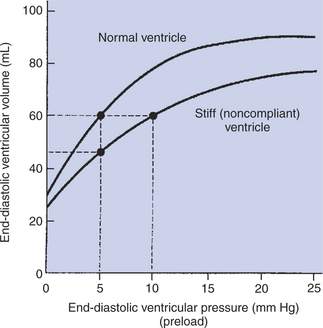
FIGURE 21-4 Stiff, noncompliant ventricle requires a higher filling pressure (preload) to reach a normal degree of filling (end-diastolic ventricular volume).
In addition to preload and compliance, the third factor that affects ventricular end-diastolic volume is the length of time available for ventricular filling during diastole. Heart rate is the main determinant of diastolic filling time. At a normal resting heart rate, there is ample time for ventricular filling during diastole; in fact, ventricular filling is almost complete even before atrial systole occurs. As heart rate increases, however, diastolic duration decreases. At heart rates greater than about 160 beats per minute, the shortness of diastolic filling time precludes achievement of normal end-diastolic ventricular volume. This limitation on ventricular filling would dramatically reduce stroke volume when heart rate is high if not for an additional, compensating influence brought about by the sympathetic nervous system, as discussed later.
Figure 21-2 (left side) provides a useful summary of the preceding discussion. End-diastolic ventricular volume is determined by ventricular preload, ventricular compliance, and diastolic filling time. An elevated preload increases ventricular filling. Decreased ventricular compliance or decreased diastolic filling time can limit ventricular filling.
Increases in Ventricular Contractility Cause Decreases in Ventricular End-Systolic Volume
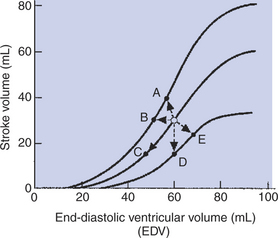
Contractility refers to the pumping ability of a ventricle. With increased contractility, there is a more complete emptying of the ventricle during systole and therefore a decreased end-systolic volume (see Figure 21-2, middle). An increase in contractility brings about an increase in stroke volume without requiring an increase in end-diastolic volume. Figure 21-5 shows graphically that increased contractility results in an increased stroke volume for any given end-diastolic volume.
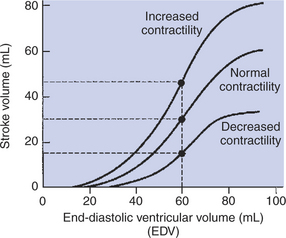
FIGURE 21-5 Increase in cardiac contractility is identifiable graphically as a leftward and upward shift of the ventricular function curve. Increase in contractility means that there will be a larger stroke volume for any given end-diastolic volume. Conversely, decrease in contractility (rightward and downward shift) means that there will be a smaller stroke volume for any given end-diastolic volume. With normal contractility and a normal end-diastolic volume of 60 mL, the end-systolic volume is 30 mL, and so the stroke volume is 30 mL (middle dot). An increased contractility with no change in end-diastolic volume results in more systolic emptying. For example, if the end-systolic volume is reduced to 15 mL, the stroke volume increases to 45 mL (upper dot).
Sympathetic nerve activity increases ventricular contractility through the action of the neurotransmitter norepinephrine, which activates β-adrenergic receptors on ventricular muscle cells. As discussed in Chapter 19, activation of β-adrenergic receptors leads to an increased influx of extracellular Ca2+ into cardiac cells during an action potential (and to several other effects); the overall result is that cardiac contractions are stronger, quicker to develop, and shorter. Epinephrine and norepinephrine released from the adrenal medulla and circulating in the blood can likewise activate β-adrenergic receptors and increase contractility, as can β-adrenergic agonist drugs (e.g., epinephrine, isoproterenol). The cardiac glycosides (e.g., digitalis) are another class of drugs that increases cardiac contractility, again by increasing the cytosolic Ca2+ concentration during an action potential.
If cardiac contractility becomes depressed, there is less-than-normal ventricular emptying during systole. End-systolic volume increases, and stroke volume decreases, as shown in Figure 21-5. A decrease in sympathetic activity causes a decrease in cardiac contractility, as do β-adrenergic antagonist drugs, which block the β-adrenergic receptors on cardiac muscle cells. Propranolol and atenolol are the β-adrenergic antagonists used most often to decrease cardiac contractility. As with β-adrenergic antagonists, calcium channel–blocking drugs also decrease cardiac contractility by making less Ca2+ available for the activation of the contractile proteins. Barbiturates, opioids, and some general anesthetics depress cardiac contractility as well; this must be kept in mind, particularly when administering such drugs to a patient who may already have compromised cardiac function. A decrease in cardiac contractility causes a decrease in stroke volume and therefore cardiac output. Consequently, the patient’s blood pressure may fall to dangerously low levels.
A decreased cardiac contractility is the hallmark of the general clinical condition called heart failure (myocardial failure). Although there are many forms of heart failure, they share one characteristic: a decrease in pumping ability of one or both ventricles. Heart failure can result from coronary artery disease, myocardial ischemia, myocardial infarction, myocarditis, toxins, or electrolyte imbalances.
Although ventricular contractility is usually the predominant factor affecting ventricular end-systolic volume, the effect of arterial blood pressure must also be considered. A substantial increase in arterial blood pressure impairs ventricular ejection because the left ventricular pressure during systole must exceed aortic pressure before ejection of blood from the ventricle can occur. Arterial pressure is called the cardiac afterload; this is the pressure against which the ventricle must pump in order to eject blood. The higher the afterload, the more difficult it is for the ventricle to eject blood. If arterial pressure is excessively high, ventricular ejection is impaired, end-systolic volume increases, and stroke volume decreases. This effect is minor for a normal heart and within the normal range of arterial pressure. However, high afterload can significantly limit stroke volume for a heart that is in failure.
Increasing the Heart Rate Does Not Increase Cardiac Output Substantially Unless Stroke Volume Is Maintained
Because cardiac output is equal to stroke volume multiplied by heart rate, cardiac output might be expected to be proportional to heart rate; that is, doubling the heart rate would be expected to double cardiac output (Figure 21-6, dashed line). However, if the heart rate is experimentally increased above its normal level with an electrical pacemaker, cardiac output increases somewhat, but not in proportion to the increase in heart rate. The reason, as mentioned earlier, is that diastolic filling time is reduced at high heart rates. The resulting reduction in end-diastolic volume reduces stroke volume, so cardiac output does not increase in proportion to heart rate (Figure 21-6, lower solid line). In fact, at heart rates greater than about 160 beats/min, stroke volume decreases so much that cardiac output actually declines with further increases in heart rate. This problem was encountered when early versions of artificial cardiac pacemakers malfunctioned in ways that caused high ventricular rates. Decreases in stroke volume at high heart rates are also encountered in certain cardiac arrhythmias. In paroxysmal atrial tachycardia, for example, a rapid heart rate is originated by an ectopic atrial pacemaker. The tachycardia occurs typically in bursts or paroxysms. The high heart rate limits diastolic filling so much that cardiac output falls below normal. This causes the blood pressure to fall so low that the patient becomes lethargic and may even faint.
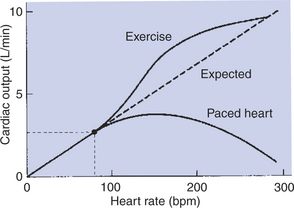
FIGURE 21-6 Dashed line shows the expected increase in cardiac output in proportion to increases in heart rate (assuming stroke volume remains constant). However, if the heart is paced to higher and higher rates, the observed increase in cardiac output is less than expected because stroke volume decreases (lower solid line). In contrast, when a dog increases its own heart rate through sympathetic activation (e.g., during exercise), cardiac output increases even more than expected because stroke volume increases (upper solid line).
Although cardiac pacing does not cause a large increase in cardiac output, increases in heart rate in the course of normal daily activities are accompanied by substantial increases in cardiac output. An example is the increase in cardiac output that normally accompanies exercise. As shown in Figure 21-6 (upper solid line), the actual increase in cardiac output during progressively more intense exercise is even greater than would be expected on the basis of the associated increase in heart rate. The reason that cardiac output increases so much during exercise is that stroke volume also increases. During exercise, increases in heart rate are brought about by increases in sympathetic activity. This sympathetic activation also increases cardiac contractility, so the ventricles empty more completely with each beat. In addition, sympathetic activation shortens the duration of systole, which helps to preserve diastolic filling time. In summary, under sympathetic action, the heart not only contracts more frequently (increased rate) and more forcefully (increased contractility), but also contracts and relaxes more quickly.
Figure 21-7 illustrates how the shortening of systole helps to preserve diastolic filling time. When heart rate is 60 beats/min, each beat takes 1 second. This 1 second must include one systole and one diastole. Typically, systole lasts about ⅓ second, which leaves about ⅔ second (plenty of time) for diastolic filling. If heart rate is increased to 120 beats/min, each beat lasts only about ½ second. If systole remains at about ⅓ second, there is only about ⅙ second left for diastolic filling (not enough time). However, if the increase in heart rate occurs because of an increase in sympathetic activity, systole becomes shorter, which restores part of the lost diastolic filling time. Diastole is shorter under these conditions than at rest, but it is longer than it would have been if systole were not shortened. Thus, sympathetic activation is said to help preserve the diastolic filling time. Overall, sympathetic activation (especially when coupled with a decrease in parasympathetic activity) can dramatically increase cardiac output (Table 21-1).
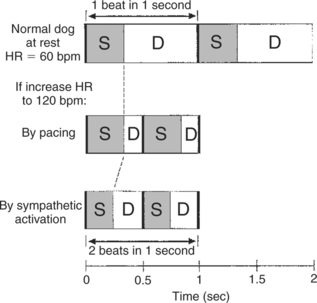
FIGURE 21-7 How shortening of systole (by sympathetic activation) helps to preserve diastolic filling time. Top, In a resting dog with a heart rate (HR) of 60 beats per minute (bpm), systole (S) takes about one-third second, leaving two thirds of each beat for diastole (D) and filling. Middle, If HR is increased to 120 bpm by an artificial pacemaker, the duration of systole is unchanged, so diastolic duration (filling time) is greatly reduced. Bottom, If the same increase in heart rate is brought about by sympathetic activation, systole becomes shorter, which restores part of the lost diastolic filling time.
Table 21-1 Typical Cardiac Changes During Vigorous Exercise in a Large Dog
| Measurement | Rest | Exercise |
|---|---|---|
| Ventricular end-diastolic volume (mL) | 60 | 55 |
| Ventricular end-systolic volume (mL) | 30 | 15 |
| Stroke volume (mL) | 30 | 40 |
| Ejection fraction (%) | 50 | 73 |
| Heart rate (beats/min) | 80 | 240 |
| Cardiac output (L/min) | 2.4 | 9.6 |
It is useful at this point to review the control of cardiac output, as summarized in Figure 21-2. Cardiac output is determined by stroke volume and heart rate. Stroke volume is determined by end-diastolic volume and end-systolic volume. End-diastolic volume depends on preload, ventricular compliance, and diastolic filling time. End-systolic volume depends on contractility and, to a lesser extent, on arterial pressure or afterload (not shown in Figure 21-2). Sympathetic activation increases contractility. Heart failure decreases contractility, as do several drugs often used in veterinary practice. Increased heart rate acts directly to increase cardiac output, but it also decreases diastolic filling time, which compromises the increased cardiac output. Heart rate is increased by sympathetic activation and parasympathetic withdrawal. Sympathetic activation also shortens systolic duration, which helps to preserve diastolic filling time.
Murmurs Are Abnormal Heart Sounds Caused by Turbulent Flow Through Cardiac Defects
Cardiac murmurs are abnormal heart sounds, and they often indicate the presence of cardiac abnormalities. Some murmurs are abnormalities in the first or second heart sound; others are additional (“extra”) heart sounds. Murmurs are caused by turbulent flow through cardiac defects. The underlying physical principle is that laminar or smooth flow of blood through the heart or blood vessels is quiet, whereas turbulent flow is noisy. An analogy is that a river does not make any sound as it flows smoothly through a broad, relatively flat channel. If the same river enters a channel that is restricted or drops steeply, a rapid or cataract forms. The flow becomes turbulent, and the turbulent flow makes noise.
The flow of blood through the heart and blood vessels is normally smooth, and therefore quiet, during all parts of the cardiac cycle, except two. The first moment of turbulent flow occurs at the beginning of ventricular contraction, on closure of the AV valves. The second moment of turbulent flow normally occurs at the end of ventricular systole, when the aortic and pulmonic valves close. The momentary turbulence and vibration associated with valve closure create the first and second heart sounds. Figure 21-1 indicates that the first heart sound is associated with the closure of the AV valves at the beginning of ventricular systole. The second heart sound is associated with the closure of the aortic and pulmonic valves at the end of ventricular systole. On occasion, normal third and fourth heart sounds are faintly audible with the stethoscope. In comparison, clinically important murmurs are louder. Sometimes, murmurs are even louder than the normal first and second heart sounds.
Table 21-2 lists cardiac valve defects that cause additional instances of turbulent flow and therefore murmurs. The table also indicates the timing of the murmurs in relation to the cardiac cycle. Systolic murmurs occur during ventricular systole; diastolic murmurs occur during ventricular diastole. Continuous murmurs occur during both systole and diastole. The timing of each murmur is easy to remember if two basic principles are kept in mind: murmurs are caused by turbulent blood flow, and blood flows in response to pressure differences. In other words, turbulent (noisy) flow through a cardiac defect occurs only if there is a substantial pressure difference from one side of the defect to the other.
Table 21-2 Cardiac Valve Defects and Resulting Murmurs
| Nature of defect | ||
|---|---|---|
| Site of defect | Incompetence or insufficiency (allows regurgitation) | Stenosis (narrow valve opening, creates restriction) |
| Atrioventricular valves | Systolic murmur | Diastolic murmur |
| Aortic or pulmonic valves | Diastolic murmur | Systolic murmur |
Figure 21-8 indicates how these principles can be used to account for systolic murmurs. The numbers in the figure indicate the maximal pressures that normally exist in each cardiac chamber during ventricular systole. Note, for example, that the pressure in the left ventricle is normally much higher than the pressure in the left atrium during ventricular systole. The mitral valve is normally closed during ventricular systole, so no blood flows backward from the ventricle to the left atrium. If the mitral valve fails to close completely during ventricular systole, however, the large pressure difference between the left ventricle and the left atrium causes a rapid, backward flow of blood through the partially closed valve. This turbulent backflow creates a systolic murmur. A mitral valve that fails to close completely is said to be insufficient or incompetent. The backflow across the valve is called regurgitation. Mitral regurgitation is present in about 8% of dogs over 5 years of age.
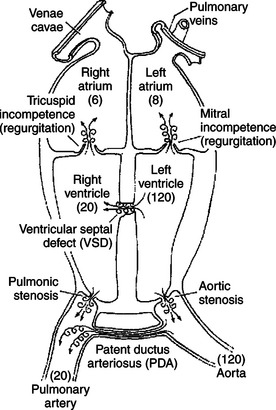
FIGURE 21-8 Schematic view of the heart showing cardiac defects that cause systolic murmurs. The numbers in parentheses indicate normal maximal pressures (mm Hg) during ventricular systole. The swirled arrows indicate the sites of turbulent (noisy) flow.
A ventricular septal defect (VSD) is a hole or cleft in the interventricular septum. Blood flows through a VSD from the left ventricle to the right ventricle during ventricular systole because systolic pressure is much higher in the left ventricle than in the right ventricle. Typically, the flow of blood through a VSD is turbulent, and a systolic murmur is created.
Systolic turbulence is also created if the aortic valve does not open widely enough. Blood ejected from the ventricle accelerates to a high velocity as it squeezes through the restricted aortic opening, and turbulence occurs. A valve that fails to open widely enough is called stenotic; the defect of aortic stenosis produces a systolic murmur. Likewise, pulmonic stenosis causes a systolic murmur. Aortic and pulmonic stenosis are common congenital defects in dogs.
A patent ductus arteriosus (PDA) is persistence after birth of the opening between the aorta and the pulmonary artery (see Chapter 51). A PDA produces a murmur during systole because the pressure in the aorta is much higher than the pressure in the pulmonary artery. Blood flows from the aorta into the pulmonary artery, and turbulence occurs. The murmur of a PDA is not restricted to systole, however, because the aortic pressure remains higher than the pulmonary artery pressure throughout diastole. Therefore the murmur of PDA is heard in both systole and diastole and is thus a continuous murmur. It is also called a machinery murmur because it characteristically sounds like the rumble of machinery. PDA is common in dogs, especially females.
The site on the thorax from which a particular murmur can be heard (auscultated) best is often indicative of the particular location and type of defect that causes the murmur. For example, the murmur of PDA is characteristically heard best over the left heart base. Occasionally, the turbulence caused by a cardiac defect will be so extreme as to cause a palpable thoracic vibration (thrill).
Animals sometimes have open pathways for blood flow between peripheral arteries and peripheral veins. These openings are called arteriovenous fistulae. Arteriovenous fistulae carry flow (and create turbulence) during both systole and diastole and therefore create continuous murmurs. The murmur of an arteriovenous fistula is most audible at the body surface close to the point of the fistula.
The numerical values in Figure 21-9 correspond to the minimal pressures that normally exist in the various cardiac chambers during ventricular diastole. These pressures form the basis for understanding why certain cardiac defects typically produce diastolic murmurs. For example, a normal mitral valve opens widely during ventricular diastole, which creates a low-resistance pathway for blood to flow from the left atrium into the left ventricle. However, if the mitral valve fails to open widely (mitral stenosis), ventricular filling must occur through a stenotic (narrow) valve. This creates turbulent flow and a diastolic murmur. Mitral stenosis is a common murmur among humans who have developed calcification of the mitral valve as a result of rheumatic heart disease.
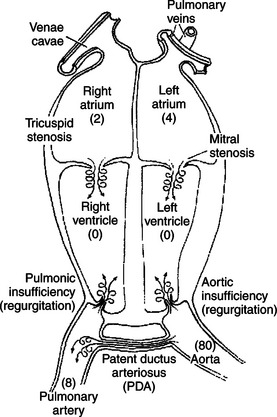
FIGURE 21-9 Cardiac defects that cause diastolic murmurs. The numbers in parentheses indicate normal minimal pressures (mm Hg) during ventricular diastole. The swirled arrows indicate the sites of turbulent (noisy) flow.
During diastole the normal aortic valve is closed, and no blood flows backward from the aorta into the left ventricle. If the aortic valve does not close tightly, blood flows backward (regurgitates) from the aorta to the left ventricle during diastole. Therefore, aortic regurgitation produces a diastolic murmur. The defect is called aortic incompetence or aortic insufficiency. Aortic regurgitation is common in horses but not in dogs.
Diastolic murmurs can also be produced by defects on the right side of the heart. Pulmonic regurgitation produces a diastolic murmur, but it is relatively rare. Tricuspid stenosis is uncommon, at least as a congenital defect. However, a heavy infestation of heartworms in the right side of the heart can create a stenosis at the tricuspid valve and a diastolic murmur.
Cardiac murmurs themselves are not harmful. They are clinically important, however, because the defects that cause the murmurs also cause pathological changes. Cardiac defects typically lead to one or more of these pathological consequences: (1) abnormally high or low blood flow to a region of the body, (2) abnormally high or low blood pressure in a region of the body, and (3) cardiac hypertrophy (enlargement of cardiac muscle).
It is not difficult to understand why cardiac defects lead to abnormal blood flows or abnormal blood pressures. For example, in the presence of a ventricular septal defect, the right ventricle receives blood from both the right atrium and the left ventricle, which leads to an abnormally high blood flow through the pulmonary circulation. In the presence of aortic stenosis, the left ventricle must generate an abnormally high systolic pressure to eject blood through the narrow valve opening. In the presence of mitral stenosis, blood dams up (and excessive pressure builds up) in the left atrium and pulmonary veins. It is more difficult to understand why some cardiac defects lead to cardiac hypertrophy. The underlying principle is that some cardiac defects increase the workload of one or both ventricles, and an increase in the workload of cardiac muscle leads to hypertrophy. Developing this concept more fully requires an understanding of cardiac energetics, as described next.
Some Cardiac Defects Increase the Heart’s Workload, Which Causes Cardiac Hypertrophy
Cardiac defects often compromise the heart’s ability to supply the systemic organs with the blood flow they need to support their metabolism. Compensating for such a pump failure frequently requires one or both ventricles to pump more blood than normal or to pump blood at a higher pressure than normal. These adaptations increase the workload of the heart. A persistent increase in cardiac workload leads, over several weeks, to cardiac hypertrophy. A ventricle that must pump more blood volume than normal will develop some hypertrophy, whereas a ventricle that must pump blood at a higher pressure than normal develops a huge hypertrophy. This observation is the basis for the clinical aphorism, “Pressure work is harder for the heart [i.e., causes more hypertrophy] than volume work.” To understand the physiological reason of this difference, we must delve into cardiac muscle energetics. To get started, it is useful to consider the analogous case of skeletal muscle hypertrophy in response to increased workload (physical conditioning).
A skeletal muscle does work by exerting a force while shortening. The useful mechanical work (external work) done by a skeletal muscle is equal to the force developed by the contracting muscle, multiplied by the distance moved during one contraction, multiplied by the number of contractions. Therefore the external work done by a skeletal muscle can be increased by increasing the forcefulness of contraction, the distance moved, or the number of contractions. In weightlifting conditioning the emphasis is on performing a few very forceful contractions of skeletal muscle. In contrast, conditioning that involves repetitive, low-force contractions of skeletal muscle (e.g., running, swimming) emphasizes primarily the distance and duration components of skeletal muscle work. Both “weight work” and “distance work” lead to skeletal muscle hypertrophy. However, a common observation is that weight work causes substantially more hypertrophy than does distance work.
The heart does work by pumping blood. The useful mechanical work (external work) done by any pump is equal to the pressure generated by the pump, multiplied by the volume of fluid that is pumped in one pump stroke, multiplied by the number of pump strokes. Therefore the external work done by the left ventricle in 1 minute is equal to the pressure generated, multiplied by the stroke volume, multiplied by the heart rate. The pressure generated by the left ventricle can be approximated by the average (mean) pressure in the aorta, as follows:

The external work done by the ventricle in one cardiac cycle is called the stroke work, as follows:

(The work of the right ventricle can be calculated in a similar way, but using mean pulmonary artery pressure.)
In accordance with the analogy to skeletal muscle conditioning, the average aortic pressure is analogous to the force developed by the contracting skeletal muscle; the stroke volume is analogous to the distance moved during one contraction; and the heart rate is analogous to the number of contractions. Obviously, the external work done by the left ventricle could be increased by increasing the pressure that the left ventricle generates, by increasing the stroke volume, or by increasing the heart rate. For example, a 50% increase in ventricular work can result from a 50% increase in the left ventricular pressure, a 50% increase in the left ventricular stroke volume, or a 50% increase in the heart rate. Any of these changes results, over a period of weeks, in left ventricular hypertrophy. However, an increase in the ventricular pressure causes a much more pronounced hypertrophy than does an increase in the stroke volume or heart rate. The basis for this difference is that increasing the pressure involves the generation of much more internal work (wasted work), which appears as heat. This large expenditure of energy on internal work greatly increases the total work (external work plus internal work) being done by cardiac muscle. It is the total work of the cardiac muscle, not just the external work, that is the primary stimulus for hypertrophy.
Under normal conditions, about 85% of the metabolic energy consumed by the heart appears as heat, and only 15% appears as external work. A physicist would say that the heart has a “thermodynamic efficiency” of about 15%. However, the “cardiac efficiency” depends on the type of work being done by the ventricles. The heart becomes less efficient when the external work is increased by increasing the pressure. Conversely, the heart becomes more efficient when the external work is increased by an increase in the volume of blood pumped.
The dominant role of pressure in determining total ventricular energy consumption is evident from a comparison of the work done by the left and right ventricles. The stroke volume and heart rate are equivalent for the left and right ventricles, but the pressure generated is about five times higher in the left ventricle than in the right (mean aortic pressure is about five times higher than mean pulmonary artery pressure). Therefore the external work done by the left ventricle is approximately five times greater than the external work done by the right ventricle. However, the total metabolic energy consumption of the left ventricle is much more than five times greater than the energy consumption of the right ventricle, because the extra external work performed by the left ventricle is in the form of greater pressure. As a result, almost all the energy consumed by the heart is consumed by the left ventricle. Therefore, almost all the coronary blood flow is delivered to the left ventricular muscle, and almost all the oxygen consumed by the heart is consumed by the left ventricle. Because of the high amount of pressure work done by the left ventricle compared with the right ventricle, the left ventricle develops much heavier and thicker muscle walls than the right ventricle.
A clinical observation from human medicine provides a further illustration of how an increase in the ventricular pressure work leads to ventricular hypertrophy. About 20% of adult humans have hypertension. In most of these patients, cardiac output is normal. Their arterial blood pressure is elevated because of an increased resistance to blood flow in the systemic arterioles. An elevated left ventricular pressure is required to force the cardiac output through these constricted systemic arterioles. The increased pressure work done by the left ventricle in hypertensive patients results in a striking left ventricular hypertrophy.
Up to a point, ventricular hypertrophy is an appropriate and beneficial adaptation to an increased workload imposed on the ventricular muscle. However, excessive hypertrophy is deleterious for three reasons. First, enlargement of the ventricular muscle restricts the opening of the aortic or pulmonic valve. A vicious cycle develops. Ventricular hypertrophy leads to aortic or pulmonic stenosis, which necessitates that the ventricle generate an even greater systolic pressure to eject blood, which leads to more ventricular hypertrophy, and so on. A second complication of excessive hypertrophy is that the coronary circulation may be unable to provide enough blood flow to meet the increased metabolic demand of the massive ventricular muscle, particularly during exercise. Inadequate coronary blood flow is especially likely if the coronary vessels have become constricted because of coronary artery disease (atherosclerosis). As a result, patients with ventricular hypertrophy and coronary artery disease are at high risk for cardiac ischemia, myocardial infarction, ventricular arrhythmias, and sudden death during periods of exercise. This explains why the all-too-common combination of hypertension and coronary artery disease is such a serious problem in human medicine. Fortunately, coronary artery disease is rare in most animals. The third complication of cardiac hypertrophy is that the cellular growth factors that mediate the hypertrophy also predispose the cardiac muscle to apoptosis.
The Pathological Consequences of Cardiac Defects Are Direct Results of the Abnormal Pressures, Volumes, and Workloads Created in the Cardiac Chambers
Figure 21-10 summarizes the pathological consequences associated with some common cardiac defects. First, consider mitral regurgitation. With each contraction of the left ventricle, a normal volume of blood is ejected into the aorta, and an additional volume of blood is ejected backward (through the regurgitant valve) into the left atrium. As a result, there is an increase in the volume work performed by the left ventricle. Therefore, mild to moderate left ventricular hypertrophy develops. Also, in a heart with mitral regurgitation, the left atrium becomes distended, and left atrial pressure increases, as does pulmonary venous pressure. Elevated pressure in the pulmonary blood vessels forces water and electrolytes out of the bloodstream and into the pulmonary interstitial spaces, causing pulmonary edema. When left atrial pressures exceed about 20 mm Hg, pulmonary edema becomes so severe that the lungs’ ability to transfer oxygen into the bloodstream is substantially reduced. The result is respiratory distress.
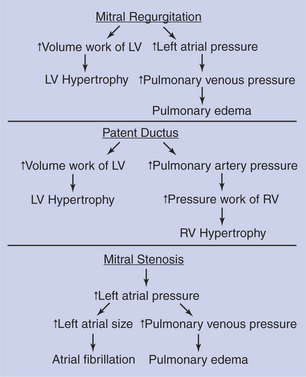
FIGURE 21-10 Pathological consequences of several common cardiac defects. LV, Left ventricle; RV, right ventricle.
The consequences of mitral regurgitation are usually more noticeable during exercise than during rest. One reason is that despite the regurgitation, the left ventricle can usually adapt enough through hypertrophy and an increase in heart rate to maintain a normal cardiac output into the aorta (and therefore into the systemic circulation) at rest. Also, despite some pulmonary edema, the oxygenation of the blood is sufficient to meet the animal’s needs during rest. During exercise, however, the output of the left ventricle into the systemic circulation must increase several-fold to supply adequate blood to exercising skeletal muscle. Also, the delivery of oxygen into the blood must increase several-fold. Despite the hypertrophy, the left ventricle may not be able to deliver adequate blood flow to the systemic circulation during exercise if mitral regurgitation is serious. Also, pulmonary edema may prevent delivery of enough oxygen into the blood to support the metabolism of the exercising animal.
Consider next the abnormalities associated with aortic stenosis (not shown in Figure 21-10). To eject a normal volume of blood with each beat through a stenotic aortic valve, the left ventricle must develop an abnormally high systolic pressure. This increases the pressure work of the left ventricle, which leads to a marked left ventricular hypertrophy. The hypertrophy has the desirable effect of increasing the contractility of the left ventricular muscle so that it can generate the increased pressure required to maintain normal cardiac output. As hypertrophy progresses, however, the ventricular muscle begins to impinge on the aortic outflow pathway, which further hampers the ability of the ventricle to eject blood. In a sense, the hypertrophic ventricular muscle “gets in its own way” or becomes muscle bound. The resulting limitation in aortic outflow is much more likely to be a problem during exercise than at rest. A patient with aortic stenosis may be able to function normally at rest but characteristically exhibits exercise intolerance.
Patent ductus arteriosus (PDA) is a defect that typically results in both left and right ventricular hypertrophy (Figure 21-10). In a typical patient with a PDA, the left ventricle pumps a near-normal volume of blood per minute to the systemic circulation and also pumps two to three times that volume of blood per minute through the PDA. As a result, the volume work done by the left ventricle greatly exceeds normal amounts, which leads to left ventricular hypertrophy. The blood flowing through the PDA enters the pulmonary artery, and thus pulmonary arterial pressure exceeds normal levels. This in turn increases the pressure work that must be done by the right ventricle. The right ventricle receives a near-normal volume of blood back from the systemic circulation each minute, and the right ventricle must generate an elevated systolic pressure to eject this blood into the high-pressure pulmonary artery. The increased pressure work for the right ventricle is a powerful stimulus for hypertrophy, and pronounced right ventricular hypertrophy develops.
As a patient with PDA grows, exercise intolerance becomes evident. Despite hypertrophy, the left ventricle cannot supply the increased blood flow needed by growing, exercising skeletal muscles, in addition to the blood that flows through the PDA. In patients with PDA the pulmonary artery and the pulmonary blood vessels must carry not only the blood that is pumped by the right ventricle (as in a normal animal), but also the blood that is pumped through the PDA. In a severe case, pulmonary blood flow can be more than four times greater than normal. The resulting increases in pulmonary vascular pressure can lead to pulmonary edema. Surgical repair of a PDA in a young animal leads to a rapid reversal of all these pathological changes.
An understanding of the preceding examples should make it easy to predict the pathological consequences of a ventricular septal defect. These consequences include increased volume work of the left ventricle, moderate left ventricular hypertrophy, increased volume and pressure work of the right ventricle, pronounced right ventricular hypertrophy, increased blood flow through the lungs, possible pulmonary edema, and probable exercise intolerance. It should also be clear why pulmonic stenosis leads to increased pressure work for the right ventricle and pronounced right ventricular hypertrophy (see Clinical Correlations).
Figure 21-10 also summarizes the pathological consequences associated with the diastolic murmur of mitral stenosis. The left atrial pressure must exceed normal levels to force a normal volume of blood through the stenotic mitral valve and into the left ventricle during each ventricular diastole. The elevated left atrial pressure distends the left atrium. There may be some hypertrophy of the atrial muscle. The atrium continues to function, however, mainly as a reservoir to collect and hold blood during ventricular systole, rather than as a pumping chamber to force blood into the ventricle during its diastole. One problem is that atrial action potentials tend to become discoordinated in a distended atrium, and atrial fibrillation is a common consequence. Also, the increase in the left atrial pressure causes blood to back up and accumulate in the pulmonary blood vessels, so pulmonary edema is likely. It might seem that the backup of blood in the pulmonary vessels would eventually also increase the pressure in the pulmonary artery and thereby increase the pressure work of the right ventricle. In other words, mitral stenosis might be predicted to lead to right ventricular hypertrophy. This prediction is logical, but in practice, animals with greatly elevated left atrial pressures usually die from the effects of pulmonary edema before right ventricular pressures have had a chance to become high enough to induce right ventricular hypertrophy. Therefore, mitral stenosis does not generally lead to hypertrophy of either ventricle.
The defect of aortic regurgitation leads to left ventricular hypertrophy. With each systole, the left ventricle must eject an abnormally large volume of blood into the aorta. Of this, a normal volume of blood goes on into the systemic circuit; the rest is simply regurgitated back from the aorta into the left ventricle during diastole. Thus the volume work of the left ventricle is increased to above-normal levels, and left ventricular pressures may rise as well. Both these factors stimulate left ventricular hypertrophy. In severe cases of aortic regurgitation, diastolic ventricular pressure becomes elevated (because during diastole the left ventricle receives blood from both the left atrium and the aorta). This leads to increases in left atrial pressure, and pulmonary edema may develop.
Consideration of the abnormalities associated with cardiac defects is important for two reasons. First, these defects and their consequences are often encountered in veterinary medicine. Second, this discussion illustrates how the clinical signs and consequences of disease states can be understood and predicted in a rational way, on the basis of an understanding of basic principles of cardiac physiology.
CLINICAL CORRELATIONS
Pulmonic Stenosis
History.
A 6-month-old female schnauzer is referred to your clinic because of a heart murmur that was detected during a routine health care visit. The puppy is fairly active but is slightly smaller than her female littermates. She also tires more quickly than her littermates when they play together.
Clinical Examination.
All physical parameters are normal except for a systolic heart murmur that can be heard best over the left third to fourth intercostal space. Femoral pulses are normal, and the jugular veins are not distended. Electrocardiography reveals that the dog is in normal sinus rhythm with a heart rate of 118 beats/min. The PR interval is normal. However, the major QRS deflection is negative in leads I and aVF. Also, deep S waves are noted in leads II and III, and the QRS complexes are slightly prolonged as a result of the wide S waves. Thoracic radiographs show right ventricular enlargement; the right border of the cardiac silhouette is more rounded, and closer to the right thoracic wall, than normal.
A catheter is inserted into the jugular vein, and the following pressures are measured as the catheter is advanced through the right side of the heart and into the pulmonary artery: central venous pressure (mean right atrial pressure), 8 mm Hg (normal, 3 mm Hg); right ventricular systolic pressure, 122 mm Hg (normal, 20 mm Hg); and pulmonary artery systolic pressure, 16 mm Hg (normal, 20 mm Hg).
The jugular catheter is withdrawn until the catheter tip is in the right ventricle. Additional radiographs are then taken while a radiopaque dye is injected through the catheter. These radiographs reveal that the right ventricular outflow tract is narrowed just below the pulmonic valve and that the pulmonic valve does not open widely during ventricular systole.
Comment.
The young age of this dog and the absence of other signs of illness suggest that the murmur results from a congenital cardiac abnormality. Murmurs are graded on a scale of I through VI, with VI being the most severe. This dog’s murmur is graded IV. A systolic murmur can result from aortic or pulmonic stenosis, mitral or tricuspid regurgitation, or a ventricular septal defect (see Figure 21-8). On the basis of the location from which this murmur can be heard best, aortic or pulmonic stenosis is the most likely cause. All the additional clinical evidence supports a diagnosis of pulmonic stenosis.
The electrocardiogram indicates that the sinoatrial node is acting as the pacemaker and that the AV node is conducting each atrial action potential into the ventricles. However, the abnormalities observed in the polarity and shape of the QRS complex are indicative of right ventricular hypertrophy, and the radiographs corroborate this finding. Pulmonic stenosis leads to right ventricular hypertrophy, because the right ventricle must generate much higher pressures than normal during systole in order to eject blood through the narrow outflow tract.
Normally, the pulmonic valve opens widely during systole, and the ventricular systolic pressure closely matches the pulmonary artery systolic pressure. In this dog, there is a difference of 106 mm Hg between right ventricular systolic pressure and the systolic pressure in the pulmonary artery just beyond the pulmonic valve. This difference indicates a severe pulmonic obstruction. The degree of obstruction can be visualized on the radiographs taken during dye injection.
Right ventricular hypertrophy is one of two adaptive responses that help this dog maintain a near-normal right ventricular stroke volume, despite the pulmonic stenosis. The other adaptive response is that the mean right atrial pressure is higher than normal (8 vs. 3 mm Hg). The right atrial pressure is elevated because blood backs up or accumulates in areas upstream from the stenosis (i.e., in the right ventricle, right atrium, and systemic veins). The elevated atrial pressure is adaptive because it increases the right ventricular preload, which increases the end-diastolic volume, which (according to Starling’s law of the heart) helps keep the right ventricular stroke volume at a normal level, despite the stenosis. The right atrial pressure is not quite high enough in this dog to cause systemic edema or abdominal ascites (see Chapter 23). However, both these signs are sometimes seen in dogs with severe pulmonic stenosis because excessively elevated right atrial pressure leads to marked increases in capillary hydrostatic pressure (upstream from the right atrium).
The combined effects of right ventricular hypertrophy and elevated right ventricular preload allow this dog’s heart to pump a near-normal stroke volume during rest. However, the pulmonic obstruction limits the increase in the stroke volume that can occur during exercise. The resulting limitation in cardiac output accounts for this dog’s lack of stamina during exercise. Over a prolonged period, such a limitation in cardiac output can also stunt growth.
Treatment.
Theoretically, the best treatment for pulmonic stenosis is to remove the obstruction surgically. A valve dilator can be used, or an artificial conduit can be installed across the stenotic valve. Although seriously affected dogs require such interventional treatment, dogs with mild to moderate pulmonic stenosis can lead sedentary lives without any treatment.
Some evidence indicates that the adverse effects of pulmonic stenosis can be minimized by the administration of β-adrenergic antagonists (e.g., propranolol) or calcium channel blockers (e.g., verapamil). Although the mechanism and efficacy of these drugs remain unclear, there is speculation that these drugs are beneficial because they limit ventricular contractility, which limits the work of the heart. Because an increase in cardiac work is the stimulus for hypertrophy, a drug that limits the increase in work also limits the hypertrophy. Although moderate hypertrophy can be adaptive (as explained earlier), excessive hypertrophy is detrimental for two reasons. First, the enlarged ventricular muscle can crowd the pulmonic outflow tract, worsening the stenosis. Second, the coronary circulation may be unable to deliver the increased amounts of blood flow required by the massive ventricular muscle.
Older Horse with Exercise Intolerance
History.
A 22-year-old Thoroughbred mare is presented for exercise intolerance. The owner uses her for trail riding and some low-level eventing. The mare has had some mild arthritis during her career, but in the last 2 to 3 months she seems reluctant to work, takes longer to recover after rides, and seems lethargic. Vaccinations and deworming are current.
Clinical Examination.
The mare appears to be slightly underweight. She is responsive but quiet (more quiet than normal, according to the owner). Her temperature is normal; pulse and respiration are slightly increased. Her mucous membranes are darker pink than normal (suggesting reduced blood flow), but capillary refill time is not abnormally long. She has a grade IV systolic murmur on the left side, most consistent with mitral regurgitation. Her lungs are normal on auscultation. No other abnormal findings are noted on physical examination. The mare is lunged for several minutes and reauscultated. No additional abnormalities are detected, except the mare’s heart rate and respiratory rate seem to take longer than normal to return to their resting levels. A blood sample is taken for analysis.
Comment.
Results of the complete blood count (CBC) and serum chemistry are within normal limits. Echocardiography reveals mitral regurgitation associated with fibrotic thickening of the mitral valve. The chordae tendinae are intact. There is some dilation (eccentric hypertrophy) of the left ventricle, but not of the left atrium.
Mitral valve thickening and insufficiency often develop with age, and mitral regurgitation is likely limiting this mare’s left ventricular performance. The resulting tendency for inefficient pumping of blood into the systemic circulation can account for the decreased perfusion of the mucous membranes at rest and for the exercise intolerance and listlessness noticed by the owner. With each systolic contraction, the left ventricle is pumping blood both forward, into the aorta, and backward, through the leaky mitral valve and into the left atrium. The mild left ventricular hypertrophy and dilation are likely adaptive responses to this increased volume work. Animals with more severe mitral regurgitation also have left atrial dilation, associated with a much poorer prognosis than if there is no dilation or only left ventricular dilation.
Treatment.
No medical treatment is indicated at this time. However, the owner needs to decrease the work by the mare. The mare should have only light, nonstressful activity. A follow-up examination is recommended in 3 to 6 months to assess the rate of progression of the mitral valve disease. If marked progression is noted at that time, the mare should be retired.
Berne RM, Levy MN. Cardiovascular physiology, ed 8. St Louis: Mosby, 2001.
Boulpaep EL. The heart as a pump. In: Boron WF, Boulpaep EL. Medical physiology: a cellular and molecular approach. Philadelphia: Saunders, 2005.
Katz AM. Physiology of the heart, ed 4. Baltimore: Lippincott Williams & Wilkins, 2005.
Lilly LS. Pathophysiology of heart disease: a collaborative project of medical students and faculty, ed 4, Baltimore: Williams & Wilkins, 2006.
Marr C, ed. Cardiology of the horse. London: Saunders, 1999.
Opie LH. The heart: physiology, from cell to circulation, ed 4. Baltimore: Lippincott Williams & Wilkins, 2003.
Oyama MA, Sisson DD, Thomas WP, Bonagura JD. Congenital heart disease. Ettinger SJ, Feldman EC. Textbook of veterinary internal medicine: diseases of the dog and cat, ed 6, St Louis: Saunders, 2005.
Patteson MW. Acquired cardiac disease. In: Robinson NE, ed. Current therapy in equine medicine 4. Philadelphia: Saunders, 1997.
Physick-Sheard PW. Pathophysiology and principles of therapy. Colahan PT, Merritt AM, Moore JN, et al, eds. Equine medicine and surgery, ed 5, vol 1. St Louis: Mosby-Year Book, 1999.
Reece WO. Dukes’ physiology of domestic animals, ed 12. Ithaca, NY: Comstock Cornell University Press, 2004.
Reed SM, Bayly M, Sellon DC. Equine internal medicine. Philadelphia: Saunders, 2004.
Schmidt-Nielsen K. Animal physiology: adaptation and environment. Cambridge, UK: Cambridge University Press, 1997.
Smith FWK, Jr., Keene BW, Tilley LP. Rapid interpretation of heart and lung sounds: a guide to cardiac and respiratory auscultation in dogs and cats, ed 2. St Louis: Saunders, 2006.
PRACTICE QUESTIONS
1. In the normal cardiac cycle:
2. Figure 21-11 shows a plot of the changes in pressure and volume that occur in the left ventricle during one cardiac cycle. Which of the following is true?
3. Which statement is true for a normal heart?
4. Starting at the open circle in Figure 21-12, which point would be reached after the contractility decreased and the preload increased?
5. You examine a 7-year-old poodle and find evidence of a systolic murmur (no diastolic murmur), pulmonary edema (indicated by rapid, noisy respiration and cough), left ventricular hypertrophy (no right ventricular hypertrophy), and exercise intolerance. The most likely explanation for the symptoms is:
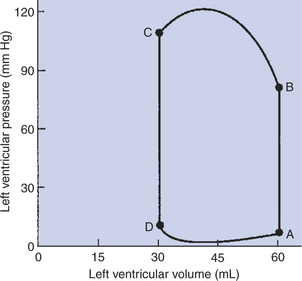
FIGURE 21-11 Closed loop depicts the changes in left ventricular pressure and volume that occur during one cardiac cycle. Practice Question 2 is based on this graph. The first step in understanding the figure is to determine whether the normal sequence of events proceeds clockwise or counterclockwise around the loop. To make this distinction, recall that the ventricles fill when ventricular pressure is low and they empty when ventricular pressure is high. Next, identify the phases of the cardiac cycle that correspond with each limb of the loop. Finally, determine what happens to the mitral and aortic valves at each corner of the loop. Hint: A, B, C, and D in this figure match the similarly labeled points in Figure 21-1 (graph of ventricular pressure).