Sampling
Many of us have preconceived notions about samples and sampling, which we acquired from television commercials, polls of public opinion, market researchers, and newspaper reports of research findings. The advertiser boasts that four of five doctors recommend its product; the newscaster announces that John Jones is predicted to win the senate election by a margin of 3 to 1; the newspaper reports that scientists’ studies have found that taking a statin drug, such as atorvastatin (Lipitor), significantly reduces the risk of coronary artery disease.
All of these examples use sampling techniques. Some of the outcomes, however, are more valid than others, partly because of the sampling techniques used. In most instances, television, newspapers, and advertisements do not explain their sampling techniques. You may hold opinions about the adequacy of these techniques, but there is not enough information to make a judgment.
The sampling component is an important part of the research process that needs to be carefully thought out and clearly described. To achieve these goals, you and other researchers must understand the techniques of sampling and the reasoning behind them. With this knowledge, you can make intelligent judgments about sampling when you are critically appraising studies or developing a sampling plan for your own study. This chapter examines sampling theory and concepts, sampling plans, probability and nonprobability sampling methods for quantitative research, nonprobability sampling methods for qualitative research, sample size, and settings for conducting studies. The chapter concludes with a discussion of the process for acquiring and retaining subjects for a sample in a variety of settings.
SAMPLING THEORY
Sampling involves selecting a group of people, events, behaviors, or other elements with which to conduct a study. A sampling plan defines the process of making the sample selections; sample denotes the selected group of people or elements included in a study. Sampling decisions have a major impact on the meaning and generalizability of the findings.
Sampling theory was developed to determine mathematically the most effective way to acquire a sample that would accurately reflect the population under study. The theoretical, mathematical rationale for decisions related to sampling emerged from survey research, although the techniques were first applied to experimental research by agricultural scientists. One of the most important surveys that stimulated improvements in sampling techniques was the United States census. Researchers have adopted the assumptions of sampling theory identified for the census surveys and incorporated them within the research process.
Key concepts of sampling theory are (1) populations, (2) elements, (3) sampling criteria, (4) representativeness, (5) sampling errors, (6) randomization, (7) sampling frames, and (8) sampling plans. The following sections explain these concepts; and later in the chapter, these concepts are used to explain a variety of sampling methods.
Populations and Elements
The population is a particular type of individual or element, such as people with type 2 diabetes, who are the focus of the research. The target population is the entire set of individuals or elements who meet the sampling criteria, such as women who are 18 years and older with a new diagnosis of type 2 diabetes. Figure 14-1 demonstrates the relationships among the population, target population, and accessible populations. An accessible population is the portion of the target population to which the researcher has reasonable access. The accessible population might be elements within a country, state, city, hospital, or nursing unit, such as the diabetics in primary care clinics in Fort Worth, Texas. The sample is obtained from the accessible population by a particular sampling method, such as simple random sampling. The individual units of the population and sample are called elements. An element can be a person, event, behavior, or any other single unit of study. When elements are persons, they are usually referred to as subjects in quantitative, outcomes, and interventions research and participants in qualitative research (see Figure 14-1). The findings from a study are generalized first to the accessible population and then, more abstractly, to the target population.
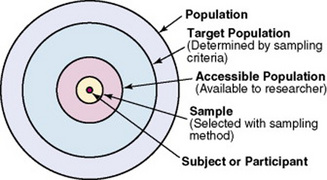
Generalizing means that the findings can be applied to more than just the sample under study. Because of the importance of generalizing, there are risks to defining the accessible population too narrowly. For example, a narrow definition of the accessible population reduces the ability to generalize from the study sample to the target population and, thus, diminishes the meaningfulness of the findings. Biases may be introduced that make generalization to the broader target population difficult to defend. If the accessible population is defined as individuals in a white, upper-middle-class setting, one cannot generalize to nonwhite or lower-income populations. These biases are similar to those that may be encountered in a nonrandom sample.
In some studies, the entire population is the target of the study. These studies are referred to as population studies (Barhyte, Redman, & Neill, 1990). Many of these studies use data available in large databases, such as the census data or other government-maintained databases. Epidemiologists often use entire populations for their large database studies. In other studies, the entire population of interest in the study is small and well defined. For example, one could conduct a study in which the defined population was all living recipients of heart and lung transplants.
In some cases, a hypothetical population is defined. A hypothetical population assumes the presence of a population that cannot be defined according to sampling theory rules, which require a list of all members of the population. For example, individuals who successfully lose weight would be a hypothetical population. The number of individuals in the population, who they are, how much weight they have lost, how long they have kept it off, or how they achieved the weight loss is unknown. Some populations are elusive and constantly changing. For example, listing all women in active labor in the United States, all people grieving the loss of a loved one, or all people coming into an emergency department would be impossible.
Sampling or Eligibility Criteria
Sampling criteria, also referred to as eligibility criteria, include a list of characteristics essential for membership or eligibility in the target population. The criteria are developed from the research problem, the purpose, a review of literature, the conceptual and operational definitions of the study variables, and the design. The sampling criteria determine the target population, and the sample is selected from the accessible population within the target population (see Figure 14-1). When the study is complete, the findings are generalized from the sample to the accessible population and then to the target population.
You might identify broad sampling criteria for a study, such as all adults over 18 years of age able to read and write English. These criteria ensure a large target population of heterogeneous or diverse potential subjects. A heterogeneous sample increases your ability to generalize the findings to a larger target population. In descriptive or correlational studies, the sampling criteria may be defined to ensure a heterogeneous population with a broad range of values for the variables being studied. The sampling criteria may be specific and designed to make the population as homogeneous or similar as possible or to control for extraneous variables. In quasi-experimental or experimental studies, the primary purpose of sampling criteria is to limit the effect of extraneous variables on the particular interaction between the independent and dependent variables. Subjects are selected to maximize the effects of the independent variable and minimize the effects of variation in other extraneous variables so they have a limited impact on the dependent variable scores.
Sampling criteria may include characteristics such as the ability to read, to write responses on the data collection instruments or forms, and to comprehend and communicate using the English language. Age limitations are often specified, such as adults 18 years and older. Subjects may be limited to those who are not participating in any other study. Persons who are able to participate fully in the procedure for obtaining informed consent are often selected as subjects. If potential subjects have diminished autonomy or are unable to give informed consent, consent must be obtained from their legal representative. Thus, persons who are legally or mentally incompetent, terminally ill, or confined to an institution are more difficult to access as subjects. However, sampling criteria should not become so restrictive that the researcher cannot find an adequate number of subjects.
A study might have inclusion or exclusion sampling criteria (or both). Inclusion sampling criteria are those characteristics that a subject or element must possess to be part of the target population. Exclusion sampling criteria are those characteristics that can cause a person or element to be excluded from the target population. For example, Andrews, Felton, Wewers, Waller, and Tingen (2007) clearly identified their inclusion and exclusion sampling criteria for their quasi-experimental study of the effect of a smoking cessation intervention on smoking abstinence in African American women residing in public housing.
Andrews et al.’s (2007) inclusion and exclusion sampling criteria precisely designated the attributes of the subjects who made up the target population. The researchers narrowly defined these sampling criteria, probably to promote the selection of a homogeneous sample of female African Americans with a documented smoking problem. Because this was a quasi-experiment study, the specific sampling criteria decreased the effects of extraneous variables so the effect of the smoking cessation intervention (independent variable) could be determined on the women’s smoking abstinence (dependent variable).
Researchers must provide logical reasons for their inclusion and exclusion sampling criteria. Larson (1994) suggested that some groups, such as women, ethnic minorities, the elderly, and the poor, are unnecessarily excluded from many studies. A review of approved research protocols in one tertiary care center (1989–1990) revealed that 75% of studies listed exclusion criteria, many of which were not justified by the researchers. The most common exclusions for which no justification was provided were age, socioeconomic status, and race. Exclusion criteria limit the generalization of the study findings and should be carefully considered before being used in a study. Andrews et al.’s (2007) study focused on a minority, adult, female population, and there was no exclusion based on age (age greater than 18 years). The exclusion criteria—mental illness, unstable angina, plans to move, and the precontemplation stage of quitting—seem appropriate for the study to decrease the effects of extraneous variables.
Representativeness
For a sample to be representative, it must be like the target population in as many ways as possible. It is especially important that the sample be representative in relation to the variables you are studying and to other factors that may influence the study variables. For example, if your study examines attitudes toward acquired immunodeficiency syndrome (AIDS), the sample should represent the distribution of attitudes toward AIDS that exists in the specified population. In addition, a sample must represent the demographic characteristics, such as age, gender, ethnicity, income, and education, which often influence study variables.
The accessible population must be representative of the target population. If the accessible population is limited to a particular setting or type of setting, the individuals seeking care at that setting may be different from those who would seek care for the same problem in other settings or from those who self-manage their problems. Studies conducted in private hospitals usually exclude the poor, and other settings could exclude the elderly or the undereducated. People who do not have access to care are usually excluded from health-focused studies. Subjects in research centers and the care they receive are different from patients and the care they receive in community clinics, public hospitals, veterans’ hospitals, and rural health clinics. Obese individuals who chose to enter a program to lose weight may differ from those who did not enter a program. All of these factors limit representativeness and, in turn, limit our understanding of the phenomena important in practice.
Representativeness is usually evaluated by comparing the numerical values of the sample (a statistic such as the mean) with the same values from the target population. A numerical value of a population is called a parameter. We can estimate the population parameter by identifying the values obtained in previous studies examining the same variables. The accuracy with which the population parameters have been estimated within a study is referred to as precision. Precision in estimating parameters requires well-developed methods of measurement that are used repeatedly among several studies. You can define parameters by conducting a series of descriptive and correlational studies, each of which examines a different segment of the target population. Then perform a meta-analysis to estimate the population parameter.
Sampling Error
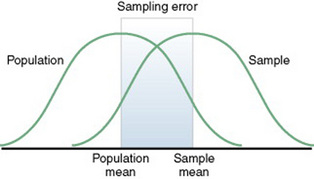
The difference between a sample statistic and a population parameter is called the sampling error (Figure 14-2). A large sampling error means that the sample is not providing a precise picture of the population; it is not representative. Sampling error is usually larger with small samples and decreases as the sample size increases. Sampling error reduces the power of a study, or the ability of the statistical analyses conducted to detect differences between groups or to describe the relationships between variables. Sampling error occurs as a result of random variation and systematic variation.
Random Variation
Random variation is the expected difference in values that occurs when one examines different subjects from the same sample. If the mean is used to describe the sample, the values of individuals in that sample will not all be exactly the same as the sample mean. Individual subjects’ values vary from the value of the sample mean. The difference is random because the value of each subject is likely to vary in a different direction. Some values are higher and others are lower than the sample mean. Thus, the values are randomly scattered around the mean. As the sample size becomes larger, overall variation in sample values decreases, with more values being close to the sample mean. As the sample size increases, the sample mean is also more likely to have a value similar to that of the population mean.
Systematic Variation
Systematic variation, or systematic bias, is a consequence of selecting subjects whose measurement values are different, or vary, in some specific way from the population. Because the subjects have something in common, their values tend to be similar to those of others in the sample but different in some way from those of the population as a whole. These values do not vary randomly around the population mean. Most of the variation from the mean is in the same direction; it is systematic. All the values in the sample may tend to be higher or lower than the population mean.
For example, if all the subjects in a study examining some type of health care knowledge have an intelligence quotient (IQ) higher than 120, many of their scores will likely be higher than the mean of a population that includes individuals with a wide variation in IQ, such as IQs that range from 90 to 130. The IQs of the subjects have introduced a systematic bias. This situation could occur, for example, if all the subjects were college students, which has been the case in the development of many measurement methods in psychology.
Because of systematic variance, the sample mean is different from the population mean. The extent of the difference is the sampling error. Exclusion criteria tend to increase the systematic bias in the sample and thus increase the sampling error. An extreme example of this problem is the highly restrictive sampling criteria used in some clinical trials that result in a large sampling error and greatly diminished representativeness.
If the method of selecting subjects produces a sample with a systematic bias, increasing the sample size will not decrease the sampling error. When a systematic bias occurs in an experimental study, it can lead the researcher to believe that a treatment has made a difference when, in actuality, the values would be different even without the treatment. This situation usually occurs because of an interaction of the systematic bias with the treatment.
Systematic variation or bias is most likely to occur when the sampling process is not random. However, even in a random sample, systematic variation can occur if potential subjects decline participation. Thus, systematic bias increases as the subjects’ refusal rate increases. A refusal rate is the number or percentage of subjects who declined to participate in the study. High refusal rates to participate in a study have been linked to individuals with serious physical and emotional illnesses, low socioeconomic status, and weak social networks (Neumark, Stommel, Given, & Given, 2001). The higher the refusal rate, the less the sample is representative of the target population. The refusal rate is calculated by dividing the number of potential subjects refusing to participate by the number of potential subjects meeting sampling criteria and multiplying the results by 100%. For example if 200 potential subjects met the sampling criteria and 40 refused to participate in the study, the refusal rate is 20%.
Sometimes researchers provide an acceptance rate, or the number or percentage of the subjects who agree to participate in a study, rather than a refusal rate. The acceptance rate is calculated by dividing the number of potential subjects who agree to participate in a study by the number of potential subjects who meet sampling criteria and multiplying the result by 100%. If you know the refusal rate, you can subtract the refusal rate from 100% to obtain the acceptance rate. In the example mentioned earlier, 200 potential subjects met the sampling criteria; 160 agreed to participate in the study and 40 refused.

Andrews et al. (2007) described the screening of their potential subjects, identified those who did not meet sample criteria, and indicated the acceptance rate for their study, introduced earlier in this chapter.
Andrews et al. (2007) had a 73% acceptance rate, which is somewhat low and could indicate a systematic bias in the subjects who chose to participate in this study. In addition, the researchers did not provide a rationale for the potential subjects’ refusal to participate (27% refusal rate), nor did they discuss if there were any differences between those who did participate and those who refused to participate. The 73% acceptance rate and the lack of rationale for subjects’ refusals are study limitations that could affect the sample’s representativeness of the target population. These sampling limitations decrease the researchers’ ability to generalize their findings (Peat, Mellis, Williams, & Xuan, 2002). The calculations for the acceptance and refusal rates for this study are presented here:
Systematic variation can also occur in studies with high sample mortality. Sample mortality or attrition is the withdrawal or loss of subjects from a study. Systematic variation is greatest when a high number of subjects withdraw from the study before the data have been collected or when a large number of subjects withdraw from one group but not the other in the study (Kerlinger & Lee, 2000). In studies involving a treatment, subjects in the control group who do not receive the treatment may be more likely to withdraw from the study. Sample mortality or attrition should be reported in the published study to determine if the final sample represents the target population. Sample attrition is calculated by dividing the number of subjects withdrawing from a study by the sample size and multiplying the results by 100%. The opposite of the attrition rate is the retention rate. For example, if a study had a sample size of 160 and 40 people withdrew from the study, the attrition rate would be 25%. In that same example, if 40 subjects withdrew from the study, then 120 subjects were retained. The calculations of the attrition and retention rates are presented here:
Andrews et al. (2007) described their study attrition as follows:
The calculations for the attrition and retention rates for the Andrews et al. (2007) study are presented here:
Andrews et al. (2007) had a strong retention rate of 87.4%, when you consider this was a 6-month long intervention study focused on smoking cessation. The attrition from the treatment group (6 subjects) was essentially the same as that for the comparison group (7 subjects), indicating the groups were comparable for retention. In addition, the researchers found no differences in the demographic variables (age, income, education levels, and employment status) between those who remained in the study and those lost to attrition. These are study strengths that increased the sample’s representativeness of the target population; however, indicating the reasons for the loss of the 13 subjects would have added to the quality of the study report.
Randomization
From a sampling theory point of view, randomization means that each individual in the population should have a greater than zero opportunity to be selected for the sample. The method of achieving this opportunity is referred to as random sampling. In experimental studies that use a control group, subjects are randomly selected and then randomly assigned to either the control group or the experimental group. The use of the term control group is limited to those studies using random sampling and random assignment to the treatment and control groups. If nonrandom sampling methods are used for sample selection, the group not receiving a treatment is referred to as a comparison group, because there is a greater possibility of preexisting differences between that group and the group receiving the treatment.
Random sampling increases the extent to which the sample is representative of the target population. However, random sampling must take place in an accessible population that is representative of the target population. Exclusion criteria limit true randomness. Thus, a study that uses random sampling techniques may have such restrictive sampling criteria that the sample is not truly random. In any case, it is rarely possible to obtain a purely random sample for nursing studies because of informed consent requirements. Even if the original sample is random, persons who volunteer or consent to participate in a study may differ in important ways from those who are not willing to participate. Methods of achieving random sampling are described later in the chapter.
Sampling Frames
For each person in the target or accessible population to have an opportunity to be selected for the sample, each person in the population must be identified. To accomplish this goal, the researcher must acquire a list of every member of the population through the use of the sampling criteria to define membership. This listing of members of the population is referred to as the sampling frame. The researcher then selects subjects from the sampling frame using a sampling plan. Rivers et al. (2003) studied predictors of nurses’ acceptance of an intravenous catheter safety device and described their sampling frame as follows: “The sampling frame consisted of full-time direct patient care registered nurses (N = 742), who had used the Protective® Plus IV [intravenous] catheter device to initiate intravenous procedures at this hospital. Temporary (contract), supplemental, and part-time nurses and licensed practical nurses were excluded” (p. 250).
Sampling Plans
A sampling plan describes the strategies that will be used to obtain a sample for a study. The plan is developed to enhance representativeness, reduce systematic bias, and decrease the sampling error (Brent, Scott, & Spencer, 1988; Peat et al., 2002). Thus, sampling strategies have been devised to accomplish these three tasks and to optimize sample selection. The sampling plan may use probability (random) sampling methods or nonprobability (nonrandom) sampling methods.
A sampling method is the process of selecting a group of people, events, behaviors, or other elements that represent the population being studied. A sampling method is similar to a design; it is not specific to a study. The sampling plan provides detail about the use of a sampling method in a specific study. The sampling plan must be described in detail for purposes of critique, replication, and future meta-analyses. The following sections describe different types of probability and nonprobability sampling methods.
PROBABILITY (RANDOM) SAMPLING METHODS
Probability sampling methods have been developed to ensure some degree of precision in estimations of the population parameters. Thus, probability samples reduce sampling error. The term probability sampling method refers to the fact that every member (element) of the population has a probability higher than zero of being selected for the sample. Inferential statistical analyses are based on the assumption that the sample from which data were derived has been obtained randomly. Thus, probability sampling methods are often referred to as random sampling methods. These samples are more likely to represent the population than are samples obtained with nonprobability sampling methods. All subsets of the population, which may differ from one another but contribute to the parameters of the population, have a chance to be represented in the sample. Probability sampling methods are most commonly used in quantitative and outcomes research.
There is less opportunity for systematic bias if subjects are selected randomly, although it is possible for a systematic bias to occur by chance. Using random sampling, the researcher cannot decide that person X will be a better subject for the study than person Y. In addition, a researcher cannot exclude a subset of people from selection as subjects because he or she does not agree with them, does not like them, or finds them hard to deal with. Potential subjects cannot be excluded because they are too sick, not sick enough, coping too well, or not coping adequately. The researcher, who has a vested interest in the study, could (consciously or unconsciously) select subjects whose conditions or behaviors are consistent with the study hypothesis. It is tempting to exclude uncooperative or assertive individuals. Random sampling leaves the selection to chance and, thus, increases the validity of the study.
Theoretically, to obtain a probability sample, the researcher must develop a sampling frame that includes every element in the population. The sample must be randomly selected from the sampling frame. Thus, according to sampling theory, it is not possible to select a sample randomly from a population that cannot be clearly defined. Four sampling designs have been developed to achieve probability sampling: simple random sampling, stratified random sampling, cluster sampling, and systematic sampling.
Simple Random Sampling
Simple random sampling is the most basic of the probability sampling methods. To achieve simple random sampling, elements are selected at random from the sampling frame. This goal can be accomplished in a variety of ways, limited only by the imagination of the researcher. If the sampling frame is small, the researcher can write names on slips of paper, place the names in a container, mix well, and then draw out one at a time until the desired sample size has been reached. Another technique is to assign a number to each name in the sampling frame. In large population sets, elements may already have assigned numbers. For example, numbers are assigned to medical records, organizational memberships, and licenses. The researcher can then select these numbers randomly to obtain a sample.
There can be some differences in the probability for the selection of each element, depending on whether the selected element’s name or number is replaced before the next name or number is selected. Selection with replacement, the most conservative random sampling approach, provides exactly equal opportunities for each element to be selected (Kerlinger & Lee, 2000). For example, if the researcher draws names out of a hat to obtain a sample, each name must be replaced before the next name is drawn to ensure equal opportunity for each subject.
Selection without replacement gives each element different levels of probability for selection. For example, if the researcher is selecting 10 subjects from a population of 50, the first name has a 1 in 5 chance, or a 0.2 probability, of being selected. If the first name is not replaced, the second name has a 9 in 49 chance, or a 0.18 probability, of being selected. As further names are drawn, the probability of being selected decreases.
There are many ways to achieve random selection, such as with the use of a computer, a random numbers table, or a roulette wheel. The most common method of random selection is the computer, which can be programmed to randomly select a sample from the sampling frame with replacement. However, some researchers still use a table of random numbers to select a random sample. Table 14-1 shows a section from a random numbers table. To use a table of random numbers, the researcher places a pencil or a finger on the table with the eyes closed. The number touched is the starting place. Moving the pencil or finger up, down, right, or left, the researcher uses the numbers in order until the desired sample size is obtained. For example, the researcher places a pencil on 58 in Table 14-1, which is in the fourth column from the left and fourth row down. If five subjects are to be selected from a population of 100 and the researcher decides to go across the column to the right, the subject numbers chosen are 58, 25, 15, 55, and 38. Table 14-1 is useful only if the population number is less than 100. However, tables are available for larger populations, such as the random numbers table provided in Appendix A.

Flynn (2007, p. 200) used simple random sampling in her study that “explored associations between organizational support for nursing practice in home health care agencies and (a) the frequency of nurse-reported adverse events, (b) nurse-assessed quality of care, (c) nurse job satisfaction, and (d) nurses’ intentions to leave their employing agency.” The following excerpt from her study describes the process used to obtain the random sample.
Flynn (2007) used simple random sampling to obtain her sample from 38 different states. However, the sampling frame was a list of subscribers to a journal, and home health nurses who did not subscribe to this journal were excluded and might differ in some way from the subscribers. In addition, the researcher had a 52.4% response rate, which is strong for a mailed survey. However, the final sample size was small because only 137 of the RNs who responded met the study sample criteria. Simple random sampling increased the sample’s representativeness of the target population, but the sampling frame and sample size problems decreased the sample’s representativeness.
Stratified Random Sampling
Stratified random sampling is used when the researcher knows some of the variables in the population that are critical to achieving representativeness. Variables commonly used for stratification are age, gender, ethnicity, socioeconomic status, diagnosis, geographical region, type of institution, type of care, care provider, and site of care. The variable or variables chosen for stratification must be correlated with the dependent variables being examined in the study. Subjects within each stratum are expected to be more alike (homogeneous) in relation to the study variables than they are to be like subjects in other strata or the total sample. In stratified random sampling, the subjects are randomly selected on the basis of their classification into the selected strata.
For example, if in conducting your research you selected a stratified random sample of 100 adult subjects using age as the variable for stratification, the sample might include 25 subjects in the age range 18 to 39 years, 25 subjects in the age range 40 to 59 years, 25 subjects in the age range 60 to 79 years, and 25 subjects 80 years or older. Stratification ensures that all levels of the identified variable, in this example age, are adequately represented in the sample. With a stratified random sample, you could use a smaller sample size to achieve the same degree of representativeness as a large sample acquired through simple random sampling. Sampling error decreases, power increases, data collection time is reduced, and the cost of the study is lower if stratification is used.
One question that arises in relation to stratification is whether each stratum should have equivalent numbers of subjects in the sample (termed disproportionate sampling) or whether the numbers of subjects should be selected in proportion to their occurrence in the population (termed proportionate sampling). For example, if stratification is being achieved by ethnicity and the population is 60% Caucasian, 20% African American, 15% Mexican American, and 5% Asian, your research team would have to decide whether to select equal numbers of each ethnic group or to calculate a proportion of the sample. Good arguments exist for both approaches. Stratification is not as useful if one stratum contains only a small number of subjects. In the aforementioned situation, if proportions are used and the sample size is 100, the study would include only five Asians, hardly enough to be representative. If equal numbers of each group are used, each group would contain at least 25 subjects; however, the Caucasian group would be underrepresented. In this case, mathematically weighting the findings from each stratum can equalize the representation to ensure proportional contributions of each stratum to the total score of the sample. Most textbooks on sampling describe this procedure (Cochran, 1977; Levy & Lemsbow, 1980; Yates, 1981).
Ulrich et al. (2006) used a stratified random sampling method to obtain their sample of nurse practitioners (NPs) and physician assistants (PAs) for the purpose of studying their ethical conflict associated with managed care. The following excerpt from this study describes the sampling method used to obtain the final sample of 1536 providers (833 NPs and 689 PAs).
The study sampling frames for the NPs and PAs are representative of all 50 states and the District of Columbia, and the lists for the sampling frames were from quality sources. The study has a strong response rate of 50.6% for the mailed questionnaires, and the researchers identified why certain respondents were disqualified. The final sample was large (1536 subjects) with strong representation for both NPs (833 subjects) and PAs (689 subjects). The study sample might have been stronger with a more equal number of NP and PA subjects. However, the sample was a great strength of this study and appeared to represent the target population of NPs and PAs currently practicing in primary care.
Cluster Sampling
Cluster sampling is used in two situations. The first situation is when a simple random sample would be prohibitive in terms of travel time and cost. Imagine trying to arrange personal meetings with 100 people, each in a different part of the United States. The second situation is in cases in which the individual elements making up the population are not known, thus preventing the development of a sampling frame. For example, there is no list of all the open-heart surgery patients in the United States. In these cases, it is often possible to obtain lists of institutions or organizations with which the elements of interest are associated.
In cluster sampling, the researcher develops a sampling frame that includes a list of all the states, cities, institutions, or organizations with which elements of the identified population would be linked. States, cities, institutions, or organizations are selected randomly as units from which to obtain elements for the sample. In some cases, this random selection continues through several stages and is then referred to as multistage cluster sampling. For example, the researcher might first randomly select states, then randomly select cities within the sampled states. Hospitals within the randomly selected cities might then be randomly selected. Within the hospitals, nursing units might be randomly selected. At this level, either all the patients on the nursing unit who fit the criteria for the study might be included or patients could be randomly selected.
Cluster sampling provides a means for obtaining a larger sample at a lower cost. However, it has some disadvantages. Data from subjects associated with the same institution are likely to be correlated and thus not completely independent. This correlation can cause a decrease in precision and an increase in sampling error. However, such disadvantages can be offset to some extent by the use of a larger sample.
Mitchell, Woods, & Lentz (1994) used multistage cluster sampling in their study differentiating women with three perimenstrual symptom patterns. They described their sampling procedure as follows.
Mitchell et al. (1994) clearly described the different clusters (census block groups, street segments, and residential telephone numbers) of subjects that were used to randomly select the sample. In addition, the sample size of 142 subjects is a strength but is somewhat limited because 656 women met the inclusion criteria. Overall, this sampling method strengthens this study and produces a sample that probably represents the target population.
Systematic Sampling
Systematic sampling can be conducted when an ordered list of all members of the population is available. The process involves selecting every kth individual on the list, using a starting point selected randomly. If the initial starting point is not random, the sample is not a probability sample. To use this design in your research, you must know the number of elements in the population and the size of the sample desired. Divide the population size by the desired sample size, giving k, the size of the gap between elements selected from the list. For example, if the population size is N = 1200 and the desired sample size is n = 100, then you could calculate the value of k:
Thus, k = 12, which means that every twelfth person on the list would be included in the sample. Some argue that this procedure does not truly give each element an opportunity to be included in the sample; it provides a random but not equal chance for inclusion.
Researchers must be careful to determine that the original list has not been set up with any ordering that could be meaningful in relation to the study. The process is based on the assumption that the order of the list is random in relation to the variables being studied. If the order of the list is related to the study, systematic bias is introduced. In addition to this risk, it is difficult to compute sampling error with the use of this design. For additional information about systematic sampling, see Floyd (1993).
Tolle, Tilden, Rosenfeld, and Hickman (2000) used systematic sampling to study family reports of the barriers to optimal care of the dying. They described their sampling plan as follows.
The systematic sampling plan used by Tolle et al. (2000) has both strengths and weaknesses. Because their sampling frame was 24,074 death certificates and their desired sample size was 1458, they systematically selected every 16th death certificate to identify families for inclusion in their study. Two potential areas of bias are that 44% of the families identified on the originally selected 1458 death certificates could not be contacted. Of the 816 families contacted, 41% refused to participate. The families who could not be contacted or refused to participate might differ in some way from those who did participate, which decreases the sample’s representativeness of the target population. However, the representativeness of the sample is strengthened by the sample size, N = 475, and the use of a probability sampling method.
NONPROBABILITY (NONRANDOM) SAMPLING METHODS IN QUANTITATIVE RESEARCH
In nonprobability sampling, not every element of the population has an opportunity to be included in the sample. Thus, nonprobability sampling methods increase the likelihood of obtaining samples that are not representative of their target populations. However, the majority of nursing studies use nonprobability sampling, especially convenience sampling, to select study samples. An analysis of nursing studies published in six nursing journals from 1977 to 1986 revealed that 91% of the studies used nonrandom sampling methods and only 9% used random sampling, which is a trend that appears to continue today (Moody et al., 1988).
There are several types of nonprobability (nonrandom) sampling designs. Each addresses a different research need. The five nonprobability sampling designs described in this textbook are (1) convenience sampling, (2) quota sampling, (3) purposive sampling, (4) network sampling, and (5) theoretical sampling. These sampling methods are used in both quantitative and qualitative research. However, convenience sampling and quota sampling are used more often in quantitative than in qualitative studies and are discussed in this section. Purposive sampling, network sampling, and theoretical sampling are used more frequently in qualitative studies than in quantitative studies and are discussed later in this chapter.
Convenience (Accidental) Sampling
In convenience sampling, subjects are included in the study because they happened to be in the right place at the right time. Researchers simply enter available subjects into the study until they have reached the desired sample size. Convenience sampling, also called accidental sampling, is considered a weak approach to sampling because it provides little opportunity to control for biases. Multiple biases may exist in convenience sampling; these biases range from minimal to serious.
Researchers must identify and describe known biases in their samples. You can identify biases by carefully thinking through the sample criteria used to determine the target population and then taking steps to improve the representativeness of the sample. For example, in a study of home care management of patients with complex health care needs, educational level would be an important extraneous variable. One solution for controlling this extraneous variable would be to redefine the sampling criteria to include only those with a high school education. Doing so would limit the extent of generalization but decrease the bias created by educational level. Another option would be to select a population known to include individuals with a wide variety of educational levels. Data could be collected on educational level so that the description of the sample would include information on educational level. With this information, one could judge the extent to which the sample was representative with respect to educational level.
Decisions related to sample selection must be carefully described to enable others to evaluate the possibility of biases. In addition, data must be gathered to allow a thorough description of the sample that can also be used to evaluate for possible biases. Data on the sample can be used to compare the sample with other samples and for estimating the parameters of populations through meta-analyses.
Many strategies are available for selecting a convenience sample. A classroom of students might be used. Patients who attend a clinic on a specific day, subjects who attend a support group, patients currently admitted to a hospital with a specific diagnosis, and every fifth person who enters the emergency department are examples of types of commonly selected convenience samples.
Convenience samples are inexpensive and accessible, and they usually require less time to acquire than other types of samples. Convenience samples provide means to conduct studies on topics that could not be examined through the use of probability sampling. Thus, convenience sampling enables researchers to acquire information in unexplored areas. According to Kerlinger and Lee (2000), a convenience sample is probably not that bad when it is used with reasonable knowledge and care in implementing a study. Health care studies are usually conducted with particular types of patients experiencing varying numbers of health problems; these patients often have limited desires to participate in research. Thus, researchers often find it very difficult to recruit subjects for their studies and frequently must use a sample of convenience versus random sampling to obtain their sample.
Bay, Hagerty, and Williams (2007) used convenience sampling to describe the depressive symptoms of individuals following mild-to-moderate traumatic brain injury (TBI). The following excerpt describes their sampling method.
Bay et al.’s (2007) convenience sample has several strengths and a few weaknesses. The consistent recruitment of the participants and the inclusion of five traumatic brain injury programs across the Midwest as settings are strengths of the sample. It would have been helpful if the acceptance or refusal rate for the study had been addressed to determine possible sample bias. The individuals with traumatic brain injury have decreased ability to consent to research so consent was obtained from these individuals and their relative/significant others, indicating ethical treatment of the subjects during the sampling process. The data were collected at one session, so no attrition was noted during the study. The subjects were compensated for their time during the study, which usually increases the acceptance and retention rates for a study. The sample size of 75 might have been larger but was strong considering the type of patient studied. Most of the actions of the researchers during the sampling process decreased the potential for bias and improved this convenience sample’s representativeness of the target population.
Quota Sampling
Quota sampling uses a convenience sampling technique with an added feature, a strategy to ensure the inclusion of subject types that are likely to be underrepresented in the convenience sample, such as women, minority groups, the elderly, the poor, the rich, and the undereducated. This method may also be used to mimic the known characteristics of the target population or to ensure adequate numbers of subjects in each stratum for the planned statistical analyses. The technique is similar to that used in stratified random sampling. If necessary, mathematical weighting can be used to adjust sample values so that they are consistent with the proportion of subgroups found in the population. Quota sampling offers an improvement over convenience sampling and tends to decrease potential biases. In most studies in which convenience samples are used, quota sampling could be used and should be considered.
McCain et al. (2003) used quota sampling to study the effects of stress management on the psychoneuroimmunology outcomes in persons with HIV infection. They described their sample selection as follows.
McCain et al. (2003) used quota sampling to ensure a gender distribution of 80% males and 20% females in the study and to achieve study groups that were equal based on patients’ CD4+ counts and stage of illness. The stratification by gender and CD4+ count decreased the potential for bias in the sampling method, promoted equality in the study groups, and improved the sample’s representativeness of the target population. The researchers also addressed the attrition rate in terms of the total sample and the groups and indicated that this probably did not affect the study findings. The strengths of this study’s sampling process decreased the likelihood of sampling error, which is often associated with nonprobability sampling.
NONPROBABILITY SAMPLING METHODS USED IN QUALITATIVE RESEARCH
Qualitative research is conducted to gain insights and discover meaning about a particular experience, situation, cultural element, or historical event. The intent is an in-depth understanding of a purposefully selected sample and not the generalization of the findings from a randomly selected sample to a target population, as in quantitative research. Thus, in qualitative research, experiences, events, and incidents are more the focus of sampling than people (Patton, 2002; Sandelowski, 1995, 2000). The researcher attempts to select participants who can provide extensive information about the experience or event being studied. For example, if the goal of your study was to describe the phenomenon of living with chronic pain, you would purposefully select participants who were articulate and reflective, had a history of chronic pain, and were willing to share their chronic pain experience (Coyne, 1997).
Three common sampling methods used in qualitative research are purposive sampling, snowball sampling, and theoretical sampling. These sampling methods enable the researcher to select the specific participants who will provide the most extensive information about the phenomenon, event, or situation being studied (Marshall & Rossman, 2006). The sample selection process can have a profound effect on the quality of the research and should be described in enough depth to promote the interpretation of the findings and the replication of the study (Munhall, 2001; Patton, 2002).
Purposive Sampling
In purposive sampling, sometimes referred to as judgmental or selective sampling, the researcher consciously selects certain participants, elements, events, or incidents to include in the study. In purposive sampling, qualitative researchers select information-rich cases, or those cases that can teach them a great deal about the central focus or purpose of the study (Green & Thorogood, 2004; Patton, 2002). Efforts might be made to include typical and atypical participants or situations. Researchers also seek critical cases, or those cases that make a point clearly or are extremely important in understanding the purpose of the study (Munhall, 2001). The researcher might select participants of various ages, those with differing diagnoses or illness severity, or those who received an ineffective treatment versus an effective treatment for their illness.
This sampling plan has been criticized because it is difficult to evaluate the precision of the researcher’s judgment. How does one determine that the patient or element was typical or atypical, good or bad, effective or ineffective? Thus, researchers need to indicate the characteristics that they desire in participants and provide a rationale for selecting these types of participants to obtain essential data for their study. Purposive sampling method is used in qualitative research to gain insight into a new area of study or to obtain in-depth understanding of a complex experience or event.
Bakitas (2007) used purposive sampling in conducting her qualitative study to describe the symptom experiences and the impact of chemotherapy-induced peripheral neuropathy (CIPN) on function and everyday life for 28 cancer patients. She described her sample as follows.
In this example, Bakitas (2007) used purposive sampling to select participants who were information rich for her sample. Thus, the study participants were recruited from a large, national cancer center so they would have maximal diverse personal, disease, and CIPN characteristics. The sample inclusion and exclusion criteria are clearly identified to ensure that the participants are experiencing CIPN and not neuropathy resulting from another condition. Bakitas (2007) provided a strong rationale for the number (28) and types of patients selected for her study. These sampling strengths promote the conduct of a sound qualitative study.
Network Sampling
Network sampling, sometimes referred to as “snowballing,” holds promise for locating samples difficult or impossible to obtain in other ways or who had not been previously identified for study. Network sampling takes advantage of social networks and the fact that friends tend to have characteristics in common. When you have found a few participants with the necessary criteria, you can ask for their assistance in getting in touch with others with similar characteristics. The first few participants are often obtained through a convenience sampling method, and the sample size is expanded using network sampling. This sampling method is occasionally used in quantitative studies, but it is more commonly used in qualitative studies (Marshall & Rossman, 2006; Munhall, 2001). In qualitative research, network sampling is an effective strategy for identifying participants who know other potential participants who can provide the greatest insight and essential information about an experience or event that is identified for study (Patton, 2002). This strategy is also particularly useful for finding participants in socially devalued populations such as alcoholics, child abusers, sex offenders, drug addicts, and criminals. These individuals are seldom willing to make themselves known. Other groups, such as widows, grieving siblings, or those successful at lifestyle changes, can be located using this strategy. These individuals are outside the existing health care system and are difficult to find. Obviously, biases are built into the sampling process, because the participants are not independent of one another. However, the participants selected have the expertise to provide the essential information needed to address the study purpose.
Coté-Arsenault and Morrison-Beedy (2001) conducted a phenomenological study titled “Women’s Voices Reflecting Changed Expectations for Pregnancy after Perinatal Loss.” They used network or snowball sampling and described the sampling plan for their study as follows.
The researchers clearly identified the networks (personal contacts, loss support group, and flyers) that were used to recruit study participants. This sampling plan successfully identified women with diverse childbearing experiences, who provided detailed, information-rich data on the expectations for pregnancy after perinatal loss. The sample size of 21 is strong for a qualitative study.
Theoretical Sampling
Theoretical sampling is usually used in grounded theory research to advance the development of a selected theory throughout the research process (Munhall, 2001). The researcher gathers data from any individual or group that can provide relevant data for theory generation. The data are considered relevant if they include information that generates, delimits, and saturates the theoretical codes in the study needed for theory generation. A code is saturated if it is complete and the researcher can see how it fits in the theory. Thus, the researcher continues to seek sources and gather data until the codes are saturated and the theory evolves from the codes and the data. Diversity in the sample is encouraged so the theory developed covers a wide range of behavior in varied situations (Patton, 2002).
Rew (2003) conducted a grounded theory study to develop a theory of taking care of oneself that was grounded in the experiences of homeless youth. The study incorporated theoretical sampling, and the sampling method was described as follows.
Rew (2003) clearly identified the sampling method and the type of participants who were recruited for the study. The number of participants interviewed to reach data saturation was addressed, and three additional interviews were conducted to verify the findings. Adequate data were collected, and codes were saturated to ensure the development of a grounded theory of “Taking Care of Oneself in a High Risk Environment.” This descriptive theory of self-care for homeless/street youth included three categories: becoming aware of oneself, staying alive with limited resources, and handling one’s own health.
SAMPLE SIZE IN QUANTITATIVE RESEARCH
One of the questions beginning researchers commonly ask is, “What size sample should I use?” Historically, the response to this question has been that a sample should contain at least 30 subjects. There is no logical reason for the selection of this number, and in most cases, 30 subjects is an inadequate sample size.
Currently, the deciding factor in determining an adequate sample size for correlational, quasi-experimental, and experimental studies is power. Power is the capacity of the study to detect differences or relationships that actually exist in the population. Expressed another way, power is the capacity to correctly reject a null hypothesis. The minimum acceptable power for a study is 0.80 (80%). If you do not have sufficient power to detect differences or relationships that exist in the population, you might question the advisability of conducting the study. You determine the sample size needed to obtain sufficient power by performing a power analysis. The statistical procedures used to perform power analyses are described in Chapter 18.
An increasing number of nurse researchers are using power analysis to determine sample size, but it is essential that the results of the power analyses be included in the published studies. Not conducting a power analysis for a study or omitting the power analysis results in a published study are significant problems if the study failed to detect significant differences or relationships, which might be due to an inadequate sample size. Beck (1994) reviewed the reporting of power analysis in three nursing research journals from 1988 through 1992. Power analysis was reported in only eight studies published in Nursing Research, nine studies in Research in Nursing & Health, and three studies in Western Journal of Nursing Research. Currently, many published studies still do not include a discussion of power analysis, and a number of studies lack the power to detect significant relationships or differences.
The adequacy of sample sizes must be more carefully evaluated in future nursing studies before data collection. Studies with inadequate sample sizes should not be approved for data collection unless they are preliminary pilot studies conducted before a planned larger study. If it is not possible for you to obtain a larger sample because of time or numbers of available subjects, you should redesign your study so that the available sample is adequate for the planned analyses. If you cannot obtain a sufficient sample size, you should not conduct the study.
Large sample sizes are difficult to obtain in nursing studies, require long data collection periods, and are costly. Therefore, in developing the methodology for a study, you must evaluate the elements of the methodology that affect the required sample size. Kraemer and Thiemann (1987) identified the following factors that must be taken into consideration in determining sample size:
1. The more stringent the significance level (e.g., 0.001 versus 0.05), the greater the necessary sample size.
2. Two-tailed statistical tests require larger sample sizes than one-tailed tests. (Tailedness of statistical tests is explained in Chapter 18.)
3. The smaller the effect size, the larger the necessary sample size.
4. The larger the power required, the larger the necessary sample size.
5. The smaller the sample size, the smaller the power of the study.
The factors that must be considered in decisions about sample size (because they affect power) are the effect size, the type of study, the number of variables, the sensitivity of the measurement methods, and the data analysis techniques. These factors are discussed in the following sections.
Effect Size
Effect is the presence of a phenomenon. If a phenomenon exists, it is not absent, and thus, the null hypothesis is in error. However, effect is best understood when not considered in a dichotomous way—that is, as either present or absent. If a phenomenon exists, it exists to some degree. Effect size (ES) is the extent of the presence of a phenomenon in a population. Effect, in this case, is used in a broader sense than that of “cause and effect.” For example, you might examine the impact of distraction on the experience of pain during an injection. To examine this question, you might obtain a sample of subjects receiving injections and measure differences in the experience of pain in a group of subjects who were distracted during injection and a group of subjects who were not distracted. The null hypothesis would be that there is no difference in the amount of pain experienced by the group receiving distraction versus the one receiving no distraction. If this were so, you would say that the effect of distraction on the experience of pain was zero. In another study, you might be interested in using the Pearson product moment correlation r to examine the relationship between coping and anxiety. Your null hypothesis is that the population r would be zero or coping is not related to anxiety (Cohen, 1988).
In a study, it is easier to detect large differences between groups than to detect small differences. Thus, smaller samples can detect large ESs; smaller effect sizes require larger samples. Broadly speaking, a small ES would be < 0.3, a medium ES would be about 0.3 to 0.5, and a large ES would be > 0.5. Extremely small ESs, such as < 0.2, may not be clinically important because the relationships between the variables are small and the differences between the treatment and comparison groups are limited. Knowing the effect size that would be regarded as clinically important allows us to limit the sample to the size needed to detect that level of ES (Kraemer & Thiemann, 1987). A result is clinically significant if the effect is large enough to alter clinical decisions. For example, in a comparison of glass thermometers with electronic thermometers, an effect size of 0.1 °F in oral temperature is probably not important enough to influence selection of a particular type of thermometer.
ESs vary according to the population being studied. Thus, we must determine the ES for the particular relationship or effect being studied in a selected population. The most desirable source of this information is evidence from previous studies (Melnyk & Fineout-Overholt, 2005). The correlation value (r) is equal to the ES for the relationship between two variables. For example, if depression is correlated with anxiety at r = 0.45, then the ES = 0.45. In published studies with treatments, the means and standard deviations can be used to calculate the ES. For example, if the mean weight loss for the treatment or intervention group is 5 pounds per month with a standard deviation (SD) of 4.5 and the mean weight loss of the control or comparison group is 1 pound per month with a SD = 6.5, you can calculate the ES.

This calculation, however, can be used only as an estimate of ES for the study. If the researcher changes the measurement method used, the design of the study, or the population being studied, the ES will be altered. The best estimate of a population parameter of ES is obtained from a meta-analysis in which an estimated population effect size is calculated through the use of statistical values from all studies included in the analysis (Cohen, 1988).
If few relevant studies have been conducted in the area of interest, small pilot studies can be performed, and data analysis results used to calculate the ES. If pilot studies are not feasible, dummy power table analysis can be used to calculate the smallest ES with clinical or theoretical value. Yarandi (1991) described the process of calculating a dummy power table. If all else fails, ES can be estimated as small, medium, or large. Numerical values would be assigned to these estimates, and the power analysis performed. Cohen (1988) has indicated the numerical values for small, medium, and large effects on the basis of specific statistical procedures. In new areas of research, ESs are usually small (< 0.3) (Borenstein & Cohen, 1989).
Im et al. (2007, p. 296) conducted a power analysis to identify the sample size they needed to “determine ethnic differences in reported cancer pain experiences among four of the most common ethic groups in the United States, Hispanic, non-Hispanic [N-H] White, N-H African American, and N-H Asian.” They included the following discussion of power analysis in their published study.
Im et al. (2007) identified the small ES of 0.2 for their study because this is a relatively new area of research for the four ethnic groups. The researchers indicated that a minimum of 68 subjects would be needed for each ethnic group to achieve a power of 0.8 to detect significant differences in this study. Thus, the minimum sample size needed was 272, and the researchers greatly exceeded that minimum sample size by obtaining a sample of 480. Another important strength of this study was that each ethnic group had more than 100 subjects, when a minimum of 68 subjects was required. The total sample size (480 subjects) and the number of subjects in each ethnic group enabled the researchers to detect significant differences among the four ethnic groups. The study findings indicated that there were ethnic differences in types of pain, symptoms, and functional status for cancer patients, which needs to be considered in caring for these patients.
Type of Study
Descriptive case studies tend to use small samples. Groups are not compared, and problems related to sampling error and generalization have little relevance for such studies. A small sample size may better serve the researcher who is interested in examining a situation in depth from various perspectives. Other descriptive studies, particularly those using survey questionnaires, and correlational studies often require large samples. In these studies, multiple variables may be examined, and extraneous variables are likely to affect subject responses to the variables under study. Statistical comparisons are often made among multiple subgroups in the sample, requiring that an adequate sample be available for each subgroup being analyzed. In addition, subjects are likely to be heterogeneous in terms of demographic variables, and measurement tools are sometimes not adequately refined. Although target populations may have been identified, sampling frames may not be available, and parameters have not usually been well defined by previous studies. All of these factors lower the power of the study and require increases in sample size (Kraemer & Thiemann, 1987).
In the past, quasi-experimental and experimental studies often used smaller samples than descriptive and correlational studies. As control in the study increases, the sample size can decrease and still approximate the population. Instruments in these studies tend to be refined, thus improving precision. However, sample size must be sufficient to achieve an acceptable level of power (0.8) and thereby reduce the risk of a type II error (indicating the study findings are nonsignificant, when they are really significant) (Kraemer & Thiemann, 1987).
The study design influences power, but the design with the greatest power may not always be the most valid design to use. The experimental design with the greatest power is the pretest-posttest design with a historical control or comparison group. However, this design may have questionable validity because of the historical control group. Can the researcher demonstrate that the historical control group is comparable to the experimental group? The repeated measures design will increase power if the trait being assessed is relatively stable over time. Designs that use blocking or stratification usually require an increase in the total sample size. The sample size increases in proportion to the number of cells included in the data analysis. Designs that use matched pairs of subjects have greater power and thus require a smaller sample. The higher the degree of correlation between subjects on the variable on which the subjects are matched, the greater the power (Kraemer & Thiemann, 1987).
Kraemer and Thiemann (1987) classified studies as exploratory or confirmatory. According to their approach, confirmatory studies should be conducted only after a large body of knowledge has been gathered through exploratory studies. Confirmatory studies are expected to have large samples and to use random sampling techniques. These expectations are lessened for exploratory studies. Exploratory studies are not intended for generalization to large populations. They are designed to increase the knowledge of the field of study. For example, pilot or preliminary studies to test a methodology or provide estimates of an ES are often conducted before a larger study. In other studies, the variables, not the subjects, are the primary area of concern. Several studies may examine the same variables using different populations. In these types of studies, the specific population used may be somewhat incidental. Data from these studies may be used to define population parameters. This information can then be used to conduct confirmatory studies using large, randomly selected samples.
Confirmatory studies, such as those testing the effects of nursing interventions on patient outcomes or those testing the fit of a theoretical model, require large sample sizes. Clinical trials are being conducted in nursing for these purposes. The power of these large, complex studies must be carefully analyzed (Leidy & Weissfeld, 1991). For the large sample sizes to be obtained, subjects are acquired in a number of clinical settings, sometimes in various parts of the country. Kraemer and Thiemann (1987) believe that these studies should not be performed until extensive information is available from exploratory studies. This information should include meta-analysis and the definition of a population ES.
Number of Variables
As the number of variables under study grows, the needed sample size may also increase. Adding variables such as age, gender, ethnicity, and education to the analysis plan (just to be on the safe side) can increase the sample size by a factor of 5 to 10 if the selected variables are uncorrelated with the dependent variable. In this case, instead of a sample of 50, you may need a sample of 250 to 500 if you plan to use the variables in the statistical analyses. (Using them only to describe the sample does not cause a problem in terms of power.) If the variables are highly correlated with the dependent variable, however, the effect size will increase, and the sample size can be reduced.
Therefore, variables included in the data analysis must be carefully selected. They should be essential to the research purpose or should have a documented strong relationship with the dependent variable (Kraemer & Thiemann, 1987). Sometimes researchers have obtained sufficient sample size for the primary analyses but failed to plan for analyses involving subgroups, such as analyzing the data by age categories or by ethnic groups, which require a larger sample size. The inclusion of multiple dependent variables also increases the sample size needed.
Measurement Sensitivity
Well-developed instruments measure phenomena with precision. A thermometer, for example, measures body temperature precisely. Tools measuring psychosocial variables tend to be less precise. However, a tool with strong reliability and validity tends to measure more precisely than a tool that is less well developed. Variance tends to be higher in a less well-developed tool than in one that is well developed. An instrument with a smaller variance is preferred because the power of a test always decreases when within-group variance increases (Kraemer & Thiemann, 1987). For example, if you were measuring anxiety and the actual anxiety score for several subjects was 80, the subjects’ scores on a less well-developed tool might range from 70 to 90, whereas a well-developed tool would tend to show a score closer to the actual score of 80 for each subject. As variance in instrument scores increases, the sample size needed to gain an accurate understanding of the phenomenon under study increases.
The range of measured values influences power. For example, a variable might be measured in 10 equally spaced values, ranging from 0 to 9. ESs vary according to how near the value is to the population mean. If the mean value is 5, ESs are much larger in the extreme values and lower for values near the mean. If you decided to use only subjects with values of 0 and 9, the ES would be large, and the sample could be small. The credibility of the study might be questionable, however, because the values of most individuals would not be 0 or 9 but rather would tend to be in the middle range of values. If you decided to include subjects who have values in the range of 3 to 6, excluding the extreme scores, the ES would be small, and you would require a much larger sample. The wider the range of values sampled, the larger the ES (Kraemer & Thiemann, 1987). A strong measurement method has validity and reliability and measures variables at the interval or ratio level. The stronger the measurement methods used in a study, the smaller the sample that is needed to identify significant relationships among variables and differences between groups.
Data Analysis Techniques
Data analysis techniques vary in their ability to detect differences in the data. Statisticians refer to this as the power of the statistical analysis. For your data analysis, choose the most powerful statistical test appropriate to the data. Overall, parametric statistical analyses are more powerful than nonparametric techniques in detecting differences and should be used if the data meet criteria for parametric analysis. In many cases, however, nonparametric techniques are more powerful if your data do not meet the assumptions of parametric techniques. Parametric techniques vary widely in their capacity to distinguish fine differences and relationships in the data. Parametric and nonparametric analyses are discussed in Chapter 18.
There is also an interaction between the measurement sensitivity and the power of the data analysis technique. The power of the analysis technique increases as precision in measurement increases. Larger samples must be used when the power of the planned statistical analysis is low.
For some statistical procedures, such as the t-test and analysis of variance (ANOVA), having equal group sizes increases power, because the effect size is maximized. The more unequal the group sizes are, the smaller the effect size. Therefore, in unequal groups, the total sample size must be larger (Kraemer & Thiemann, 1987).
The chi-square (χ2) test is the weakest of the statistical tests and requires very large sample sizes to achieve acceptable levels of power. As the number of categories in your study grows, the sample size needed increases. Also, if there are small numbers in some of the categories, you must increase the sample size. Kraemer and Thiemann (1987) have recommended that the chi-square test be used only when no other options are available. In addition, the number of categories should be limited to those essential to the study.
SAMPLE SIZE IN QUALITATIVE RESEARCH
In quantitative research, the sample size must be large enough to identify relationships among variables or to determine differences between groups. However, in qualitative research, the focus is on the quality of information obtained from the person, situation, event, or documents sampled versus the size of the sample (Patton, 2002; Sandelowski, 1995). The sample size and sampling plan are determined by the purpose of the study. Thus, the sample size required is determined by the depth of information that is needed to gain insight into a phenomenon, describe a cultural element, develop a theory, or describe a historical event. The sample size can be too small when the data collected lacks adequate depth or richness. Thus, an inadequate sample size can reduce the quality and credibility of the research findings. Many qualitative researchers use purposive sampling methods to select the specific participants, events, or situations that they believe will provide them the rich data needed to gain insights and discover new meaning in an area of study (Sandelowski, 2000).
The number of participants in a qualitative study is adequate when saturation of information is achieved in the study area. Saturation of data occurs when additional sampling provides no new information, only redundancy of previously collected data. Important factors that must be considered in determining sample size to achieve saturation of data are (1) scope of the study, (2) nature of the topic, (3) quality of the data, and (4) study design (Marshall & Rossman, 2006; Morse, 2000; Munhall, 2001; Patton, 2002).
Scope of the Study
If the scope of your study is broad, you will need extensive data to address the study purpose, and it will take longer to reach data saturation. Thus, a study with a purpose that has a broad scope will require more sampling of participants, events, or documents than would a study with a narrow scope (Morse, 2000). A study that has a clear focus and provides focused data collection usually has richer, more credible findings. Thus, the depth of your study’s scope and its clarity of the focus will influence the number of participants you will need for the sample. For example, fewer participants would be needed to describe the phenomenon of chronic pain in adults with rheumatoid arthritis than would be needed to describe the phenomenon of chronic pain in the elderly. A study of chronic pain in the elderly has a much broader focus, with less clarity, than a study of chronic pain experienced by adults with a specific medical diagnosis of rheumatoid arthritis.
Nature of the Topic
If the topic of your study is clear and the participants can easily discuss it, fewer individuals are needed to obtain the essential data. If the topic is difficult to define and awkward for people to discuss, however, you will probably need a larger number of participants to saturate the data (Morse, 2000; Patton, 2002). For example, a phenomenological study of the experience of an adult living with a history of child sexual abuse is a sensitive, complex topic to investigate. This type of topic would probably require a greater number of participants and increased interview time to collect the essential data.
Quality of the Data
The quality of information obtained from an interview, observation, or document review influences the sample size. The higher the quality and richness of the data, the fewer participants you will need to saturate data in the area of study. Quality data are best obtained from articulate, well-informed, and communicative participants (Sandelowski, 1995). These participants are able to share more rich data in a clear and concise manner. In addition, participants who have more time to be interviewed usually provide data with greater depth and breadth. Qualitative studies require that you critically appraise the quality of the participants, events, or documents studied; the richness of the data collected; and the adequacy of the sample size based on the findings.
Study Design
Some studies are designed to increase the number of interviews with participants. The more interviews conducted with a participant, the greater the quality of the data collected. For example, a study design that includes an interview both before an event and after the event would produce more data than a single interview. Designs that involve interviewing a family or a group of individuals produce more data than an interview with a single study participant. In critically appraising a qualitative study, determine if the sample size is adequate for the design of the study.
Bakitas (2007) conducted a qualitative study to explore and describe the symptom experience and the resulting impact of chemotherapy-induced peripheral neuropathy (CIPN) on function and everyday life for patients with cancer. We introduced this study earlier in this chapter as an example of a study with purposive sampling, where the sampling method, sample criteria, and setting were described. The following excerpt describes Bakitas’s rationale for the sample size used to collect data in her study.
Bakitas’s (2007) study has many strengths in the area of sampling, including quality sampling methods (purpose and theoretical), strong sample size (N = 28), and conscientious participants. She provided extensive detail of her sampling process that included both purposive and theoretical sampling methods to ensure an adequate number of data-rich participants were interviewed to achieve depth and breadth in the data. The sample size of 20 from purposive sampling seemed strong, because rich, detailed data were collected from these participants. By using theoretical sampling to select seven more participants, Bakitas was able to more fully identify themes and issues and to saturate the data. Bakitas conducted a final interview to strengthen the study conclusions, resulting in a sample size of 28 for the study. The scope of the study, nature of the topic, and quality of the data were addressed and seemed to support the sample size. The report would have been strengthened by a discussion of refusal and attrition rates for the study, but the sample and data collected were extremely strong, increasing the validity of the study findings. The study results indicated “diverse symptom patterns and degrees of physical symptoms and distress from mild to severe, emotional distress, alterations in functional ability, and social role impairment. Comprehensive clinical and research measures are needed to assess the full spectrum of CIPN effects on everyday life” (Bakitas, 2007, p. 323).
RESEARCH SETTINGS
The setting is the location where a study is conducted. There are three common settings for conducting nursing research: natural, partially controlled, and highly controlled. A natural setting, or field setting, is an uncontrolled, real-life situation or environment (Peat et al., 2002). Conducting a study in a natural setting means that the researcher does not manipulate or change the environment for the study. Descriptive and correlational quantitative studies and qualitative studies are often conducted in natural settings. For example, Bakitas (2007), discussed previously, made no attempt to manipulate the setting when she conducted the interviews for her qualitative study; she even allowed participants to select the setting most convenient to and comfortable for them. All data were conducted in natural settings, with 21 participants interviewed in a private cancer center office, 6 in their homes, and 1 by telephone. The intent of the study was to describe the cancer patients’ symptoms and function as they exist in a natural environment.
A partially controlled setting is an environment that the researcher manipulates or modifies in some way. An increasing number of nursing studies, usually correlational, quasi-experimental, and experimental studies, are being conducted in partially controlled settings. Rivers et al. (2003), in a study that was introduced earlier in the discussion of sampling frame, conducted a predictive correlational study to determine predictors of nurses’ acceptance of an intravenous catheter safety device. These researchers described their setting as follows:
Rivers et al. (2003) selected a teaching hospital, which provides a partially controlled setting in terms of the units that have IVs, nurses’ training within the hospital and in particular for the IV safety device, and the safety climate or requirements of the workplace. However, the researchers did not control other aspects of the environment, such as the nurses’ previous work experience; interactions of the nurses regarding their training and use of the IV safety device on different units; and the data collection process, which was a self-administered questionnaire.
A highly controlled setting is an artificially constructed environment developed for the sole purpose of conducting research. Laboratories, research or experimental centers, and test units in hospitals or other health care agencies are highly controlled settings where experimental studies are often conducted. This type of setting reduces the influence of extraneous variables, which enables the researcher to examine accurately the effect of one variable on another. Highly controlled settings are commonly used to conduct experimental research. Rasmussen and Farr (2003) conducted an experimental study of the effects of morphine and time of day on pain and beta-endorphin in a sample of Dilute Brown Agouti (DBA) mice. This study was conducted in a laboratory using a selected type of mouse, and the setting is described as follows.
The study included the use of a highly controlled laboratory setting in terms of the housing of the mice, the light and temperature of the environment, implementation of the treatments, and the measurements of the dependent variables. Only with animals could this type of setting control be achieved in the conduct of a study. This type of highly controlled setting removes the impact of numerous extraneous variables, so the effects of the independent variables on the dependent variables can be clearly determined. However, because this research was conducted on animals, the findings cannot be generalized to humans, and additional research is needed to determine the effects of the independent variables of morphine and time of day on the dependent variables of pain and beta-endorphins in humans.
RECRUITING AND RETAINING SUBJECTS
Once you and your research team have made a decision about the size of the sample, your next step is to develop a plan for recruiting subjects. Recruitment strategies differ, depending on the type of study and the setting. Special attention must focus on recruiting subjects who tend to be underrepresented in studies, such as minorities, women, children, and the elderly (Corbie-Smith, Thomas, Williams, & Moody-Ayers, 1999; Fulmer, 2001; Hendrickson, 2007; Rice, Bunker, Kang, Howell, & Weaver, 2007). The sampling plan, initiated at the beginning of data collection, is almost always more difficult than expected. In addition to subject recruitment, retaining acquired subjects is critical to achieve an acceptable sample size and requires you to consider the effects of the data collection strategies on subject attrition. Problems with retaining subjects increase as the data collection period lengthens. Some researchers never obtain their planned sample size because of problems they encounter as they try to recruit and retain subjects. These researchers often are forced to complete their study with a smaller sample size, which could decrease the power of the study and produce nonsignificant results. With the additional studies being conducted in health care, recruiting and retaining subjects have become more complex issues for researchers to manage.
Recruiting Subjects
The effective recruitment of subjects is crucial to the success of a study. Few studies have examined the effectiveness of various strategies of subject recruitment. Most information available to guide researchers comes from the personal experiences of skilled researchers. Some of the factors that influence a subject’s decision to participate in a study are the attitudes and ethics of the researchers, the subject’s need for a treatment, the subject’s interest in the study topic, fear of the unknown, time and travel constraints, financial compensation, and the nature of the informed consent (Madsen et al., 2002; Papadopoulos & Lees, 2002; Sullivan-Bolyai et al., 2007).
The researcher’s initial approach to a potential subject usually strongly affects his or her decision about participating in the study. Therefore, your approach must be pleasant, positive, informative, and nonaggressive. Explain the importance of the study, and clarify exactly what the subject will be asked to do, how much of the subject’s time will be involved, and what the duration of the study will be. Subjects are valuable resources, and the researcher must communicate this value to the potential subject. High-pressure techniques, such as insisting that the subject make an instant decision to participate in a study, usually lead to resistance and a higher rate of refusals. If the study involves minorities, the researcher must be culturally competent or knowledgeable and skilled in relating to the particular ethnic group being studied (Papadopoulos & Lees, 2002). Hendrickson (2007) used a video for recruiting Hispanic women for her study, and she provided all the details related to the study in the subjects’ own language in the video. This greatly improved the subjects’ understanding of the study and the consent process.
If a potential subject refuses to participate in a study, you must accept the refusal gracefully—in terms of body language, as well as words. Your actions can influence the decision of other potential subjects who observe or hear about the encounter. Studies in which a high proportion of individuals refuse to participate have a serious validity problem. The sample is likely to be biased, because often only a certain type of individual has agreed to participate. Therefore, keep records of the numbers of persons who refuse and, if possible, their reasons for refusal. With this information, you can include the refusal rate in the published research report with the reasons for refusal. It would also be helpful if you could determine if the potential subjects who refused to participate differ from those who agreed to participate in the study. This information will help you to determine the representativeness of your sample.
Recruiting minority subjects for a study can be particularly problematic. Minority individuals may be difficult to locate and are often reluctant to participate in studies because of feelings of being “used” while receiving no personal benefit from their involvement or because of their distrust of the medical community (Corbie-Smith et al., 1999). Pletsch, Howe, and Tenney (1995, p. 211) recommended using “feasibility analysis, developing partnerships with target groups and community members, using active face-to-face recruitment, and using process evaluation techniques to recruit members of minority groups as subjects of a study.”
If you are using data collectors in your study, verify that they are following the sampling plan, especially in random samples. When the data collectors encounter difficult subjects or are unable to make contact easily, they may simply shift to the next person without informing the principal investigator. This behavior could violate the rules of random sampling and bias the sample. If data collectors do not understand, or do not believe in, the importance of randomization, their decisions and actions can undermine the intent of the sampling plan. Thus, data collectors must be carefully selected and thoroughly trained. Develop a plan for the supervision and follow-up of data collectors to increase their accountability.
If you conduct a survey study, you may never have personal contact with the subjects. To recruit such subjects, you must rely on the use of attention-getting techniques, persuasively written material, and strategies for following up on individuals who do not respond to the initial written or e-mail communication. Because of the serious problems of low response rates in survey studies, using strategies to raise the response rate is critical. For instance, we have received a teabag or packet of instant coffee with a questionnaire, accompanied by a recommendation in the letter to have a cup of tea or coffee “on” the researcher while we take a break from work to complete the questionnaire. Creativity is required in the use of such strategies, because they tend to lose their effect on groups who receive questionnaires frequently (such as faculty). In some cases, small amounts of money (fifty cents to a dollar) are enclosed with the letter, which may suggest that the recipient buy a soft drink or that the money is a small offering for completing the questionnaire. This strategy imposes some sense of obligation on the recipient to complete the questionnaire, but it is not thought to be coercive (Baker, 1985). Also, you should plan mailings to avoid holidays or times of the year when workloads are high for potential subjects, possibly reducing the return rate.
Researchers frequently use the Internet to recruit subjects and to collect survey data. This method makes it easier for you to contact potential subjects and for the subjects to provide the requested data. However, an increased number of surveys are being sent by the Internet, which can decrease the response rate of potential subjects who are frequently surveyed.
In studies with surveys, the letter (in hard copy or e-mail) to potential subjects must be carefully composed. It may be your only chance to persuade the subject to invest the time needed to complete the questionnaire. You must sell the reader on the importance of both your study and his or her response. The tone of your letter will be the potential subject’s only image of you as a person; yet, for many subjects, their response to the perception of you as a person most influences their decision about completing the questionnaire. Seek examples of letters sent by researchers who have had high response rates, and save letters you receive that you responded positively to. You also might pilot-test your letter on individuals who can give you feedback about their reactions to the letter’s tone.
The use of follow-up e-mails, letters, or cards has been repeatedly shown to raise response rates to surveys. The timing is important. If too long a period has lapsed, the potential subject may have deleted the questionnaire from his or her e-mail box or discard the mailed copy. Sending the follow-up too soon, however, could be offensive. Baker (1985) described her strategies for following up on questionnaires:
Before the questionnaires are emailed or mailed, precise plans need to be made for monitoring the return of each questionnaire as a means of follow-up procedure. A bar graph could be developed to record the return of each questionnaire as a means of suggesting when the follow-up mailing or email should occur. The cumulative number and percentage of responses would then be logged on the graph to reflect the overall data collection process. When the daily responses decline, a follow-up, first-class mailing or email could be sent, containing another questionnaire and a modified cover letter. Study participants and questionnaires are assigned the same code numbers, and nonrespondents are identified by checking the list of code numbers of unreturned questionnaires. A third follow-up questionnaire with a further modified cover letter could be emailed or mailed to increase the return rate for the questionnaires.
The factors involved in the decision of whether to respond to a questionnaire are not well understood. One obvious factor is the time required to respond; this includes the time needed to orient to the directions and the emotional energy necessary to deal with the threats and anxieties generated by the questions. There is also a cognitive demand for thinking. Subjects seem to make a judgment about the relevance of the research topic and the potential for personal application of findings. Previous experience with questionnaires is also a deciding factor.
Traditionally, subjects for nursing studies have been sought in the hospital setting. However, access to these subjects is becoming more difficult—in part because of the larger numbers of nurses and other health care professionals now conducting research. The largest involvement of research subjects within a health care agency usually occurs with medical research and mainly with clinical trials that include large samples (Hellard, Sinclair, Forbes, & Fairley, 2001; Sullivan-Bolyai et al., 2007). Nurse researchers and other clinicians are now recruiting subjects from a variety of settings. An initial phase of recruitment may involve obtaining community and institutional support for the study. Support from other health care professionals, such as nurses and physicians, may be critical to the successful recruitment of subjects.
Recruitment of subjects for clinical trials requires a different set of strategies because the recruitment may be occurring simultaneously in several sites (perhaps in different cities). Many of these studies never achieve their planned sample size. The number of subjects meeting the sampling criteria who are available in the selected clinical sites may not be as large as anticipated. Researchers must often screen twice as many patients as are required for the study to obtain a sufficient sample size. Screening logs must be kept during the recruiting period to record data on patients who met the criteria but were not entered into the study. Researchers commonly underestimate the amount of time required to recruit subjects for a clinical study. In addition to defining the number of subjects and the time set aside for recruitment, it may be helpful to develop short-term or interim recruitment goals designed to maintain a constant rate of patient entry. Hellard et al. (2001) studied methods to improve the recruitment and retention of subjects in clinical trials and found that the four most important strategies were to (1) use nonaggressive recruitment methods, (2) maintain regular contact with the participants, (3) ensure that the participants are kept well informed of the study’s progress, and (4) constantly encourage subjects to continue participation. Another source is Sullivan-Bolyai et al. (2007), who identified the barriers and strategies to improve the recruitment of study participants from clinical settings (Table 14-2).
TABLE 14-2
Barriers to Recruitment with Actions and Strategies for Engaging Health Care Providers in the Referral Process
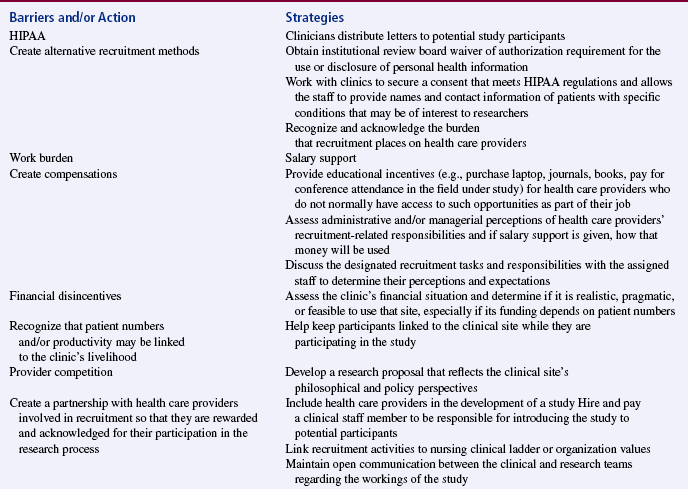

From Sullivan-Bolyai, S., Bova, C., Deatrick, J. A., Knafl, K., Grey, M., Leung, K., et al. (2007). Barriers and strategies for recruiting study participants in clinical settings. Western Journal of Nursing Research, 29(4), 498–499.
Studies may also benefit from the endorsement of community leaders, such as city officials; key civic leaders; and leaders of social, educational, religious, or labor groups. In some cases, these groups may be involved in planning the study, leading to a sense of community ownership of the project. Community groups may also help researchers to recruit subjects for the study. Sometimes, subjects who meet the sampling criteria are found in the groups assisting with the study. Endorsement may involve letters of support and, in some cases, funding. These activities can add legitimacy to your study and make involvement in the study more attractive to potential subjects (Alvarez, Vasquez, Mayorga, Feaster, & Mitrani, 2006).
Media support can be helpful in recruiting subjects. Researchers can place advertisements in local newspapers and church and neighborhood bulletins. Radio stations can make public service announcements. Members of the research team can speak to groups relevant to the study population. Your team can place posters in public places, such as supermarkets, drugstores, and public laundries. With permission, you can set up tables in shopping malls with a member of the research team present to recruit subjects.
Dombeck (2003) used multiple recruitment strategies to obtain a sample of 36 nurses for a qualitative ethnographic study to explore how nurses construe and understand their professional culture, including gender and race, and their professional personhood. The following excerpt from her study describes the different recruitment strategies used and the numbers of subjects obtained with each strategy.
Retaining Subjects
One of the serious problems in many studies is subject retention. Often, subject attrition cannot be avoided. Subjects move, die, or withdraw from a treatment. If you must collect data at several points over time, subject mortality can become a problem. Subjects who move frequently and those without phones pose a particular problem. A number of strategies have been found to be effective in maintaining the sample. For instance, it is a good idea to obtain the names, addresses, and phone numbers (cell and home numbers if possible) of at least two family members or friends when you enroll the subject in the study. Ask if the subject would agree to give you access to unlisted phone numbers in the event that the subject changes his or her number.
In some studies, the subject is reimbursed for participation. A bonus payment may be included for completing a certain phase of the study. Gifts can be used in place of money. Sending greeting cards for birthdays and holidays helps maintain contact. Rudy, Estok, Kerr, and Menzel (1994) compared the effect on recruitment and retention of money versus gifts. They found no differential effect on recruitment but found that money was more effective than gifts in retaining subjects in longitudinal studies. However, the researchers pointed out the moral issues related to providing monetary payment to subjects. This strategy can compromise the voluntariness of participation in a study and particularly has the potential of exploiting low-income persons.
Collecting data takes time. Always keep in mind that the subject’s time is valuable and should be used frugally. During data collection, it is easy to begin taking the subject for granted. Taking time for social amenities with subjects may pay off. However, take care that these interactions do not influence the data being collected. Beyond that, nurturing subjects participating in the study is critical. In some situations, providing refreshments and pleasant surroundings helps. Often, during the data collection phase, you also must nurture others who interact with the subjects; these may be volunteers, family, staff, students, or other professionals. It is important to maintain a pleasant climate for the data collection process, which will pay off in the quality of data collected and the retention of subjects.
Qualitative studies and longitudinal studies require extensive time commitment from the subjects. They are asked to participate in detailed interviews or to complete numerous forms at various intervals during a study (Marshall & Rossman, 2006; Patton, 2002). Sometimes data are collected with diaries that require daily entries over a set period of time. These studies face the greatest risk of participant mortality. Barnard, Magyary, Booth, and Eyres (1987) described the extensive sample maintenance procedures required for their longitudinal study in the following excerpt.
In summary, subjects who have a personal investment in the study are more likely to continue participating. This investment occurs through interactions with and nurturing by the researcher. A combination of the subject’s personal belief in the significance of the study, perceived altruistic motives of the researcher in conducting the study, the ethical actions of the researcher, and nurturing support provided by the researcher during data collection can greatly diminish subject attrition (Madsen et al., 2002). The recruitment and retention of subjects will continue to be significant challenges for researchers, and creative strategies are needed to manage these challenges.
SUMMARY
• Sampling involves selecting a group of people, events, behaviors, or other elements with which to conduct a study. Sampling denotes the process of making the selections; sample denotes the selected group of elements.
• A sampling plan is developed to increase representativeness, decrease systematic bias, and decrease the sampling error; there are two main types: probability and nonprobability sampling plans.
• Four sampling designs have been developed to achieve probability sampling: simple random sampling, stratified random sampling, cluster sampling, and systematic sampling.
• In nonprobability (nonrandom) sampling, not every element of the population has an opportunity for selection in the sample. The five nonprobability sampling designs described in this textbook are (1) convenience sampling, (2) quota sampling, (3) purposive sampling, (4) network sampling, and (5) theoretical sampling.
• In quantitative studies, sample size is best determined by a power analysis, which is calculated using the level of significance (αα = 0.05, 0.01, or 0.001), standard power of 0.8, and effect size.
• The number of participants in a qualitative study is adequate when saturation of information is achieved in the study area, which occurs when additional sampling provides no new information, only redundancy of previously collected data. Important factors that must be considered in determining sample size to achieve saturation of data are (1) scope of the study, (2) nature of the topic, (3) quality of the data, and (4) study design.
• The three common settings for conducting nursing research are natural, partially controlled, and highly controlled. A natural setting, or field setting, is an uncontrolled, real-life situation or environment. A partially controlled setting is an environment that the researcher has manipulated or modified in some way. A highly controlled setting is an artificially constructed environment developed for the sole purpose of conducting research.
• Recruiting and retaining subjects have become significant challenges in research, and this chapter includes some strategies to assist researchers with these challenges so their samples might be more representative of their target population.
REFERENCES
Alvarez, R.A., Vasquez, E., Mayorga, C.C., Feaster, D.J., Mitrani, V.B. Increasing minority research participation through community organization outreach. Western Journal of Nursing Research. 2006;28(5):541–560.
Andrews, J.O., Felton, G., Wewers, M.E., Waller, J., Tingen, M. The effect of a multi-component smoking cessation intervention in African American women residing in public housing. Research in Nursing & Health. 2007;30(1):45–60.
Baker, C.M. Maximizing mailed questionnaire responses. Image: Journal of Nursing Scholarship. 1985;17(4):118–121.
Bakitas, M.A. Background noise: The experience of chemotherapy-induced peripheral neuropathy. Nursing Research. 2007;56(5):323–331.
Barhyte, D.Y., Redman, B.K., Neill, K.M. Population or sample: Design decision. Nursing Research. 1990;39(5):309–310.
Barnard, K.E., Magyary, D.L., Booth, C.L., Eyres, S.J. Longitudinal designs: Considerations and applications to nursing research. Recent Advances in Nursing. 1987;17:37–64.
Bay, E., Hagerty, B.M., Williams, R.A. Depressive symptomatology after mild-to-moderate traumatic brain injury: A comparison of three measures. Archives of Psychiatric Nursing. 2007;21(1):2–11.
Beck, C.T. Statistical power analysis in pediatric nursing research. Issues in Comprehensive Pediatric Nursing. 1994;17(2):73–80.
Borenstein, M., Cohen, J. Statistical power analysis (Release: 1.00). Hillsdale, NJ: Erlbaum, 1989.
Brent, E.E., Jr., Scott, J.K., Spencer, J.C. Ex-Sample™: An expert system to assist in designing sampling plans. In User’s guide and reference manual (Version 2.0). Columbia, MO: The Idea Works; 1988.
Cochran, W.G. Sampling techniques, (3rd ed.). New York: Wiley, 1977.
Cohen, J. Statistical power analysis for the behavioral sciences, (2nd ed.). New York: Academic Press, 1988.
Corbie-Smith, G., Thomas, S.B., Williams, M.V., Moody-Ayers, S. Attitudes and beliefs of African Americans toward participation in medical research. Journal of General Internal Medicine. 1999;14(9):537–546.
Coté-Arsenault, D., Morrison-Beedy, D. Women’s voices reflecting changed expectations for pregnancy after perinatal loss. Journal of Nursing Scholarship. 2001;33(3):239–244.
Coyne, I.T. Sampling in qualitative research.Purposeful and theoretical sampling; merging or clear boundaries. Journal of Advanced Nursing. 1997;26(3):623–630.
Dombeck, M.T. Work narratives: Gender and race in professional personhood. Research in Nursing & Health. 2003;26(5):351–365.
Floyd, J.A. Systematic sampling: Theory and clinical methods. Nursing Research. 1993;42(5):290–293.
Flynn, L. Extending work environment research into home health settings. Western Journal of nursing Research. 2007;29(2):200–212.
Fulmer, T. Recruiting older adults in our studies [Editorial]. Applied Nursing Research. 2001;14(2):63.
Glaser, B.G., Strauss, A.L. The discovery of grounded theory: Strategies for qualitative research. Chicago: Aldine, 1967.
Green, J., Thorogood, N. Qualitative methods for health research. Thousand Oaks, CA: Sage, 2004.
Hellard, M.E., Sinclair, M.I., Forbes, A.B., Fairley, C.K. Methods used to maintain a high level of participant involvement in a clinical trial. Journal of Epidemiology and Community Health. 2001;55(5):348–351.
Hendrickson, S.G. Video recruitment of non-English-speaking participants. Western Journal of Nursing Research. 2007;29(2):232–242.
Im, E., Chee, W., Guevara, E., Liu, Y., Lim, H., Tsai, H., et al. Gender and ethnic differences in cancer pain experience: A multiethnic survey in the United States. Nursing Research. 2007;56(5):296–306.
Kerlinger, F.N., Lee, H.B. Foundations of behavioral research, (4th ed.). Fort Worth, TX: Harcourt College Publishers, 2000.
Kraemer, H.C., Thiemann, S. How many subjects? Statistical power analysis in research. Newbury Park, CA: Sage, 1987.
Larson, E. Exclusion of certain groups from clinical research. Image: Journal of Nursing Scholarship. 1994;26(3):185–190.
Leidy, N.K., Weissfeld, L.A. Sample sizes and power computation for clinical intervention trials. Western Journal of Nursing Research. 1991;13(1):138–144.
Levy, P.S., Lemsbow, S. Sampling for health professionals. Belmont, CA: Lifetime Learning, 1980.
Lincoln, Y.S., Guba, E.G. Naturalistic inquiry. Beverly Hills, CA: Sage, 1985.
Madsen, S.M., Mirza, M.R., Holm, S., Hilsted, K.L., Kampmann, K., Riis, P. Attitudes towards clinical research amongst participants and nonparticipants. Journal of Internal Medicine. 2002;251(2):156–168.
Marshall, C., Rossman, G.B. Designing qualitative research, (4th ed.). Thousand Oaks, CA: Sage, 2006.
McCain, N.L., Munjas, B.A., Munro, C.L., Elswick, R.K., Jr., Robins, J.L.W., Ferreira-Gonzalez, A., et al. Effects of stress management on PNI-based outcomes in persons with HIV disease. Research in Nursing & Health. 2003;26(2):102–117.
Melnyk, B.M., Fineout-Overholt, E. Evidence-based practice in nursing & healthcare: A guide to best practice. Philadelphia: Lippincott Williams & Wilkins, 2005.
Mitchell, E.S., Woods, N.F., Lentz, M.J. Differentiation of women with three perimenstrual symptom patterns. Nursing Research. 1994;43(1):25–30.
Moody, L.E., Wilson, M.E., Smyth, K., Schwartz, R., Tittle, M., Van Cott, M.L. Analysis of a decade of nursing practice research: 1977–1986. Nursing Research. 1988;37(6):374–379.
Morse, J.M. Designing funded qualitative research. In: Denzin N.K., Lincoln Y.S., eds. Strategies of qualitative inquiry. Thousand Oaks, CA: Sage; 1998:56–85.
Morse, J.M. Determining sample size. Qualitative Health Research. 2000;10(1):3–5.
Munhall, P.L. Nursing research: A qualitative perspective, (3rd ed.). Sudbury, MA: Jones & Bartlett, 2001.
Neumark, D.E., Stommel, M., Given, C.W., Given, B.A. Brief report: Research design and subject characteristics predicting nonparticipation in panel survey of older families with cancer. Nursing Research. 2001;50(6):363–368.
Papadopoulos, I., Lees, S. Developing culturally competent researchers. Journal of Advanced Nursing. 2002;37(3):258–264.
Patton, M.Q. Qualitative evaluation and research methods, (3rd ed.). Thousand Oaks, CA: Sage, 2002.
Peat, J.K., Mellis, C., Williams, K., Xuan, W. Health science research: A handbook of quantitative methods. Thousand Oaks, CA: Sage, 2002.
Pletsch, P.K., Howe, C., Tenney, M. Recruitment of minority subjects for intervention research. Image: Journal of Nursing Scholarship. 1995;27(3):211–215.
Rasmussen, N.A., Farr, L.A. Effects of morphine and time of day on pain and beta-endorphin. Biological Research for Nursing. 2003;5(2):105–116.
Rew, L. A theory of taking care of oneself grounded in experiences of homeless youth. Nursing Research. 2003;52(4):234–241.
Rice, M., Bunker, K.D., Kang, D., Howell, C.C., Weaver, M. Accessing and recruiting children for research in schools. Western Journal of Nursing Research. 2007;29(4):501–514.
Rivers, D.L., Aday, L.A., Frankowski, R.F., Felknor, S., White, D., Nichols, B. Predictors of nurses’ acceptance of an intravenous catheter safety device. Nursing Research. 2003;52(4):249–255.
Rudy, E.B., Estok, P.J., Kerr, M.E., Menzel, L. Research incentives: Money versus gifts. Nursing Research. 1994;43(4):253–255.
Sandelowski, M. Sample size in qualitative research. Research in Nursing & Health. 1995;18(2):179–183.
Sandelowski, M. Combining qualitative and quantitative sampling, data collection, and analysis techniques in mixed-method studies. Research in Nursing & Health. 2000;23(3):246–255.
Sullivan-Bolyai, S., Bova, C., Deatrick, J.A., Knafl, K., Grey, M., Leung, K., et al. Barriers and strategies for recruiting study participants in clinical settings. Western Journal of Nursing Research. 2007;29(4):486–500.
Tolle, S.W., Tilden, V.P., Rosenfeld, A.G., Hickman, S.E. Family reports of barriers to optimal care of the dying. Nursing Research. 2000;49(6):310–317.
Ulrich, C.M., Danis, M., Ratcliffe, S.J., Garrett-Mayer, E., Koziol, D., Soeken, K.L., et al. Ethical conflict in nurse practitioners and physician assistants in managed care. Nursing Research. 2006;55(6):391–401.
Yarandi, H.N. Planning sample sizes: Comparison of factor level means. Nursing Research. 1991;40(1):57–58.
Yates, F. Sampling methods for censuses and surveys. New York: Macmillan, 1981.