Selecting a Quantitative Research Design
A design is the blueprint for conducting a study that maximizes control over factors that could interfere with the validity of the findings. A research design gives you greater control and thus improves the validity of your study. To select an appropriate research design, you will need to integrate many elements. Chapter 10 began with questions that will help you select a design or identify by name the design of a study you are appraising. But identifying the design of a published study is not always easy, because many published studies do not identify the design used. Determining the design may require you to put together bits of information from various parts of the research report.
This chapter describes the designs most commonly used in nursing research, using the design categories described in Chapter 3: descriptive, correlational, quasi-experimental, and experimental. Descriptive and correlational designs examine variables in natural environments and do not include researcher-designed treatments or interventions. Quasi-experimental and experimental designs examine the effects of an intervention by comparing differences between groups that have received the intervention and those that have not received the intervention. As you review each design, note the threats to validity controlled by the design, keeping in mind that uncontrolled threats in the design you choose may weaken the validity of your study. Table 11-1 lists the designs discussed in this chapter. After the descriptions of the designs, we provide a series of decision trees that will help you to select the appropriate design or to identify the design used in a published study.
TABLE 11-1
Typical descriptive study designs
Comparative descriptive study designs
Descriptive correlational designs Predictive designs
Quasi-experimental study designs
Nonequivalent comparison group studies
One-group posttest-only designs
Posttest-only designs with comparison group
One-group pretest-posttest designs
Pretest and posttest designs with a comparison group
Pretest and posttest designs with two comparison treatments
Pretest and posttest designs with two comparison treatments and a standard or routine care group
Pretest and posttest designs with a removed treatment
Pretest and posttest designs with a reversed treatment
Interrupted time-series designs
Simple interrupted time-series designs
Interrupted time-series designs with a no-treatment comparison group
Interrupted time-series designs with multiple treatment replications
Experimental posttest-only comparison group designs
Investigators have always developed designs to meet emerging research needs. In the 1930s, Sir Ronald A. Fisher (1935) developed the first experimental designs, which were published in a book titled The Design of Experiments. However, most work on design has been conducted since the 1970s. Since this time, designs have become much more sophisticated and varied. There is no universal standard for categorizing designs. Names of designs change as various authors discuss them. Researchers sometimes merge elements of several designs to meet the research needs of a particular study. From these developments, new designs sometimes emerge.
Originally, only experimental designs were considered of value. In addition, many believed that the only setting in which an experiment can be conducted is a laboratory, where stricter controls can be maintained than in a field or natural setting. This approach is appropriate for the natural sciences but not for the social sciences. From the social sciences have emerged additional quantitative designs (descriptive, correlational, and quasi-experimental), methodological designs, and qualitative designs. The epidemiology, public health, and community health fields have presented time-series designs, health promotion designs, and prevention designs.
At present, nurse researchers are using designs developed in other disciplines, such as psychology, that meet the needs of that discipline. Will these designs be effective in adding to the knowledge base required for nursing? These designs are a useful starting point, but nurse scientists must go beyond these designs to develop designs that will more appropriately meet the needs of the nursing community. To go beyond current designs, nurse scientists must have a working knowledge of available designs and of the logic on which they are based. Designs created to meet nursing needs should be congruent with nursing philosophy. They must provide a means for nurses to examine dimensions of nursing within a holistic framework and to review those dimensions over time. Designs must be developed that can seek answers to important nursing questions rather than answering only questions that can be examined by existing designs.
Innovative design strategies are beginning to appear within nursing research. One example is the intervention research design described in Chapter 13. Developing designs to study the outcomes of nursing actions is also important. This emerging field of research in nursing is described in Chapter 12. Nurse researchers must see themselves as credible scientists before they will dare to develop new design strategies that will explore little-understood aspects of nursing. To develop a new design, the researcher must carefully consider possible threats to validity and ways to diminish them. She or he must also be willing to risk the temporary failures that are always inherent in the development of something new.
DESCRIPTIVE STUDY DESIGNS
Descriptive study designs (Table 11-1) are crafted to gain more information about characteristics within a particular field of study. Their purpose is to provide a picture of situations as they naturally happen. In many aspects of nursing, a phenomenon must be clearly delineated before prediction or causality can be examined. A descriptive design may be used to develop theory, identify problems with current practice, justify current practice, make judgments, or determine what others in similar situations are doing. Variables are not manipulated and there is no treatment or intervention. Dependent and independent variables should not be used within a descriptive design, because the design involves no attempt to establish causality.
Descriptive designs vary in levels of complexity. Some contain only two variables, whereas others may have multiple variables. The relationships among variables present an overall picture of the phenomenon being examined, but examination of types and degrees of relationships is not the primary purpose of a descriptive study. Protection against bias (or threat to the validity) in a descriptive design is achieved through (1) links between conceptual and operational definitions of variables, (2) sample selection and size, (3) the use of valid and reliable instruments, and (4) data collection procedures that achieve some environmental control.
Typical Descriptive Study Designs
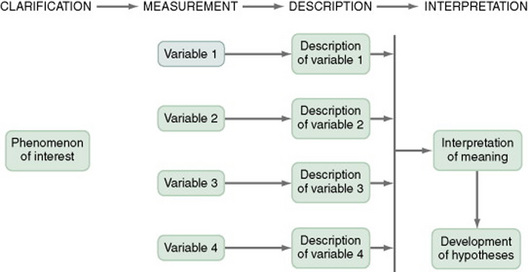
Figure 11-1 presents the commonly used descriptive study design. The design examines characteristics of a single sample. It identifies a phenomenon of interest and the variables within the phenomenon, develops conceptual and operational definitions of the variables, and describes the variables. The description of the variables leads to an interpretation of the theoretical meaning of the findings and provides knowledge of the variables and the study population that can be used for future research in the area.
Most studies contain descriptive components; however, the methodology of some studies is confined to the typical descriptive design. This is a critically important design for acquiring knowledge in an area in which little research has been conducted. An example of a descriptive design is the Rodehorst, Wilhelm, and Stepans (2006) study of asthma in rural elementary school children. The following excerpt describes the design of their study.
This is a descriptive study because there is no treatment, the researchers measure the variables of children who are at risk of asthma, (FEV[1]), (FVC), (PEF), (FEF[25-75]); and children who sought and obtained follow-up from their primary health care provider and were given a definitive diagnosis of asthma, and described the results of measuring the variables. Some descriptive studies use questionnaires (surveys) to describe an identified area of concern. For example, Yoon and Black (2006) distributed a questionnaire to 63 caregivers of children with sickle-cell disease to determine the prevalence and types of complementary therapies used for pain management (full-text article available in CINAHL). Other descriptive studies obtain data from retrospective chart review. For example, Kline and Edwards (2007) conducted a chart review to describe the effectiveness of intrapartum intravenous (I.V.) insulin on antepartum and intrapartum diabetic control of the mother and on the occurrence and severity of hypoglycemia in the neonate (full-text article available in CINAHL).
This is a descriptive design because there is no treatment or intervention, the researchers measured the variables of intrapartum I.V. insulin, antepartum diabetic control, intrapartum diabetic control, and hypoglycemia in the neonate. The results were a description of the measures of these variables.
It is not uncommon for researchers using a descriptive design to combine quantitative descriptive methods and qualitative methods (triangulation of method). To use this strategy, consult with a researcher experienced in using qualitative methods or include this person as a research partner to appropriately collect qualitative data and interpret it. Meghani and Keane (2007) used quantitative and qualitative methods in their study of preference for analgesic treatment for cancer patients among African Americans (the full-text article is available in CINAHL). The authors used demographic data, the Brief Pain Inventory, and in-depth semistructured interviews. Their sample of 35 patients was from three outpatient oncology clinics. Their study identified the major sources of anxiety described by this sample. The goal of their study was to improve our understanding of patient needs and assist in the development of specific interventions that might alleviate the problem.
Comparative Descriptive Designs
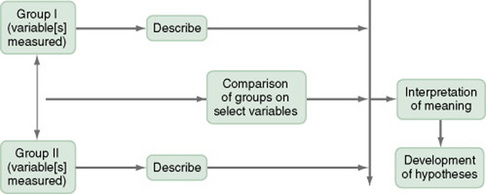
The comparative descriptive design (Figure 11-2) examines and describes differences in variables in two or more groups that occur naturally in the setting. Descriptive statistics and inferential statistical analyses may be used to examine differences between or among groups. Commonly, the results obtained from these analyses are not generalized to a population because the description is to a very specific sample and would not necessarily apply to a larger population. An example of this design is the study by Cramer, Chen, Roberts, and Clute (2007) of the social and economic impact of community-based prenatal care. The following extract describes the study.
This is a comparative descriptive design because there is no treatment or intervention; the researchers describe variables of incidence of case management, home visits, screening, referral, transportation, and health education, as well as outcomes of low birth weight, infant mortality, adequacy of care, trimester of care, and costs of care in three groups: OHS birth mothers, non-OHS birth mothers, and Douglas County birth mothers yearly for three years. Results of the study were comparisons across the three years and across the three groups.
Time-Dimensional Designs
Time-dimensional designs were developed within the discipline of epidemiology, a field that studies the occurrence and distribution of disease among populations. These designs examine sequences and patterns of change, growth, or trends over time. The dimension of time, then, becomes an important factor. Within the field of epidemiology, the samples in time-dimensional studies are called cohorts. Originally, cohorts were age categories; however, the concept has been expanded to apply to groups distinguished by many other variables. Other means of classifying populations that have relevance in relation to time are time of diagnosis, point of entry into a treatment protocol, point of entry into a new lifestyle, and age at which the subject started smoking. An understanding of temporal sequencing is an important prerequisite to examining causality between variables. Thus, the results of these designs lead to description of trends, processes, patterns, and changes over time as well as the development of hypotheses, and are often forerunners of experimental designs.
Epidemiological studies that use time-dimensional designs determine the risk factors or causal factors of illness states. Cause determined in this manner is called inferred causality. These studies also examine trends, patterns, processes, and changes over time. The best-known studies in this area are those on smoking and cancer. Because of the strength of studies that have undergone multiple repetitions, the causal link is strong. The strategy is not as powerful as experimental designs in supporting causality; however, in this situation, as in many nursing contexts, one can never ethically conduct a true experiment. A true experiment requires that there be an experimental group (who would not smoke) and a control group (who smokes). The two groups must be randomly assigned to groups. Therefore, without being provided a choice, some individuals would be required to smoke while others would be required to abstain from smoking over a long period of time.
Epidemiologists use two strategies to examine changes over time: retrospective studies and prospective studies. The norm in epidemiological studies is to use the word cohorts to refer to groups of subjects in prospective studies, but the term is generally not used in retrospective studies. In retrospective studies, both the proposed cause and the proposed effect have already occurred. For example, the subjects could have a specific type of cancer, and the researcher could be searching for commonalities among subjects that may have led to the development of that type of cancer. In a prospective cohort study, causes may have occurred, but the proposed effect has not.
The Framingham study is the best-known example of a prospective study (U.S. Department of Health and Human Services, 1968). In this study, researchers monitored members of a community for 20 years and examined variables such as dietary patterns, exercise, weight, and blood lipid levels. As the subjects experienced illnesses, such as heart disease, hypertension, or lung disease, their illnesses could be related to previously identified variables.
Prospective studies are considered more powerful than retrospective studies in inferring causality, because the researcher can demonstrate that the risk factors occurred before the illness and are positively related to the illness. Both designs are important for use in nursing studies, because a person’s responses to health situations are patterns that developed long before the health situation occurred. These patterns then influence the person’s responses to nursing interventions.
Several designs are used to conduct time-dimensional studies: longitudinal, cross-sectional, trend, and event or treatment partitioning.
Longitudinal Designs
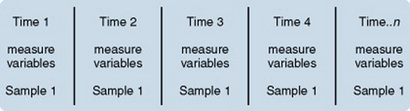
Longitudinal designs examine changes in the same subjects over an extended period. They are sometimes called panel designs (Figure 11-3). Longitudinal designs are expensive and require a long period of researcher and subject commitment. The area to be studied, the variables, and their measurement must be clearly identified before data collection begins. Measurement must be carefully planned and implemented because the measures will be used repeatedly over time. If children are being studied, the measures must be valid for all the ages being studied. To use this design, you must be familiar with how the construct being measured changes, is patterned and trended over time and give a clear rationale for the points of time you have selected for measurement. There is often a bias in selection of subjects because of the requirement for a long-term commitment. In addition, loss of subjects (mortality—not that the subject dies but that the subject quits participating in the study) can be high and can decrease the validity of findings.
Power analysis must be calculated according to the number of subjects expected to complete the study, not the number recruited initially. As a researcher, you must invest considerable energy in developing effective strategies to maintain the sample; Chapter 10 examined some strategies used for this purpose The period during which subjects will be recruited into the study must be carefully planned, and a time line depicting data collection points for each subject must be developed to enable planning for the numbers and availability of data collectors. If this issue is not carefully thought out, data collectors may be confronted with the need to recruit new subjects while they are attempting to collect data scheduled for subjects recruited earlier. You must also decide whether you will use a single data collector to attain all data from a particular subject or whether you will use a different data collector at each point to ensure that data are collected blindly.
Because of the large volumes of data acquired in a longitudinal study, you must give careful attention to strategies for managing the data. The repetition of measures requires that data analysis be carefully thought through. Analyses commonly used are repeated measures analyses of variance, multivariate analyses of variance (MANOVA), regression analysis, cluster analysis, and time-series analysis.
An example of a longitudinal design is the study by Baird and Sands (2006). An abstract of that study follows.
Cross-Sectional Designs
Cross-sectional designs examine groups of subjects in various stages of development, trends, patterns, and changes simultaneously with the intent to describe changes in the phenomenon across stages (Figure 11-4). The assumption is that the stages are part of a process that will progress over time. Selecting subjects at various points in the process provides important information about the totality of the process, even though the same subjects are not monitored through the entire process. The processes of development selected for the study might be related to age, position in an educational system, growth pattern, or stages of maturation or personal growth (if they could be clearly enough defined to develop criteria for inclusion within differentiated groups or disease stages). Subjects are then categorized by group, and data on the selected variables are collected at a single point in time.
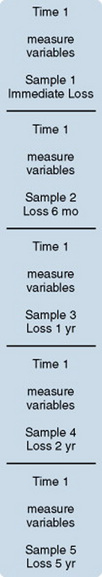
For example, suppose you wish to study grief reactions at various periods after the death of a spouse. With a cross-sectional design, you could study a group of individuals whose spouse had died 1 week ago, another group composed of individuals whose loss occurred 6 months ago, and other groups whose losses occurred 1 year, 2 years, and 5 years ago, respectively. You could study all of these groups during one period of time, but you could describe a pattern of grief reactions over a 5-year period. The design is not as strong as the longitudinal design in which the same participants continue in the study over time and thus eliminate some variance, but it allows some understanding of the phenomenon over time when time allowed for the study is limited.
Sidani et al. (2007) conducted a cross-sectional study titled “Outcomes of Nurse Practitioners in Acute Care: An Exploration.” The following excerpts describe the design of their study.
Trend Designs
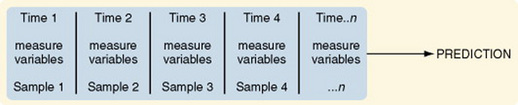
Trend designs examine changes in the general population in relation to a particular phenomenon (Figure 11-5). The researcher selects different samples of subjects from the same population at preset intervals of time, and at each selected time, he or she collects data from that particular sample. You must be able to justify generalizing from the samples to the population under study. Analysis involves strategies to predict future trends by examining past trends. An example of this design is the study by Hartley (2003) of “[l]ongitudinal analysis of access to health care, use of preventive health services, and practice of health-related behaviors of Appalachian and non-Appalachian adults in Kentucky.” The study is described as follows.
Event-Partitioning Designs
A merger of the cross-sectional or longitudinal and trend designs, the event-partitioning design, is used in some cases to increase sample size and to avoid the effects of history on the validity of findings. Cook and Campbell (1979) referred to these as cohort designs with treatment partitioning (Figures 11-6 and 11-7). The term treatment is used loosely here to mean a key event that is thought to lead to change. In a descriptive study, the researcher would not cause or manipulate the key event but rather would clearly define it so that when it occurred naturally, it would be recognized.
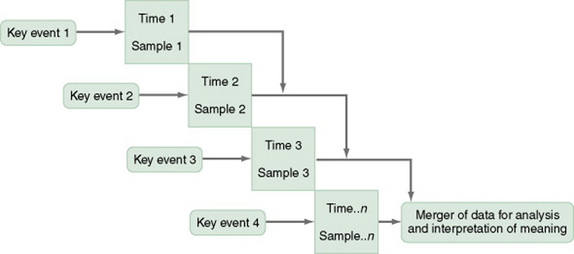
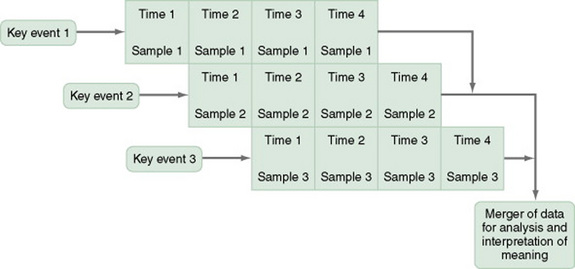
For example, you could use the event-partitioning design to study subjects who have completed programs to stop smoking. Smoking behaviors and incidence of smoking-related diseases might be measured at intervals of 1 year for a 5-year period. However, the number of subjects available at one time might be insufficient for you to adequately analyze findings. Therefore, you could use subjects from several programs offered at different times. You would examine the data in terms of the relative time since the subjects’ completion of the stop-smoking program, not the absolute length of time. Data would be assumed to be comparable, and a larger sample size would be available for analysis of changes over time.
An example of this design is Barnes-McDowell’s (1997) study on home apnea monitoring. The following excerpt describes the study design.
Case Study Designs
The case study design involves an intensive exploration of a single unit of study, such as a person, family, group, community, or institution, or a small number of subjects who are examined intensively. Although the number of subjects tends to be small, the number of variables involved is usually large. In fact, it is important to examine all variables that might have an impact on the situation being studied.
Case studies were commonly used in nursing research in the 1970s. Their use then declined, but they are beginning to appear in the literature more frequently today. Well-designed case studies are good sources of descriptive information and can be used as evidence for or against theories. Case studies can use a triangulated approach, incorporating both quantitative and qualitative methods in a case study. Sterling and McNally (1992) recommended single-subject case studies for examining process-based nursing practice. The strategy allows the researcher to investigate daily observations and interventions that are a common aspect of nursing practice. Dowd, Withers, Hackwood, and Shuter (2007) used a case study to examine communication impairments.
Case studies are commonly used in qualitative studies (Sandelowski, 1996). There are even experimental designs for single case studies (Barlow & Hersen, 1984). A variety of sources of information can be collected on each concept of interest through the use of different data collection methods. This approach allows researchers to perform a detailed study of all aspects of a single case. Such a strategy can greatly expand our understanding of the phenomenon under study.
Case studies also can demonstrate the effectiveness of specific therapeutic techniques. In fact, by reporting a case study, the researcher introduces the technique to other practitioners. The case study design also has potential for revealing important findings that can generate new hypotheses for testing. Thus, the case study can lead to the design of large sample studies to examine factors identified through the case study.
How you design a case study depends on the circumstances of the case but usually includes an element of time. History and previous behavior patterns are usually explored in detail. As the case study proceeds, you may become aware of components important to the phenomenon being examined that were not originally built into the study. A case study is likely to have both quantitative and qualitative elements, and you must incorporate these components into the study design. Methods used to analyze and interpret qualitative data need to be carefully planned. Consultation with a qualitative researcher can strengthen the study. Large volumes of data are generally obtained during a case study. Organizing the findings of a case study into a coherent whole is a difficult but critical component of the study. Generalizing study findings in the statistical sense is not appropriate; however, generalizing the findings to theory is appropriate and important (Barnard, Magyary, Booth, & Eyres, 1987; Crombie & Davies, 1996; Gray, 1998; Yin, 1984).
Not all case studies are research. Many of the articles referring to case studies are clinical practice articles, in which a clinical situation is reported for the purpose of illustrating clinical practice, problems in clinical practice, or changes that need to be made in clinical practice. These articles do not use research methods but rather describe events out of the patient record or the author’s personal experience.
SURVEYS
The term survey is used in two ways within scientific thought. It is used in a broad sense to mean any descriptive or correlational study; in this sense, survey tends to mean nonexperimental. In a narrower sense, survey is used to describe a data collection technique in which the researcher uses questionnaires (collected by mail or in person) or personal interviews to gather data about an identified population.
Surveys, in the narrower definition, are used to gather data that can be acquired through self-report. Because of this limitation in data, some researchers view surveys as rather shallow and as contributing in a limited way to scientific knowledge. This belief has led to a bias in the scientific community against survey research. In this context, the term survey is used derisively. However, surveys can be an extremely important source of data. In this text, we use the term survey to designate a data collection technique, not a design. Surveys can be used within many designs, including descriptive, correlational, and quasi-experimental studies.
CORRELATIONAL STUDY DESIGNS
Correlational study designs examine relationships among variables. The examination can occur at several levels. The researcher can seek to describe a relationship, predict relationships among variables, or test the relationships proposed by a theoretical proposition. In any correlational study, a representative sample must be selected for the study. That sample reflects the full range of values possible on the variables being measured. Thus, large samples are required. In correlational designs, a large variance in the variable values is necessary to determine the existence of a relationship. Therefore, correlational designs are unlike experimental designs, in which variance in variable scores is controlled (limited).
In correlational designs, if the range of scores is truncated, the obtained correlational value will be artificially depressed. Truncated means that the lowest values and the values either are not measured or are condensed and merged with less extreme values. For example, if an attitude scale were scored from a low score of 1 to a high score of 50, truncated scores might indicate only scores in the range 10 to 40. More extreme scores would be combined with scores within the designated range. If truncation is performed, the researcher may not find a correlation when the variables are actually correlated.
Neophyte researchers tend to make two serious errors with correlational studies. First, they often attempt to establish causality by correlation, reasoning that if two variables are related, one must cause the other. Second, they confuse studies in which differences are examined with studies in which relationships are examined. Although the existence of a difference assumes the existence of a relationship, the design and statistical analysis of studies examining differences are not the same as those examining relationships. If your study examines two or more groups in terms of one or more variables, then you are exploring differences between groups as reflected in scores on the identified variables. If your study examines a single group in terms of two or more variables, then you are exploring relationships between variables. In a correlational study, the relationship examined is that between two or more research variables within an identified situation. Thus, the sample is not separated into groups. Analyses examine variable values in the entire sample. In a correlational design, data from the entire sample are analyzed as a single group.
Descriptive Correlational Designs
A descriptive correlational design examines the relationships that exist in a situation. Using this design facilitates the identification of many interrelationships in a situation in a short time. While the descriptive design discussed earlier may reveal relationships among variables, the descriptive correlational design focuses specifically on relationships among study variables. Descriptive correlational studies may lead to hypotheses for later studies (Figure 11-8).
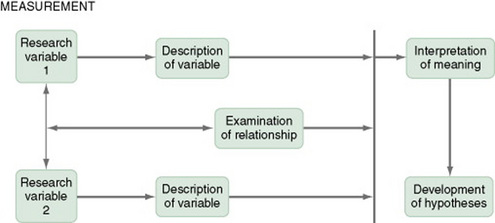
A descriptive correlational study may examine variables in a situation that has already occurred or is currently occurring. No attempt is made to control or manipulate the situation. As with descriptive studies, variables must be clearly identified and defined. An example of a descriptive correlational design is the study by Kacel, Millar, and Norris (2005) titled “Measurement of Nurse Practitioner Job Satisfaction in a Midwestern State.” The following text summarizes the study.
Purpose: To describe the current level of job satisfaction of nurse practitioners (NPs) in one Midwestern state.
Data Sources: This study utilized descriptive correlation design to examine factors that lead to job satisfaction and dissatisfaction among a randomized sample of licensed NPs from a Midwestern state. The sample of 147 NPs (63% return rate) completed self-administered questionnaires about various characteristics of their jobs. Descriptive statistics and correlations were used to analyze the data. The theoretical foundation for the study was Herzberg’s Dual Factor Theory of Job Satisfaction.
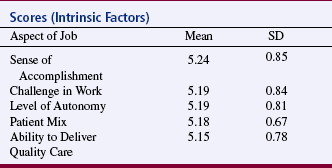
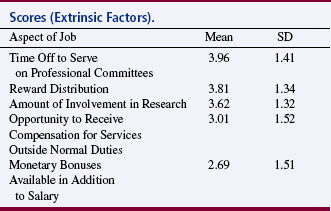
Conclusions: Overall job satisfaction of NPs was minimally satisfied to satisfied. NPs were most satisfied with intrinsic factors and least satisfied with extrinsic factors of their jobs. Factors NPs were most satisfied with were sense of accomplishment, challenge in work, level of autonomy, patient mix, and ability to deliver quality care. NPs were least satisfied with time off to serve on professional committees, reward distribution, amount of involvement in research, opportunity to receive compensation for services outside normal duties, and monetary bonuses available in addition to salary. NPs with 0-1 year practice experience were the most satisfied with their jobs, but satisfaction scores fell steadily with each additional year of experience, reaching a plateau between the 8th to 11th years of practice. Table 11-2 shows the areas of practice in which NPs were most satisfied and Table 11-3 shows the areas of practice in which NPs were least satisfied.
Implications for Practice: Improving job satisfaction for NPs is critical to recruit and retain advanced practice nurses to enhance access to quality, cost-effective care for all patient populations. Satisfied NPs can potentially reduce healthcare costs associated with employee turnover. Employers must look at extrinsic factors such as compensation and opportunities for professional growth to enhance NP job satisfaction. (Kacel et al., 2005; full-text article available in CINAHL)
This is a correlational study because there is no treatment or intervention, data are obtained from a single group, and correlational statistical analyses are used to examine relationships between variables. Descriptive statistics are used in this study to a greater extent than correlation analyses. However, correlational analyses were used to examine the relationships of the MNPJSS six subscales with some of the study variables including intrapractice partnership/collegiality, challenge/autonomy, professional, social, and community interaction, professional growth, time, and benefits. Statistical values obtained from the correlational analyses are not provided in the published study.
Predictive Designs
Predictive designs are used to predict the value of one variable on the basis of values obtained from another variable or variables. Prediction is one approach you can use to examine causal relationships between variables. Because causal phenomena are being examined, the terms dependent and independent are used to describe the variables. One variable (the one to be predicted) is classified as the dependent variable, and all other variables (those that are predictors) are classified as independent variables.
The aim of a predictive design is to predict the level of the dependent variable from the independent variables (Figure 11-9). Independent variables most effective in prediction are highly correlated with the dependent variable but not highly correlated with other independent variables used in the study. Predictive designs will require you to develop a theory-based mathematical hypothesis proposing the independent variables that are expected to predict the dependent variable effectively. You can then test the hypothesis using regression analysis. Predictive studies are also used to establish the predictive validity of measurement scales.

Huang et al. (2007) conducted a predictive correlational study called “Stressors, Depressive Symptoms, and Learned Resourcefulness among Taiwanese Adults with Diabetes Mellitus.” The following abstract describes this study:
This is a predictive correlational study because both correlational and regression analyses are used. Data are gathered from a single sample of 131 subjects. Correlational analyses were used to examine the relationships among demographic characteristics, stressors, learned resourcefulness, and depressive symptoms. Regression analyses revealed that duration of diabetes, number of complications, and glycemic control predicted depressive symptoms. HbA1C also predicted depressive symptoms. Learned resourcefulness and better glycemic control resulted in fewer depressive symptoms.
Model-Testing Designs
Some studies are designed specifically to test the accuracy of a hypothesized causal model. The model-testing design requires that all variables relevant to the model be measured. A large, heterogeneous sample is required. All the paths expressing relationships between concepts are identified, and a conceptual map is developed (Figure 11-10). The analysis determines whether or not the data are consistent with the model. For some studies, you might set aside data from some subjects and not include them in the initial path analysis. You might use these data to test the fit of the paths defined by the initial analysis in another data set.
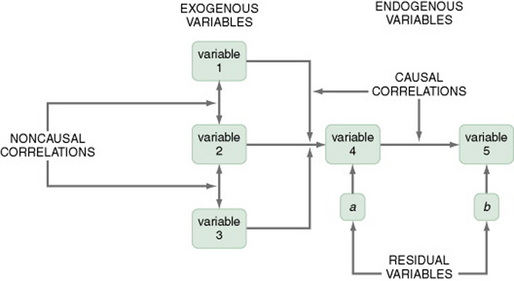
Variables are classified into three categories: exogenous variables, endogenous variables, and residual variables. Exogenous variables are within the theoretical model but are caused by factors outside of this model. Endogenous variables are those whose variation is explained within the theoretical model. Exogenous variables influence the variation of endogenous variables. Residual variables indicate the effect of unmeasured variables not included in the model. These variables explain some of the variance found in the data but not the variance within the model (Mason-Hawkes & Holm, 1989).
In Figure 11-10, the illustration of a model-testing design, paths are drawn to demonstrate directions of cause and effect. The arrows (paths) from the exogenous variables 1, 2, and 3 lead to the endogenous variable 4, indicating that variable 4 is theoretically proposed to be caused by variables 1, 2, and 3. The arrow (path) from endogenous variable 4 to endogenous variable 5 indicates that variable 4 theoretically causes variable 5.
To measure exogenous and endogenous variables, collect data from the subjects and analyze the accuracy of the proposed paths. Initially, these analysis procedures were performed with a series of regression analyses. Statistical procedures have been developed specifically for path analysis using the computer programs LISREL and EQS. Structural equation modeling is a statistical procedure commonly used. Path coefficients are calculated that indicate the effect that one variable has on another. The amount of variance explained by the model, as well as the fit between the path coefficients and the theoretical model, indicates the accuracy of the theory. Variance that is not accounted for in the statistical analysis is attributed to residual variables (variables a and b) not included in the analyses (Mason-Hawkes & Holm, 1989).
An example of this design is the Cummings, Estabrooks, Midodzi, Wallin, and Hayduk (2007) test of a model of the influence of organizational characteristics and context on research utilization in nursing.
DEFINING THERAPEUTIC NURSING INTERVENTIONS
In quasi-experimental and experimental studies, an intervention (or protocol) is developed that is expected to result in differences in posttest measures of the treatment and control or comparison groups. This intervention may be physiological, psychosocial, educational, or a combination of these and should be designed to maximize the differences between the groups. Thus, it should be the best intervention possible in the circumstances of the study, an intervention that is expected to improve the outcomes of the experimental group.
The nursing literature has not adequately addressed the methodology for designing interventions for nursing studies. In addition, descriptions of nursing interventions in published studies lack the specificity and clarity given to describing measurement instruments (Egan, Snyder, & Burns, 1992). Thus, nurse researchers provide detailed information about measurement but do not provide sufficient detail to allow a nurse to implement a nursing intervention as it was used in a published nursing study. To some extent, this may reflect the state of knowledge in the nursing field regarding the provision of nursing interventions in clinical practice. Clinical nursing interventions are not well defined; thus, each nurse may use her or his own terminology to describe a particular intervention. In addition, an intervention tends to be applied differently in each case by a single nurse and even less consistently by different nurses.
The Nursing Interventions Classification
The Nursing Interventions Classification (NIC) is a standardized language used to describe treatments performed by nurses. Each intervention consists of a label, a definition, and a set of activities performed by nurses carrying out the intervention. The intervention labels were derived from nursing education and nursing practice. The research methods used to develop the classification included content analysis, surveys, focus groups, similarity analysis, and hierarchical clustering.
Tripp-Reimer Woodworth, McCloskey, and Bulechek (1996), in their analysis of the structure of the NIC interventions, identified three dimensions: focus of care, intensity, and complexity. A high intensity of care is associated with the physiological illness level of the patient and the emergency nature of the illness. The dimension of intensity of care includes indicators of (1) intensity (or acuity) and (2) whether the care is typical or novel. The dimension of focus of care addresses (1) the target of the intervention, ranging from the individual to the system, (2) whether the care action is direct or on behalf of the patient, and (3) the continuum of practice from independent to collaborative actions. The dimension of complexity of care includes continua of degree of knowledge, skill, and urgency of the interventions.
The interventions in the NIC are being subjected to multiple studies examining the effects on different populations and the effects of varying degrees of intensity. Links are being established between the intervention and outcomes at varying points in time after the intervention has been implemented. Studies are also determining the outcomes of each intervention. Outcomes that occur immediately following the intervention are easiest to determine. However, the most important outcomes may be those that occur after a client has been discharged or several weeks or months after the intervention. This information is critical to justifying nursing actions in a cost-conscious market (Stewart & Archbold, 1992, 1993). For a more extensive discussion of the importance of linking interventions with outcomes measures, see Chapter 12. See Table 11-4 for a sample of the work in nursing related to the NIC and the Nursing Outcomes Classification (NOC).
TABLE 11-4
Work in Nursing Related to the NIC and the Nursing Outcomes Classification (NOC)
| Year | Author | Title |
| 1995 | Davis | AIDS nursing care and standardized nursing language: An application of the Nursing Intervention Classification |
| 1996 | Kirby | Classification of advanced practice nursing functions using the Nursing Intervention Classification taxonomy |
| 1996 | Micek et al. | Patient outcomes: The link between nursing diagnoses and interventions |
| 1996 | Bowles & Naylor | Nursing intervention classification systems |
| 1997 | Jones-Baucke | A qualitative study of the implementation of a system to increase nurses’ use of standardized nursing languages |
| 1997 | Henry & Meade | Nursing classification systems: Necessary but not sufficient for representing “what nurses do” for inclusion in computer-based patient record systems |
| 1997 | Redes & Lunney | Validation by school nurses of the Nursing Intervention Classification for computer software |
| 1998 | Corbett | Predictors and outcomes of home care for diabetics |
| 1999 | Boomsma, Dassen, Dingemans, & van den Heuvel | Nursing interventions in crisis-oriented and long-term psychiatric home care |
| 1999 | Coenen, Weis, Schank, & Matheus | Describing parish nurse practice using the Nursing Minimum Data Set |
| 2000 | Weis & Schank | Use of a taxonomy to describe parish nurse practice with older adults |
| 2001 | Wu & Thompson | Evaluation of the Nursing Intervention Classification for use by flight nurses |
| 2001 | O’Connor, Kershaw, & Hameister | Documenting patterns of nursing interventions using cluster analysis |
| 2002 | Solari-Twadell | The differentiation of the ministry of parish nursing practice within congregations |
| 2002 | Weis, Schank, Coenen, & Matheus | Parish nurse practice with client aggregates |
| 2002 | Winters | Primary prevention of agricultural injuries: use of standardized nursing diagnoses, interventions, and outcomes |
| 2003 | Blissitt, Roberts, Hinkle, & Kopp | Defining neuroscience nursing practice: The 2001 role delineation study |
| 2003 | Mrayyan | Nurse autonomy, nurse job satisfaction and client satisfaction with nursing care: their place in nursing data sets |
| 2003 | Jones | Reminiscence therapy for older women with depression: Effects of Nursing Intervention Classification in assisted-living long-term care |
| 2004 | Guimarães | Fluid management: a nursing intervention for the patient with fluid volume excess [Portuguese] |
| 2004 | Pallarés | Influence of transcultural factors on immigrants populations’ needs and nursing diagnosis [Spanish] |
| 2004 | Bassoli & Guimaraes | Wound care: Nursing activities in the assistance practice, compared to the activities proposed by the Nursing Intervention Classification (NIC) [Portuguese] |
| 2004 | McBride | Postdischarge nursing interventions for stroke survivors and their families |
| 2005 | Martins | Nursing interventions for the nursing diagnosis ineffective airway clearance [sic] [Portuguese] |
| 2005 | von Krogh, Dale, & Naden | A framework for integrating NANDA, NIC, and NOC terminology in electronic patient records |
| 2006 | Figoski & Downey | Perspectives in continuity of care: Facility charging and Nursing Intervention Classification (NIC): the new dynamic duo |
| 2006 | Sawada, Porter, Kayama, Setoya, & Miyamato | International nursing. Nursing care delivery in Japanese psychiatric units |
| 2006 | Villanueva, Thompson, Macpherson, Meunier, & Hilton | The Neuroscience Nursing 2005 Role Delineation Study: Implications for certification |
| 2007 | González-Gancedo & Fernández García | Care plan in a patient with spina bifida. Case report [Spanish] |
Designing an Intervention for a Nursing Study
The therapeutic nursing intervention provided in a nursing study needs to be carefully designed, clearly described, and well linked to the outcome measures (dependent variables) to be used in the study. Each of these dimensions must be considered to develop consistency in the intervention. The intervention needs to be provided consistently to all subjects. In some studies, you may need to develop a step-by-step protocol in order to control consistency. Educational treatments or educational components of treatments might be audio- or videotaped for consistency.
The first step in designing an intervention should be a thorough review of the clinical and research literature related to the intervention. Because of the sparsity of information in the literature on nursing interventions, you may need to rely on a personal knowledge base emerging from expertise in clinical practice. The nursing actions that are included in the intervention must be spelled out sequentially so that other nurses are able to follow the description and provide the intervention in a consistent manner. The intervention must be consistent in such areas as content, intensity, and length of time. If several caregivers are involved in providing the intervention, take care to protect the integrity of the intervention. You may need to employ a pilot study to refine the intervention so that it can be applied consistently.
QUASI-EXPERIMENTAL STUDY DESIGNS
Quasi-experimental and experimental designs examine causality. The power of the design to accomplish this purpose depends on the extent to which the actual effects of the experimental treatment (the independent variable) can be detected by measuring the dependent variable. Obtaining an understanding of the true effects of an experimental treatment requires action to control threats to the validity of the findings. Threats to validity are controlled through selection of subjects, control of the environment, manipulation of the treatment, and reliable and valid measurement of the dependent variables. These threats were described in Chapter 10.
Experimental study designs, with their strict control of variance, are the most powerful method of examining causality. For many reasons, both ethical and practical, however, experimental designs cannot always be used in social science research. Quasi-experimental study designs were developed to provide alternative means of examining causality in situations not conducive to experimental controls. Campbell and Stanley first described quasi-experimental designs as a group in 1963, when only experimental designs were considered of any worth. Cook and Campbell expanded this description in 1979. Quasi-experimental designs facilitate the search for knowledge and examination of causality in situations in which complete control is not possible. These designs have been developed to control as many threats to validity as possible in a situation in which at least one of the three components of true experimental design (randomization, comparison groups, and manipulation of the treatment) is lacking.
There are differences of opinion in nursing about the classification of a particular study as quasi-experimental or experimental. The experimental designs emerged from a logical positivist perspective with the purpose of determining cause and effect. The focus is to determine differences between groups using statistical analyses on the basis of decision theory (see Chapter 18 for an explanation of decision theory). The true experimental design (from a logical positivist view) requires the use of random sampling to obtain subjects, random assignment to control and experimental groups, rigorous control of the treatment, and designs that controlled threats to validity. Chapter 14 explains the various sampling methods.
A less rigorous type of experimental design is referred to as the comparative experimental design. Researchers in both nursing and medicine are using it for clinical situations in which the expectation of random sampling is difficult if not impossible to achieve. These studies use convenience samples with random assignment to groups. For example, clinical trials do not use randomly obtained samples but tend to be considered experimental in nature. These studies are classified as experimental because they have internal validity if the two groups are comparable on variables important to the study, even though there are biases in the original sample. However, these designs do not address threats to statistical conclusion validity and threats to external validity by the nonrandom sample. Threats to external validity have not, in the past, been considered a serious concern because they affect not the claim that the treatment caused a difference but rather the ability to generalize the findings. The importance of external validity, although discounted in the past, is taking on greater importance in the current political and health policy climate. Chapter 12, on outcomes research, explores the concerns some have about the validity of clinical trials.
Random Assignment to Groups
Random assignment to groups is a procedure used to assign subjects to treatment or control groups randomly. Random assignment is most commonly used in nursing and medicine to assign subjects obtained through convenience sampling methods to groups for purposes of comparison. Random assignment used without random sampling is purported to decrease the risk of bias in the selection of groups. However, Ottenbacher (1992) performed a meta-analysis to examine the effect of random assignment versus nonrandom assignment on outcomes. The results failed to reveal significant differences in these two sampling techniques. He suggested that previous assumptions about design strategies should be empirically tested. The term randomized clinical trial (RCT) usually means that the study used random assignment of subjects to groups, not that the sample was obtained through random sampling methods.
Traditional approaches to random assignment involve using a random numbers table or flipping an unbiased coin to determine group assignment. However, these procedures can lead to unequal group sizes and thus a decrease in power. Hjelm-Karlsson (1991) suggested using what is referred to as a biased coin design to randomly assign subjects to groups. With this technique, selection of the group to which a particular subject will be assigned is biased in favor of groups that have smaller sample sizes at the point of the assignment of that subject. This strategy is particularly useful when assignment is being made to more than two groups. The researcher can complete calculations for the sequencing of assignment to groups before collecting data, thus freeing the researcher for other activities during this critical period. Hjelm-Karlsson (1991) suggested using cards to make group assignments. The subject numbers and random group assignments are written on cards. As each subject agrees to participate in the study, the next card is drawn from the stack, indicating that subject’s number and group assignment.
Stout, Wirtz, Carbonari, and Del Boca (1994) suggested a similar strategy they referred to as urn randomization, which they described as follows.
These authors also provided strategies for balancing several variables simultaneously during random assignment.
Koniak-Griffin et al. (2003) used random assignment in their study of nurse visitation for adolescent mothers. They described their sampling procedure as follows.
Each of the quasi-experimental designs described in this section involves threats to validity owing to constraints in controlling variance. Some achieve greater amounts of control than others. When choosing designs, you must select the design that offers the greatest amount of control possible within your study situation. Even the first designs described in this section, which have low power in terms of establishing causality, can provide useful information on which to design later studies.
Comparison Groups
Control groups, traditionally used in experimental studies, are selected randomly from the same population as the experimental group and receive no treatment. Use of a control group increases the ability of the researcher to detect differences between groups in the real world. Thus, they reduce the risk of error. Control groups are rarely used in nursing or medical studies because of requirements related to consent, ethical issues regarding withholding treatment, and the difficulty of acquiring sufficient potential subjects from which to select a sample.
Comparison groups are not selected using random sampling and do not receive the experimental treatment. There are four types of comparison groups: (1) groups that receive no treatment, (2) groups that receive a placebo treatment, (3) groups that receive the “usual treatment,” and (4) groups that receive a second experimental treatment or a different treatment dose for comparison with the first experimental treatment (e.g., clinical trials of drug effectiveness). As a researcher, you should clarify the type of comparison group you are using.
When a study uses a comparison group that receives no treatment, demonstrating statistical significance is easier because there is less variation in the treatments and a greater difference between the two groups. Placebo treatments provide consistency in the comparison group, provide less difference between groups than in no-treatment comparison groups, and would be unethical in some nursing studies. “Usual treatment” is the treatment routinely provided by the health care system. However, usual treatment is uneven and thus is often not standardized across patients. Thus, provision of care may vary from one patient to another depending on the availability of nursing staff and the intensity of care demands being made on nurses at the time the care is provided. Some patients may receive little or no care, whereas others may receive considerably more or better care. There will likely be a greater amount of difference between a patient who received little or no care and patients in the experimental group, and less difference between patients in the “usual care group” who received considerably more care and the experimental group. This wide variation reduces the effect size of the experimental treatment, increases the variance, and decreases the possibility of obtaining a significant difference between groups. The researcher should carefully spell out “usual treatment” and the degree of variation in treatment in the facility in which the study is being conducted.
Nonequivalent Comparison Group Designs
A comparison group is one in which the groups are not selected by random means. Some groups are more nonequivalent than others, and some quasi-experimental designs involve using groups (comparison and treatment) that have evolved naturally rather than being developed randomly. For example, groups might be selected because they are registered for an 8:00 am class in a university. These groups cannot be considered equivalent because the individuals in the comparison group may be different from individuals in the treatment group. Individuals have selected the group in which they are included rather than being selected by the researcher. Thus, selection becomes a threat to validity.
The approach to statistical analysis is problematic in quasi-experimental designs. Although many researchers use the same approaches to analysis as are used for experimental studies, the selection bias inherent in nonequivalent comparison groups makes this practice questionable. Reichardt (1979) recommended using multiple statistical analyses to examine the data from various perspectives and to compare levels of significance obtained from each analysis. As a researcher, you must carefully assess the potential threats to validity in interpreting statistical results, because statistical analysis cannot control for threats to validity. The following sections describe examples of nonequivalent comparison group design.
One-Group Posttest-Only Designs
The one-group posttest-only design is referred to as preexperimental rather than quasi-experimental because of its weaknesses and the numerous threats to validity. It is inadequate for making causal inferences (Figure 11-11). Usually in this design, no attempt is made to control the selection of subjects who receive the treatment (the experimental group). It is difficult to justify generalizing findings beyond those tested. The group is not pretested; therefore, there is no direct way to measure change. The researcher cannot claim that posttest scores were a consequence (effect) of the treatment if scores before the treatment are unknown. Because there is no comparison group, one does not know whether groups not receiving the treatment would have similar scores on the dependent variable. The one-group posttest-only design is more commonly used in evaluation than in research.
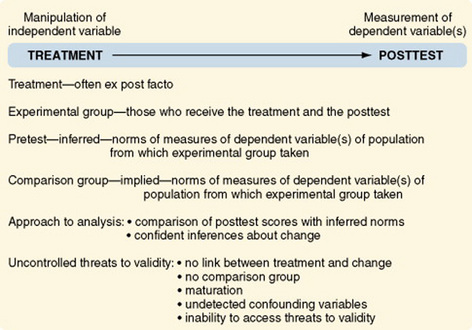
Cook and Campbell (1979) suggested situations in which the one-group posttest-only design can be appropriate and adequate for inferring causality. For example, the design could be used to determine that a single factory’s use of vinyl chloride is causing an increase in the rate of neighborhood and employee cancers. The incidence of cancer in the community at large is known. The fact that vinyl chloride causes cancer and the types of cancer it causes are also known. These norms would then take the place of the pretest and the comparison group. Thus, to use this design intelligently, one must know a great deal about the causal factors interacting within the situation. This is not the usual situation in nursing studies.
Posttest-Only Designs with a Comparison Group
Although the posttest-only design with comparison groups offers an improvement on the previous design, because of the addition of a nonequivalent comparison group, it is still referred to as preexperimental (Figure 11-12). The addition of a comparison group can lead to a false confidence in the validity of the findings.
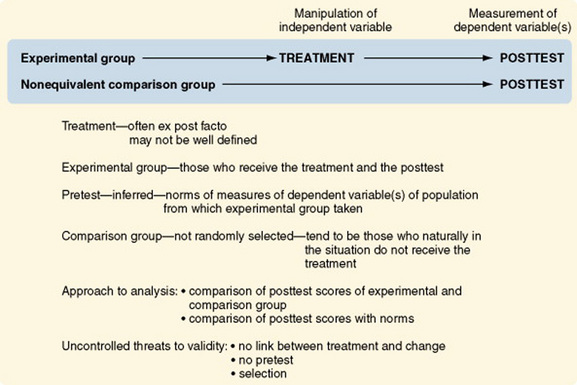
Selection threats are a problem with both groups. The lack of a pretest remains a serious impediment to defining change. Differences in posttest scores between groups may be caused by the treatment or by differential selection processes.
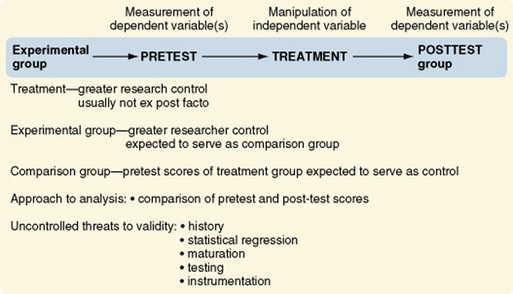
One-Group Pretest-Posttest Designs
Another preexperimental design, the one-group pretest-posttest design, is one of the more commonly used designs. However, it has such serious weaknesses that findings are often uninterpretable (Figure 11-13). Pretest scores cannot adequately serve the same function as a comparison group. Events can occur between the pretest and posttest that alter responses to the posttest. These events then serve as alternative hypotheses to the proposal that the change in posttest scores is due to the treatment. Posttest scores might be altered by (1) maturation processes, (2) administration of the pretest, and (3) changes in instrumentation. Additionally, subjects in many studies using this design are selected on the basis of high or low scores on the pretest. Thus, there is an additional threat that changes in the posttest may be due to regression toward the mean. The addition of a nonequivalent comparison group, as described in the next design, can greatly strengthen the validity of the findings.
Warrington, Cholowski, and Peters (2003) conducted a one-group pretest-posttest study that they describe as follows.
Pretest and Posttest Designs with a Comparison Group
The pretest and posttest design with a comparison group is the most commonly used design in social science research (Figure 11-14). This quasi-experimental design is the first design discussed here that is generally interpretable. The uncontrolled threats to validity are primarily due to the absence of randomization and, in some studies, the inability of the researcher to manipulate the treatment. Cook and Campbell (1979) offered a detailed discussion of the effects of these threats on interpreting study findings.
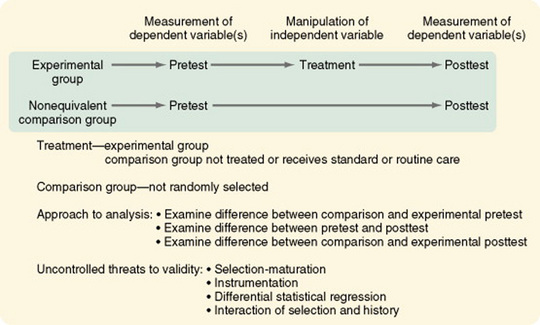
Variations in this design include the use of (1) proxy pretest measures (a different pretest that correlates with the posttest), (2) separate pretest and posttest samples, and (3) pretest measures at more than one time interval. The first two variations weaken the design, but the last variation greatly strengthens it. In some studies, the comparison group consists of patients cared for before a new treatment was initiated. Data on this comparison group are obtained through chart audit or from electronic databases owned by the facility. Obviously there is no opportunity to control the quality of the data obtained through chart audit. Thus, this strategy weakens the design.
Costanzo, Walker, Yates, McCabe, and Berg (2006) used a pretest-posttest comparison group design in their study of physical activity counseling for older women. They described their design as follows.
Pretest and Posttest Designs with Two Comparison Treatments
The two-treatment design is used when two experimental treatments are being compared to determine which is most effective. In most cases, this design is used when one treatment is the currently identified treatment of choice and the researcher has identified a treatment that might lead to even better outcomes (Figure 11-15). This design is strengthened by the addition of one or more of the following: a no-treatment group, a placebo-treatment group, or a usual-treatment group (Figure 11-16).
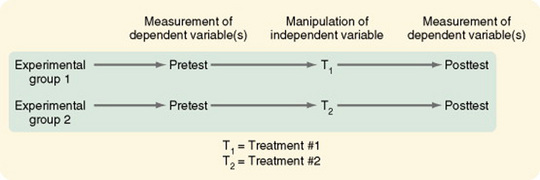
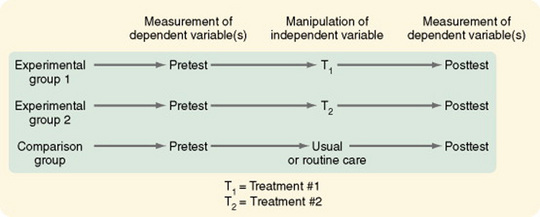
Figure 11-16 Pretest and posttest design with two comparison treatments and a standard or routine care group used as a comparison group.
Côté and Pepler (2002) conducted a study that compared two coping interventions designed for acutely ill HIV-positive men. The following is a description of their study.
Pretest and Posttest Designs with a Removed Treatment
In some cases, gaining access to even a comparison group is not possible. The removed-treatment design with pretest and posttest creates conditions that approximate the conceptual requirements of a control group receiving no treatment. The design is basically a one-group pretest-posttest design. However, after a delay, a third measure of the dependent variable is taken, followed by an interval in which the treatment is removed, followed by a fourth measure of the dependent variable (Figure 11-17). The periods between measures must be equivalent. In nursing situations, the researcher must consider the ethics of removing an effective treatment. Even if doing so is ethically acceptable, the response of subjects to the removal may make interpreting changes difficult.
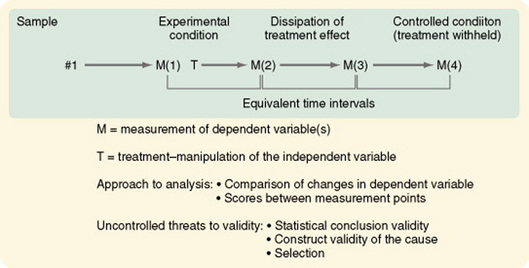
Figure 11-17 Pretest and posttest design with a removed treatment. M(1), pretest; M(2), posttest; M(3), pretest of controlled condition; M(4), posttest of controlled condition.
It is difficult in CINAHL and MEDLINE to locate examples of studies using removed-treatment designs, because the search requires the use of the Boolean terms “removed ADJ treatment” or “removed w treatment.” A search in PsychInfo located one study: Schneider (1998) described a study of the effects of virtual reality on symptom distress in children receiving cancer chemotherapy.
Pretest and Posttest Designs with a Reversed Treatment
The reversed-treatment nonequivalent control group design with pretest and posttest introduces two independent variables—one expected to produce a positive effect and one expected to produce a negative effect (Figure 11-18). There are two experimental groups, each exposed to one of the treatments. The design tests differences in response to the two treatments. This design is more useful for theory testing than the no-treatment control group design because of its high construct validity of the cause. This means that there are strong theoretical sources that propose that specific treatments cause specific effects. The theoretical causal variable must be rigorously defined to allow differential predictions of directions of effect. To be maximally interpretable, the following two groups must be added: (1) a placebo control group in which the treatment is not expected to affect the dependent variable and (2) a no-treatment control group to provide a baseline.
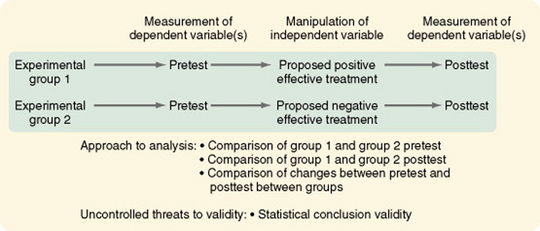
McConnell (1976) used a reversed-treatment design to test how knowledge of the results affected a subject’s attitude toward a motor learning task. The study
Interrupted Time-Series Designs
The interrupted time-series design is similar to descriptive time designs except that a treatment is applied at some point in the observations. Time-series analyses have some advantages over other quasi- experimental designs. First, repeated pretest observations can assess trends in maturation before the treatment. Second, the repeated pretest observations allow measures of trends in scores before the treatment, decreasing the risk of statistical regression, which would lead to misinterpretation of findings. If you keep records of events that could influence subjects in your study, you can determine whether historical factors that could modify responses to the treatment were in operation between the last pretest and the first posttest.
Some threats, however, are particularly problematic in time-series designs. Record-keeping procedures and definitions of constructs used for data collection tend to change over time. Thus, maintaining consistency can be a problem. The treatment can result in attrition so that the sample before treatment may be different in important ways from the posttreatment group. Seasonal variation or other cyclical influences can be interpreted as treatment effects. Therefore, identifying cyclical patterns and controlling for them are critical to the analysis of study findings.
McCain and McCleary (1979) have suggested using the autoregressive integrated moving average (ARIMA) statistical model (see Chapter 20) to analyze time-series data. ARIMA is a relatively new statistical model that has some distinct advantages over regression analysis techniques. For adequate statistical analysis, at least 50 measurement points are needed; however, Cook and Campbell (1979) believe that even small numbers of measurement points can provide better information than that obtained in cross-sectional studies. The numbers of measures shown in the designs illustrated in Figures 11-19 through 11-21 are limited by space. They are not meant to suggest limiting measures to the numbers shown.
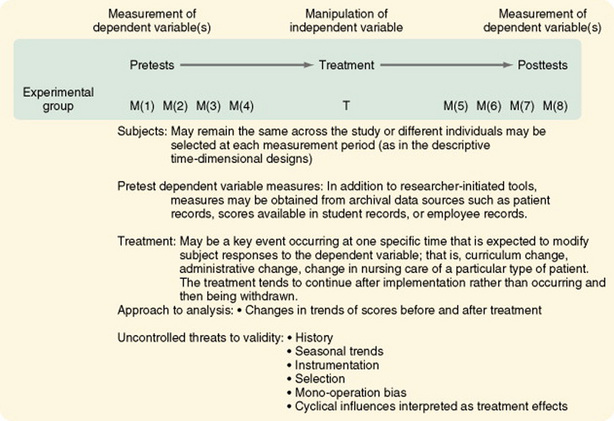
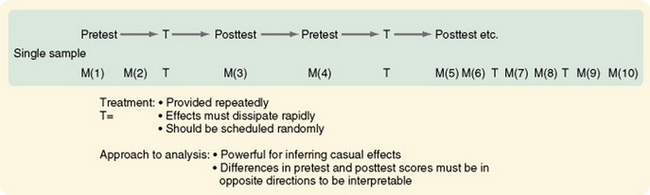
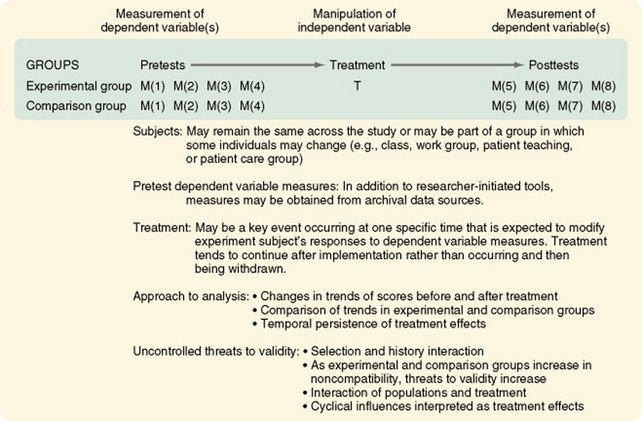
Figure 11-20 Interrupted time-series design with a nonequivalent no-treatment comparison group time series.
Simple Interrupted Time-Series Designs
The simple interrupted time-series design is similar to the descriptive time-series study, with the addition of a treatment that occurs or is applied (interrupts the time series) at a given point in time (see Figure 11-19). The treatment, which in some cases is not completely under the control of the researcher, must be clearly defined. There is no control or comparison group in this design. The use of multiple methods to measure the dependent variable greatly strengthens the design. Threats that are well controlled by this design are maturation and statistical regression.
Woods and Dimond (2002) used a simple interrupted time-series design to examine the effect of therapeutic touch on agitated behavior and cortisol in persons with Alzheimer’s disease. They described their study as follows.
Interrupted Time-Series Designs with a Comparison Group
The addition of a comparison group to the interrupted time-series design greatly strengthens the validity of the findings. The comparison group allows the researcher to examine the differences in trends between groups after the treatment and the persistence of treatment effects over time (Figure 11-20). Although the treatment may continue (e.g., a change in nursing management practices or patient teaching strategies), the initial response to the change may differ from later responses.
Chan, Lu, Tseng, and Chous (2003) used an interrupted time-series design with a comparison group to evaluate an anger control program. The study is described as follows.
Interrupted Time-Series Designs with Multiple Treatment Replications
The interrupted time-series design with multiple treatment replications is a powerful design for inferring causality (see Figure 11-21). It requires greater researcher control than is usually possible in social science research outside closed institutional settings, such as laboratories or research units. The studies that led researchers to adopt behavior modification techniques used this design. For significant differences to be interpretable, the pretest and posttest scores must be in different directions. Within this design, treatments can be modified by substituting one treatment for another or combining two treatments and examining interaction effects.
EXPERIMENTAL STUDY DESIGNS
Experimental study designs provide the greatest amount of control possible to examine causality more closely. To examine cause, one must eliminate all factors influencing the dependent variable other than the cause (independent variable) being studied. Other factors are eliminated by controlling them. The study is designed to prevent any other element from intruding into observation of the specific cause and effect that the researcher wishes to examine.
The three essential elements of experimental research are (1) randomization, (2) researcher-controlled manipulation of the independent variable, and (3) researcher control of the experimental situation, including a control or comparison group. Experimental designs exert much effort to control variance. Sample criteria are explicit, the independent variable is provided in a precisely defined way, the dependent variables are carefully operationalized, and the situation in which the study is conducted is rigidly controlled to prevent the interference of unstudied factors from modifying the dynamics of the process being studied.
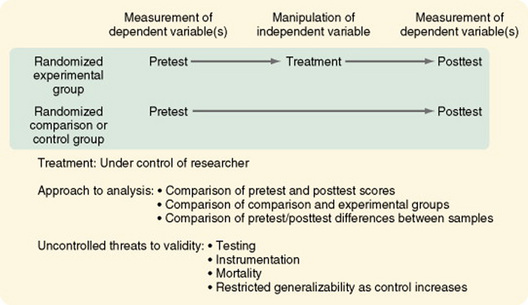
Classic Experimental Design
The original, or classic, experimental design, or pretest-posttest control group design, is still the most commonly used experimental design (Figure 11-22). There are two randomized groups, one receiving the experimental treatment and one receiving no treatment, a placebo treatment, or the usual or standard care. By comparing pretest scores, one can evaluate the effectiveness of randomization in providing equivalent groups. The researcher controls treatment. The dependent variable is measured twice, before and after the manipulation of the independent variable. As with all well-designed studies, the dependent and independent variables are conceptually linked, conceptually defined, and operationalized. Instruments used to measure the dependent variable clearly reflect the conceptual meaning of the variable and have good evidence of reliability and validity. Often, more than one means of measuring the dependent variable is advisable to avoid mono-operation and mono-method biases.
Most other experimental designs are variations of the classic experimental design. Multiple groups (both experimental and comparison) can be used to great advantage in the pretest-posttest design and the posttest-only design. For example, the researcher could withhold treatment from one comparison group and treat another comparison group with a placebo. Multiple experimental groups could receive varying levels of the treatments, such as differing frequency, intensity, or duration of nursing care measures. These additions greatly increase the generalizability of the study findings.
Malm, Karlsson, and Fridlund (2007) conducted an experimental study of the effects of a self-care program on health-related quality of life (HRQoL) for pacemaker patients. The study is described as follows.
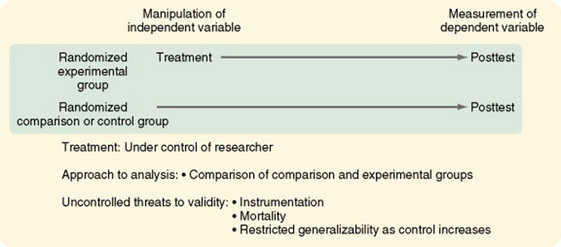
Experimental Posttest-Only Comparison Group Designs
In some studies, the dependent variable cannot be measured before the treatment. For example, before the beginning of treatment, it is not possible to measure, in a meaningful way, a subject’s responses to interventions designed to control nausea from chemotherapy or postoperative pain. Additionally, in some cases, subjects’ responses to the posttest can be due, in part, to learning from or having a subjective reaction to the pretest (pretest sensitization). If this issue is a concern in your study, you may eliminate the pretest and use an experimental posttest-only design with a comparison group (Figure 11-23). However, you then will not be able to use many powerful statistical analysis techniques within the study. Additionally, the effectiveness of randomization in obtaining equivalent experimental and comparison groups cannot be evaluated in terms of the study variables. Nevertheless, the groups can be evaluated in terms of sample characteristics and other relevant variables.
Randomized Blocking Designs
The randomized blocking design uses the two-group pretest-posttest pattern or the two-group posttest pattern with one addition: a blocking variable. The blocking variable, if uncontrolled, is expected to confound the findings of the study. To prevent this confusion, the subjects are rank ordered in relation to the blocking variable.
For example, if effectiveness of a nursing intervention to relieve postchemotherapy nausea were the independent variable in your study, severity of nausea could confound the findings. Subjects would be ranked according to severity of nausea. You would identify and randomly assign the two subjects with the most severe nausea, one to the experimental group and one to the comparison group. You then would identify and randomly assign the two subjects next in rank. You would follow this pattern until the entire sample was randomly assigned as matched pairs. This procedure ensures that the experimental group and the comparison group are equal in relation to the potentially confounding variable.
The effect of blocking can also be accomplished statistically (through the use of analysis of covariance) without categorizing the confounding variable into discrete components. However, for this analysis to be accurate, one must be careful not to violate the assumptions of the statistical procedure (Spector, 1981). An example of this design is the study by Mishel et al. (2003), which was designed to identify moderators of an uncertainty management intervention for men with localized prostate cancer. They described the study as follows.
Factorial Designs
In a factorial design, two or more different characteristics, treatments, or events are independently varied within a single study. This design is a logical approach to examining multiple causality. The simplest arrangement is one in which two treatments or factors are involved and, within each factor, two levels are manipulated (for example, the presence or absence of the treatment); this is referred to as a 2 × 2 factorial design. This design is illustrated in Figure 11-24, in which the two independent variables are relaxation and distraction as means of relieving pain.
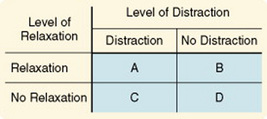
A 2 × 2 factorial design produces a study with four cells (A through D). Each cell must contain an approximately equivalent number of subjects. Cells B and C allow the researcher to examine of each intervention separately. Cell D subjects receive no treatment and serve as a control group. Cell A allows the researcher to examine the interaction between the two independent variables. This design can be used, as in the randomized block design, to control for confounding variables. The confounding variable is included as an independent variable, and interactions between it and the other independent variable are examined (Spector, 1981).
Extensions of the factorial design to more than two levels of variables are referred to as M × N factorial designs. Within this design, independent variables can have any number of levels within practical limits. Note that a 3 × 3 design involves 9 cells and requires a much larger sample size. A 4 × 4 design would require 16 cells. A 4 × 4 design would allow relaxation to be provided at four levels of intensity, such as no relaxation, relaxation for 10 minutes twice a day, relaxation for 15 minutes three times a day, and relaxation for 20 minutes four times a day. Distraction would be provided at similar levels.
Factorial designs are not limited to two independent variables; however, interpretation of larger numbers becomes more complex and requires greater knowledge of statistical analysis. Factorial designs do allow the examination of theoretically proposed interrelationships between multiple independent variables. However, very large samples are required.
An example of factorial design is the study by Phibbs et al. (2006), which evaluated the impact of a comprehensive geriatric assessment service. An excerpt from that study follows.
Nested Designs
In some experimental situations, you may wish to consider the effect of variables that are found only at some levels of the independent variables being studied. Variables found only at certain levels of the independent variable are called nested variables. Possible nested variables are gender, race, socioeconomic status, and education. A nested variable may also be the patients who are cared for on specific nursing units or at different hospitals; the statistical analysis in this case would be conducted as though the unit or hospital were the subject rather than the individual patient. Figure 11-25 illustrates the nested design. In actual practice, nursing units used in this manner would have to be much larger in number than those illustrated, because each unit would be considered a subject and would be randomly assigned to a treatment.
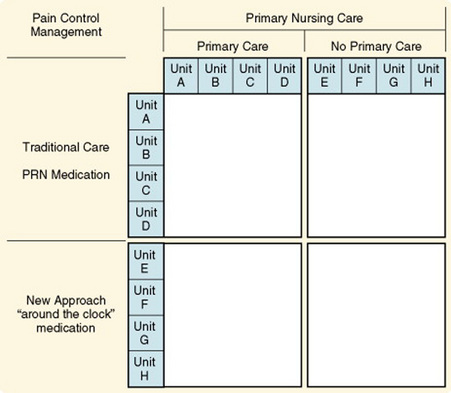
Lewandowski, Good, and Draucker (2005) studied verbal descriptions of pain change. The following excerpt describes their study.
Crossover or Counterbalanced Designs
In some studies, more than one treatment is administered to each subject. The treatments are provided sequentially rather than concurrently. Comparisons are then made of the effects of the different treatments on the same subject. For example, two different methods known to achieve relaxation might be used as the two treatments. One difficulty with this type of study is that exposure to one treatment may result in effects (called carryover effects) that persist and influence responses of the subject to later treatments. Also, subjects can improve as they become more familiar with the experimental protocol, which is called a practice effect. They may become tired or bored with the study, which is called a fatigue effect. The direct interaction of one treatment with another, such as the use of two drugs, can confound differences in the two treatments.
Crossover, or counterbalancing, is a strategy designed to guard against possible erroneous conclusions resulting from carryover effects. With counterbalancing, subjects are randomly assigned to a specific sequencing of treatment conditions. This approach distributes the carryover effects equally throughout all the conditions of the study, thus canceling them out. To prevent an effect related to time, the same amount of time must be allotted to each treatment, and the crossover point must be related to time, not to the condition of the subject.
In addition, the design must allow for an adequate interval between treatments to dissipate the effects of the first treatment; this is referred to as a washout period. For example, the design would specify that each treatment would last 6 days and that on the eighth day, each subject would cross over to the alternative treatment after a 2-day washout period.
The researcher also must be alert to the possibility that changes may be due to factors such as disease progression, the healing process, or the effects of treatment of the disease rather than the study treatment. The process of counterbalancing can become complicated when more than two treatments are involved. Counterbalancing is effective only if the carryover effect is essentially the same from treatment A to treatment B as it is from treatment B to treatment A. If one treatment is more fatiguing than the other or more likely to modify response to the other treatment, counterbalancing will not be effective. You can use the crossover design to control variance in your study and thus allow the sample size to be smaller. The sample size required to detect a significant effect is considerably smaller because the subjects serve as their own controls. Because the data collection period is longer, however, the rate of subject dropout may increase (Beck, 1989).
An example of this design is the Chang, Lin, Lin, and Lin (2007) study of feeding premature infants using either single-hole or cross-cut nipple units. They described their study as follows.
To assist you in integrating the information on traditional designs, Table 11-5 is provided.
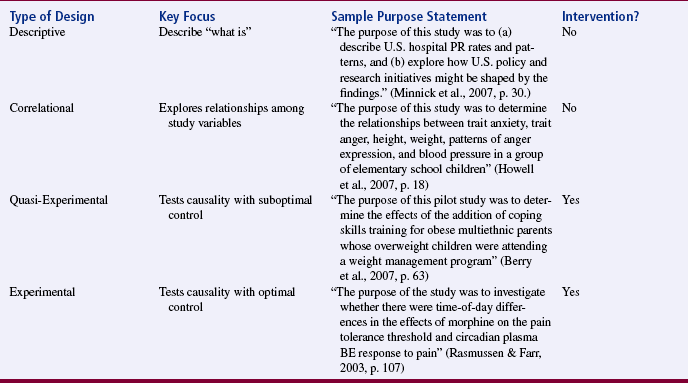
Randomized Clinical Trials
Randomized clinical trials (RCTs) have been used in medicine since 1945. Wooding (1994) described the strategies that were used to introduce new medical therapies before that time.
The methodology for a clinical trial uses strategies for medical research (Meinert & Tonascia, 1986; Piantadosi, 1997; Pocock, 1996; Whitehead, 1992; Wooding, 1994). The phase I, II, III, and IV clinical trial categories were developed specifically for testing experimental drug therapy. Phase I, the initial testing of a new drug, focuses on determining the best drug dose and identifying safety effects. Phase II trials seek preliminary evidence of efficacy and side effects of the drug dose determined by the phase I trial. Phase I and phase II trials do not include comparison groups or randomization and therefore could not be classified as experimental. They are more similar to pilot studies (Whitehead, 1992).
Phase III trials are comparative definitive studies in which the new drug’s effects are compared with those of the drug considered standard therapy. Phase III trials are sometimes referred to as “full-scale definitive clinical trials,” suggesting that a decision is made on the basis of the findings as to whether the experimental drug is more effective than standard treatment. In some phase III clinical trials, the sample size is not determined before initiation of data collection. Rather, data are analyzed at intervals to test for significant differences between groups. If a significant difference is found, data collection may be discontinued. Otherwise, the data collection will continue and retesting is initiated after accrual of additional subjects (Meinert & Tonascia, 1986; Whitehead, 1992). Phase IV trials occur after regulatory approval of the drug, are designed to follow patients over time to identify uncommon side effects and test marketing strategies, and do not include a comparison group or randomization (Piantadosi, 1997; Wooding, 1994).
Piantadosi (1997) recommended redefining these stages to be broader and applicable to more types of trials. He suggested using the following terminology: early development, middle development, comparative studies, and late development. In early development trials, researchers would develop and test the treatment mechanism (thus, they could also be called TM trials). Middle development studies would focus on clinical outcomes and treatment “tolerability.” Tolerability would have three components: feasibility, safety, and efficacy; thus, Piantadosi (1997) referred to middle development studies as safety and efficacy trials, or SE trials. In this phase, the researcher would estimate the probability that patients would benefit from the treatment (or experience side effects from it). Performance criteria such as success rate might be used.
Comparative studies, according to Piantadosi (1997), would have defined clinical end points and would address comparative treatment efficacy (so could be called CTE trials). These studies would include a concurrent control group that receives the standard treatment and an experimental group that receives the experimental treatment. Late development studies would be designed to identify uncommon side effects, interactions with other treatments, or unusual complications. They would be developed as expanded safety trials, or ES trials.
Elwood (1998) suggested that clinical trial methodology could be used for prevention intervention studies, as well as testing treatments. Murray (1998) proposed methods of randomizing groups rather than subjects in prevention studies and explores issues related to community-based trials such as sample mortality.
Until recently, the term clinical trial has not been used to describe studies conducted in nursing research. The clinical trial is perceived by many to be the Cadillac of designs. (There are serious criticisms of the clinical trial, however; they are discussed in Chapter 12.)
If the clinical trial is to be used in nursing, the methodology should be redefined to fit the knowledge-building needs of nursing. Sidani and Braden (1998) made a start in this direction by proposing such a methodology, which is described in Chapter 13. Criteria for defining a study as a clinical trial as opposed to referring to it as an experimental study have not been clarified in the nursing literature.
Meinert and Tonascia (1986) defined a clinical trial as a
Conceptually, the term clinical trial, as it is used in the nursing literature, seems to be associated with a phase III trial and has the following expectations:
1. The study is designed to be a definitive test of the hypothesis that the intervention causes the defined effects.
2. Previous studies have provided evidence that the intervention causes the desired outcome.
3. The intervention is clearly defined, and a protocol has been established for its clinical application.
4. The study is conducted in a clinical setting, not in a laboratory.
5. The design meets the criteria of an experimental study.
6. Subjects are drawn from a reference population through the use of clearly defined criteria. Baseline states are comparable in all groups included in the study. Selected subjects are then randomly assigned to treatment and comparison groups; thus, the term randomized clinical trial.
7. Subjects are accrued individually over time as they enter the clinical area, are identified as meeting the study criteria, and agree to participate in the study.
8. The study has high internal validity. The design is rigorous and involves a high level of control of potential sources of bias that will rule out possible alternative causes of the effect. The design may include blinding or double-blinding to accomplish this purpose. Blindingmeans that either the patient or those providing care to the patient are unaware of whether the patient is in the experimental group or the control group. Double-blinding means that neither the patient nor the caregivers are aware of the group assignment of the patient.
9. The treatment is equal and consistently applied to all subjects in the experimental group.
10. Dependent variables are measured consistently.
11. The proposed study has been externally reviewed by expert researchers who have approved the design.
12. The study has received external funding sufficient to allow a rigorous design with a sample size adequate to provide a definitive test of the intervention.
13. If the clinical trial results indicate a significant effect of the intervention, the evidence is sufficient to warrant application of the findings in clinical practice.
14. The intervention is defined in sufficient detail so that clinical application can be achieved.
Clinical trials may be carried out simultaneously in multiple geographical locations to increase sample size and resources and to obtain a more representative sample (Meinert & Tonascia, 1986). In this case, the primary researcher must coordinate activities at all the sites. Meinert and Tonascia (1986) indicated that the costs per patient per year of study are less for multicenter studies than for single-center trials. If you plan to use this technique in your research, you must confront several problems. Coordination of a project of this type requires much time and effort. Keeping up with subjects is critical but may be difficult. Communication with and cooperation of staff assisting with the study in the various geographical locations are essential but sometimes difficult. You may encounter attempts to ignore the protocol and provide traditional care (Fetter et al., 1989; Gilliss & Kulkin, 1991; Tyzenhouse, 1981). Meinert and Tonascia (1986) recommended the development of a coordinating center for multisite clinical trials that will be responsible for receiving, editing, processing, analyzing, and storing data generated in the study.
The use of the clinical trial is growing in nursing research. Brooten et al. (1986) conducted a clinical trial of early hospital discharge and home follow-up of very low birth weight infants. Burgess et al. (1987) performed a clinical trial of cardiac rehabilitation. Later studies defined in the literature as clinical trials are those by Clarke (1999); deMoissac & Jensen (1998); Griebel, Wewers, and Baker (1998); Ippoliti and Neumann (1998); Rawl, Easton, Kwiatkowski, Zemen, and Burczyk (1998); and Turner, Clark, Gauthier, and Williams (1998) (all full-text articles available in CINAHL).
An example of a clinical trial in nursing is the study by Krichbaum (2007), which tested the effectiveness of a gerontological advanced practice nurse intervention for elders with hip fracture. The study was funded by a Mentored Research Scientist Award from the National Institutes for Health/National Institute of Nursing Research. The author described the study as follows.
STUDIES THAT DO NOT USE TRADITIONAL RESEARCH DESIGNS
In some approaches to research, the research designs described in this chapter cannot be used. These studies tend to be in highly specialized areas that require unique design strategies to accomplish their purposes. Designs for primary prevention and health promotion, secondary analysis, and methodological studies are described here.
Primary Prevention and Health Promotion Studies
To study primary prevention and health promotion as a nurse researcher, you must apply a treatment of primary prevention (the cause) and then attempt to measure the effect (an event that does not occur if the treatment was effective). Primary prevention studies, then, attempt to measure things that do not happen. One cannot select a sample to study, apply a treatment, and then measure an effect. The sample must be the community. The design involves examining changes in the community, and the variables are called indicators. A change in an identified indicator is inferred to be a consequence of the effectiveness of the prevention program (treatment).
Specific indicators would depend on the focus of prevention. For example, nurses in Canada identified oral mucositis as a recurring issue in clinical practice and developed an oral care guide. They used the University Health Network Nursing Research Utilization Model and the Neuman Systems Model as conceptual frameworks.
A flowchart was developed to ensure a coordinated and continuous provision of oral care. Educational presentations were conducted to familiarize nurses and members of the multidisciplinary team of the practice changes. The introduction of the oral care regimen as primary prevention, plus systematic oral assessment and monitoring had the potential to reduce the occurrence and severity of oral mucositis in patients undergoing autologous stem cell transplantation. (Salvador, 2006)
How might you study the effectiveness of this primary prevention strategy? Because one indicator alone would be insufficient to infer effect, multiple indicators and statistical analyses appropriate for these indicators must be used. For example, you might measure the color of the oral mucosa, moistness in the mouth, severity of oral mucositis, and amount of pain expressed by the patient when eating.
Guinan, McGuckin, and Ali (2002) studied the effect of a comprehensive handwashing program on absenteeism in elementary schools. They described their study as follows.
Secondary Analyses
Secondary analysis design involves studying data previously collected in another study. Data are reexamined with the use of different organizations of the data and different statistical analyses from those previously used. The design involves analyzing data to validate the reported findings, examining dimensions previously unexamined, or redirecting the focus of the data to allow comparison with data from other studies (Gleit & Graham, 1989). As data sets accumulate from the research programs of groups of faculty, secondary analyses can be expected to increase. This approach allows the investigators to examine questions related to the data that were not originally posed. These data sets may provide opportunities for junior faculty members or graduate students to become involved in a research program.
Of concern in secondary analyses of data is the tendency of some researchers to write as many papers as possible from the planned analyses of a study to increase the number of their publications—a strategy referred to as “salami slicing.” Researchers performing secondary analyses should always identify the original source of data and the previous publications emerging from the analysis of that data set. Aaronson (1994) pointed out the problem with this practice.
An example of secondary analysis is Koci and Strickland’s (2007) study of the relationship of adolescent physical and sexual abuse with premenstrual syndrome (PMS) in adulthood. Data analyzed from this study were from a longitudinal study of a community sample of 568 women in a database called Nursing Assessment of PMS: Neurometric Indices. A study such as this yields an enormous amount of data that is not examined in the original study. The authors used this large data set to examine another question posed for a secondary analysis. The authors found that “a history of both adolescent physical abuse and sexual abuse was significantly associated with PMS in adulthood. Women with a history of adolescent physical and sexual abuse had significantly more severe PMS patterns with more dysphoria than women without abuse.”
Methodological Designs
Methodological designs are used to develop the validity and reliability of instruments to measure constructs used as variables in research. The process is lengthy and complex. The average length of researcher time required to develop a research tool to the point of appropriate use in a study is 5 years. An example of a methodological study is the Reyes, Meininger, Liehr, Chan, and Mueller (2003) study of a scale, funded by the National Institute of Nursing Research (NINR). The study measured anger in adolescents, and the authors explained their study as follows.
ALGORITHMS FOR SELECTING RESEARCH DESIGNS
To select a research design, the investigator must follow paths of logical reasoning. You need a calculating mind to explore all the possible consequences of using a particular design in a study. In some ways, selecting a design is like thinking through the moves in a chess game. You must carefully think through the consequences of each option. The research design organizes all the components of the study in a way that is most likely to lead to valid answers to the questions that have been posed.
To help you select the most appropriate design, a series of decision trees is provided here. The first decision tree (Figure 11-26) will help you to identify the type of study you plan to conduct. The next four decision trees (Figures 11-27 through 11-30) will assist you in selecting specific designs for each of the types of studies. Not all of the designs included in these tables have been reviewed in this chapter. Selecting a design is not a rigid, rule-guided task. As a researcher, you have considerable flexibility in choosing a design. The pathways within the decision trees are not absolute and are to be used as guides.
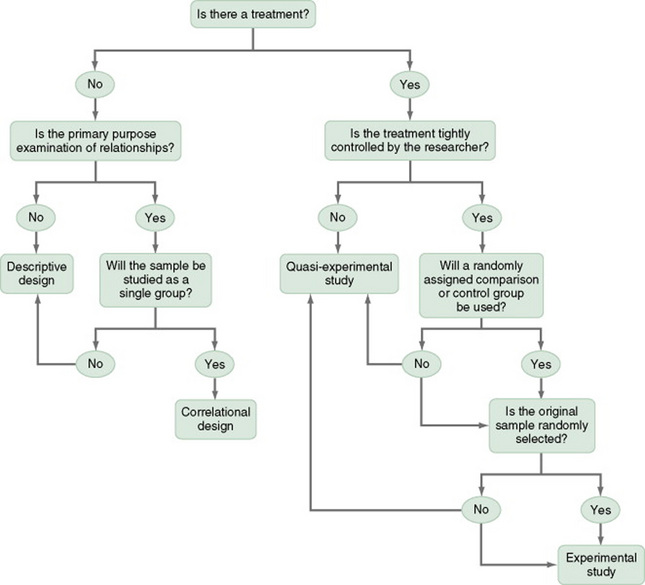
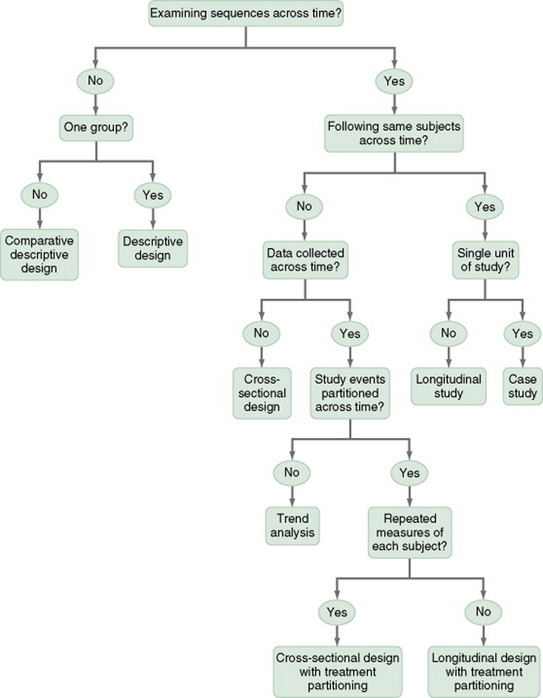
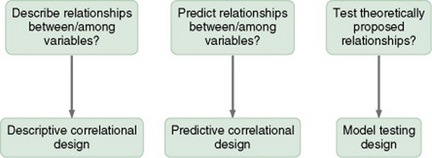
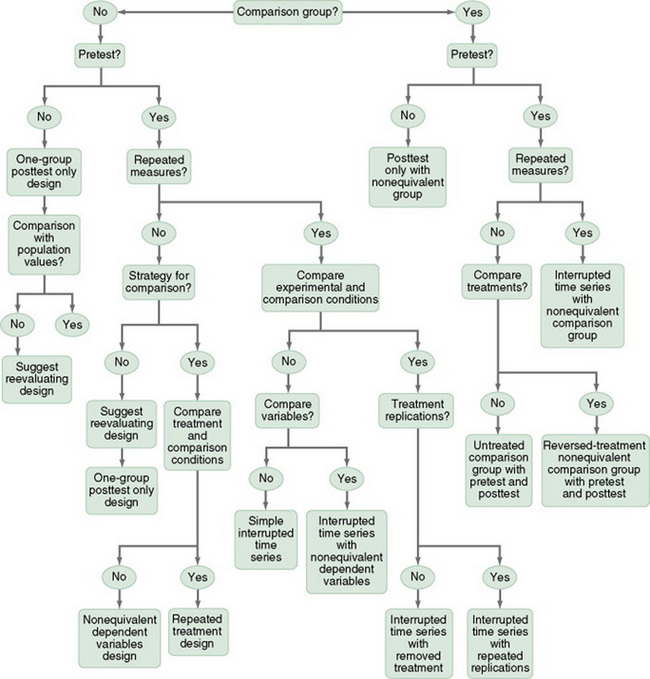
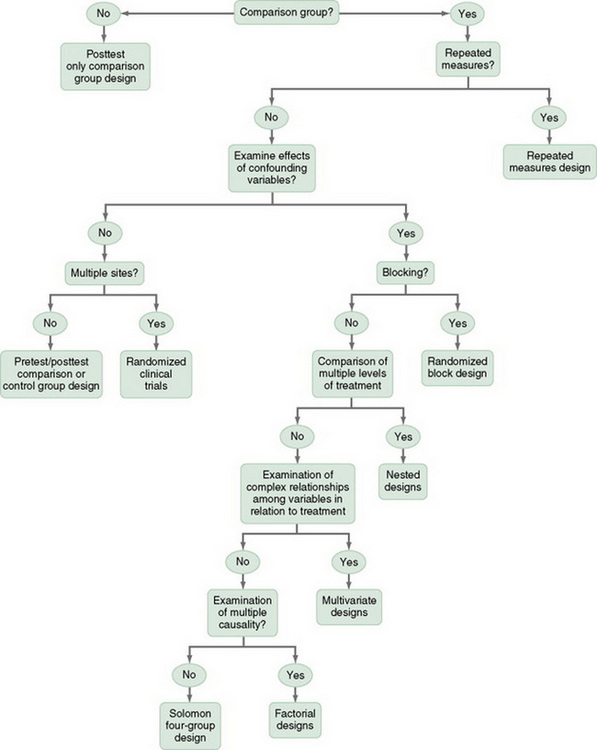
SUMMARY
• Researchers have developed designs to meet unique research needs as they emerge.
• At present, nursing research is using designs developed by other disciplines, which are a useful starting point, but nurse scientists must go beyond them to develop designs that will more appropriately meet the needs of the knowledge base in nursing.
• Descriptive studies are designed to gain more information about variables within a particular field of study.
• Correlational studies examine relationships between variables.
• Quasi-experimental and experimental designs examine causality. The power of the design to accomplish this purpose depends on the degree to which the actual effects of the experimental treatment (the independent variable) can be detected by measuring the dependent variable.
• Obtaining an understanding of the true effects of an experimental treatment requires action to control threats to the validity of the findings.
• Threats to validity are controlled through selection of subjects, manipulation of the treatment, and reliable measurement of variables.
• Criteria for defining a study as a clinical trial as opposed to referring to it as an experimental study have not been clarified in the nursing literature.
• Studying primary prevention and health promotion involves applying a treatment of primary prevention (the cause) and then attempting to measure the effect (an event that does not occur if the treatment was effective).
• Secondary analysis is the study of data previously collected in another study.
• Methodological studies are designed to develop the validity and reliability of instruments to measure constructs used as variables in research.
• Algorithms for design identification and selection are provided in Figures 11-27 to 11-30.
Aaronson, L.S. Milking data or meeting commitments: How many papers from one study? Nursing Research. 1994;43(1):60–62.
Baird, C.L., Sands, L.P. Effect of guided imagery with relaxation on health-related quality of life in older women with osteoarthritis. Research in Nursing & Health. 2006;29(5):442–451.
Barlow, D.H., Hersen, M. Single case experimental designs: Strategies for studying behavior change. New York: Pergamon, 1984.
Barnard, K.E., Magyary, D.L., Booth, C.L., Eyres, S.J. Longitudinal designs: Considerations and applications to nursing research. Recent Advances in Nursing. 1987;17:37–64.
Barnes-McDowell, B.M. Home apnea monitoring: Family functioning, concerns, and coping, 1997. Unpublished doctoral dissertation, University of South Carolina
Bassoli, S.R.B., Guimaraes, H.C.Q. Wound care: Nursing activities in the assistance practice, compared to the activities proposed by the Nursing Intervention Classification (NIC) [Portuguese]. Revista Paulista De Enfermagem. 2004;23(2):108–113.
Beck, S.L. The crossover design in clinical nursing research. Nursing Research. 1989;38(5):291–293.
Blissitt, P.A., Roberts, S., Hinkle, J.L., Kopp, E.M. Defining neuroscience nursing practice: The 2001 role delineation study. Journal of Neuroscience Nursing. 2003;25(1):8–15.
Boomsma, J., Dassen, T., Dingemans, C., van den Heuvel, W. Nursing interventions in crisis-oriented and long-term psychiatric home care. Scandinavian Journal of Caring Science. 1999;13(1):41–48.
Bowles, K.H., Naylor, M.D. Nursing intervention classification systems. Journal of Nursing Scholarship. 1996;28(4):303–308.
Brooten, D., Kumar, S., Brown, L.P., Butts, P., Finkler, S.A., Bakewell-Sachs, S., et al. A randomized clinical trial of early hospital discharge and home follow-up of very-low-birth-weight infants. New England Journal of Medicine. 1986;315(15):934–939.
Burgess, A.W., Lerner, D.J., D’Agostino, R.B., Vokonas, P.S., Hartman, C.R., Gaccione, P. A randomized control trial of cardiac rehabilitation. Social Science and Medicine. 1987;24(4):359–370.
Campbell, D.T., Stanley, J.C. Experimental and quasi-experimental designs for research. Chicago: Rand McNally, 1963.
Chan, H.Y., Lu, R.B., Tseng, C.L., Chous, K.R. Effectiveness of the anger-control program in reducing anger expression in patients with schizophrenia. Archives of Psychiatric Nursing. 2003;17(2):88–95.
Chang, Y.J., Lin, C.P., Lin, Y.J., Lin, C.H. Effects of single-hole and cross-cut nipple units on feeding efficiency and physiological parameters in premature infants. Journal of Nursing Research. 2007;15(3):215–223.
Clarke, D.A. Advancing my health care practice in aromatherapy. Australian Journal of Holistic Nursing. 1999;6(1):32–38.
Coenen, A., Weis, D.M., Schank, M.J., Matheus, R. Describing parish nurse practice using the Nursing Minimum Data Set. Public Health Nursing. 1999;16(6):412–416.
Cook, T.D., Campbell, D.T. Quasi-experimentation: Design and analysis issues for field settings. Chicago: Rand McNally, 1979.
Corbett, C.L.F. Predictors and outcomes of home care for diabetics, 1998. Unpublished doctoral dissertation, Loyola University of Chicago
Costanzo, C., Walker, S.M., Yates, B.C., McCabe, B., Berg, K. Physical activity counseling for older women. Western Journal of Nursing Research. 2006;28(7):786–810.
Côté, J.K., Pepler, C. A randomized trial of a cognitive coping intervention for acutely ill HIV-positive men. Nursing Research. 2002;51(4):237–244.
Cramer, M.E., Chen, L.W., Roberts, S., Clute, D. Evaluating the social and economic impact of community-based prentatal care. Public Health Nursing. 2007;24(4):329–336.
Crombie, I.K., Davies, H.T.O. Research in health care: Design, conduct and interpretation of health services research. New York: Wiley, 1996.
Cummings, G.G., Estabrooks, C.A., Midodzi, W.K., Wallin, L., Hayduk, L. Influence of organizational characteristics and context on research utilization. Nursing Research. 2007;56(4 Suppl):S24–S39.
Davis, K.A. AIDS nursing care and standardized nursing language: An application of the nursing intervention classification. Journal of the Association of Nurses in AIDS Care. 1995;6(6):37–44.
deMoissac, D., Jensen, L. Changing IV administration sets: Is 48 versus 24 hours safe for neutropenic patients with cancer? Oncology Nursing Forum. 1998;25(5):907–913.
Dowd, T., Withers, E., Hackwood, J., Shuter, P. An Australian pilot study of a parent-child interaction program: “You make the difference.”. Neonatal, Paediatric & Child Health Nursing. 2007;10(1):13–19.
Egan, E.C., Snyder, M., Burns, K.R. Intervention studies in nursing: Is the effect due to the independent variable? Nursing Outlook. 1992;40(4):187–190.
Elwood, J.M. Critical appraisal of epidemiological studies and clinical trials. New York: Oxford University Press, 1998.
Fetter, M.S., Fettham, S.L., D’Apolito, K., Chaze, B.A., Fink, A., Frink, B.B., et al. Randomized clinical trials: Issues for researchers. Nursing Research. 1989;38(2):117–120.
Figoski, M.R., Downey, J. Perspectives in continuity of care. Facility charging and Nursing Intervention Classification (NIC): The new dynamic duo. Nursing Economics. 2006;24(2):102–115.
Fisher, R.A. The design of experiments. New York: Hafner, 1935.
Flaskerud, J.H., Winslow, B.J. Conceptualizing vulnerable populations health-related research. Nursing Research. 1998;47(2):69–78.
Gilliss, C.L., Kulkin, I.L. Monitoring nursing interventions and data collection in a randomized clinical trial. Western Journal of Nursing Research. 1991;13(3):416–422.
Gleit, C., Graham, B. Secondary data analysis: A valuable resource. Nursing Research. 1989;38(6):380–381.
González-Gancedo, J., Fernández García, D. Care plan in a patient with spina bifida. Case report [Spanish]. Enfermeria Clinica. 2007;17(2):90–95.
Gray, M. Introducing single case study research design: An overview. Nurse Researcher. 1998;5(4):15–24.
Griebel, B., Wewers, M.E., Baker, C.A. The effectiveness of a nurse-managed minimal smoking-cessation intervention among hospitalized patients with cancer. Oncology Nursing Forum. 1998;25(5):897–902.
Guimarães, H.C.Q. Fluid management: a nursing intervention for the patient with fluid volume excess [Portuguese]. Barros ALB Revista Latino-Americana de Enfermagem. 2003;11(6):734–741.
Guinan, M., McGuckin, M., Ali, Y. The effect of a comprehensive handwashing program on absenteeism in elementary schools. American Journal of Infection Control. 2002;30(4):217–220.
Hartley, L.A. Longitudinal analysis of access to health care, use of preventive health services, and practice of health-related behaviors of Appalachian and non-Appalachian adults in Kentucky, 2003. Unpublished doctoral dissertation, University of Kentucky
Henry, S.B., Meade, C.N. Nursing classification systems: Necessary but not sufficient for representing “what nurses do” for inclusion in computer-based patient record systems. Journal of the American Medical Informatics Association. 1997;4(3):222–322.
Hjelm-Karlsson, K. Using the biased coin design for randomization in health care research. Western Journal of Nursing Research. 1991;13(2):284–288.
Huang, C.Y., Sousa, V.D., Chen, H.F., Tu, S.Y., Chang, C.J., Pan, I.J. Stressors, depressive symptoms, and learned resourcefulness among Taiwanese adults with diabetes mellitus. Research & Theory for Nursing Practice. 2007;21(2):83–97.
Ippoliti, C., Neumann, J. Octreotide in the management of diarrhea induced by graft versus host disease. Oncology Nursing Forum. 1998;25(5):873–878.
Jones, E.D. Reminiscence therapy for older women with depression: Effects of Nursing Intervention Classification in assisted-living long-term care. Journal of Gerontological Nursing. 2003;29(7):26–33.
Jones-Baucke, D.L. A qualitative study of the implementation of a system to increase nurses’ use of standardized nursing languages, 1997. Unpublished doctoral dissertation, University of Washington
Kacel, B., Millar, M., Norris, D. Measurement of nurse practitioner job satisfaction in a Midwestern state. Journal of the American Academy of Nurse Practitioners. 2005;17(1):27–32.
Kirby, A.E. Classification of advanced practice nursing functions using the Nursing Intervention Classification taxonomy, 1996. Unpublished doctoral dissertation, University of Pennsylvania
Kirchhoff, K.T., Dille, C.A. Issues in intervention research: Maintaining integrity. Applied Nursing Research. 1994;7(1):32–46.
Kline, G.A., Edwards, A. Antepartum and intra- partum insulin management of type 1 and type 2 diabetic women: Impact on clinically significant neonatal hypoglycemia. Diabetes Research & Clinical Practice. 2007;7(22):223–230.
Koci, A., Strickland, O. Relationship of adolescent physical and sexual abuse to perimenstrual symptoms (PMS) in adulthood. Issues in Mental Health Nursing. 2007;28(1):75–87.
Koniak-Griffin, D., Verzemnicks, I.L., Anderson, N.L.R., Brecht, M., Lesser, J., Kim, S., et al. Nurse visitation for adolescent mothers: Two-year infant health and maternal outcomes. Nursing Research. 2003;52(2):127–136.
Krichbaum, K. GAPN Postacute care coordination improves hip fracture outcomes. Western Journal of Nursing Research. 2007;29(5):523–544.
Lewandowski, W., Good, M., Draucker, C.B. Changes in the meaning of pain with the use of guided imagery. Pain Management Nursing. 2005;6(2):58–67.
Malm, D., Karlsson, J.E., Fridlund, B. Effects of a self-care program on the health-related quality of life of pacemaker patients: A nursing intervention study. Canadian Journal of Cardiovascular Nursing. 2007;17(1):15–26.
Martins, I. Nursing interventions for the nursing diagnosis ineffective airway clearance [sic] [Portuguese]. Acta Paulista de Enfermagem. 2005;18(2):143–149.
Mason-Hawkes, J., Holm, K. Causal modeling: a comparison of path analysis and LISREL. Nursing Research. 1989;38(5):312–314.
McBride, K.L., White, C.L., Sourial, R., Mayo, N. Postdischarge nursing interventions for stroke survivors and their families. Journal of Advanced Nursing. 2004;47(2):192–200.
McCain, L.J., McCleary, R. The statistical analysis of the simple interrupted time-series quasi-experiment. In: Cook T.D, Campbell D.T., eds. Quasi-experimentation: Design and analysis issues for field settings. Chicago: Rand McNally; 1979:233–293.
McConnell, A. Effect of knowledge of results on attitude formed toward a motor learning task. Research Quarterly. 1976;47(3):394–399.
McCorkle, R., Young, K. Development of a symptom distress scale. Cancer Nursing. 1978;1(5):373–378.
Meghani, S.H., Keane, A. Preference for analgesic treatment for cancer pain among African Americans. Journal of Pain & Symptom Management. 2007;34(2):136–147.
Meinert, C.L., Tonascia, S. Clinical trials: Design, conduct, and analysis. New York: Oxford University Press, 1986.
Micek, W.T., Berry, L., Gilski, D., Kallenbach, A., Link, D., Scharer, K. Patient outcomes: The link between nursing diagnoses and interventions. Journal of Nursing Administration. 1996;26(11):29–35.
Mishel, M.H., Germino, B.B., Belyea, M., Stewart, J.L., Bailey, D.E., Mohler, J., et al. Moderators of an uncertainty management intervention: for men with localized prostate cancer. Nursing Research. 2003;52(2):89–97.
Mrayyan, M. Nurse autonomy, nurse job satisfaction and client satisfaction with nursing care: Their place in nursing data sets. Canadian Journal of Nursing Leadership. 2003;16(2):74–82.
Murray, D.M. Design and analysis of group-randomized trials. New York: Oxford University Press, 1998.
O’Connor, N.A., Kershaw, T., Hameister, A.D. Documenting patterns of nursing interventions using cluster analysis. Journal of Nursing Measurement. 2001;9(1):73–90.
Ottenbacher, K. Impact of random assignment on study outcome: An empirical examination. Controlled Clinical Trials. 1992;13(1):50–61.
Pallarés, M.A. Influence of transcultural factors on immigrants populations’ needs and nursing diagnosis [Spanish]. Cultura de los Cuidados. 2004;8(16):62–67.
Phibbs, C.S., Holty, J.E., Goldstein, M.K., Garber, A.M., Wang, Y., Feussner, J.R., et al. The effect of geriatrics evaluation and management on nursing home use and health care costs: Results from a randomized trial. Medical Care. 2006;44(1):91–95.
Piantadosi, S. Clinical trials: A methodologic perspective. New York: Wiley, 1997.
Pocock, S.J. Clinical trials: A practical approach. New York: Wiley, 1996.
Rawl, S.M., Easton, K.L., Kwiatkowski, S., Zemen, D., Burczyk, B. Effectiveness of a nurse-managed follow-up program for rehabilitation patients after discharge. Rehabilitation Nursing. 1998;23(4):204–209.
Redes, S., Lunney, M. Validation by school nurses of the Nursing Intervention Classification for computer software. Computers in Nursing. 1997;15(6):333–338.
Reichardt, C.S. The statistical analysis of data from nonequivalent group designs. In: Cook T.D., Campbell D.T., eds. Quasi-experimentation: Design and analysis issues for field settings. Chicago: Rand McNally; 1979:147–206.
Reyes, L.R., Meininger, J.C., Liehr, P., Chan, W., Mueller, W.H. Anger in adolescents: Sex, ethnicity, age differences, and psychometric properties. Nursing Research. 2003;52(1):2–11.
Rodehorst, T.K.C., Wilhelm, S.L., Stepans, M.B. Screen for asthma: Results from a rural cohort. Issues in Comprehensive Pediatric Nursing. 2006;29(4):205–224.
Salvador, P.T. Development of an oral care guide for patients undergoing autologous stem cell transplantation. Canadian Oncology Nursing Journal. 2006;16(1):18–20.
Sandelowski, M. One is the liveliest number: The case orientation of qualitative research. Research in Nursing & Health. 1996;19(6):525–529.
Sawada, A., Porter, S.E., Kayama, M., Setoya, N., Miyamato, Y. Nursing care delivery in Japanese psychiatric units. British Journal of Nursing. 2006;15(17):920–925.
Schneider, S.M. Effects of virtual reality on symptom distress in children receiving cancer chemotherapy. Dissertation Abstracts International: Section B: The Sciences & Engineering. 1998;59(5-B):2126.
Sidani, S., Braden, C.J. Evaluating nursing interventions: A theory-driven approach. Thousand Oaks, CA: Sage, 1998.
Sidani, S., Doran, D., Porter, H., LeFort, S., O’Brien-Pallas, L.L., Zahn, C., et al. Outcomes of nurse practitioners in acute care: An exploration. Internet Journal of Advanced Nursing Practice. 2007;8(1):15.
Solari-Twadell, P.A. The differentiation of the ministry of parish nursing practice within congregations, 2004. Unpublished doctoral dissertation, Loyola University of Chicago
Spector, P.E. Research designs. Beverly Hills, CA: Sage, 1981.
Spielberger, C.D., Edwards, C.D., Montuori, J., Lushene, R.E., et al. Manual for the State-Trait Anxiety Inventory for Children. Palo Alto, CA: Consulting Psychologist Press, 2007.
Sterling, Y.M., McNally, J.A. Single-subject research for nursing practice. Clinical Nurse Specialist. 1992;6(1):21–26.
Stewart, B.J., Archbold, P.G. Nursing intervention studies require outcome measures that are sensitive to change, part 1. Research in Nursing & Health. 1992;15(6):477–481.
Stewart, B.J., Archbold, P.G. Nursing intervention studies require outcome measures that are sensitive to change, part 2. Research in Nursing & Health. 1993;16(1):77–81.
Stout, R.L., Wirtz, P.W., Carbonari, J.P., Del Boca, F.K. Ensuring balanced distribution of prognostic factors in treatment outcome research. Journal of Studies in Alcoholism. 1994;12(Suppl):70–75.
Tripp-Reimer, T., Woodworth, G., McCloskey, J.C., Bulechek, G. The dimensional structure of nursing interventions. Nursing Research. 1996;45(1):10–17.
Turner, J.G., Clark, A.J., Gauthier, D.K., Williams, M. The effect of therapeutic touch on pain and anxiety in burn patients. Journal of Advanced Nursing. 1998;28(1):10–20.
Tyzenhouse, P.S. Technical notes: The nursing clinical trial. Western Journal of Nursing Research. 1981;3(1):102–109.
U.S. Department of Health and Human Services. The Framingham study: An epidemiological investigation of cardiovascular disease. Bethesda, MD: Author, 1968. (USDHHS Publication No. RC667F813)
U.S. Department of Health and Human Services Healthy People 2010: With Understanding and Improving Health and Objectives for Improving Health, 2000. Retrieved May 6, 2008, from www.healthypeople.gov/Publications/, 2000.
Villanueva, N.E., Thompson, H.J., Macpherson, B.C., Meunier, K.E., Hilton, E. The Neuroscience Nursing 2005 Role Delineation Study: Implications for certification. Journal of Neuroscience Nursing. 2005;38(6):403–408.
von Krogh, G., Dale, C., Naden, D. A framework for integrating NANDA, NIC, and NOC terminology in electronic patient records. Journal of Nursing Scholarship. 2005;37(3):275–281.
Warrington, D., Cholowski, K., Peters, D. Effectiveness of home-based cardiac rehabilitation for special needs patients. Journal of Advanced Nursing. 2003;41(2):121–129.
Weis, D., Schank, M.J. Use of a taxonomy to describe parish nursing practice with older adults. Geriatric Nursing. 2000;21(3):125–131.
Weis, D.M., Schank, M.J., Coenen, A., Matheus, R. Parish nurse practice with client aggregates. Journal of Community Health Nursing. 2002;19(2):105–113.
Whitehead, J. The design and analysis of sequential clinical trials. New York: Ellis Horwood, 1992.
Winters, J. Primary prevention of agricultural injuries: Use of standardized nursing diagnosis, interventions, and outcomes. AAOHN Journal. 2002;50(6):271–274.
Wooding, W.M. Planning pharmaceutical clinical trials: Basic statistical principles. New York: Wiley, 1994.
Woods, D.Y., Dimond, M. The effect of therapeutic touch on agitated behavior and cortisol in persons with Alzheimer’s disease. Biological Research for Nursing. 2002;4(2):104–114.
Wu, S.H., Thompson, C.B. Evaluation of the Nursing Intervention Classification for use by flight nurses. Air Medical Journal. 2001;20(1):33–37.
Yin, R. Applied social research methods series: Vol. 5. Case study research: Design and methods. Beverly Hills, CA: Sage, 1984.
Yoon, S.L., Black, S. Comprehensive, integrative management of pain for patients with sickle-cell disease. Journal of Alternative & Complementary Medicine. 2006;12(10):995–1001.