Origin and Spread of Cardiac Impulse and Electrocardiography
 Introduction
Origin and spread of cardiac impulse
Introduction
The cardiac muscle possesses special properties which include autorhythmicity, conductivity, excitability and contractility.
Autorhythmicity, refers to the property of the cardiac muscle which enables the heart to initiate its own impulse at constant rhythmical intervals. Because of this property, the heart continues to beat even after all nerves to it are sectioned. This is because of the presence of a specialized pacemaker tissue in the heart that can initiate repetitive action potentials. The pacemaker tissue makes a conduction system that normally spreads impulses through the heart.
Anatomic consideration
Conducting system of the heart
The conducting system of the heart consists of specialized fibres of the heart muscle present as the sinoatrial (SA) node, the interatrial tract, the internodal tracts, the atrioventricular (AV) node, the AV bundle of His and its right and left terminal branches, and the subendocardial plexuses of the Purkinje fibres (Fig. 4.2-1).
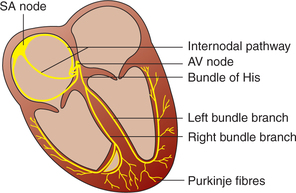
1. Sinoatrial node. The SA node is located in the wall of right atrium, just right to the opening of superior vena cava.
Spontaneous rhythmical electrical impulses arise from the SA node and spread in all directions to:
2. Interatrial tract (Bachman's bundle). It is a band of specialized muscle fibres that run from the SA node to the left atrium. It causes simultaneous depolarization of the atria.
3. Internodal conduction pathway. Three internodal conduction paths have been described (Fig. 4.2-2):
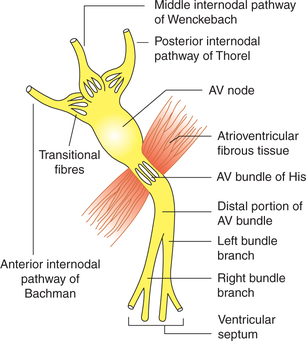
4. Atrioventricular node. The AV node is located just beneath the endocardium on the right side of lower part of the atrial septum, near the tricuspid valve. It is stimulated by the excitation wave that travels through the internodal tracts and the atrial myocardium. From it, the cardiac impulse is conducted to the ventricles by the AV bundle.
5. Atrioventricular bundle of His. The AV bundle arises from the AV node, descends through the fibrous skeleton of the heart and divides into right bundle branch for the right ventricle and the left bundle branch for the left ventricle. The branches break up and become continuous with the plexus of Purkinje fibres.
6. Purkinje fibres. These are spread out deep to the endocardium and reach all parts of the ventricles including the bases of papillary muscles.
Innervational characteristics of the heart
• Both SA node and AV node are richly supplied by the sympathetic as well as the parasympathetic nerves. Para sympathetic fibres come from the vagus nerve and most sympathetic fibres come from the stellate ganglion.
• The SA node is supplied by the right vagus nerve and right-sided sympathetics.
• The AV node is supplied by the left vagus and left-sided sympathetic nerves.
Mechanism of origin of rhythmic cardiac impulse
Pacemaker
The part of the heart from which rhythmic impulses for heart beat are produced is called pacemaker. In mammalian heart, though the other parts of the heart like AV node, atria and ventricle can also produce the impulse but SA node acts as a pacemaker because the rate of impulse generation by the SA node is highest. However, when there occurs blockage of transmission of impulse from the SA node to the AV node, the pacemaker activity may shift from the SA node to other sites, e.g. the AV node. When pacemaker is other than the SA node, it is called as ectopic pacemaker. Ectopic pacemaker causes abnormal sequence of contraction of different parts of the heart.
Rate of production of rhythmic impulses by different parts of the heart is:
Electrical potential in pacemaker tissue
The electrical potential in a cardiac muscle (contractile myocardial cells—CMC) has been described on page 132. As shown in Fig. 4.1-7 in phase 4 of action potential of cardiac muscle (CMC), there exists a constant resting membrane potential of −85 to −90 mV. In pacemaker (SA node) fibres, however, the resting membrane potential is only of −55 to −60 mV, and that this is not steady, i.e. it shows a slow rise in the resting membrane potential due to slow depolarization (Fig. 4.2-3). Due to this slow depolarization the threshold level of −40 mV is reached very slowly. Once the threshold level of −40 mV is reached, there occurs a rapid depolarization up to +5 mV followed by a rapid repolarization, i.e. there occurs action potential and generation of an impulse. After a rapid repolarization (phase 3 of action potential) once again the resting membrane potential (phase 4 of action potential) is reached, which is not stable and starts rising slowly to again reach at threshold level to produce the second impulse. This slow-rising resting membrane potential in between the action potentials is called prepotential or pacemaker potential (Fig. 4.2-3). Presence of this unique feature in the cells of pacemaker tissue is the underlying mechanism responsible for self-generation of rhythmic impulses (autorhythmicity).
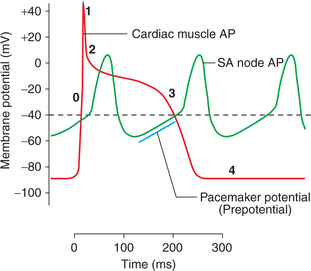
Fig. 4.2-3 Phases of action potential in a cardiac muscle fibre (0, 1, 2, 3, 4) and sinoatrial node showing pacemaker potential. (AP = Action potential.)
Ionic basis of pacemaker potential and action potential in SA node
The myocardial cells present in the SA node and the AV node are called slow fibres (Fig. 4.2-4).
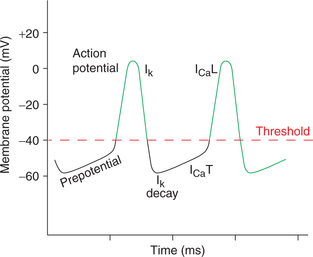
Fig. 4.2-4 Pacemaker potential and its ionic basis. ICaT: Ca2+ conductance through transient channels; ICaL: Ca2+ conductance through long-lasting channels; Ik: potassium conductance.
• The slow fibres of the pacemaker tissue have a unique feature, i.e. leakage of resting membrane for sodium (whereas the resting membrane of fast fibres is relatively impermeable to Na+). This causes slow diffusion of Na+ into the SA nodal fibres under resting condition. This slow entry of Na+ in the cells slowly raises the potential to −55 mV (i.e. causes slow depolarization). This slow depolarization forms the initial part of pacemaker potential (Fig. 4.2-4).
• Then the ‘T (transient) calcium channels’ open up and there is slow influx of Ca2+ causing further depolarization in the same at slower rate till a threshold level of −40 mV is reached. Thus, calcium current (Ica) due to opening of ‘T calcium channels’ forms the later part of the pacemaker potential.
• At the threshold level (−40 mV) the long-lasting calcium channels open up and the action potential starts with a rapid depolarization due to influx of Ca2+. Thus, it is important to note that the depolarization in SA node is mainly due to influx of Ca2+ rather than Na+. Consequently, the depolarization is not as sharp as in the other myocardial fibres.
• At the end of depolarization, potassium channels open up and calcium channels close. This causes K+ to diffuse out of the fibres resulting in a rapid repolarization from −55 to −60 mV.
• Again, due to an unique feature of slow fibres of the SA node (i.e. leakage of resting membrane to Na+) the resting potential does not become stable but slow depolarization starts due to slow influx of Na+ making initial part of prepotential. And ultimately, due to repetition of the abovedescribed steps another action potential is initiated. In this way, impulses are generated at regular intervals of time (autorhythmicity).
Role of autonomic nervous system in controlling heart rhythm
Vagal tone. SA node is richly innervated by the parasympathetic fibres from the right vagus. Normal activity of vagus liberates acetylcholine from its nerve endings, which increases the permeability of the SA nodal fibres for potassium producing hyperpolarization (due to rapid efflux of K+). This hyperpolarization slows the firing rate of the SA node from its automatic rate of 90−120 impulses/min to the actual heart rate of about 72 beats/min. The normal vagal activity is called vagal tone.
Effect of parasympathetic stimulation. Parasympathetic stimulation causes release of acetylcholine at the vagal nerve endings and by the above described mechanism causes (Fig. 4.2-5A):
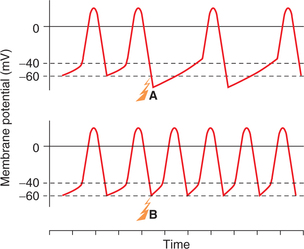
• Decrease in the heart rate by decrease in the rate of sinus rhythm and
• Decrease in the rate of transmission of impulses to ventricles due to decreased excitation of the conducting system. Strong parasympathetic stimulation may even completely block the transmission and ventricles may stop beating for 4−10 s. If it happens, the Purkinje system initiates the rhythm causing the ventricular contraction at a rate of 15−40/min. This phenomenon is called vagal escape.
Effect of sympathetic stimulation. Stimulation of the sympathetic nerves causes release of norepinephrine at the nerve endings. Probably, this increases permeability of cardiac muscle fibres to calcium by opening up L calcium channels. This increases the rate of sinus rhythm and rate of conduction of impulse as well as excitability in all the portions of heart. Force of contraction of atria and ventricles also increases greatly (Fig. 4.2-5B).
Spread of cardiac impulse
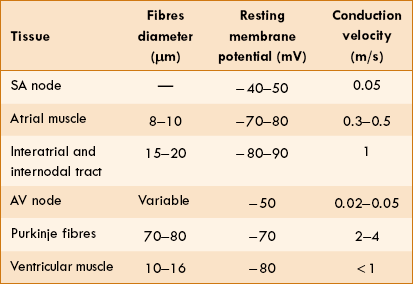
The cardiac impulse which originates in the SA node in the form of action potential spreads throughout the heart through the conduction system (properties of which are summarized in Table 4.2-1) in the sequence given:
SA node and atria. The impulse travels over the muscle fibres of atria from the SA nodal fibres and through the interatrial tract to the left atrium. Conduction through these fibres causes simultaneous depolarization of both the atria. Atrial depolarization is completed in about 0.1 s. The impulse reaches to AV node from SA node within 0.03 s after its origin.
AV node. Conduction through AV node is slow, there is a delay of about 0.1 s. The causes of AV nodal delay are given below:
• Transitional fibres connecting internodal tracts and the AV node are very small and conduct the impulse at a very slow rate.
• There are very few gap junctions connecting successive fibres in the pathway.
The ability of the AV node to slow and block the rapid impulse is called detrimental contraction.
 Important note
This AV nodal delay is useful, for it provides time for completion of the atrial contraction and their emptying (i.e. ventricular filling), before the ventricles contract.
Ventricular conduction. The impulses conducted through the AV node are distributed to ventricles through bundle of His, its branches and Purkinje fibres in 0.08−0.15 s. In humans, depolarization of the ventricular muscle proceeds as (Fig. 4.2-6):
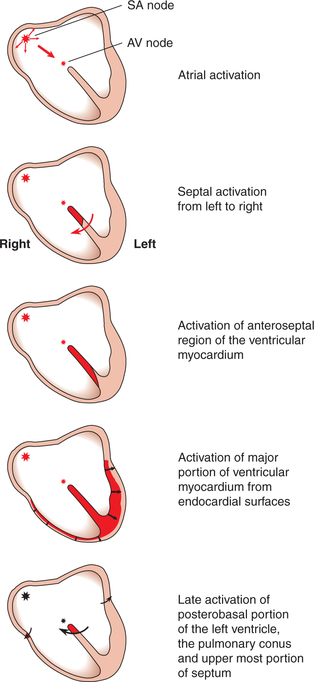
• Starts at the left side of the interventricular septum. Moves first to the right across the middle portion of the septum.
• The wave of depolarization then spreads down the septum to apex of the heart.
• It, then, returns along the ventricular walls to the AV groove, proceeding from the endocardial to the epicardial surface.
• The last parts of the heart to be depolarized are the posterobasal portion of the left ventricles, the pulmonary conus and the upper most portion of the septum.
The total time required for conduction from the SA node to the endocardial surface is 0.22 s.
Heart rate
The normal heart rate in an adult male is 70–80 beats/min.
Factors affecting heart rate
The factors that affect heart rate are given below:
1. Age. Heart rate varies with age, i.e. it decreases as the age increases due to increase in the degree of vagal tone. The normal range of heart rate with different age groups is shown in Table 4.2-2.
Table 2
Heart rate values in relation to age
| Age | Heart rate (beats/min) |
| Birth | 140–150 |
| 1 month | 130–140 |
| 1 year | 110–115 |
| 5 years | 105–110 |
| 10 years | 95–100 |
| 15 years | 80–85 |
| Adults | 70–80 |
| Old age | Up to 100 |
2. Sex. In females the resting heart rate is comparatively higher than in males of same age group.
3. Temperature. Heart rate increases with rise in body temperature. For each 1°F rise in body temperature, the heart rate increases by 10 beats/min.
4. Blood pressure. Heart rate is inversely related to the arterial pressure; this is referred as Marey's law.
5. Emotions. Tachycardia occurs in emotions such as anxiety, anger and fear. Bradycardia is associated with sudden shock and grief. The emotional effects on heart rate are mediated through corticohypothalamic pathways.
6. Exercise. During muscular exercise heart rate increases. For details see page 178.
• Superficial pain causes tachycardia and hypertension (rise in blood pressure).
• Deep pain (visceral pain) is associated with bradycardia and hypotension (fall in blood pressure).
8. Respiration. Heart rate varies with phases of respiration; it increases with inspiration and decreases during expiration. This phenomenon is referred as sinus arrhythmia. It is quite common in infants and children during normal breathing but in adults it is observed only during deep breathing.
Electrocardiography
Introduction
Willem Einthoven, a Dutch physiologist, originally developed the technique of electrocardiography. He was awarded Nobel prize in 1924 for his contribution and is called the father of modern electrocardiography.
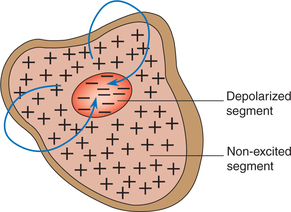
Electrocardiography refers to the extracellular recording of the summed-up electrical events of all the cardiac muscle fibres generated with each heart beat. Electrically, heart behaves as a dipole, i.e. two terminal batteries in which the excited part (depolarized segment) forms a negative pole and the non-excited part forms the positive pole (Fig. 4.2-7). Thus, electrocardiogram (ECG) is nothing but the surface recording of the potential difference between the two poles of the heart dipole at a given time. The record of the potential fluctuations during the cardiac cycle is called the electrocardiogram. The machine used to record these potential fluctuations is called electrocardiograph, which is essentially a sensitive galvanometer.
Recording of ECG
ECG Leads
ECG leads refer to the two electrodes which are placed on the body surface and connected to ECG machine for measuring the potential fluctuations between only two points. ECG is recorded using two types of lead systems, the bipolar leads and unipolar leads.
Bipolar leads
In bipolar recording both the electrodes are active, and one of the active electrode is connected to negative terminal of the ECG machine and the other to the positive terminal. Three standard limb leads are used in the bipolar recording.
In three standard limb leads, the two active electrodes are connected as shown in Fig. 4.2-8.
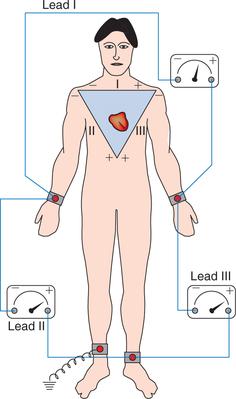
Lead I (LI). In lead I, the two active electrodes are connected to left arm to the positive and right arm to the negative.
Lead II (LII). In lead II, the electrodes are connected to right arm to the negative and left leg to the positive terminals.
Lead III (LIII). In lead III, the electrodes are connected to left arm to the negative and left leg to the positive terminals.
Unipolar leads
In unipolar recording one electrode is an active or the exploring electrode and the other is an indifferent electrode at zero potential. Since the potential at the indifferent electrode remains zero, so in unipolar recording the records obtained represent the potential fluctuations occurring at the site of exploring electrode.
In clinical electrocardiography, two types of unipolar leads are used.
Unipolar chest leads. There are six unipolar chest leads (precordial leads) designated V1−V6. The indifferent electrode is obtained as described above and the active electrode is placed on six points on the chest as shown in Fig. 4.2-9.
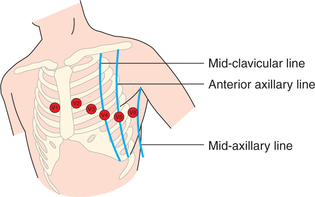
• Lead V1: In the right-fourth intercostal space, just near the sternum.
• Lead V2: In the left-fourth intercostal space, just near the sternum.
• Lead V3: Halfway between V2 and V4.
• Lead V4: In the left-fifth intercostal space at mid-clavicular line.
• Lead V5: In the left-fifth intercostal space at anterior axillary line.
• Lead V6: In the left-fifth intercostal space at mid-axillary line.
Unipolar limb leads. These include lead VL, VF and VR. In unipolar limb leads one exploring (active) electrode is placed over a limb (in lead VL over the left arm, VF over the left foot and lead VR over the right arm) and is connected to the positive terminal of the electrocardiograph. These leads are not used and have been replaced by the augmented limb leads.
Augmented unipolar limb leads. Generally, augmented unipolar limb leads designated as aVR, aVL and aVF are used. In augmented leads the size of potential is increased by 50% without any change in the configuration from the nonaugmented record.
Electrocardiograph
The electrocardiograph (ECG machine) is essentially a sophisticated string galvanometer. A modern electrocardiograph amplifies and records the potential fluctuations on a moving strip of paper. Special paper is used which turns black on exposure to heat. The stylus (recording pen) is made hot by the electrical current flowing through its tip.
Calibration of time and voltage on ECG paper
• The special ECG paper having 1-mm and 5-mm squares (Fig. 4.2-10) is used. The tracing is usually made at a standard recording speed of 25 mm/s.
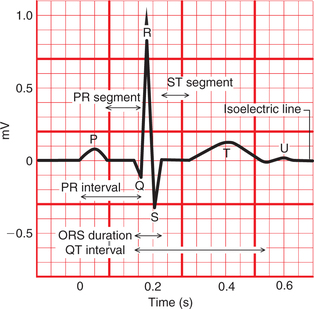
• On horizontal axis, therefore, each millimetre represents 0.04 s (1/25).
• The sensitivity of ECG is adjusted in such a way that apotential fluctuation of 1 mV causes a vertical deflection of 1 cm. Thus, on vertical axis, each millimetre represents 0.1 mV magnitude of potential.
Normal electrocardiogram
Electrocardiogram refers to the record of the potential fluctuations during the cardiac cycle. As a result of sequential spread of the excitation in the atria, the interventricular septum and the ventricular walls (Fig. 4.2-6) and finally repolarization of the myocardium, a series of positive and negative waves designated as P, Q, R, S and T are recorded during each cardiac cycle. Depolarization moving towards an active electrode in a volume conductor produces a positive deflection, whereas depolarization moving in the opposite direction produces a negative deflection.
Therefore, the shape and polarity of P, Q, R, S and T waves will vary in different leads due to differences in the orientation of each lead with respect to the heart (Fig. 4.2-11). Configuration of a typical electrocardiogram from a bipolar limb lead II (L II) is described below (Fig. 4.2-10).
Waves of ECG
P wave
Configuration. P wave is the positive (upright rounded) deflection.
Cause. It is produced by the depolarization of the atrial musculature, therefore it is also called atrial complex.
Duration. Duration of P wave is not more than 0.1 s.
Amplitude. Amplitude of P wave is from 0.1 to 0.12 mV.
Clinical significance. Magnitude of P wave is a guide to the functional activity of atria.
QRS complex
Configuration. QRS complex consists of three consecutive waves. Q wave is a small negative wave which may be absent normally (quite often). It is continued as a tall positive R wave which is followed by a small negative S wave.
Cause. The QRS complex is caused by a ventricular depolarization.
Duration. Duration of QRS complex is normally less than 0.08 s. It is a measure of an intraventricular conduction time.
Amplitude. Amplitude of Q wave is 0.1−0.2 mV, R wave is 1.0 mV and S wave is 0.4 mV (total 1.5−1.6 mV).
Clinical significance. QRS complex from the precordial leads are more important than the limb leads.
T wave
Configuration. T wave is the last, positive, dome-shaped deflection. Normally, it is in the same direction as the QRS complex because the ventricular repolarization follows a path opposite to depolarization.
Cause. T wave represents ventricular repolarization.
Duration. Duration of T wave is approximately 0.27 s.
U wave
Configuration. It is a small round positive wave.
Cause. It occurs due to slow repolarization of papillary muscle.
Duration. Duration of U wave when present is 0.08 s.
Amplitude. Amplitude of U wave is about 0.2 mV.
Significance. It is rarely seen normally. It becomes prominent in hypokalaemia.
Note. Since atrial repolarization coincides with ventricular depolarization, so it is merged with the QRS complex and thus not recorded as a separate wave.
Intervals and segments of ECG
P–R interval
It is measured from the onset of P wave to the onset of the QRS complex. Actually, it is P–Q interval but Q wave is frequently absent, therefore it is called P–R interval.
J point
J point refers to the point on ECG which coincides with the end of depolarization and start of repolarization of ventricles, i.e. it occurs at the end of QRS complex. At this point, since all parts of the ventricles are depolarized so no current is flowing around the heart.
Q–T interval
It is the time from the start of the QRS complex to the end of T wave.
• It indicates total systolic time of ventricles, i.e. ventricular depolarization and repolarization.
• Duration of Q–T interval is about 0.4 s (QRS duration and ST segment duration).
• Clinical significance. Ischaemia and any ventricular conduction defects prolong the Q–T interval. In hypocalcaemia also Q–T interval is prolonged.
Characteristic features of ecg complex in unipolar chest leads and limb leads
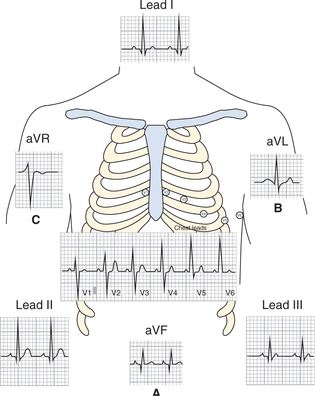
The ECG complex produced in unipolar chest leads (V1−V6) represents the electrical activity of the part of the heart, which lies nearest to the active electrode (Fig. 4.2-12).
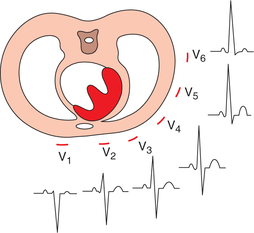
P wave is positive in all the leads because the excitation wave moves from the SA node to the AV node, i.e. posterior to anterior.
QRS complex. It represents the electrical activity of ventricles and so its configurational changes in different leads are as below:
• In V1 and V2 (which reflect right ventricular activity), the main QRS complex is negative.
• In V3 and V4 (which reflect activity of both ventricles including interventricular septum) the main QRS complex is biphasic.
• In V5 and V6 (which reflect left ventricular activity) mainly the main QRS complex is positive. Thus as shown in Fig. 4.2-12.
• R wave gradually increases in size from V1 to V6 leads. In leads V1, R wave represents the activity of right ventricle and in V6 of left ventricle.
• S wave gradually decreases in size from lead V1 to V6. In lead V1, S wave represents activity of left ventricle and in lead V6 of right ventricle.
Lead VF and aVF. These leads reflect the electrical activity of inferior surface of the heart, which is formed by parts of both right and left ventricles and interventricular septum. Therefore, the QRS complex in these leads like that of V3 and V4 is predominantly biphasic (Fig. 4.2-11A).
Lead VL and aVL. These leads reflect the electrical activity of left outer side of the heart, which is mainly formed by the left ventricle. Therefore, the QRS complex in these leads like that of V6 is predominantly positive (Fig. 4.2.11B).
Lead VR and aVR. These leads reflect the activity of the cavity of the ventricles, irrespective of the position of heart. Therefore, P wave, QRS complex and T wave all have negative deflection (Fig. 4.2-11C).