Functional Anatomy of Heart and Physiology of Cardiac Muscle
 Process of excitability and contractility
Functional anatomy of heart
The heart is a muscular pump designed to ensure the circulation of blood through the tissues of the body. The human heart weighs approximately 300 g and consists of two halves, right and left. The right heart circulates blood through the lungs for the purpose of oxygenation (i.e.through pulmonary circulation). The left heart circulates blood to the tissues of the entire body (i.e. through thesystemic circulation).
Chambers of heart
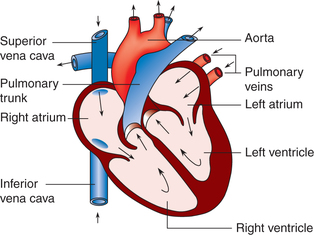
Each half of the heart consists of an inflow chamber called the atrium and an outflow chamber called the ventricle (Fig. 4.1-1). Thus, there are four chambers in the heart.
Atria
Interatrial septum separates the right and left atria which are thin-walled chambers.
Right atrium receives deoxygenated blood from the tissuesof the entire body through the superior and inferior venacavae. This blood passes into the right ventricle through the right atrioventricular orifice, which is guarded by a tricuspid valve. The right atrium has got the pacemaker known assinoatrial (SA) node that produces cardiac impulses andatrioventricular (AV) node that conducts these impulses to the ventricles.
Left atrium receives oxygenated blood from the lungs through the four pulmonary veins (two right and two left). This blood passes into left ventricle through the left atrioventricular orifice, which is guarded by the mitral valve.
Ventricles
Interventricular septum separates the right ventricle from the left ventricle.
Right ventricle receives blood from the right atrium and pumps through the pulmonary trunk (which divides intoright and left pulmonary arteries) into the lungs. The pulmonary valve is present at the junction of right ventricle and pulmonary trunk.
Left ventricle receives blood from the left atrium and pumps out into systemic circulation through the aorta. Aortic valve is present at the junction of left ventricle and the ascending aorta.
Valves of heart
There are four valves in a human heart, two AV valves andtwo semilunar valves. Valves allow unidirectional flow of blood.
Atrioventricular valves
The AV valves open towards the ventricles and close towards the atria. They allow blood to flow from atria to ventricles. But when ventricles contract, they remain closed and thus prevent backflow of blood from ventricles to atria.
• The right AV valve is known as tricuspid valve and is made of three cusps: anterior, posterior and septal (Fig. 4.1-2).
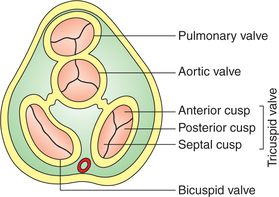
• The left AV valve is called mitral valve or bicuspid valve and is made of two cusps: anterior and posterior (Figs4.1-2 and 4.1-3).
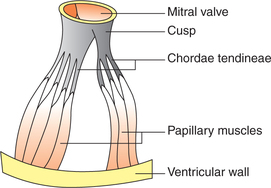
• At the periphery the cusps (flaps) of the AV valves are attached to the AV ring, which is the fibrous connection between the atria and ventricles. The free edges of the cusps are attached to the papillary muscles through the cord-like structures called the chordae tendineae (Fig. 4.1-3).
• Papillary muscles arise from the inner surface of ventricles and contract when the ventricular walls contract.
They prevent the bulging of the valves into the atria when ventricles contract.
Semilunar valves
• Semilunar valves open away from the ventricles and close towards the ventricles. These valves open when ventricles contract allowing the blood to flow from the left ventricle to aorta and from the right ventricle to the pulmonary trunk.
• Semilunar valves close when ventricles relax, thus preventing backflow of blood from aorta or pulmonary trunk intothe ventricles.
• Aortic valve is the semilunar valve present at the opening of aorta in the left ventricle. It is made of three semilunar cusps: one anterior and two posterior (Fig. 4.1-2).
• Pulmonary valve is the semilunar valve present at the opening of pulmonary trunk into the right ventricle. It is also made of three semilunar cusps: one posterior and two anterior (Fig. 4.1-2).
Structure of the walls of heart
Walls of the heart are composed of thick layer of cardiac muscle, the myocardium (see page 131), covered externally by the epicardium and lined internally by the endocardium.
Skeleton of the heart consists of fibrous rings that surround the AV, pulmonary and aortic orifices, and are continuous with the membranous part of the ventricular septum.
Pericardium
Pericardium consists of two layers: outer fibrous and inner serous (Fig. 4.1-4).
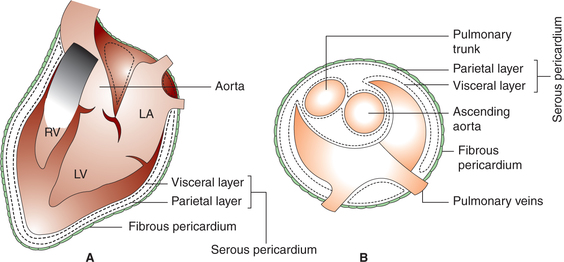
Fibrous pericardium surrounds the heart like a bag and is attached with the surrounding structures.
Serous pericardium has parietal and visceral layers. The parietal layer of serous pericardium lines the fibrous pericardium and is reflected around the roots of the great vessels to become continuous with the visceral layer of serous pericardium that closely covers the heart and is often called the epicardium. The slit-like space between the parietal andthe visceral layers of the serous pericardium is called pericardialcavity, which contains small amount of pericardial fluid that acts as a lubricant to facilitate movement of the heart.
Physiology of cardiac muscle
Structural organization of cardiac muscle
• The cardiac muscle fibres are striated and resemble quite a lot to the skeletal muscle fibres in structure. However,unlike the skeletal muscles, the cardiac muscles are involuntary (like smooth muscles). Thus cardiac muscles share some characteristics with the skeletal muscles and others with the smooth muscles.
• The cardiac muscle fibres are ribbon-like rather than cylindrical. These are branched and interdigitate freely with each other, but each fibre is a completely separate unit. The branches from the neighbouring fibres join together. At the point of contact of two muscle fibres, the membranes of both the muscle fibres are fused together and thrown into an extensive infolding forming the so-called intercalated disc (Fig. 4.15). These discs form tight junctions between the muscle fibres and do not allow the ions to pass through. However, the intercalated discs provide a strong union between fibres and thus play an important role during the contraction of muscle fibres by transmitting pull of one contractile unit along its axis to the next, thereby increasing force of contraction.
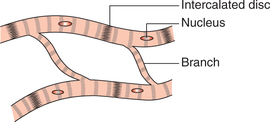
• Along the sides near the outer border of intercalated disc, the two adjacent muscle fibres are connected with each other through the gap junctions. The action potential passes from one cardiac muscle cell to the other through gap junctions, which provide low-resistance bridges and thus the cardiac muscle acts as a functional syncytium of many cardiac cells. In this way, the cardiac impulse spreads throughout the muscle mass quickly resulting in a co-ordinated contraction of the whole tissue. In the heart, the cardiac muscle forms two separate syncytia, i.e. the atrial syncytium (walls of two atria) and the ventricular syncytium (walls of the two ventricles). Action potential is conducted from the atrial syncytium to the ventricular syncytium by way of specialized conducting system. Each syncytiumobeys all-or-none law. Because the atrial and the ventricular syncytium are two separate syncytia, there fore, atria contract as hort time ahead of the ventricular contraction.
• The cardiac muscle fibres are richly supplied by the capillaries (one capillary/fibre).
Structure of a cardiac muscle fibre
Each muscle fibre is about 80 μm long and about 15 μm broad. Its cell membrane is called sarcolemma and the cytoplasmis called sarcoplasm. The sarcoplasm is in abundance and contains all the cell organelles, a well-developed sarcoplasmicreticulum and a centrally placed nucleus. Each muscle fibre is made up of number of myofibrils, which lieparallel to each other. Each myofibril is 2 μm is diameter.
Myofibril. Each myofibril consists of thick and thin filaments.Essentially, the structure and striations as seen under light microscope and the detailed electron microscopic structure are similar to that of a skeletal muscle (see page 47).
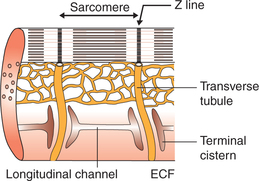
Sarcotubular system
The sarcotubular system in the cardiac muscles is well developed like that of the skeletal muscle. However, the tubules of the T-system penetrate the sarcomere at Z line (Fig. 4.1-6). There fore, in cardiac muscles, there is only one triad per sarcomere as compared to two in skeletal muscle (page 49).
Process of excitability and contractility: an electromechanical phenomenon
The cardiac muscle being an excitable tissue produces anaction potential (electrical phenomenon) when stimulated and responds by contracting.
Electrical potentials in cardiac muscle
Resting membrane potential
The resting membrane potential of a normal cardiac musclefibre is −85 to −95 mV (negative interior with reference to exterior).
Action potential
When stimulated, each cardiac muscle fibre shows an electrical activity known as propagated action potential.
The action potential recorded from a single cardiac muscle fibre is unusually long and can be divided into five distinct phases (Fig. 4.1-7).
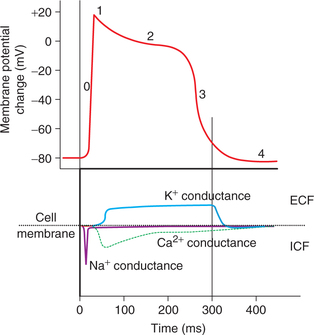
Fig. 4.1-7 Various phases of action potential and ion conductance:Phase 0 = depolarization; Phase 1 = rapid repolarization;Phase 2 = plateau phase; Phase 3 = late rapid repolarizationand Phase 4 = resting potential.
Phase 0: Rapid depolarization. The phase 0 (upstroke) is characterized by the depolarization which proceeds rapidly,an overshoot is present, as in skeletal muscle and nerve.In mammalian heart, depolarization lasts about 2 ms. In thisphase, amplitude of potential reaches up to +20 to +30 mV(positive interior with reference to exterior).
Ionic basis. The initial rapid depolarization and the overshoot are due to the rapid opening of voltage-gated Na+ channels and rapid in flux of Na+ ions similar to that occurring in the nerve and the skeletal muscle.
At −30 to −40 mV membrane potential the calcium channels also open up and influx of Ca2+ ions also contributes inthis phase.
Phase 1: Initial rapid repolarization. Rapid depolarization is followed by a very short-lived, slight, rapid repolarization.The membrane potential reaches from +30 to −10 mV duringthis phase.
Ionic basis. The initial rapid repolarization is due to closure of Na+ channels and opening of K+ channels resulting intransient outward current.
Phase 2: Plateau. During plateau phase, the cardiac muscle fibre remains in the depolarized state. The membrane potential falls very slowly only to −40 mV during this phase.The plateau lasts for about 100–200 ms. This plateau inaction potential explains the 5–15 times longer contraction time of the cardiac muscle as compared to skeletal muscle.
Ionic basis. Very slow repolarization during the plateauphase is due to:
• Slow influx of Ca2+ ions resulting from opening of sarcolemmal L-type Ca2+ channels.
• Closure of a distinct set of K+channels called the inward rectifying K+ channels.
Phase 3: Repolarization. During this phase, complete repolarization occurs and the membrane potential falls to theapproximate resting value −80 mV. This phase lasts forabout 50 ms.
Ionic basis. The slow repolarization results from the closing of Ca2+ channels and opening of following two types of K+ channels:
• Delayed outward rectifying K+channels, which are voltage-gated and are activated slowly.
• Ca2+activated channels, which are activated by the elevated sarcoplasmic Ca2+ levels.
Phase 4: Resting potential. In this phase of resting membranepotential (also called as polarised state) the potentialis maintained at −90 mV by activation of Na+−K+ ATPase pump.
The duration of action potential is about 250 ms at a heart rate of 75 beats/min. The duration of action potential decreases with increased heart rate (150 ms at a heart rateof 200 beats/min). This type of action potential found incontractile myocardial cells of the ventricles is referred to as fast response.
Spread of action potential through cardiac muscle
The cardiac muscle acts as a physiological syncytium due to the presence of gap junctions amongst the cardiac muscle fibres. Because of this the action potential spreads through the cardiac muscles very rapidly. Further, as there are two syncytia (the atrial and the ventricular) in the heart, so the action potential is transmitted from atria to ventricles only through the fibres of specialized conductive system.
Excitation–contraction coupling phenomenon in cardiac muscles
Excitation–contraction coupling refers to the sequence of events by which an excited plasma membrane of a muscle fibre leads to cross-bridge activity by increasing sarcoplasmic calcium concentration.
The sequence of events during excitation–contraction coupling in the cardiac muscle is similar to those observed ina skeletal muscle (see page 49) with the following exception:
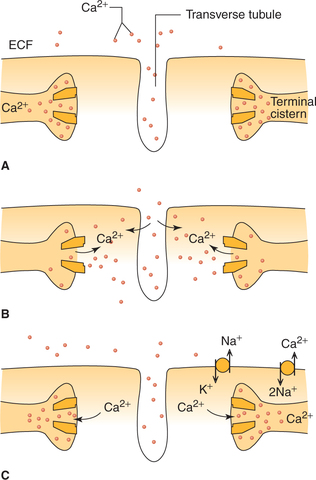
In cardiac muscle (as against that in skeletal muscle), extra calcium ions diffuse into the sarcoplasm from T-tubules (Fig. 4.1-8) without which the contraction strength would be considerably reduced. Whereas, skeletal muscle contractionis hardly affected by calcium concentration in ECF.
Process of cardiac muscle contraction
The molecular mechanism of cardiac muscles contractionby cross-bridge cycling and sliding of filaments primarily similar to that of skeletal muscles (page 50) and smooth muscles. However, in cardiac muscle:
Relaxation of cardiac muscle
Relaxation of cardiac muscle (diastole) occurs when levels of Ca2+ ions fall in the cardiac muscle fibres. During diastole,the Ca2+ ions are extruded out of the cardiac muscle fibre by a carrier system operating at the sarcolemma in which twoNa+ ions are exchanged for each Ca2+ ion extruded (Fig. 4.1-8C). Thus, the rate of Ca2+ ion extrusion depends on the gradientof Na+ created by Na+−K+ ATPase.
 Important note
Properties of cardiac muscle
The basic properties of a cardiac muscle include:
Some of the properties of cardiac muscle, viz. automaticity,rhythmicity and conductivity are discussed in Chapter 4.2 (see page 138).
The characteristics of excitability and contractility aredescribed here.
Excitability
Excitability (bathmotropism) is the property by which tissues respond to stimuli. The cardiac muscle responds by thedevelopment of action potential. The essential features of theresting membrane potential and action potential of cardiacmuscle have been discussed on page 132.
The characteristic of a cardiac muscle excitability which needs a special emphasis is its refractory period.
Refractory period
Refractory period refers to the period following actionpotential during which the cardiac muscle does not respond to a stimulus. Cardiac muscle has a long refractory period (250−300 ms in ventricles and about 150 ms in atria). It is of two types.
1. Absolute refractory period (ARP). During this period, the cardiac muscle does not show any response at all. It extends from phase 0 to half of phase 3 of action potential, i.e. until the membrane potential reaches approximately −50 mV during repolarization (Fig. 4.1-9). Normal duration of ARPin the ventricles is about 180−200 ms.
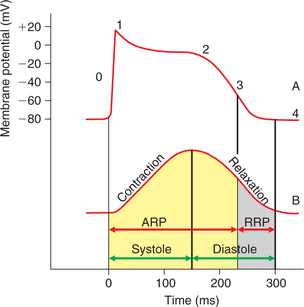
Fig. 4.1-9 Record of action potential (A) and mechanical response (B) from the cardiac muscle fibre shown on same timescale depicting the significance of long refractory period. ARP =absolute refractory period; RRP = relative refractory period.
2. Relative refractory period. During this period, the muscle shows response if the strength of stimulus is increased to maximum. It extends from second half of the phase 3 tophase 4 of the action potential. Normal duration of relative refractory period in ventricles is about 50 ms.
Significance of long refractory period incardiac muscle
As shown in Fig. 4.1-9, the cardiac muscle is refractory to any stimulus during the contraction phase (systole); therefore,the complete summation of contractions and thus tetanus cannot be produced in the cardiac muscle. This property is very useful. Since the heart has to function as a pump, it must relax, get filled up with blood and then contract to pump out the blood. A tetanized heart would be useless as a pump.
Contractility
Contractility is the ability of the cardiac muscle to actively generate force to shorten and thicken to do work when sufficient stimulus is applied.
Mechanical response in cardiac muscle fibre begins just after the start of depolarization and lasts about 1.5 times aslong as the action potential (Fig .4.1-10B). Thus the mechanical response (300 ms) overlaps the electrical response (200 ms) for the whole period. This is in contrast to the skeletal muscle, where the mechanical response begins a few milliseconds after the end of repolarization and lasts for 30–50 ms in the mammalian skeletal muscle and 100 ms in the amphibian skeletal muscle (Fig. 4.1-10A).
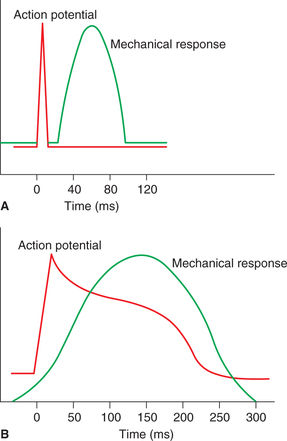
Fig. 4.1-10 Relationship of action potential and mechanical response: A, in skeletal muscle and B, in cardiac muscle.
Characteristic features of myocardial contractility and factors affecting are:
1 All-or-none law
The response of a cardiac muscle to a stimulus is all-or-none in character, i.e. when a stimulus is applied either the heart does not contract at all (none response) or contracts to its maximum ability (all response). This is because of the syncytial arrangement of the cardiac muscle fibres. There fore, the‘all-or-none’ law in heart is applicable to whole of function alsyncytial unit, i.e. the entire atria or entire ventricle. Whereas in skeletal muscle it is applicable only to a single muscle fibre.
2 Effect of preload
A load which starts acting on a muscle before it starts to contractis called preload. The preload increases the initial length of the muscle. According to Starling's law, the force of contraction is the function of the initial length of the muscle fibres, and up to physiological limits the greater the initial length, greateris the force of contraction. In the case of heart muscle, theend diastolic volume forms the preload. The effect of changing end diastolic volume on force of cardiac contraction has been studied by Frank and Starling in 1910. The Frank–Starling law of heart states that with in physiological limits the force of cardiac contraction is proportional to its end diastolic volume.
Length–tension relationship, i.e. the relation between the initial fibre length and total tension in cardiac muscle is basically similar to that in the skeletal muscle. In cardiac muscle, the length–tension relationship graph is plotted with the end diastolic volume in mL (representing initial length) along the horizontal axis and the pressure developed in the ventricle in mm Hg (representing tension) along the vertical axis (Fig. 4.1-11). The following inferences canbe drawn from this graph (Starling's curve).
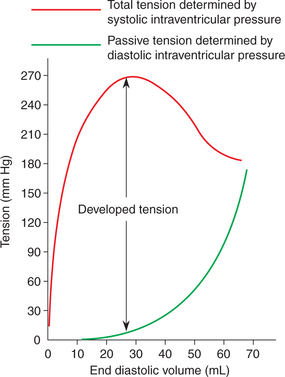
Diastolic intraventricular pressure represents the passive tension and it increases with the increase in end diastolic volume (i.e. with the passively increased muscle length). It is important to note that the pressure–volume curve for ventricles in diastole is initially quite flat, indicating that large increase in volume can be accommodated with only small increase in pressure.
Systolic ventricular pressure represents the active tension developed (isometric tension), which is proportionateto the degree of diastolic filling of the heart (initial length of muscle fibres). The graph (Fig. 4.1-11) shows that the developedtension increases as the diastolic volume increasesuntil it reaches a maximum (ascending limb of Starlingcurve), then tends to decrease (descending limb of Starling'scurve). The descending limb is instead due to the beginningof disruption of the myocardial fibres.
Clinical significance of the Frank–Starling law of heart and its role in control of cardiac output is discussedin Chapter 4.3 on ‘Heart as a Pump’ (see page 54).
3 Effect of afterload
Afterload refers to the load which acts on the muscle after the beginning of muscular contraction. The after load affecting the force of contraction of cardiac muscle is represented by the resistance against which the ventricles pump the blood. The after load (resistance) for right ventricle islow in pulmonary artery due to its intrathoracic location. The after load (resistance) for the left ventricle is high in the aorta due to resistance to blood flow through the aortic valves and systemic blood vessels called peripheral resistance.
The force–velocity curve is plotted by noting the velocity of muscle contraction with progressively increasing load onthe muscle. In the heart, load is represented by the resistanceagainst which the ventricles pump the blood andvelocity of muscle contraction is represented by the strokeoutput. Following inferences can be drawn from the force–velocity curve (Fig. 4.1-12A).
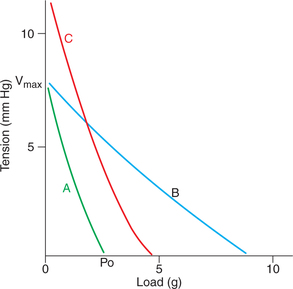
Fig. 4.1-12 Force–velocity curve in cardiac muscle (A), effectof change of initial length (B) and effect of catecholamines orincreased Ca2+ concentration in ECF (C) on it.
• When the load is zero, the muscle contracts rapidly and the velocity of muscle shortening is maximum (Vmax).
• As the load increases progressively, the velocity of shor tening decreases till it reaches zero. At this point, force developed is called maximum isometric force and is represented by Po. Therefore, during muscle contraction the velocity of shor tening and force developed are inversely related. The force–velocity relationship curve is influenced by change in initial length of the muscle and the effect of catecholamines.
– Effects of change in initial length on force–velocity relationship curve. An increase in change in the initial length (with in physiological limits) increases the force of contraction (Po) without changing the velocity (Vmax), i.e.the relationship shifts to the right (Fig. 4.1-12B).
– Effect of catecholamines or increased calcium concentration in ECF. The catecholamines or increased Ca2+concentration in ECF, both cause an increase in Poas well as Vmax (Fig. 4.1-12C).
Significance of force–velocity relationship. The cardiacmuscle can alter its work and power (rate of working) at any given load and muscle length by nature of its changing force–velocity relationship.