Heart as a Pump: Cardiac Cycle, Cardiac Output and Venous Return
 Introduction
Cardiac cycle
Introduction
The heart as a pump can be considered actually comprising of two separate pumps in the series: a right heart that pumps the blood through the lungs and a left heart that pumps the blood through the peripheral organs. To act as a pump, the heart contracts and relaxes rhythmically. The terms systole (contractile phase) and diastole (relaxation phase) usually refer to the ventricular events but may be prefixed by ‘atrial’ to refer to the atrial contraction and relaxation, respectively. As discussed in Chapter 4.2 the cardiac impulse arising from the SA node spreads in the whole heart. The electrocardiogram (ECG) records the electrical events that precede and initiate the corresponding mechanical events as:
• P wave, which is caused by spread of depolarization through the atria, and this is followed by atrial contraction.
• QRS waves, which appear 0.16 s after the onset of P wave, are caused by depolarization of the ventricles, which initiates contraction of the ventricles.
• T wave represents the stage of repolarization of the ventricles at which time the ventricular muscle fibres begin to relax. Therefore, T wave occurs slightly before the end of ventricular contraction.
The cardiac cycle thus includes both electrical and mechanical events that occur from the beginning of one heart beat to the beginning of the next.
Cardiodynamics is the study of the mechanical events associated with the contraction and relaxation of the heart. These include:
Phases of cardiac cycle
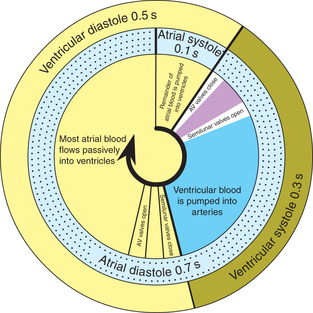
Duration of each cardiac cycle at a normal heart rate (HR) of 75 beats/min is 60/75 = 0.8 s.
During each cardiac cycle both atria contract (atrial systole) and relax (atrial diastole), and both ventricles contract (ventricular systole) and relax (ventricular diastole).
Therefore, each cardiac cycle can be considered to consist of simultaneously occurring atrial and ventricular cycles with following phases (Figs 4.3-1 and 4.3-2).
Atrial cycle
Atrial systole
• Atrial systole or the atrial contraction phase lasts for 0.1 s and coincides with the last rapid filling phase of ventricular diastole (Figs 4.3-1 and 4.3-2).
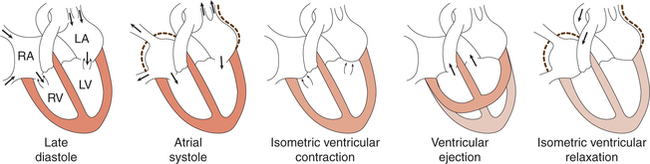
• Before the beginning of atrial systole, the ventricles are relaxing, the atrioventricular (AV) valves are open and the blood is flowing from the great veins into the atria and from the atria into the ventricles. Thus, the atria and ventricles are forming a continuous cavity.
The contraction of atria causes the following.
• Increase in the intra-atrial pressure. During atrial systole there occurs a sharp rise in intra-atrial pressure by 4–6 mm Hg in right atrium and by 7–8 mm Hg in left atrium, and causes a pressure wave recorded as a wave from the jugular vein (‘a’ stands for atrial systole).
• Increase in the ventricular pressure. The intraventricular pressure (about 6–7 mm Hg in right ventricle and about 7 to 8 mm Hg in left ventricle) due to pumping of blood in the ventricles. In the intraventricular pressure curve (Fig. 4.3-3), the segment AB represents the pressure changes during atrial systole. The point A denotes the onset of atrial systole and the point B denotes the closure of AV valve.
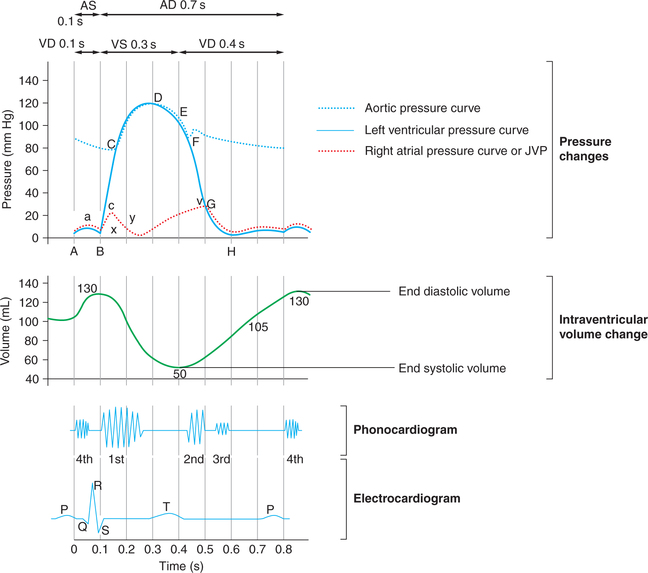
• When the atrial contraction begins about 105 mL (75%) of the blood has already flown into the ventricles. The atrial contraction causes additional 25 mL (25%) filling of the ventricles. Thus at the end of atrial systole, i.e. at the end of ventricular diastole, the ventricular volume is about 130 mL. This is called end-diastolic volume (EDV).
• During atrial systole the pressure in the aorta is about 80 mm Hg.
Atrial diastole
After the atrial systole, there occurs atrial diastole (0.7 s). This period coincides with the ventricular systole and most of the ventricular diastole (Fig. 4.3-1).
During the atrial diastole, the atrial muscles relax and there occurs gradual filling of the atria due to continuous venous return and the pressure gradually increases in the atria and drop down to almost zero with the opening of AV valves (Fig. 4.3-3). Then the pressure again rises and follows the ventricular pressure during the rest of atrial diastole.
Ventricular cycle
Ventricular systole
After the atrial contraction phase is over, the ventricles get excited by the impulse travelling along the conduction system and start contracting. The ventricular systole lasts for 0.3 s and has following phases.
1 Phase of isovolumic (isometric) contraction
• With the beginning of ventricular contraction the ventricular pressure exceeds the atrial pressure very rapidly causing closure of AV valves (this event is responsible for the production of first heart sound).
• Since the AV valves have closed and semilunar valves have not opened, so the ventricles contract as a closed chamber and the pressure inside the ventricles rises rapidly to a high level.
• In the intraventricular pressure curve (Fig. 4.3-3), this phase is represented by the segment BC. The point C denotes the opening of semilunar valves and commencement of ventricular ejection phase.
• As the ventricles contract, the volume of blood in the ventricles does not change, so this phase is called isovolumic contraction phase.
• During this phase, due to sharp rise in the ventricular pressure, there occurs bulging of AV valves into the atria producing a small but sharp rise in the intra-atrial pressure called c-wave. (‘c’ stands for contraction of the ventricle.)
• This phase lasts for 0.05 s, until the pressure in the left and right ventricles exceeds the pressure in the aorta (80 mm Hg) and pulmonary artery (10 mm Hg), and the aortic and pulmonary valves open.
2 Phase of ventricular ejection
The ventricular ejection phase begins with the opening of semilunar valves and lasts for about 0.25 s. It can be further divided into two phases.
Rapid ejection phase. As soon as the semilunar valves open, the blood is rapidly ejected out for about 0.1 s. About two-thirds (89 mL of blood) of the stroke volume (SV) is ejected out by each ventricle in this phase.
The ventricles contract at a rate greater than the rate at which blood is ejected so that a great rise in the pressure occurs. Pressure rises to maximum of 120 mm Hg in the left ventricle and 25 mm Hg in the right ventricle. In the intraventricular pressure curve (Fig. 4.3-3), this phase is denoted by the segment CD. The point D denotes the peak point of intraventricular pressure after which it starts declining.
Slow ejection phase. It refers to the latter two-third of systole (about 0.15 s) during which the rate of ejection declines. There is no further ventricular contraction and the pressure starts declining (Fig. 4.3-3, segment DE). About one-third of the SV is ejected during this phase. The intraventricular pressure starts declining and falls to a value slightly lower than in the aorta, but for a short period momentum keeps the blood flowing forward.
The aortic pressure starts rising along with the intraventricular pressure during rapid ejection phase and reaches maximum (120 mm Hg) at the end of rapid ejection phase. During reduced ejection phase the aortic pressure starts falling along with the ventricular pressure.
The percentage of the EDV that is ejected out with each stroke during systole (about 65%) is called ejection fraction. Thus, about 50 mL of the blood in each ventricle at the end of ventricular systole is called end-systolic volume.
Ventricular diastole
1 Protodiastole
When the ventricular systole ends, the ventricles start relaxing and intraventricular pressure falls rapidly. This phase lasts for 0.04 s. During this phase, the elevated pressure in the distended arteries (aorta and pulmonary artery) immediately pushes the blood back towards ventricles, which snaps the semilunar valves to close. Closure of semilunar (i.e. aortic and pulmonary) valves prevents the movement of blood back into the ventricles and produces the second heart sound (S2). It also causes a dicrotic notch in the down slope of aortic pressure called the incisura.
In the intra ventricular pressure curve (Fig. 4.3-3), this phase is represented by the segment EF and the point F denoted the closure of semilunar valves.
2 Isovolumic or isometric relaxation phase
• This phase begins with the closure of the semilunar valves and lasts for about 0.06 s.
• Since semilunar valves have closed and the AV valves have not yet opened, so the ventricles continue to relax as closed chambers in this phase. This causes rapid fall of pressure inside the ventricles (from 80 to about 2−3 mm Hg in the left ventricle).
• As in this phase the ventricular volume remains constant, so this phase is called isovolumic or isometric relaxation phase.
• In the intraventricular pressure curve (Fig. 4.3-3) the segment FG represents this phase and the point G coincides with the opening of AV valve.
• During rest of the diastole the aortic pressure smoothly declines. By the time the aortic pressure declines to about 80 mm Hg, another ventricular systole boosts the aortic pressure again.
• This phase ends when the AV valves open, as indicated by the peak of v-wave on the atrial pressure tracing (Figs4.3-2 and 4.3-3).
3 Rapid passive filling phase (0.11 s)
During ventricular systole, the atria are in diastole and venous return continues so that the atrial pressure is high. When the AV valves open, the high atrial pressure causes a rapid, initial flow of blood into the ventricles. The rapid passive filling phase produces the third heart sound (S3), which is not normally audible in adults but may be heard in children.
Once the AV valves open, the atria and ventricles are a common chamber and pressure in both cavities falls as ventricular relaxation continues (segment GH in Fig. 4.3-3).
4 Reduced filling and diastasis (0.19 s)
In this phase pressure in the atria and ventricles reduces slowly and remains little above zero. This decreases the rate of blood flow from the atria to ventricle causing a very slow filling called diastasis.
Note. It is important to note that about 75% of blood passes from the atria to the ventricles during rapid filling and reduced filling phases of the ventricular diastole.
5 Last rapid filling phase (0.1 s)
The last rapid filling phase of ventricular diastole coincides with the atrial systole. As described in the beginning, the atrial systole brings about the last rapid filling phase and pushes the additional 25% of the blood in the ventricles. With this phase the ventricular cycle is completed.
Events during cardiac cycle
The events associated with contraction and relaxation of the heart during a cardiac cycle include pressure changes in the ventricles, atria and aorta as well as volume changes in the ventricles and valvular events. Most of these have been described during various phases of cardiac cycle.
Pressure changes in the pulmonary artery
Pressure curve in the pulmonary artery is similar to that of the aorta but pressures are low (about one-sixth of that in aorta). Pulmonary artery systolic pressure averages 15−18 mm Hg and its pressure during diastole is 8−10 mm Hg.
During ventricular ejection phase about 80 mL of the blood is ejected out.
Valvular events (Heart Sounds)
A total of four heart sounds (first, second, third and fourth) are produced by certain mechanical activities during each cardiac cycle.
First heart sound (HS1)
Cause. First heart sound is produced by the vibrations set up by the sudden closure of AV valves at the start of ventricular systole during phase of isovolumic contraction (Fig. 4.3-3).
Characteristics. The first heart sound is long and soft when HR is low and loud when the HR is high. Its duration is about 0.15 s and frequency is 25−45 Hz. It sounds like the spoken word ‘LUBB’.
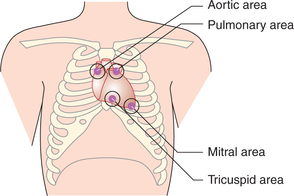
Site for auscultation. It can be heard by auscultation of the chest with stethoscope. It is best heard over mitral and tricuspid areas. Mitral area is located in the fifth intercostal space just internal to mid-clavicular line. Tricuspid area is located in the fifth intercostal space near the sternum (Fig. 4.3-4).
Second heart sound (HS2)
Cause. It is caused by the vibrations associated with closure of the semilunar valves just at the onset of ventricular diastole.
Characteristics. The second heart sound is short, loud, high-pitched sound. Its duration is 0.12 s and frequency is 50 Hz. It sounds like the spoken word ‘DUBB’.
Site for auscultation. It can be heard by auscultation of the chest with stethoscope. It is best heard over the aortic and pulmonary areas. Aortic area lies in the right second intercostal space near the sternum, pulmonary area is in the left second intercostal space close to sternum (Fig. 4.3-4).
Correlation with ECG. Second heart sound usually coincides with the end of T wave in ECG.
Third heart sound (HS3)
Cause. Third heart sound is caused by the vibrations set up in the cardiac wall by inrush of blood during rapid filling phase of the ventricular diastole.
Characteristics. Third heart sound is a short, soft and low-pitched sound. Its duration is 0.1 s. Normally, it cannot be heard by auscultation with stethoscope.
Correlation with ECG. The third heart sound appears between T and P waves of ECG.
Duration of systole and diastole vis-a-vis heart rate
Effect of heart rate
• Cardiac muscle has the unique property of contracting and repolarizing faster when the HR is high.
• Therefore, when the HR increases the total duration of cardiac cycle decreases, e.g. at an HR of 200 beats/min the total duration of cardiac cycle is 60/200 = 0.3 s.
• It is important to note that though the duration of all phases of the cardiac cycle decreases at high HR, the duration of diastole decreases much more than the duration of systole. For example, when the HR increases from 75 to 200 beats/min, the duration of systole decreases from 0.3 to 0.16 s, while that of diastole decreases from 0.5 to 0.14 s (Table 4.3-1).
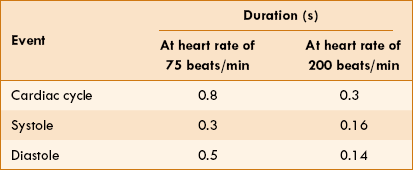
This fact has clinical implications:
• It is during diastole that the heart muscle rests and coronary blood flow to the subendocardial portion of the left ventricle occurs only during diastole. Therefore, at a very high rate there occurs reduction in cardiac perfusion and there are chances of myocardial ischaemia.
• Furthermore, most of the ventricular filling occurs in the diastole. Therefore at very high HR filling may be compromised to such a degree that cardiac output (CO) per minute falls and symptoms of the heart failure develop.
Arterial pulse
Arterial pulse is also an event related to the cardiac cycle. The blood forced into the aorta during the systole not only moves the blood in the vessels forward, but also sets up a pressure wave that is transmitted along the arteries to the periphery. The pressure wave expands the arterial walls as it travels and expansion is palpable as the pulse.
Methods of recording arterial pulse
The tracings of arterial pulse can be made by the following techniques of recording.
1. Manometric technique. It is used in animals. In this technique a cannula is inserted into the dissected artery and is connected to manometer or any other recording device to obtain the arterial pulse tracing.
2. Electronic transducer method. The electronic transducer is placed on the skin overlying any artery.
Interpretation of arterial pulse tracing
The pulse tracing recorded from the carotid artery shows the following characteristics (Fig. 4.3-5):
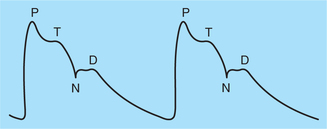
Fig. 4.3-5 Record of arterial pulse from a carotid artery: (P) percussion wave; (T) tidal wave; (N) dicrotic notch and (D) dicrotic wave.
• Ascending limb, also known as anacrotic limb or primary limb, is due to the rise in pressure during systole.
• Descending limb, also known as catacrotic limb, represents the fall in pressure during diastole.
• Percussion wave (P) corresponds to the ejection phase of the ventricular systole.
• Tidal wave (T) is due to falling blood column during slow ejection phase.
• Dicrotic notch (N) is due to the closure of aortic valve and marks end of the ventricular systole.
• Dicrotic wave (D) is due to rebound of blood column from the closed aortic valve.
When the record is taken from the peripheral arteries at a distant place from the heart, e.g. femoral or radial arteries, the contour or shape of record changes. In arterioles and capillaries, the waves disappear.
Examination of arterial pulse
Examination of the arterial pulse is an essential feature of a clinical examination. Arterial pulse can be palpated from any superficial artery, e.g. radial, femoral, dorsalis pedis and carotid, etc. Most frequently, pulse is examined from the radial artery because it is conveniently approached without exposing the body and can be easily palpated as it is placed superficially against the bone.
Examination of the pulse should include following aspects.
1. Pulse rate refers to the number of pulses per minute. It is a convenient method of determining the HR.
• Normal pulse rate varies with age being 150−180 min in fetus, 130−140 min at birth, about 90 min at the age of 10 years and about 72/min in adults.
• Increased pulse rate represents tachycardia and occurs during exercise, in anxiety, fever, hyperthyroidism, and atrial and ventricular tachycardias.
• Decreased pulse rate represents bradycardia and is seen in hypothyroidism and incomplete heart blocks.
2. Volume of pulse, also known as strength of arterial pulse or amplitude or impact, can be felt. It represents SV or the pulse pressure (i.e. systolic–diastolic pressure).
• Rapid and thready pulse occurs in hypovolaemia as in severe haemorrhage and there is marked reflex vasoconstriction.
• Increased volume pulse is seen during exercise and in ventricular hypertrophy.
3. Rhythm of pulse is noted as regular or irregular. Under normal conditions and during sinus bradycardia or sinus tachycardia pulse appears at regular intervals.
• Irregular pulse rhythm is a feature of extra systole, atrial fibrillation and other cardiac arrhythmias; type of arrhythmia is confirmed only on ECG. The irregular pulse rhythm may be regularly irregular or irregularly irregular.
4. Character of pulse is felt on palpation. It denotes the tension and waves in the pulse. Feeling of different characters of the pulse can be learnt by the subjective experience.
• Normal character of the pulse is sinuous on examination, i.e. an upstroke is followed by a downstroke. Normally, it is not possible to feel the different waves of the pulse or slight variations in the character. However, in certain heart diseases and valvular defects the normal character is altered and can be easily felt while palpating the peripheral arterial pulse.
Cardiac output and venous return
Definition of cardiac output and related terms
The main function of the heart is to pump blood to meet the metabolic needs of the body. The measure of the heart's ability to pump blood is cardiac output.
• The cardiac output refers to the amount of blood ejected by each ventricle per minute.
• The stroke volume is the amount of blood pumped out by each ventricle per beat or per contraction. Therefore, CO can be calculated by multiplying the SV by the HR:

Under normal conditions the average HR is about 70 beats/min and SV is about 80 mL, and thus CO is 80 × 70 = 5.6 L.
The CO is expressed in litres per minute and normally varies from 5–6 L/min. Thus, each ventricle pumps about 5–6 L of blood into the circulation per minute. This is made possible because of the fact that the right and the left side of pumps act in series.
Cardiac index is the CO expressed in relation to the body surface area. The normal cardiac index is about 3.2 L/min/m2.
Measurement of cardiac output
Cardiac output, in experimental animals, can be measured directly with the help of an electromagnetic flowmeter placed on the ascending aorta. However, in humans only indirect methods are possible and include:
Methods based on fick's principle
Fick's principle
The Fick's principle states that the amount of a substance taken up by an organ (or by the whole body) per unit of time is equal to the arterial level of the substance (A) minus the venous level (V) times the blood flow (F), i.e.


This principle can be, of course, only in situations in which the arterial blood is the sole source of the substance taken up.
In this method (Fig. 4.3-6) CO is determined by measuring the pulmonary blood flow. As we know:
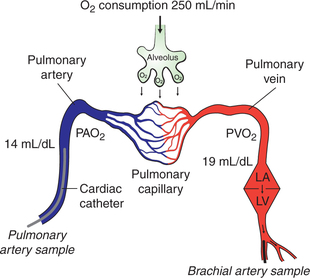
Fig. 4.3-6 Estimation of cardiac output by Fick's principle. (PAO2 = Oxygen content of pulmonary artery blood; PVO2 = oxygen content of pulmonary vein blood.)
Measurement of pulmonary blood flow can be made by measuring the amount of O2 taken by the blood from the lungs, O2 concentration of the venous blood from pulmonary artery (PAO2) and O2 concentration of the arterial blood from the pulmonary vein (PVO2).
• Amount of O2 uptake/min is determined with the help of a spirometer.
• PAO2 is measured from the venous blood sample taken from the pulmonary artery directly with the help of a cardiac catheter. The cardiac catheter is inserted into a vein at the forearm and is then guided up under fluoroscopic control through the venous channels into the right atrium, right ventricle and pulmonary artery.
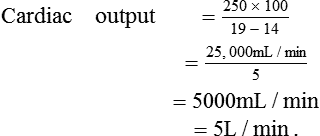
• PVO2, because of practical difficulty in taking sample from pulmonary vein, is measured from the arterial blood sample taken from any peripheral artery, e.g. brachial artery (the O2 content of all the major arteries is same as that of pulmonary veins). According to Fick's principle:


For example, if O2 uptake is 250 mL/min, PVO2 is 19 mL/ 100 mL and PAO2 is 14mL/100mL, then
Disadvantages of Fick's principle
• It is an invasive technique, so there are risks of infection and haemorrhage.
• The CO estimated may be somewhat higher than normal as the patient becomes conscious of the whole technique.
• A fatal complication like ventricular fibrillation may occur if the indwelling catheter irritates the ventricular walls, especially when the CO is being measured during heavy exercise.
Indicator or dye dilution method
Principle
In this method, a known amount of the dye is injected into a large vein or preferably into the right atrium by cardiac catheterization. By its passage through heart and pulmonary circulation it will be evenly distributed in the blood stream. Its mean concentration during the first passage through an artery can be determined from the successive samples of blood taken from the artery. The blood flow in litres/min (F) is given by the following formula:

Q = Quantity of the dye injected,
C = Mean concentration of dye and
t = Time duration in second of the first passage of dye through the artery.
Thermodilution method
Principle. It is also an indicator dilution technique in which instead of a dye ‘cold saline’ is used as an indicator. The CO is measured by determining the resultant change in the blood temperature in the pulmonary artery.
Physical methods
Physical methods developed to measure the CO include the following.
Echocardiography
Echocardiography refers to the ultrasonic evaluation of cardiac functions. It is a non-invasive technique that does not involve injections or insertion of a catheter. It involves B-scan ultrasound at a frequency of 2.25 MHz using a transducer, which also acts as a receiver of the reflected waves. The recording of the echoes displayed against time on an oscilloscope provides a record of:
• The movement of the ventricular wall and septum, and valves during the cardiac cycle.
• When combined with the Doppler techniques, echocardiography can be used to measure velocity and volume of flow through the valves.
• Thus, it is particularly useful in evaluating EDV, endsystolic volume, CO and valvular defects.
Variations in cardiac output
Physiological causes of variations in cardiac output
• Age. Because of less body surface area the children have more cardiac index than adults.
• Sex. Since the body surface area is less in females so they have more cardiac index than the males.
• Diurnal variation. In the early morning CO is low, which increases in the day time depending upon the basal condition of the individual.
• Environmental temperature. Moderate change in the environmental temperature does not cause any change in CO. A high environmental temperature is associated with an increase in the CO.
• Anxiety and excitement are reported to increase the CO by 50%–100%.
• Eating is associated with an increase in CO approximately by 30%.
• Exercise may increase the CO up to 700% depending upon the vigorousness of exercise.
• Pregnancy. An increase in CO to the tune of 45%–60% is reported during the later months of the pregnancy.
• High altitude. The CO is increased at a high altitude due to release of adrenaline as a consequence to hypoxia.
• Posture change. Sitting or standing from lying down position may decrease the CO by 20%–30% because of pooling of blood in the lower limbs.
Pathological causes of variations in cardiac output
Increase in cardiac output is seen in the following conditions:
Decrease in cardiac output may occur in the following conditions:
Regulation of cardiac output
The CO increases or decreases in various physiological and pathological conditions as described above. The variations in the CO are brought out by certain factors operating through certain mechanisms by an integrated role.
The CO, as we know, is the product of SV and HR, i.e. CO = SV × HR. Therefore, variations in the CO can be produced by the factors which change SV or HR or both. The main factors affecting CO are venous return, myocardial contractility, peripheral resistance and HR (Fig. 4.3-7).
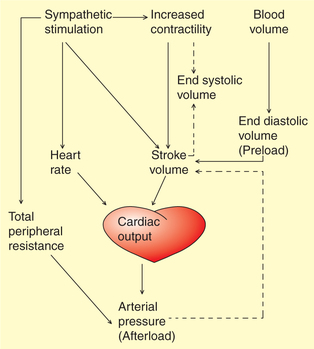
Fig. 4.3-7 Interaction between the factors that regulate cardiac output and arterial pressure. Solid lines indicate increase and dotted lines indicate a decrease.
Cardiac output control mechanisms
The CO is regulated by two mechanisms: intrinsic and extrinsic.
A Intrinsic autoregulation (Frank–Starling mechanism)
The force of contraction of cardiac muscle fibres like that of the skeletal muscle fibres depends upon its preload. The preload determines the initial length (resting length) of the muscle fibres. According to Frank–Starling law of heart, ‘within physiological limits’ the force of contraction of cardiac muscle is proportionate to the initial length of muscle fibres. In the heart, EDV forms the preload. Therefore, precisely the Frank–Starling law of heart can be stated as, within physiological limits the force of cardiac contraction is proportional to its EDV. This fact was demonstrated about a century ago by Frank and Starling on the heart– lung preparation in a dog. Since, in this intrinsic regulation mechanism, cardiac muscle fibres are stretched to increase their initial length, it is also termed as heterometric mechanism.
The relationship between the ventricular SV and EDV is called the Frank–Starling curve (Fig. 4.3-8). Details of the effect of preload on the force of myocardial contraction including the length–tension relationship are described in detail on page 135.
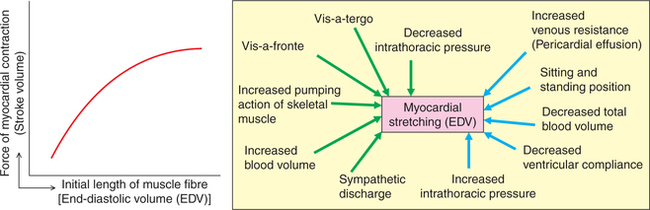
Fig. 4.3-8 Frank–Starling curve and factors affecting end-diastolic volume. Green arrows indicate increase and blue arrows indicate decrease.
Factors affecting end-diastolic volume
The EDV refers to the venous return to the heart during diastole.
Up to physiological limits, the CO is directly proportional to the venous return. Thus, over any significant period of time, venous return must be equal to CO. For individual at rest, the CO and venous return are approximately 5 L/min. Factors affecting venous return are given below (Fig. 4.3-8).
1. Respiratory pump. Normally the intrapleural (intrathoracic) pressure at the end of expiration is about −2 mm Hg. During inspiration, the intrathoracic pressure becomes more negative (about −5 mm Hg) due to which the diameter of inferior vena cava is increased and pressure inside it is reduced; and there occurs descent of diaphragm which increases the intra-abdominal pressure. The decreased pressure inside the inferior vena cava coupled with increased intra-abdominal pressure during inspiration results in the increased flow of blood into the right atrium. This mechanism of increased blood flow during inspiration is called respiratory pump. This respiratory pump operates strongly in the forced respiration and in severe muscular exercise increasing the venous return.
2. Cardiac pump. The cardiac pump influences the venous return by two kinds of forces the ‘vis-a-tergo’ and ‘vis-afronte’.
• Vis-a-tergo refers to the forward push from behind, i.e. the propelling force which pushes the blood from veins into the right atrium. Vis-a-tergo results from the myocardial contraction during systole and is supplemented by the elastic recoil of the arterial wall (windkessel effect).
• Vis-a-fronte refers to the suction force acting from the front which basically pulls the blood from the great veins into the right atrium. This suction force is created by a ventricular contraction and has the following two components:
– Ventricular systolic suction results from pulling down of the fibrous AV ring causing enlargement of the atrial lumen and thus decreasing the intra-atrial pressure which sucks blood from the inferior vena cava and the superior vena cava.
– Ventricular diastolic suction results from the opening of AV valves allowing rapid flow of blood from the atria to ventricles. The sudden decrease in the atrial pressure in turn sucks blood from the great veins.
3. Muscle pump. The muscle pump mechanism is responsible for flow of blood from the veins of the limbs to the heart.
Working of muscle pump. Two types of veins are present in the limbs: superficial and deep veins.
Blood flows from the superficial veins into the deep veins through communicating veins. Due to the presence of valves in the limb veins, the blood flows in one direction, i.e. from periphery towards heart and not in the reverse direction.
• When the skeletal muscles contract, the deep veins present in between the muscles are compressed and due to increased pressure the valve present proximal to the contracting muscle is opened up while the valve present on distal end is tightly closed, and in this way the blood is propelled up towards the heart (Fig. 4.3-9A).
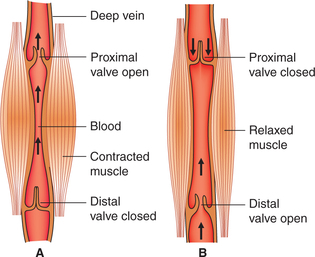
Fig. 4.3-9 Mechanism of muscle pump: A, during contraction of muscles and B, during relaxation of muscles.
• When the skeletal muscle relaxes, a negative pressure is created in the segment of veins. So due to back flow the proximal valve is closed, distal valve is opened and blood is sucked up (Fig. 4.3-9B).
• With rhythmic contractions of skeletal muscles in this way the blood is squeezed out of the limbs towards the heart.
4. Blood volume. The increased blood volume increases the venous return and a decreased blood volume decreases the venous return.
5. Sympathetic discharge. On sympathetic stimulation there occurs increase in the venous tone, which decreases the capacity of the venous system (veins are capacitance vessels).
6. Standing body position. It is associated with a decreased venous return due to peripheral pooling of the blood.
7. Resistance to venous return. Decrease in the resistance to venous return increases the venous return, while an increase in the resistance to venous flow decreases the venous return.
Clinical significance of Frank–Starling mechanism
Maintenance of constant stroke volume when the peripheral resistance is increased is carried out by intrinsic mechanism. When the peripheral resistance (blood pressure) is increased, initially the heart is unable to pump all the blood that it normally does. The accumulated blood in the ventricle stretches the muscle fibres leading to great force of contraction, and thus the SV is restored to normal in spite of greater resistance to the outflow.
Intrinsic control mechanism serves as a life-saving device in a cardiac failure. Left ventricular failure causes accumulation of blood within the left ventricle, thereby decreases blood supply to the vital organs. Soon accumulation of blood in the left ventricle increases the initial length of muscle fibres leading to greater CO according to Frank–Starling mechanism. However, when accumulation of blood is too great, the Frank–Starling law will fail to operate leading to decrease in the blood supply to the vital organs and ultimately death may occur.
B Extrinsic regulation (autonomic neural mechanism)
In this mechanism SV increases due to increased myocardial contractility without any increase in the initial muscle length. Therefore, it is also called homometric mechanism. The homometric regulation is governed by the autonomic neural mechanism as follows.
Stimulation of the sympathetic nerves to the heart results in increased myocardial contractility and is known as positive inotropic effect.
Positive inotropic effect can be defined as an increase in the maximal velocity of shortening (V’max). During any muscle contraction, the velocity of shortening and the force developed are inversely related. For details of the effect of afterload and the force–velocity curve see page 136.
Inhibition of sympathetic system has opposite effects. Under normal conditions there is continuous slow rate of discharge through sympathetic fibres to the heart. Therefore, when sympathetic activity is inhibited the ventricular force of contraction decreases.
In intact animals, stimulation of sympathetic nerves produces a marked increase in the HR and a moderate increase in the SV, leading to a manifold increase in the CO.
Characteristics of increased myocardial contractility
Characteristics of homometric regulation. The increased myocardial contractility achieved by homometric regulation differs from the increase in force of contraction of myocardium achieved by heterometric regulation. Its characteristic features are the following.
• The ventricles contract more forcefully and more rapidly, i.e. velocity of shortening of muscle is increased. As a result the ventricles are able to do more work per stroke, i.e. ejection fraction increases at the same EDV (without increase in venous return).
• Due to more complete emptying of ventricles during each systole the end-systolic volume is decreased.
• Due to increased stroke output arterial pressure is increased.
Mechanism of effects of sympathetic stimulation. Sympathetic stimulation increases the myocardial contractility by causing activation of β1 adrenergic receptors, which in turn increases the concentration of Ca2+ within the myocardial cells causing a more rapid and forceful contraction.
Role of heart rate in control of cardiac output
The CO and HR both are increased during exercise proportionate to its severity. Since, CO is the product of SV and HR, therefore it is tempting to attribute the increase in CO to increase in the HR. However, in fact it is not so. It has been seen that when HR alone is increased, e.g. by change in the frequency of discharge of an artificial cardiac pacemaker, the CO does not increase at all. As shown in Fig. 4.3-10, the progressive increase in the HR is associated with a proportionate decrease in the SV because of reduced diastole time and thus reduced EDV. Conversely, when the HR is reduced the ventricular diastole is prolonged leading to more ventricular filling and thus an increased SV.
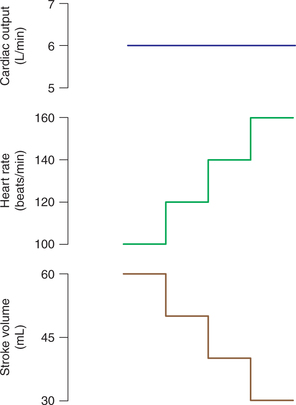
Fig. 4.3-10 Effect of increase in heart rate through an artificial pacemaker on stroke volume and cardiac output.
During exercise, the sympathetic stimulation produces a marked increase in the HR due to positive chronotropism and moderate increase in the SV due to positive inotropism leading to manifold increase in the CO.
Integrated control of cardiac output
In intact animals and humans, the intrinsic and extrinsic mechanisms described above operate simultaneously in an integrated way to maintain CO. Therefore, in a given situation, depending upon the status of EDV and status of myocardial contractility, the individual will have one of the curves from the ‘family of Frank–Starling curves’.
Interaction of Frank–Starling mechanism and myocardial contractility
Factors causing increased myocardial contractility shift the Frank–Starling curve to the left (Fig. 4.3-11). Increased contractility (positive inotropism) refers to the greater contraction force at a given preload or EDV. Factors increasing myocardial contractility are:
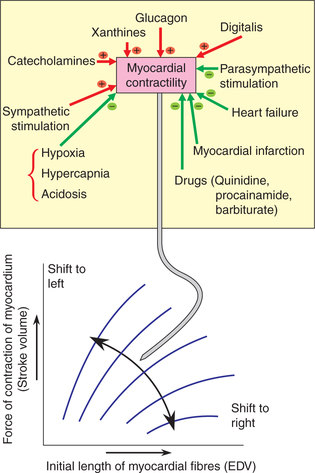
Fig. 4.3-11 Effect of changes in myocardial contractility on the Frank–Starling curve. The factors which increase the contractility shift the curve to left and those that decrease the contractility shift the curve to right.
Factors causing decreased myocardial contractility shift the Frank–Starling curve to the right (Fig. 4.3-11). The decreased contractility (negative inotropism) represents a decrease in the force of contraction at any fibre length or ventricular volume. Its causes are:
Heart–lung preparation
The Frank–Starling's heart–lung preparation is an experimental set up in a dog, devised to demonstrate the effects of various factors on the activities of heart. In this preparation, as the name suggests, blood does not flow to any part of the body except the heart and the lungs. The animal is actually dead and heart is functionally denervated.