A summary of the cardiovascular examination and extending the cardiovascular examination
TEXT BOX 8.1 The cardiovascular examination: a suggested method
Marfan’s, Turner’s, Down syndrome
Rheumatological disorders, e.g. ankylosing spondylitis (aortic regurgitation)
Eyes
Pupils—Argyll Robertson (aortic regurgitation)
Heart sounds
Sitting forwards (forced expiratory apnoea)
NB: Palpate for thrills again after positioning Dynamic auscultation
9. Abdomen (lying flat—1 pillow only)
Palpate liver (pulsatile etc.), spleen, aorta
Urine analysis (infective endocarditis)
Temperature chart (endocarditis)
Position the patient at 45° and make sure his or her chest and neck are fully exposed. Cover the breasts of a female patient with a towel or loose garment.
Inspect while standing back for the appearance of Marfan’s, Turner’s or Down syndromes. Also look for dyspnoea, cyanosis, jaundice and cachexia.
Pick up the patient’s hand. Feel the radial pulse. At the same time inspect the hands for clubbing. Also look for the peripheral stigmata of infective endocarditis: splinter haemorrhages are common (and are also caused by trauma), while Osler’s nodes and Janeway lesions are rare. Look quickly, but carefully, at each nail bed, otherwise it is easy to miss these signs. Note any tendon xanthoma (type II hyperlipidaemia).
The pulse at the wrist should be timed for rate and rhythm. Feel for radiofemoral delay (which occurs in coarctation of the aorta) and radial–radial inequality. Pulse character is best assessed at the carotids.
Take the blood pressure (lying and standing or sitting—postural hypotension).
Next inspect the face. Look at the eyes briefly for jaundice (e.g. valve haemolysis) or xanthelasmata (type II or type III hyperlipidaemia*). You may also notice the classical mitral facies. Then inspect the mouth using a torch for a high arched palate (Marfan’s syndrome), petechiae and the state of dentition (endocarditis). Look at the tongue or lips for central cyanosis.
The neck is very important. The jugular venous pressure (JVP) must be assessed for height and character. Use the right internal jugular vein for this assessment. Look for a change with inspiration (Kussmaul’s sign). Now feel each carotid pulse separately. Assess the pulse character.
Proceed to the praecordium. Always begin by inspecting for scars, deformity, the site of the apex beat and visible pulsations. Do not forget about pacemaker boxes. Mitral valvotomy scars (usually under the left breast) can be quite lateral and very easily missed.
Palpate for the position of the apex beat. Count down the correct number of interspaces. The normal position is the fifth left intercostal space, 1 cm medial to the midclavicular line. The character of the apex beat is important. There are a number of types. A pressure-loaded (hyperdynamic, systolic overloaded) apex beat is a forceful and sustained impulse that is not displaced (e.g. aortic stenosis, hypertension). A volume-loaded (hyperkinetic, diastolic overloaded) apex beat is a forceful but unsustained impulse that is displaced down and laterally (e.g. aortic regurgitation, mitral regurgitation). A dyskinetic apex beat (cardiac failure) is palpable over a larger area than normal and moves in an uncoordinated way under the examiner’s hand. Do not miss the tapping apex beat of mitral stenosis (a palpable first heart sound). The double or triple apical impulse of hypertrophic cardiomyopathy is very important too. Feel also for an apical thrill, and time it.
Then palpate with the heel of your hand for a left parasternal impulse (which indicates right ventricular enlargement or left atrial enlargement) and for thrills. Now feel at the base of the heart for a palpable pulmonary component of the second heart sound (P2) and aortic thrills. Percussion may be helpful if there is uncertainty about cardiac enlargement.
Auscultation begins in the mitral area with both the bell and the diaphragm. Listen for each component of the cardiac cycle separately. Identify the first and second heart sounds, and decide whether they are of normal intensity and whether the second heart sound is normally split. Now listen for extra heart sounds and murmurs. Do not be satisfied at having identified one abnormality.
Repeat the approach at the left sternal edge and then the base of the heart (aortic and pulmonary areas). Time each part of the cycle with the carotid pulse. Listen over the carotids.
It is now time to reposition the patient. First put him or her in the left lateral position. Again feel the apex beat for character (particularly tapping) and auscultate. Sit the patient up and palpate for thrills (with the patient in full expiration) at the left sternal edge and base. Then listen in those areas, particularly for aortic regurgitation or a pericardial rub.
Dynamic auscultation should be done if there is any doubt about a systolic murmur. The Valsalva manoeuvre should be performed whenever there is a pure systolic murmur. Hypertrophic cardiomyopathy is easily missed otherwise.
The patient is now sitting up. Percuss the back quickly to exclude a pleural effusion (e.g. due to left ventricular failure) and auscultate for inspiratory crackles (left ventricular failure). If there is a radiofemoral delay, listen for a coarctation murmur over the back. Feel for sacral oedema and note any back deformity (e.g. ankylosing spondylitis with aortic regurgitation).
Next have the patient lie flat and examine the abdomen properly for hepatomegaly (right ventricular failure) and a pulsatile liver (tricuspid regurgitation). Test for the abdomino-jugular reflux sign if relevant. Feel for splenomegaly (endocarditis) and an aortic aneurysm.
Move on to the legs. Palpate both femoral arteries and auscultate here for bruits. Go on and examine all the peripheral pulses. Look for signs of peripheral vascular disease, peripheral oedema, clubbing of the toes, Achilles tendon xanthomata and stigmata of infective endocarditis.
Finally, examine the fundi (for hypertensive changes, and Roth’s spots in endocarditis) and the urine (haematuria in endocarditis). Take the temperature.
*In type III, which is rare, chylomicrons and intermediate density lipoproteins (IDL) are elevated.
Extending the cardiovascular physical examination
Just as analysis of the chest X-ray has long been considered an extension of the patient’s physical examination, electrocardiography (see online resources) and echocardiography are now essential and basic parts of cardiac assessment. It is not possible to order even basic tests without knowing how a test might be helpful and what it is able to detect.
THE CHEST X-RAY: A SYSTEMATIC APPROACH
Interpretation of the chest X-ray is not easy. It requires knowledge of anatomy and pathology, appreciation of the whole range of normal appearances (see Figure 8.2) and knowledge of the likely X-ray changes occurring with pathological processes. The clinician should feel personally responsible for viewing a patient’s radiographs.
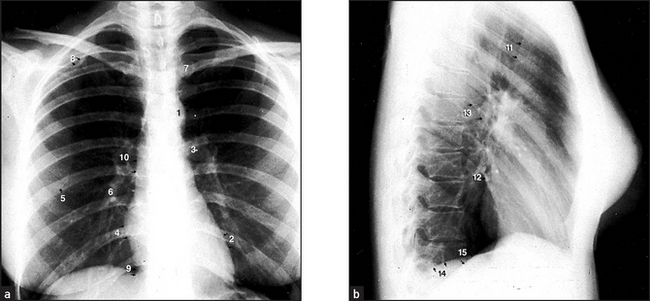
Figure 8.2 Normal chest X-ray (a) The posteroanterior view shows: (1) aortic knuckle; (2) left heart border formed by the lateral border of the left ventricle; (3) left hilum, formed mostly by the left main pulmonary artery and partly by the left upper pulmonary veins; (4) right heart border formed by the right atrium; (5) inferior angle of the scapula; (6) right basal pulmonary artery; (7) medial aspect of the left clavicle; (8) spine of the scapula; (9) right cardiophrenic angle; and (10) superimposition of the right lateral margins of the superior vena cava and the ascending aorta. (b) The lateral view shows: (11) anterior border of the trachea; (12) pulmonary vein, entering the left atrium; (13) oblique fissure; (14) left hemidiaphragm; and (15) right hemidiaphragm.
Most medical students faced with giving their interpretation of a chest X-ray either opt for a ‘spot diagnosis’ (usually wrong) or raise their eyes to heaven, hoping for divine inspiration. However, a systematic approach is generally more useful! More is missed by not looking than by not knowing.
Frontal film
Name, date and projection
First, it is important to check the name and date, to be sure that it is the correct patient’s film. The film markings also indicate the projection and patient position. The standard frontal film is taken by a posteroanterior (PA; back to front) projection of an erect patient. Anteroposterior (AP) and supine films are only second-best. On a supine film there is distension of all the posterior (gravity-dependent) vessels and thus the lung fields appear more plethoric. A small pleural effusion may not be visible if it is lying posteriorly, and the heart often appears large on a supine film.
Centring
The medial ends of the clavicles should be equidistant from the midline spinous processes. If the patient is rotated, this will accentuate the hilum that is turned forwards.
Exposure
The quality of the film is important. There should be enough X-ray penetration for the spine to be just seen through the mediastinum, otherwise the film will be too white. With good radiographic technique, the scapulae are projected outside the lung fields.
The film needs to be exposed on full inspiration so that there is no basal crowding of the pulmonary vessels and so that estimation of the cardiothoracic ratio is accurate. On full inspiration, the diaphragm lies at the level of the tenth or eleventh rib posteriorly or at the level of the sixth costal cartilage anteriorly. The right hemidiaphragm usually lies about 2 cm higher than the left.
Correct orientation
Do not miss dextrocardia—the heart apex will be to the right and the stomach gas to the left. Do not be misled by left or right markers wrongly placed by a radiographer.
Systematic film interpretation
Mediastinum
The trachea should lie in the midline. It may be deviated by a goitre or mediastinal mass. It is normally deviated a little to the left as it passes the aortic knuckle. (The aortic arch becomes wider and unfolded with age because of loss of elasticity.)
The mediastinum, including the trachea, can be deviated by a large pleural effusion, a tension pneumothorax or pulmonary collapse.
Rotation of the patient may make the mediastinum appear distorted.
Hila
The hila are mostly formed by the pulmonary arteries with the upper lobe veins superimposed. The left hilum is higher than the right. The left has a squarish shape whereas the right has a V shape.
A hilum can be more prominent if the patient is rotated. Lymphadenopathy or a large pulmonary artery will cause hilar enlargement.
Heart
The heart shape is ovoid with the apex pointing to the left. Characteristically, about two-thirds of the heart projects to the left of the spine.
The right heart border is formed by the outer border of the right atrium, and the left heart border by the left ventricle. The left margin of the right ventricle lies about a thumb’s breadth in from the left heart border. (On the surface of the heart, this is marked by the left anterior descending coronary artery.)
The cardiothoracic diameter is a rather approximate way of determining whether the heart is enlarged. If the heart size is more than 50% of the transthoracic diameter, enlargement may be present. Apparent slight cardiac enlargement can occur because of a relatively small AP diameter of the chest. A cardiothoracic ratio at the upper limit of normal should not cause alarm if the patient has no reason to have cardiac failure and no symptoms of it.
Valve calcification, if present, is better seen on the lateral view. On the frontal view, valve calcification cannot be visualised over the spine.
Diaphragm
The hemidiaphragms visualised on the frontal films are the top of the domes seen tangentially. Much lung in the posterior costophrenic angles is not seen on the frontal film.
If the hemidiaphragms are low and flat, emphysema may be present. A critical look must be made beneath the diaphragm to see if there is free peritoneal gas.
Lung fields
On the frontal field, it is convenient to divide the lung fields into zones. It is easy then to compare one zone with another for density differences and the distribution of the vascular ‘markings’.
The apices lie above the level of the clavicles. The upper zones include the apices and pass down to the level of the second costal cartilages. The mid-zones lie between the second and fourth costal cartilage levels. The lower zones lie between the fourth and sixth costal cartilages.
The radiolucency of the lung fields is due to the air filling the lung. The ‘greyness’ is due to blood in the pulmonary vessels.
The upper zones of the lungs are normally less well perfused, resulting in smaller blood vessels. With raised left atrial pressure, there is upper zone blood diversion and the vessels are congested.
An increase in lung radiolucency occurs with pulmonary vessel loss, as also happens with emphysema. Lung radiolucency is lost with an effusion or consolidation.
Terms such as ‘opacity’, ‘consolidation’ and ‘patchy shadowing’ are used to describe the lung fields. It is usually unwise to attempt to make too precise a diagnosis of the underlying pathology.
The lungs are divided into lobes by reflections of the visceral pleura. The right lung is composed of the upper, middle and lower lobes. On the left, there are only the upper and lower lobes.
The right upper lobe has three segments: anterior, posterior and apical. The right middle lobe has a lateral and medial segment. Apical, medial basal, lateral basal, anterior basal and posterior basal segments compose the lower lobe.
There are three differences in the segmental anatomy of the left lung (see Figure 12.3, page 165). The left upper lobe has four segments: an apicoposterior, an anterior and two lingular segments. The superior and inferior lingular segments are the equivalent of the right middle lobe. The left lower lobe has four segments: it does not contain a medial basal segment.
The fissures are seen as hairline shadows. The horizontal fissure is at the level of the right fourth costal cartilage. The oblique fissures are not seen on the frontal view.
Bones and soft tissue
Nipple shadows are often seen over the lower zones and are about 5 mm in diameter. They can be confused with a ‘coin’ lesion. In such a case, nipple markers may be helpful.
Look carefully for a missing breast shadow in a female patient. A mastectomy may provide a diagnostic clue to explain bony or pulmonary metastases, or upper zone post-radiation fibrosis.
Soft-tissue gas may accompany a pneumothorax or be present after a thoracotomy.
Calcified tuberculous glands in the neck should be looked for in patients with lung scarring or calcified hilar lymph nodes.
Check that there are no rib fractures or space-occupying lesions. Look for rib notching, due to increased blood flow through intercostal vessels (e.g. coarctation of the aorta). Cervical ribs or thoracic scoliosis should be noted. Erosions or arthritis around the shoulder joints should be looked for.
Review
Certain parts of the film should be double-checked if the radiograph appears normal.
The retrocardiac region should be looked at again. A collapsed left lower lobe will reveal itself as a triangular opacity behind the heart shadow.
Both apices should be rechecked for lesions, especially Pancoast’s tumours or tuberculosis.
Has the patient a pneumothorax? There will be a difference between the translucency of the two lungs.
Lateral film
The lateral view is used largely for localisation of an already visible lesion on the frontal film. Examine it just as carefully. Sometimes a lesion is seen only on the lateral view. If there is clinical evidence of heart or lung disease, frontal and lateral views should always be obtained.
Points to remember: (1) the retrosternal and retrocardiac triangles are normally of a similar radiodensity; (2) the thoracic vertebrae become less opaque lower down the spine, unless there is pulmonary or pleural disease; and (3) the posterior costophrenic angle is sharp unless there is fluid or adjacent consolidation.
The hemidiaphragms are well defined unless there is pleural or pulmonary disease.
The oblique fissure placement is ‘4 to 4’. It passes from approximately 4 cm behind the anterior costophrenic angle through the hilum to the T4 vertebral body level.
Heart
The right ventricle forms the anterior heart border on the lateral film. The left atrium forms the upper posterior border.
Mitral valve calcification is seen below an imaginary line drawn from the anterior costophrenic angle to the hilum, whereas aortic valve calcification lies above this line.
Examples of chest X-rays in cardiac disease
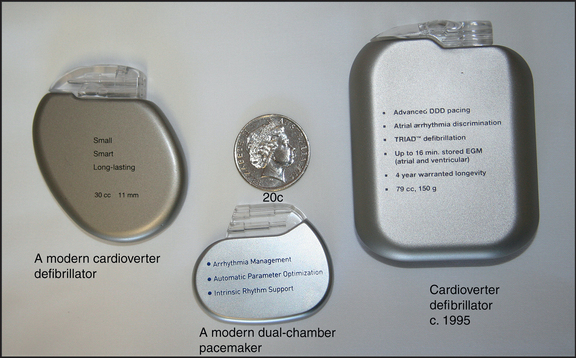
The radiological changes seen in pulmonary venous congestion, interstitial pulmonary oedema and alveolar pulmonary oedema are shown in Figures 8.3 to 8.5, respectively. Mitral valve disease is shown in Figure 8.6, while a ventricular aneurysm is seen in Figure 8.7. The characteristic notching of the inferior aspects of the ribs, due to hypertrophy of the intercostal arteries, appears in Figure 8.8, while the pulmonary plethora that is characteristic of a left-to-right shunt is obvious in Figure 8.9. Marfan’s syndrome is illustrated in Figure 8.10; and a pacemaker and defibrillators are shown in Figure 8.11.
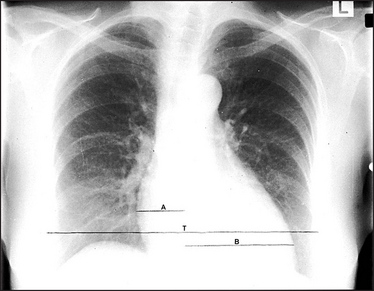
Figure 8.3 Pulmonary venous congestion The heart is enlarged due to failure. This failure is not severe enough to cause pulmonary oedema. However, the increased pulmonary venous pressure has caused upper zone blood diversion so that the vessels above the hilum appear wider than those below. (The mechanism of the blood diversion is not fully understood.) These changes are seen when the pulmonary venous pressure is about 15 to 20 mmHg. The cardiothoracic ratio A + B is a useful indicator of cardiac enlargement if it is greater than 50%. The thoracic measurement (T) is the widest diameter above the costophrenic angles, usually at the level of the right hemidiaphragm. The cardiac diameter is the addition of the two widths A and B.
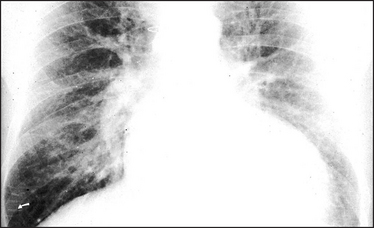
Figure 8.4 Interstitial pulmonary oedema The heart is moderately enlarged. The interstitial oedema causes fine, diffuse shadowing in the lung fields with blurring of the vessel margins. The escape of fluid into the interstitial tissue occurs when the capillary pressure exceeds the plasma osmotic pressure of 25 mmHg. The interstitial oedema is characterised by Kerley ‘B’ lines, which are oedematous interlobular septa. They are best seen peripherally in the right costophrenic angle (arrow), where they lie horizontally, and are about 1 cm long. They contain the engorged lymphatics, which were originally thought by Kerley to be the sole cause of the ‘B’ lines. Sternal sutures are present from previous cardiac surgery.
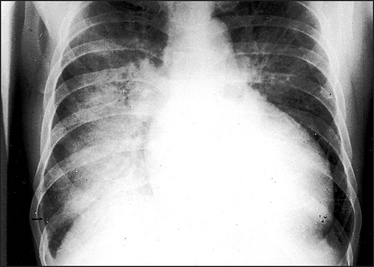
Figure 8.5 Alveolar pulmonary oedema When the pulmonary venous pressure reaches 30 mmHg, oedema fluid will pass into the alveoli. This causes shadowing (patchy to confluent depending on the extent) in the lung fields. This usually occurs first around the hila and gives a bat’s wing appearance. These changes are usually superimposed on the interstitial oedema. A lamellar pleural effusion (arrow) is seen at the right costophrenic angle where Kerley ‘B’ lines are also evident.
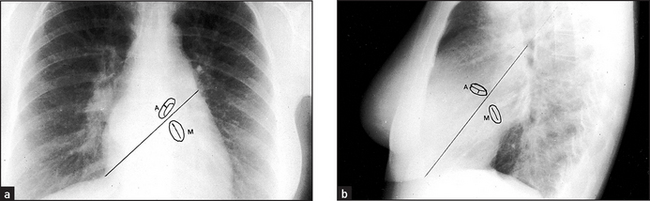
Figure 8.6 Mitral valve disease The left atrium enlarges because of the pressure and volume load. It bulges posteriorly and to both sides (arrows). The atrial appendage bulges out below the left hilum. The prominent right border of the atrium causes the ‘double right heart border’ appearance. To distinguish the valves if calcification is present, draw imaginary lines. On the PA view (a) the line passes from the right cardiophrenic angle to the inferior aspect of the left hilum. The line on the lateral view (b) passes from the antero-inferior angle through the midpoint of the hilum. The aortic valve lies above this line whereas the mitral valve lies below it.
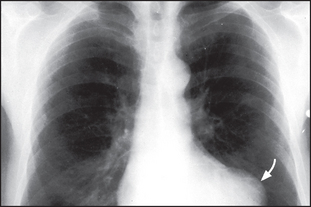
Figure 8.7 Ventricular aneurysm There is a bulge of the left cardiac border (arrow), which indicates an aneurysm of the left ventricular wall. The most common cause is weakness following myocardial infarction.
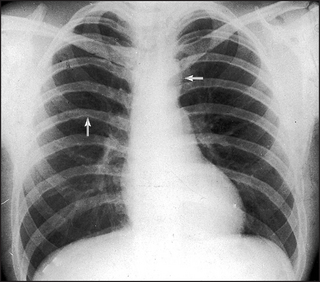
Figure 8.8 Aortic coarctation The classical sign in aortic coarctation is notching of the inferior aspects of the ribs (arrow on left). This is due to hypertrophy of the intercostal arteries in which retrograde flow from the axillary collaterals is taking blood back to the descending aorta. Because of the increased resistance to the left heart flow, left ventricular hypertrophy and then failure can occur. Failure causing cardiac enlargement has not yet occurred in this patient. The arrow on the right indicates a smaller than normal aortic knuckle.
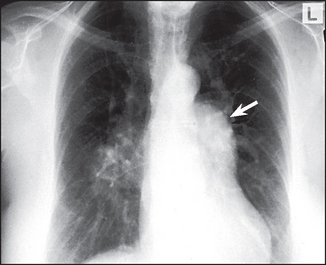
Figure 8.9 Atrial septal defect (ASD) The most important thing to recognise is that there is pulmonary plethora indicating a left-to-right shunt. Left-to-right shunts occur in ASD, ventricular septal defect (VSD) and patent ductus arteriosus (PDA). The shunted flow causes enlargement of the main pulmonary artery and its branches. The right hilum is enlarged because of the very dilated right pulmonary artery. The left hilum is hidden by the very dilated main pulmonary artery (arrow). The ascending aorta is small (in contrast to its enlargement in PDA). The left atrium and ventricle are not enlarged, as they are in VSD and PDA.

THE ECHOCARDIOGRAM
Echocardiography is now an essential and basic part of cardiac assessment and can be performed at the bedside. It does not expose the patient to radiation. Small hand-held models are available that can be used almost as readily as a stethoscope. Although these devices will result in the temptation not to bother listening to the heart, any test used without an adequate history and examination is likely to be misleading.
Most echocardiographic studies involve four modalities:
• In M mode, detailed information is provided from a single line of ultrasound. It is used to study motion in detail and to make measurements of chamber sizes (see Figures 8.12, 8.13 and 8.14).
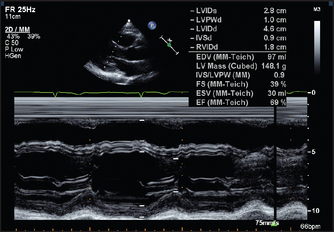
Figure 8.12 Normal long-axis M mode measurements Both the fractional shortening (change in the dimensions between systole and diastole; normally >27%) and the ejection fraction have been calculated. (From Baker T, Nikoli G, O’Connor S, Practical cardiology, 2nd edn. © 2008, Sydney: Elsevier Australia.)
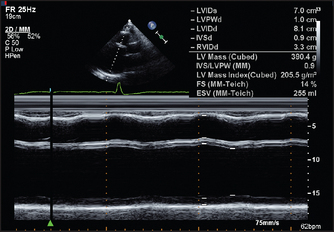
Figure 8.13 M mode echo from a 34-year-old man with two months of increasing dyspnoea, diagnosed initially as asthma. The left ventricle is very dilated. The end-diastolic dimension is 70 mm (<57). The fractional shortening is only 14% (>25–27). Contraction of the septum and posterior wall are equally reduced, typical of dilated cardiomyopathy (page 110). (From Baker T, Nikoli G, O’Connor S, Practical cardiology, 2nd edn. © 2008, Sydney: Elsevier Australia.)
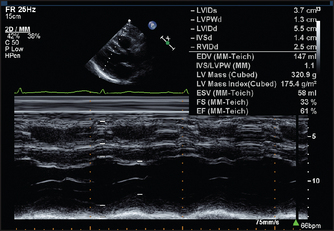
Figure 8.14 M-mode measurements in a patient with hypertension. There is symmetrical thickening of the left ventricular wall. (From Baker T, Nikoli G, O’Connor S, Practical cardiology, 2nd edn. © 2008, Sydney: Elsevier Australia.)
• In two-dimensional or sector scanning, ultrasound information is assembled into a moving picture that shows the relationship between different areas of the heart in a series of two-dimensional slices (see Figures 8.15 and 8.16 below). This gives information about valve appearance, cardiac function and the presence of congenital abnormalities.
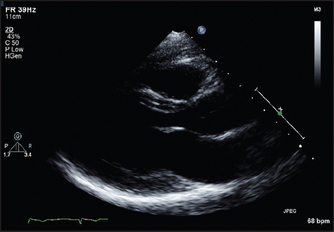
Figure 8.15 Normal long-axis view of the heart The mitral valve leaflets can be seen wide open in this diastolic frame. The apex of the heart is on the left and the right ventricle is at the top of the picture. (From Baker T, Nikoli G, O’Connor S, Practical cardiology, 2nd edn. © 2008, Sydney: Elsevier Australia.)
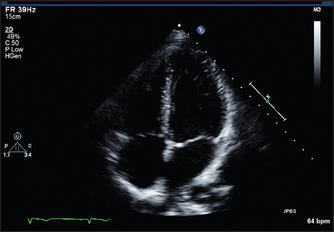
Figure 8.16 Normal four-chamber view of the heart. The left atrium and ventricle are on the right side of the picture. The AV (mitral and tricuspid) valves are closed in this systolic frame. (From Baker T, Nikoli G, O’Connor S, Practical cardiology, 2nd edn. © 2008, Sydney: Elsevier Australia.)
• In continuous and pulsed wave Doppler, interrogation of the returning ultrasound signal enables calculation of the Doppler shift caused by reflection of the beam from moving columns of blood. This means that the velocity and direction of blood flow from different parts of the heart can be measured. The Doppler signal can be displayed as a velocity wave. By superimposing the Doppler callipers on the two-dimensional image, the echocardiographer is able to measure the velocity of jets of blood from a particular area (e.g. in the ascending aorta just beyond the aortic valve cusps; see Figure 8.17).
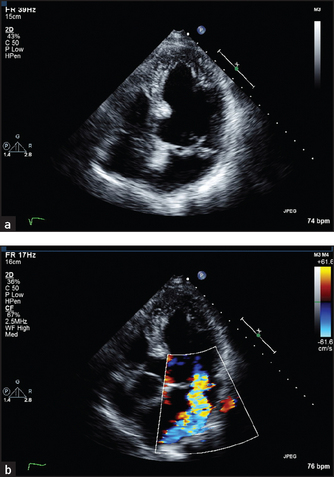
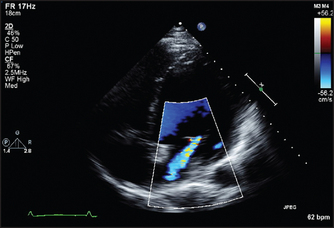
Figure 8.17 (a) Four-chamber view of a patient with prolapse of both mitral valve leaflets. This systolic frame shows the closed mitral leaflets (anterior on the left) bowing back into the left atrium as they face the full force of left ventricular systole. (b) Four-chamber view of a 50-year-old woman with a middle and late systolic murmur. A brightly coloured (high-velocity) jet is seen in this systolic frame, extending from the centre of the mitral valve well back into the left atrium. (From Baker T, Nikoli G, O’Connor S, Practical cardiology, 2nd edn. © 2008, Sydney: Elsevier Australia.)
• In colour flow mapping, it is possible for echo machines to solve the Doppler equations for sectors of the two-dimensional scan in real time, assign a colour code depending on the direction and velocity of flow and superimpose this on the two-dimensional image. In this way, flow within the heart is visible in relation to the anatomy and abnormal jets of blood can be more easily detected (see Figure 8.18).
Information commonly available from an echocardiogram
1. Structural and functional measurements. Assessment of left ventricular function by echo involves measurement of the left ventricular end-diastolic dimension (normally less than about 57 mm) and the end-systolic dimension. Figure 8.12 shows echo views of the heart in the long axis. It shows some of the measurements and structures that can be assessed in this standard view.
The echo also allows the left ventricle to be examined for areas of segmental hypokinesis (reduced wall motion) the presence of which suggests previous infarction as the cause of the cardiac failure. Figure 8.16 shows the structures seen in the four-chamber view of the heart. Here the echo transducer scans the heart from the position of the apex beat.
Sector scanning and M mode pictures can provide information about valve morphology, for example thickening or prolapse of the leaflets (see Figure 8.17). Doppler echo can reveal abnormal jets of blood, for example regurgitant jets, and measure flow velocity across valves. This measurement can be used to estimate the valve gradient (the difference in pressure across the valve).
3. Mitral regurgitation and mitral valve prolapse. Here the mitral valve may appear abnormal and abnormal coaptation of the leaflets may be visible (see Figure 8.17).
4. Aortic stenosis. Thickening and calcification (bright echoes) of the aortic valve are usually visible (see Figure 8.19). The movement of the valve cusps may appear reduced. The anatomy of the valve may be apparent. Doppler interrogation of the jet of blood in the ascending aorta will enable its velocity to be measured. A simple formula enables estimation of the pressure gradient to be made from this measurement.
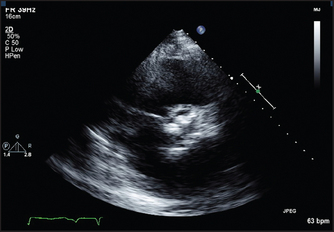
Figure 8.19 Short-axis view of the aortic valve in a patient with severe aortic stenosis. The valve cusps are heavily calcified. (From Baker T, Nikoli G, O’Connor S, Practical cardiology, 2nd edn. Sydney: Churchill Livingstone, 2008, with permission.) Churchill Livingstone
5. Aortic regurgitation. The valve may look thickened or occasionally a cusp may be seen to prolapse (see Figure 8.20). The aortic root size may be increased, especially if this is the cause of the aortic regurgitation. Left ventricular dilation is often present and the size of the ventricle may be used as an indication of severity. Doppler interrogation will show the regurgitant jet for a variable distance into the left ventricle.
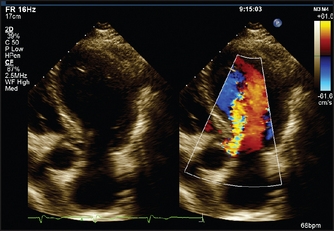
Figure 8.20 Aortic regurgitation (From Baker T, Nikoli G, O’Connor S, Practical cardiology, 2nd edn. Sydney: Churchill Livingstone, 2008, with permission.) Churchill Livingstone
6. Tricuspid regurgitation. This is more often secondary to abnormalities of right ventricular function or to raised RV pressure than to primary tricuspid valve disease. The valve will appear normal. Doppler interrogation will show a jet of blood in the right atrium.
7. Hypertrophic cardiomyopathy. Certain anatomical abnormalities are characteristic of this condition (see Figure 8.21). There is asymmetrical septal hypertrophy (ASH). The normal interventricular septum measures up to 11 mm in thickness. This may be considerably increased to 40 mm or even more. Doppler interrogation may reveal a gradient in the left ventricular outflow tract or mitral regurgitation, or both.
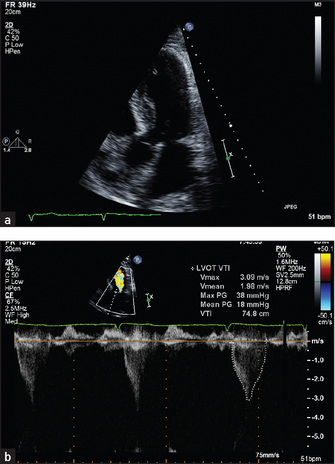
Figure 8.21 (a) and (b) Hypertrophic cardiomyopathy (From Baker T, Nikoli G, O’Connor S, Practical cardiology, 2nd edn. Sydney: Churchill Livingstone, 2008, with permission.) Churchill Livingstone
8. Ventricular septal defect. The defect may be visible in the muscular or membranous septum. The diameter of the opening can be measured. Indirect measurements of the effect of the defect include signs of RV dilation caused by left to right shunting.
Doppler interrogation, especially with colour mapping, will usually show left-to-right shunting across the septum, even if the defect itself is not visible. Measurement of the velocity of this jet gives an indication of right ventricular pressures. If the gradient across the defect is large, RV pressure must be much lower than LV pressure, as is normal. A large ventricular septal defect may cause pulmonary hypertension and elevation of RV pressures.
9. Atrial septal defect. The atrial septum can often be seen well enough to reveal a defect, although this is sometimes difficult. There may be indirect indications of left-to-right shunting at the atrial level, including enlargement of the right ventricle and abnormal motion of the interventricular septum.
Doppler interrogation may show shunting across the defect. If there is doubt, a transoesophageal echo may be needed for accurate definition of the anatomy of the atrial septum.
10. Patent ductus arteriosus. The main pulmonary artery will appear large. The ductus itself may be visible. Doppler interrogation reveals continuous flow in the main pulmonary artery at the point where the duct empties.