X-ray Production
At the completion of this chapter, the student should be able to do the following:
1 Discuss the interactions between projectile electrons and the x-ray tube target.
2 Identify characteristic and bremsstrahlung x-rays.
3 Describe the x-ray emission spectrum.
4 Explain how mAs, kVp, added filtration, target material, and voltage ripple affect the x-ray emission spectrum.
CHAPTER 6 DISCUSSES the internal components of the x-ray tube—the cathode and the anode—within the evacuated glass or metal enclosure. This chapter explains the interactions of the projectile electrons that are accelerated from the cathode to the x-ray tube target. These interactions produce two types of x-rays—characteristic and bremsstrahlung; these are described by the x-ray emission spectrum. Various conditions that affect the x-ray emission spectrum are discussed.
Electron Target Interactions
The x-ray imaging system description in Chapter 6 emphasizes that its primary function is to accelerate electrons from the cathode to the anode in the x-ray tube. The three principal parts of an x-ray imaging system—the operating console, the high-voltage generator, and the x-ray tube—are designed to provide a large number of electrons with high kinetic energy focused toward a small spot on the anode.
Stationary objects have no kinetic energy; objects in motion have kinetic energy proportional to their mass and to the square of their velocity. The kinetic energy equation follows.
where m is the mass in kilograms, v is velocity in meters per second, and KE is kinetic energy in joules.
For example, a 1000-kg automobile has four times the kinetic energy of a 250-kg motorcycle traveling at the same speed (Figure 7-1). If the motorcycle were to double its velocity, however, it would have the same kinetic energy as the automobile.
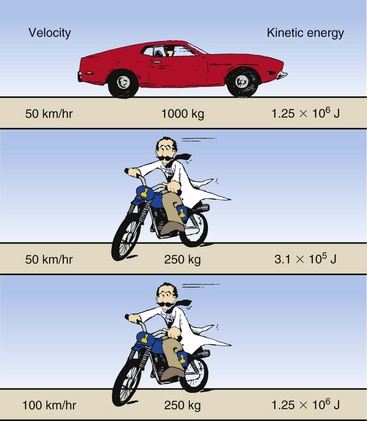
In determining the magnitude of the kinetic energy of a projectile, velocity is more important than mass. In an x-ray tube, the projectile is the electron. All electrons have the same mass; therefore, electron kinetic energy is increased by raising the kVp. As electron kinetic energy is increased, both the intensity (quantity) and the energy (quality) of the x-ray beam are increased.
The modern x-ray imaging system is remarkable. It conveys to the x-ray tube target an enormous number of electrons at a precisely controlled kinetic energy. At 100 mA, for example, 6 × 10¹⁷ electrons travel from the cathode to the anode of the x-ray tube every second.
In an x-ray imaging system operating at 70 kVp, each electron arrives at the target with a maximum kinetic energy of 70 keV. Because there are 1.6 × 10⁻¹⁶ J per keV, this energy is equivalent to the following:
When this energy is inserted into the expression for kinetic energy and calculations are performed to determine the velocity of the electrons, the result is as follows:


The distance between the filament and the x-ray tube target is only approximately 1 cm. It is not difficult to imagine the intensity of the accelerating force required to raise the velocity of electrons from zero to half the speed of light in so short a distance.
Electrons traveling from cathode to anode constitute the x-ray tube current and are sometimes called projectile electrons. When these projectile electrons hit the heavy metal atoms of the x-ray tube target, they transfer their kinetic energy to the target atoms.
These interactions occur within a very small depth of penetration into the target. As they occur, the projectile electrons slow down and finally come nearly to rest, at which time they are conducted through the x-ray anode assembly and out into the associated electronic circuitry.
The projectile electron interacts with the orbital electrons or the nuclear field of target atoms. These interactions result in the conversion of electron kinetic energy into thermal energy (heat) and electromagnetic energy in the form of infrared radiation (also heat) and x-rays.
Anode Heat
Most of the kinetic energy of projectile electrons is converted into heat (Figure 7-2). The projectile electrons interact with the outer-shell electrons of the target atoms but do not transfer sufficient energy to these outer-shell electrons to ionize them. Rather, the outer-shell electrons are simply raised to an excited, or higher, energy level.
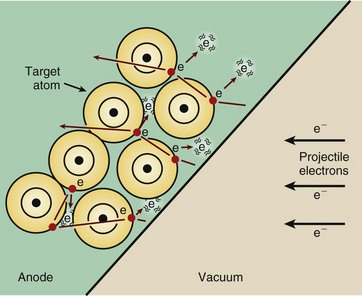
FIGURE 7-2 Most of the kinetic energy of projectile electrons is converted to heat by interactions with outer-shell electrons of target atoms. These interactions are primarily excitations rather than ionizations.
The outer-shell electrons immediately drop back to their normal energy level with the emission of infrared radiation. The constant excitation and return of outer-shell electrons are responsible for most of the heat generated in the anodes of x-ray tubes.
Only approximately 1% of projectile electron kinetic energy is used for the production of x-radiation. Therefore, sophisticated as it is, the x-ray imaging system is very inefficient.
The production of heat in the anode increases directly with increasing x-ray tube current. Doubling the x-ray tube current doubles the heat produced. Heat production also increases directly with increasing kVp, at least in the diagnostic range. Although the relationship between varying kVp and varying heat production is approximate, it is sufficiently exact to allow the computation of heat units for use with anode cooling charts.
The efficiency of x-ray production is independent of the tube current. Consequently, regardless of what mA is selected, the efficiency of x-ray production remains constant.
The efficiency of x-ray production increases with increasing kVp. At 60 kVp, only 0.5% of the electron kinetic energy is converted to x-rays. At 100 kVp, approximately 1% is converted to x-rays, and at 20 MV, 70% is converted.
Characteristic Radiation
If the projectile electron interacts with an inner-shell electron of the target atom rather than with an outer-shell electron, characteristic x-rays can be produced. Characteristic x-rays result when the interaction is sufficiently violent to ionize the target atom through total removal of an inner-shell electron.
Figure 7-3 illustrates how characteristic x-rays are produced. When the projectile electron ionizes a target atom by removing a K-shell electron, a temporary electron void is produced in the K shell. This is a highly unnatural state for the target atom, and it is corrected when an outer-shell electron falls into the void in the K shell.
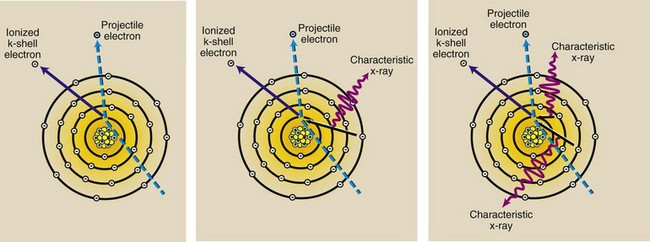
FIGURE 7-3 Characteristic x-rays are produced after ionization of a K-shell electron. When an outer shell electron fills the vacancy in the K shell, an x-ray is emitted.
The transition of an orbital electron from an outer shell to an inner shell is accompanied by the emission of an x-ray. The x-ray has energy equal to the difference in the binding energies of the orbital electrons involved.
| Question: | A K-shell electron is removed from a tungsten atom and is replaced by an L-shell electron. What is the energy of the characteristic x-ray that is emitted? |
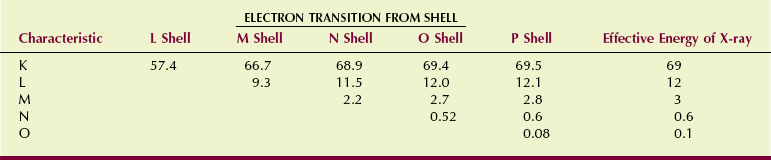
| Answer: | Reference to Figure 7-4 shows that for tungsten, K-shell electrons have binding energies of 69 keV, and L-shell electrons are bound by 12 keV. Therefore, the characteristic x-ray emitted has energy of 69 − 12 = 57 keV. |
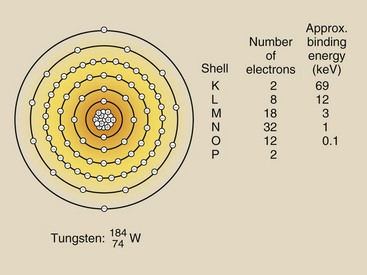
By the same procedure, the energy of x-rays resulting from M-to-K, N-to-K, O-to-K, and P-to-K transitions can be calculated. Tungsten, for example, has electrons in shells out to the P shell, and when a K-shell electron is ionized, its position can be filled with electrons from any of the outer shells. All of these x-rays are called K x-rays because they result from electron transitions into the K shell.
Similar characteristic x-rays are produced when the target atom is ionized by removal of electrons from shells other than the K shell. Note that Figure 7-3 does not show the production of x-rays resulting from ionization of an L-shell electron.
Such a diagram would show the removal of an L-shell electron by the projectile electron. The vacancy in the L shell would be filled by an electron from any of the outer shells. X-rays resulting from electron transitions to the L shell are called L x-rays and have much less energy than K x-rays because the binding energy of an L-shell electron is much lower than that of a K-shell electron.
Similarly, M-characteristic x-rays, N-characteristic x-rays, and even O-characteristic x-rays can be produced in a tungsten target. Figure 7-4 illustrates the electron configuration and Table 7-1 summarizes the production of characteristic x-rays in tungsten.
Although many characteristic x-rays can be produced, these can be produced only at specific energies, equal to the differences in electron-binding energies for the various electron transitions.
Except for K x-rays, all of the characteristic x-rays have very low energy. The L x-rays, with approximately 12 keV of energy, penetrate only a few centimeters into soft tissue. Consequently, they are useless as diagnostic x-rays, as are all the other low-energy characteristic x-rays. The last column in Table 7-1 shows the effective energy for each of the characteristic x-rays of tungsten.
 This type of x-radiation is called characteristic because it is characteristic of the target element.
Because the electron binding energy for every element is different, the energy of characteristic x-rays produced in the various elements is also different. The effective energy of characteristic x-rays increases with increasing atomic number of the target element.
Bremsstrahlung Radiation
The production of heat and characteristic x-rays involves interactions between the projectile electrons and the electrons of x-ray tube target atoms. A third type of interaction in which the projectile electron can lose its kinetic energy is an interaction with the nuclear field of a target atom. In this type of interaction, the kinetic energy of the projectile electron is also converted into electromagnetic energy.
A projectile electron that completely avoids the orbital electrons as it passes through a target atom may come sufficiently close to the nucleus of the atom to come under the influence of its electric field (Figure 7-5). Because the electron is negatively charged and the nucleus is positively charged, there is an electrostatic force of attraction between them.
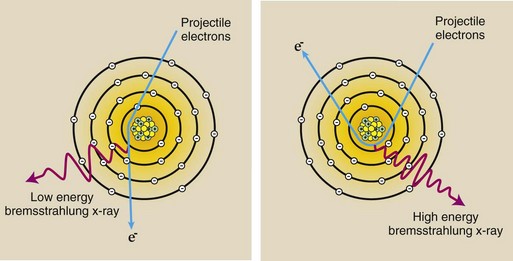
FIGURE 7-5 Bremsstrahlung x-rays result from the interaction between a projectile electron and a target nucleus. The electron is slowed, and its direction is changed.
The closer the projectile electron gets to the nucleus, the more it is influenced by the electric field of the nucleus. This field is very strong because the nucleus contains many protons and the distance between the nucleus and projectile electron is very small.
As the projectile electron passes by the nucleus, it is slowed down and changes its course, leaving with reduced kinetic energy in a different direction. This loss of kinetic energy reappears as an x-ray.
Bremsstrahlung x-rays are produced when a projectile electron is slowed by the nuclear field of a target atom nucleus.
These types of x-rays are called bremsstrahlung x-rays. Bremsstrahlung is a German word that means “slowed-down radiation.” Bremsstrahlung x-rays can be considered radiation that results from the braking of projectile electrons by the nucleus.
A projectile electron can lose any amount of its kinetic energy in an interaction with the nucleus of a target atom, and the bremsstrahlung x-ray associated with the loss can take on corresponding values. For example, when an x-ray imaging system is operated at 70 kVp, projectile electrons have kinetic energies up to 70 keV.
An electron with kinetic energy of 70 keV can lose all, none, or any intermediate level of that kinetic energy in a bremsstrahlung interaction. Therefore, the bremsstrahlung x-ray produced can have any energy up to 70 keV.
This is different from the production of characteristic x-rays, which have very specific energies. Figure 7-5 illustrates how one can consider the production of such a wide range of energies through the bremsstrahlung interaction.
A low-energy bremsstrahlung x-ray results when the projectile electron is barely influenced by the nucleus. A maximum-energy x-ray occurs when the projectile electron loses all its kinetic energy and simply drifts away from the nucleus. Bremsstrahlung x-rays with energies between these two extremes occur more frequently.
Bremsstrahlung x-rays can be produced at any projectile electron energy. K-characteristic x-rays require an x-ray tube potential of at least 69 kVp. At 65 kVp, for example, no useful characteristic x-rays are produced; therefore, the x-ray beam is all bremsstrahlung. At 100 kVp, approximately 15% of the x-ray beam is characteristic, and the remaining is bremsstrahlung.
X-Ray Emission Spectrum
Most people have seen or heard of pitching machines (the devices used by baseball teams for batting practice so that pitchers do not get worn out). Similar machines are used to automatically eject bowling balls, tennis balls, and even ping-pong balls.
Suppose there was a device that could eject all of these types of balls randomly. The most straightforward way to determine how often each type of ball was ejected on average would be to catch each ball as it was ejected and then identify it and drop it into a basket; at the end of the observation period, the total number of each type of ball could be counted.
Let us suppose that the results obtained for a given period are those shown in Figure 7-6. A total of 600 balls were ejected. Perhaps the easiest way to represent these results graphically would be to plot the total number of each type of ball emitted during the observation period and represent each total by a bar (Figure 7-7).
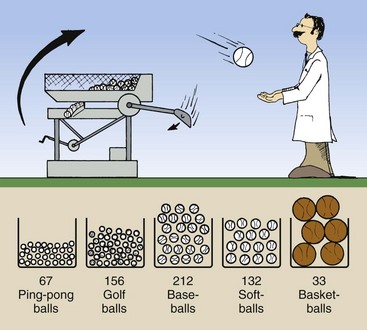
FIGURE 7-6 Over a given period, an automatic ball-throwing machine might eject 600 balls, distributed as shown.
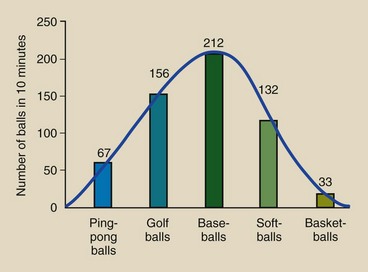
FIGURE 7-7 Bar graph representing the results of observation of balls ejected by the automatic pitching machine shown in Figure 7-6. When the height of each bar is joined, a smooth emission spectrum is created.
Such a bar graph can be described as a discrete ball ejection spectrum that is representative of the automatic pitching machine. It is a plot of the number of balls ejected as a function of the type of ball. It is called discrete because only five distinct types of balls are involved.
Connecting the bars with a curve as shown would indicate a large number of different types of balls. Such a curve is called a continuous ejection spectrum. The word spectrum refers to the range of types of balls or values of any quantity such as x-rays. The total number of balls ejected is represented by the sum of the areas under the bars in the case of the discrete spectrum and the area under the curve in the case of the continuous spectrum.
Without regard for the absolute number of balls emitted, Figure 7-7 also could be identified as a relative ball ejection spectrum because at a glance, one can tell the relative frequency with which each type of ball was ejected. Relatively speaking, baseballs are ejected most frequently and basketballs least frequently.
This type of relationship is fundamental to describing the radiation output of an x-ray tube. If one could stand in the middle of the useful x-ray beam, catch each individual x-ray, and measure its energy, one could describe what is known as the x-ray emission spectrum (Figure 7-8).
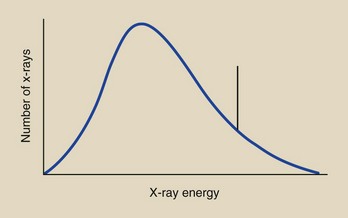
Here, the relative number of x-rays emitted is plotted as a function of the energy of each individual x-ray. X-ray energy is the variable that is considered.
Although we cannot catch and identify each individual x-ray, instruments are available that allow us to do essentially that. X-ray emission spectra have been measured for all types of x-ray imaging systems. Data on x-ray emission spectra are needed if one is to gain an understanding of how changes in kVp, mA, and added filtration affect the quality of an image.
Characteristic X-ray Spectrum
The discrete energies of characteristic x-rays are characteristic of the differences between electron binding energies in a particular element. A characteristic x-ray from tungsten, for example, can have one of 15 different energies (see Table 7-1) and no others. A plot of the frequency with which characteristic x-rays are emitted as a function of their energy would look similar to that shown for tungsten in Figure 7-9.
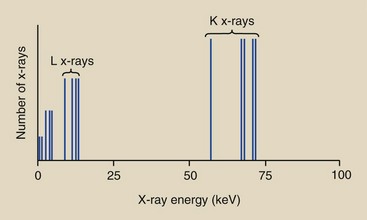
FIGURE 7-9 Characteristic x-ray emission spectrum for tungsten contains 15 different x-ray energies.
Such a plot is called the characteristic x-ray emission spectrum. Five vertical lines representing K x-rays and four vertical lines representing L x-rays are included. The lower energy lines represent characteristic emissions from the outer electron shells.
Characteristic x-rays have precisely fixed (discrete) energies and form a discrete emission spectrum.
The relative intensity of the K x-rays is greater than that of the lower energy characteristic x-rays because of the nature of the interaction process. K x-rays are the only characteristic x-rays of tungsten with sufficient energy to be of value in diagnostic radiology. Although there are five K x-rays, it is customary to represent them as one, as has been done in this figure with a single vertical line, at 69 keV (Figure 7-10). Only this line will be shown in later graphs.
Bremsstrahlung X-ray Spectrum
If it were possible to measure the energy contained in each bremsstrahlung x-ray emitted from an x-ray tube, one would find that these energies range from the peak electron energy all the way down to zero. In other words, when an x-ray tube is operated at 90 kVp, bremsstrahlung x-rays with energies up to 90 keV are emitted. A typical bremsstrahlung x-ray emission spectrum is shown in Figure 7-10.
| Question: | At what kVp was the x-ray imaging system presented in Figure 7-10 operated? |
| Answer: | Because the bremsstrahlung spectrum intersects the energy axis at approximately 90 keV, the imaging system must have been operated at approximately 90 kVp. |
The general shape of the bremsstrahlung x-ray spectrum is the same for all x-ray imaging systems. The maximum energy (in keV) of a bremsstrahlung x-ray is numerically equal to the kVp of operation.
The greatest number of x-rays is emitted with energy approximately one third of the maximum energy. The number of x-rays emitted decreases rapidly at very low energies.
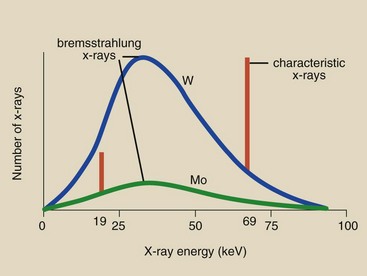
| Question: | What would be the expected emission spectrum for an x-ray imaging system with a pure molybdenum (Mo) target (effective energy of K x-ray = 19 keV) operated at 90 kVp? |
| Answer: | The spectrum should look something like Figure 7-8. The curve intersects the energy axis at 0 and 90 keV and has the general shape shown in Figure 7-10. The bremsstrahlung spectrum is much lower because the atomic number of Mo is low (Z = 42), and x-ray production is much less efficient. A line extends above the curve at 19 keV to represent the K-characteristic x-rays of molybdenum. |
As described in Chapter 4, the energy of an x-ray is equal to the product of its frequency (f) and Planck’s constant (h). X-ray energy is inversely proportional to its wavelength. As x-ray wavelength increases, x-ray energy decreases.
The minimum wavelength of x-ray emission corresponds to the maximum x-ray energy, and the maximum x-ray energy is numerically equal to the kVp.
Factors Affecting the X-Ray Emission Spectrum
The total number of x-rays emitted from an x-ray tube could be determined by adding together the number of x-rays emitted at each energy over the entire spectrum, a process called integration. Graphically, the total number of x-rays emitted is equivalent to the area under the curve of the x-ray emission spectrum.
The general shape of an emission spectrum is always the same, but its relative position along the energy axis can change. The farther to the right a spectrum is, the higher the effective energy or quality of the x-ray beam.
The larger the area under the curve, the higher is the x-ray intensity or quantity. A number of factors under the control of radiographers influence the size and shape of the x-ray emission spectrum and therefore the quality and quantity of the x-ray beam. These factors are summarized in Table 7-2.
TABLE 7-2
Factors That Affect the Size and Relative Position of X-ray Emission Spectra
| Factor | Effect |
| Tube current | Amplitude of spectrum |
| Tube voltage | Amplitude and position |
| Added filtration | Amplitude; most effective at low energy |
| Target material | Amplitude of spectrum and position of line spectrum |
| Voltage waveform | Amplitude; most effective at high energy |
Effect of mA and mAs
If one changes the current from 200 to 400 mA while all other conditions remain constant, twice as many electrons will flow from the cathode to the anode, and the mAs will be doubled. This operating change will produce twice as many x-rays at every energy. In other words, the x-ray emission spectrum will be changed in amplitude but not in shape (Figure 7-11).
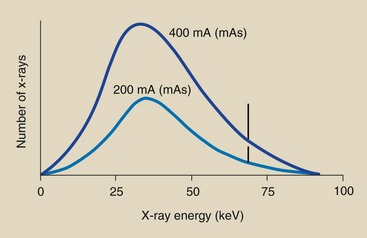
FIGURE 7-11 Change in mA or mAs results in a proportionate change in the amplitude of the x-ray emission spectrum at all energies.
Each point on the curve labeled 400 mA or 400 mAs is precisely two times higher than the associated point on the 200 mA or 200 mAs curve. Thus, the area under the x-ray emission spectrum varies in proportion to changes in mA or mAs, as does the x-ray quantity.
A change in mA or mAs results in a proportional change in the amplitude of the x-ray emission spectrum at all energies.
 Four Principal Factors Influencing the Shape of an X-ray Emission Spectrum
1. The projectile electrons accelerated from cathode to anode do not all have peak kinetic energy. Depending on the types of rectification and high-voltage generation, many of these electrons may have very low energies when they strike the target. Such electrons can produce only heat and low-energy x-rays.
2. The target of a diagnostic x-ray tube is relatively thick. Consequently, many of the bremsstrahlung x-rays emitted result from multiple interactions of the projectile electrons, and for each successive interaction, a projectile electron has less energy.
3. Low-energy x-rays are more likely to be absorbed in the target.
4. External filtration is always added to the x-ray tube assembly. This added filtration serves selectively to remove low-energy x-rays from the beam.
| Question: | Suppose the area under the 200-mA (200 mAs) curve in Figure 7-11 totals 4.2 cm2 and the x-ray quantity is 3 mGya (300 mR). What would the area under the curve and the x-ray quantity be if the tube current were increased to 400 mA (400 mAs) while other operating factors remain constant? |
| Answer: | In going from 200 to 400 mA or mAs, the tube current has been increased by a factor of two. The area under the curve and the x-ray quantity are increased proportionately: Area = 4.2 cm2 × 2 = 8.4 cm2 Intensity = 3 mGya × 2 = 6 mGya |
Effect of kVp
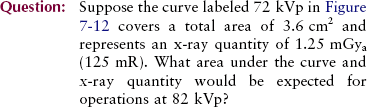
As the kVp is raised, the area under the curve increases to an area approximating the square of the factor by which kVp was increased. Accordingly, the x-ray quantity increases with the square of this factor.
When kVp is increased, the relative distribution of emitted x-ray energy shifts to the right to a higher average x-ray energy. The maximum energy of x-ray emission always remains numerically equal to the kVp.
Figure 7-12 demonstrates the effect of increasing the kVp while other factors remain constant. The lower spectrum represents x-ray operation at 72 kVp, and the upper spectrum represents operation at 82 kVp—a 10-kVp (or 15%) increase.
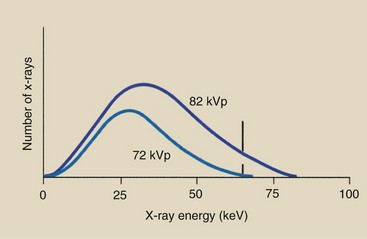
FIGURE 7-12 Change in kVp results in an increase in the amplitude of the emission spectrum at all energies but a greater increase at high energies than at low energies. Therefore, the spectrum is shifted to the right, or high-energy, side.
The area under the curve has approximately doubled, while the relative position of the curve has shifted to the right, the high-energy side. More x-rays are emitted at all energies during operation at 82 kVp than during operation at 72 kVp. The increase, however, is relatively greater for high-energy x-rays than for low-energy x-rays.
This example partially explains the rule of thumb used by radiographers to relate the kVp and mAs changes necessary to produce a constant optical density (OD) on a radiograph or a constant signal on a digital radiograph. The rule states that a 15% increase in kVp is equivalent to doubling the mAs. At low kVp, such as 50 to 60 kVp, approximately a 7-kVp increase is equivalent to doubling the mAs. At tube potentials above about 100 kVp, a 15-kVp change may be necessary.
A 15% increase in kVp does not double the x-ray intensity but is equivalent to doubling the mAs to the image receptor. To double the output intensity by increasing kVp, one would have to raise the kVp by as much as 40%.
Radiographically, only a 15% increase in kVp is necessary because with increased kVp, the penetrability of the x-ray beam is increased. Therefore, less radiation is absorbed by the patient, leaving a proportionately greater number of x-rays to expose the image receptor.
Effect of Added Filtration
Adding filtration to the useful x-ray beam reduces x-ray beam intensity while increasing the average energy. This effect is shown in Figure 7-13, where an x-ray tube is operated at 95 kVp with 2-mm aluminum (Al) added filtration compared with the same operation with 4-mm Al added filtration. Added filtration more effectively absorbs low-energy x-rays than high-energy x-rays; therefore, the bremsstrahlung x-ray emission spectrum is reduced further on the left than on the right.
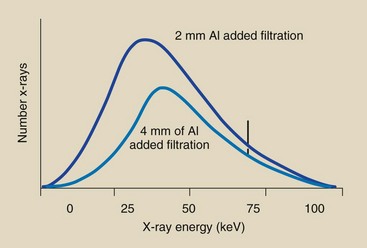
FIGURE 7-13 Adding filtration to an x-ray tube results in reduced x-ray intensity but increased effective energy. The emission spectra represented here resulted from operation at the same mA and kVp but with different filtration.
The result of added filtration is an increase in the average energy of the x-ray beam with an accompanying reduction in x-ray quantity.
Adding filtration is sometimes called hardening the x-ray beam because of the relative increase in average energy. The characteristic spectrum is not affected, nor is the maximum energy of x-ray emission. There is no simple method for calculating the precise changes that occur in x-ray quality and quantity with a change in added filtration.
Effect of Target Material
The atomic number of the target affects both the number (quantity) and the effective energy (quality) of x-rays. As the atomic number of the target material increases, the efficiency of the production of bremsstrahlung radiation increases, and high-energy x-rays increase in number to a greater extent than low-energy x-rays.
The change in the bremsstrahlung x-ray spectrum is not nearly as pronounced as the change in the characteristic spectrum. After an increase in the atomic number of the target material, the characteristic spectrum is shifted to the right, representing the higher energy characteristic radiation. This phenomenon is a direct result of the higher electron binding energies associated with increasing atomic number.
Increasing target atomic number enhances the efficiency of x-ray production and the energy of characteristic and bremsstrahlung x-rays.
These changes are shown schematically in Figure 7-14. Tungsten is the primary component of x-ray tube targets, but some specialty x-ray tubes use gold as target material. The atomic numbers for tungsten and gold are 74 and 79, respectively.
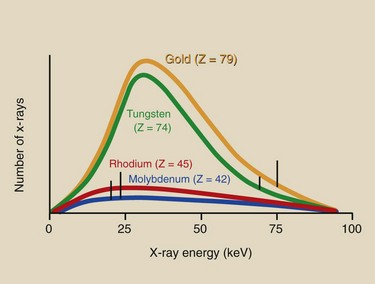
FIGURE 7-14 Discrete emission spectrum shifts to the right with an increase in the atomic number of the target material. The continuous spectrum increases slightly in amplitude, particularly to the high-energy side, with an increase in target atomic number.
Molybdenum (Z = 42) and rhodium (Z = 45) are target elements used for mammography. In many dedicated mammography imaging systems, these elements are incorporated separately into the target.
The x-ray quantity from such targets is low owing to the inefficiency of x-ray production. This occurs because of the low atomic number of these target elements. Elements of low atomic number also produce low-energy characteristic x-rays.
Effect of Voltage Waveform
There are five voltage waveforms: half-wave–rectified, full-wave–rectified, three-phase/six-pulse, three-phase/ 12-pulse, and high-frequency waveforms.
Half-wave–rectified and full-wave–rectified voltage waveforms are the same except for the frequency of x-ray pulse repetition. There are twice as many x-ray pulses per cycle with full-wave rectification as with half-wave rectification.
The difference between three-phase/six-pulse and three-phase/12-pulse power is simply the reduced ripple obtained with 12-pulse generation compared with six-pulse generation. High-frequency generators are based on fundamentally different electrical engineering principles. They produce the lowest voltage ripple of all high-voltage generators.
Figure 7-15 shows an exploded view of a full-wave–rectified voltage waveform for an x-ray imaging system operated at 100 kVp. Recall that the amplitude of the waveform corresponds to the applied voltage and that the horizontal axis represents time.
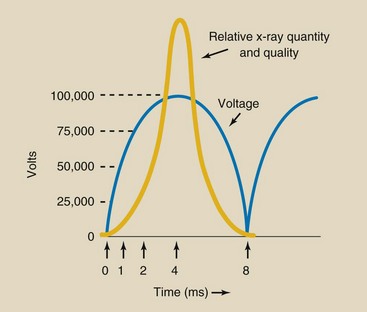
FIGURE 7-15 As the voltage across the x-ray tube increases from zero to its peak value, x-ray intensity and energy increase slowly at first and then rapidly as peak voltage is obtained.
At t = 0, the voltage across the x-ray tube is zero, indicating that at this instant, no electrons are flowing and no x-rays are being produced. At t = 1 ms, the voltage across the x-ray tube has increased from 0 to approximately 60,000 V. The x-rays produced at this instant are of relatively low intensity and energy; none exceeds 60 keV. At t = 2 ms, the tube voltage has increased to approximately 80,000 V and is rapidly approaching its peak value.
At t = 4 ms, the maximum tube voltage is obtained, and the maximum energy and intensity of x-ray emission are produced. For the following one quarter cycle between 4 and 8 ms, the x-ray quantity and quality decrease again to zero.
The number of x-rays emitted at each instant through a cycle is not proportional to the voltage. The number is low at lower voltages and increases at higher voltages. The quantity of x-rays is much greater at peak voltages than at lower voltages. Consequently, voltage waveforms of three-phase or high-frequency operation result in considerably more intense x-ray emission than those of single-phase operation.
The relationship between x-ray quantity and type of high-voltage generator provides the basis for another rule of thumb used by radiologic technologists. If a radiographic technique calls for 72 kVp on single-phase equipment, then on three-phase equipment, approximately 64 kVp—a 12% reduction—will produce similar results. High-frequency generators produce approximately the equivalent of a 16% increase in kVp, or slightly more than a doubling of mAs over single-phase power.
Because of reduced ripple, operation with three-phase power or high frequency is equivalent to an approximate 12% increase in kVp, or almost a doubling of mAs over single-phase power.
This discussion is summarized in Figure 7-16, where an x-ray emission spectrum from a full-wave–rectified unit is compared with that from a three-phase, 12-pulse generator and a high-frequency generator, all operated at 92 kVp and at the same mAs. The x-ray emission spectrum that results from high-frequency operation is more efficient than that produced with a single-phase or a three-phase generator. The area under the curve is considerably greater, and the x-ray emission spectrum is shifted to the high-energy side.
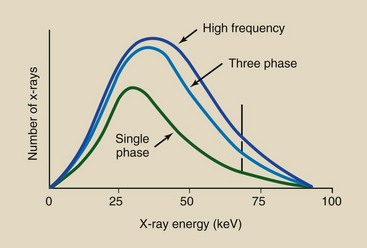
FIGURE 7-16 Three-phase and high-frequency operations are considerably more efficient than single-phase operation. Both the x-ray intensity (area under the curve) and the effective energy (relative shift to the right) are increased. Shown are representative spectra for 92-kVp operation at constant mAs.
The characteristic x-ray emission spectrum remains fixed in its position on the energy axis but increases slightly in magnitude as a result of the increased number of projectile electrons available for K-shell electron interactions.
| Question: | What would be the difference in the x-ray emission spectra between a full-wave–rectified operation and a half-wave–rectified operation if the kVp and the mAs are held constant? |
| Answer: | Under constant conditions of kVp and mAs, there should be no difference in the x-ray emission spectra. The x-ray quantity and quality will remain the same for both modes of operation. Exposure time will double for the half-wave–rectified operation. |
Table 7-3 presents a summary of the effect on x-ray quantity and quality produced by each of the factors that influence the x-ray emission spectrum. Although five factors are listed, only the first two, mAs and kVp, are routinely controlled by radiographers. Occasionally, the added filtration is changed if the imaging system design permits.
TABLE 7-3
Changes in X-ray Beam Quality and Quantity Produced by Factors That Influence the Emission Spectrum
| An Increase in | Results in |
| Current (mAs) | An increase in quantity; no change in quality |
| Voltage (kVp) | An increase in quantity and quality |
| Added filtration | A decrease in quantity and an increase in quality |
| Target atomic number (Z) | An increase in quantity and quality |
| Voltage ripple | A decrease in quantity and quality |
Summary
When electrons are accelerated from the cathode to the target of the anode, three effects take place: the production of heat, the formation of characteristic x-rays, and the formation of bremsstrahlung x-rays.
Characteristic x-rays are produced when an electron ionizes an inner-shell electron of a target atom. As the inner-shell void is filled, a characteristic x-ray is emitted.
Bremsstrahlung x-rays are produced by the slowing down of an electron by the target atom’s nuclear field. Most x-rays in the diagnostic range (20–150 kVp) are bremsstrahlung x-rays.
X-ray emission spectra can be graphed as the number of x-rays for each increment of energy in keV. Characteristic x-rays of tungsten have a discrete energy of 69 keV. Bremsstrahlung x-rays have a range of energies up to X keV, where X is the kVp.
The following four factors influence the x-ray emission spectrum: (1) low-energy electrons interact to produce low-energy x-rays, (2) successive interactions of electrons result in the production of x-rays with lower energy, (3) low-energy x-rays are most likely to be absorbed by the target material, and (4) added filtration preferentially removes low-energy x-rays from the useful beam.
1. Define or otherwise identify the following:
2. Calculate the energy and wavelength of the characteristic x-ray produced when a K-shell electron is replaced by an M-shell electron in tungsten.
3. At what fraction of the velocity of light do 90-keV electrons travel?
4. What does the discrete x-ray spectrum represent?
5. Draw the x-ray emission spectrum for an x-ray imaging system with a tungsten-targeted x-ray tube operated at 90 kVp.
6. When an x-ray imaging system is operated at 80 kVp, its emission spectrum represents an output intensity of 35 uGya/mAs. What will be the output intensity if the voltage is increased to 90 kVp? How will the emission spectrum change?
7. Discuss the effect on the x-ray emission spectrum if a single-phase x-ray imaging system is changed to a three-phase system.
8. Explain the effect the addition of filtration to an x-ray tube has on the discrete and continuous x-ray emission spectra.
9. How is the kinetic energy of the projectile electrons streaming across the x-ray tube increased?
10. At 80 kVp, what is the energy in joules of electrons arriving at the x-ray tube target?
11. Why is the x-ray tube considered an inefficient device?
12. Draw the diagram and write a description of the formation of characteristic radiation.
13. What is the importance of K-characteristic x-rays in forming a diagnostic radiograph?
14. What is the range of energies of bremsstrahlung x-rays?
15. What is the minimum wavelength associated with x-rays emitted from an x-ray tube operated at 90 kVp?
16. List three factors that affect the shape of the x-ray emission spectrum and briefly describe each.
17. Define and explain the 15% kVp rule.
18. What is the diagnostic range of x-rays?
19. What type of radiation is useful for mammography and not useful for general diagnostic exposures?
20. In your clinical setting, observe or ask what filtration is used on the x-ray tubes. Why is filtration important?
The answers to the Challenge Questions can be found by logging on to our website at http://evolve.elsevier.com.