Digital Radiographic Quality Control
At the completion of this chapter, the student should be able to do the following:
1 Describe various factors associated with the performance of digital display devices.
2 Explain the various test patterns suggested by AAPM TG 18 on digital display device performance assessment.
3 Discuss the quality control tests and schedule used for digital display devices.
WITH THE advent of digital imaging, the scope of conventional quality assurance protocols has expanded beyond the traditional areas of medical imaging with screen-film radiographic image receptors. Quality control (QC) procedures for the support of screen-film radiographic imaging are directed to imaging system evaluation, wet chemistry processors, screens, and viewboxes.
Digital radiographic imaging QC is also directed to imaging system evaluation, but that is not reviewed here (see Chapter 20). The new QC requirement of digital radiography involves the reading environment and the digital display device.
In any modern radiology reading room, light boxes are being replaced with digital monitors for radiographic image review and diagnosis. Any malfunctioning component in the digital display device can produce image degradation that can simulate or obscure disease. To ensure proper functioning of digital display devices, it is essential that a comprehensive QC program be implemented under the supervision of a qualified medical physicist.
Performance Assessment Standards
Assessing the performance of digital display devices requires that we have some understanding of the field of photometry. This is covered in Chapter 18, which describes an additional system of units.
Numerous initiatives have been developed to standardize soft copy digital display device performance standards.
SMPTE
The Society of Motion Picture and Television Engineers (SMPTE) has described the format, dimensions, and contrast characteristics of a pattern used to make measurements of the resolution of display systems. One outcome of these performance recommendations is what is commonly referred to as the SMPTE pattern (Figure 22-1).
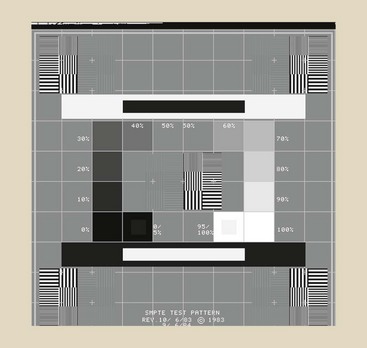
FIGURE 22-1 The SMPTE pattern was developed by the Society of Motion Picture and Television Engineers.
Among other characteristics that the pattern provides, the most common is the observation of 5% and 95% luminance patches. This helps to point out any gross deviations in luminance adjustments.
In its standards for teleradiology, the American College of Radiology (ACR) has recommended that the SMPTE pattern should be used for QC purposes as well. Most digital imaging equipment vendors provide the pattern in a format such that it can be displayed on the digital monitor for evaluation purposes.
NEMA-DICOM
The ACR and the National Electrical Manufacturers Association (NEMA) formed a committee that generated a standard for Digital Imaging and Communication that is referred to as the DICOM standard. They presented their work as a document known as the Gray Scale Display Function (GSDF). The intent of this standard was to allow medical images to be transferred according to the DICOM standard to be displayed on any DICOM-compatible display device with a consistent gray scale appearance.
The consistent appearance was achieved in keeping with the principle of perceptual linearization, wherein equal changes in digital values associated with an image translate into equal changes in perceived brightness at the display. GSDF is now mandated for all digital display devices.
DIN 2001
In 2001, the German standards institution, Deutsches Institut für Normung, published a document called, “Image Quality Assurance in X-ray Diagnostics; Acceptance Testing for Image Display Devices” (DIN 2001). DIN 2001 was developed as an acceptance testing standard to address the requirements for digital display devices. It called for joint performance evaluation of the imaging modality and the digital display device.
VESA
In 1998, the Flat Panel Display Measurement (FPDM) standard, version 1.0, was released by the Video Electronics Standard Association (VESA). This standard provides a set of instructions that can be used to help in the evaluation of system performance according to a compliance standard.
AAPM TG 18
To evaluate a digital display device comprehensively toward the goal of ensuring acceptable clinical performance, the American Association of Physicists in Medicine (AAPM) developed a set of test patterns and outlined related procedures in Task Group Report 18. The following sections explain the various patterns recommended by the AAPM along with prescribed methods for use. Particular emphasis is placed on details of associated patterns that can be used by a radiologic technologist to perform checks to ensure proper system performance.
We begin with an introduction to the test tools that are used by medical physicists for comprehensive testing of digital display devices.
Luminance Meter
The luminance response of monitors and luminance uniformity measurements require the use of a properly calibrated photometer. Two types of photometers are commonly used: near-range and telescopic photometers.
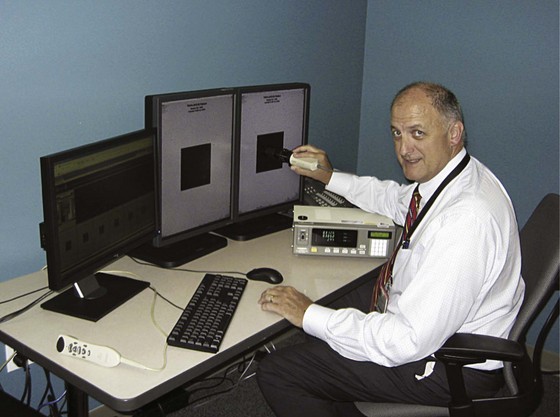
FIGURE 22-2 Use of a near-range photometer during digital display device evaluation. (Courtesy John Hazle, MD Anderson Cancer Center.)
 Photometric evaluation of digital display devices and ambient light levels is essential to digital QC.
Near-range photometers are used in close proximity to monitors; telescopic photometers are used to test from a distance of 1 m.
The response from the two types of photometers may be slightly different, depending on the contribution that is made by stray sources of light. However, the readings from both types are acceptable as long as measurements are performed in a consistent manner. Contributions from ambient light should be kept constant when either photometer is used.
The luminance meter should use a calibration method that is traceable to the National Institute of Standards and Technology (NIST) and should be able to measure luminance in the range of 0.05 to 1000 cd/m2 with better than 5% accuracy and a precision of at least 0.01. The photometer also should comply with the Commission Internationale de l’Éclairage (CIE) standard photopic spectral response within a range of 3%.
To evaluate monitor display reflection and to assess ambient light conditions, an illuminance meter is used. The illuminance meter should be calibrated according to NIST standards; response to better than 5% at a 50-degree angulation should be required.
It is important to quantify the color tint of various gray scale displays to match multiple monitors that may be used at a single workstation. Colorimeters are used to measure CIE-specified color coordinates of a digital display device. These are available in near-range and telescopic styles.
Digital Display Device Quality Control
To carefully evaluate the comprehensive characteristics of the digital display device, a range of tests are performed. For most of these, AAPM TG 18 patterns are used to perform qualitative and quantitative tests. For a few tests, no test patterns are required.
Geometric Distortion
Geometric distortion arises from problems that cause the displayed image to be geometrically different from the original image. This can affect the relative size and shape of image features.
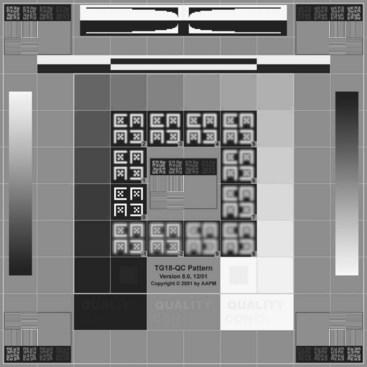
Visual assessment of geometric distortion can be carried out with the use of TG 18-QC and TG 18-LPV/LPH test patterns (Figure 22-3). By filling the entire screen with the test pattern, one can look for pincushion and barrel-like distortions. These types of distortions are common in cathode ray tube (CRT)–based display devices. All lines in the pattern in general should appear straight.
By measuring distances in the square areas of the pattern with the help of a flexible plastic ruler, one can quantify the level of distortion in the images. Measurements are performed in various quadrants to look at variation in geometric distortion in different areas of the monitor.
With primary class devices, the acceptable level of distortion in various quadrants in either direction is 2%. The corresponding criterion for secondary class devices is 5%.
Reflection
An ideal digital display device has a luminance that is based on the light generated only by the device itself. In reality, the ambient light significantly contributes to the light reflected by the display device, which in turn depends on the display characteristics of the display device. It is important to characterize these reflection characteristics of the display device.
Usually, the display reflection is characterized as specular and diffuse. Specular reflection results in the generation of mirror images of light sources surrounding the monitor. In diffuse reflection, light is randomly scattered on the digital display device.
In Figure 22-4 diffuse and specular reflections are illustrated for a color (left) and a monochrome (right) display device with the power off. Monochrome has reduced specular reflection because of an improved antireflective coating.
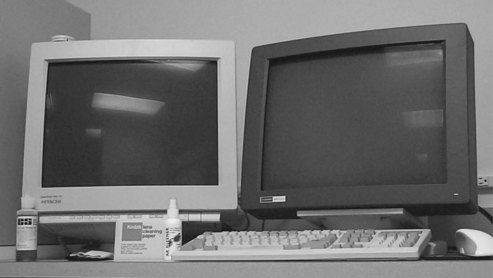
FIGURE 22-4 Diffuse and specular reflections are illustrated for a color (left) and a monochrome (right) display device with the power off. Monochrome has reduced specular reflection caused by an improved antireflective coating. (Courtesy Eshan Samei, Duke University, North Carolina.)
A simple test to assess specular reflection is to simply turn off the monitor and look for sources of illumination within a 15-degree angle of observation at an approximate distance of 30 to 50 cm. Look for images of various light sources and any high-contrast patterns from viewers’ clothing or the surroundings.
The TG 18-AD pattern (Figure 22-5) consists of uniformly varying low-contrast patterns. To evaluate diffuse reflection, one has to observe the threshold of visibility for low-contrast patterns under ambient lighting conditions and in total darkness. Under both conditions, the threshold of visibility should be the same. If the ambient lighting changes the threshold, then ambient lighting should be reduced.

Luminance Response
The image acquired by a digital modality is stored as an array of pixel values. These pixel values are also grayscale values, and they are sent to a digital display device as presentation values or p-values.
These p-values then are transformed into digital driving levels (DDLs) that then are transformed into luminance values through a look-up table. Transformation of presentation values to DDLs is performed according to the DICOM standard, which ensures that when these DDLs are displayed as luminance levels, corresponding equal changes in perceived brightness correspond to equal changes in p-values.
Digital image data arrive at the digital display device as p-values transformed into digital driving levels and viewed as luminance levels.
The luminance response of a digital display device refers to the relationship between displayed luminance and input values of a standardized display system. Displayed luminance consists of light produced by the display device; it varies between Lmin and Lmax and receives a fixed contribution from diffusely reflected ambient light—Lamb.
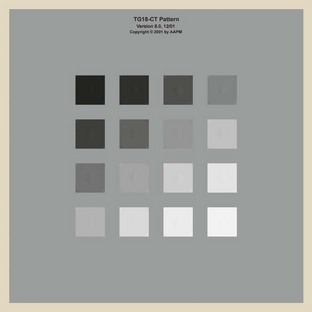
The TG 18-CT test pattern (Figure 22-6) is used to perform a qualitative evaluation of the luminance response of a digital display device. This pattern has low-contrast targets that should be visible in all 16 regions of the pattern. The pattern should be evaluated from a distance of approximately 30 cm. A common failure is to be unable to see targets in one or two of the dark regions.
With the use of an external photometer and TG 18-LN test patterns (Figure 22-7), the luminance in the test region should be recorded for the 18 DDLs. Ambient lighting conditions should be reduced to minimum levels. The maximum luminance value should be greater than 171 cd/m2. Maximum luminance values should be verified against the manufacturer’s quoted value.
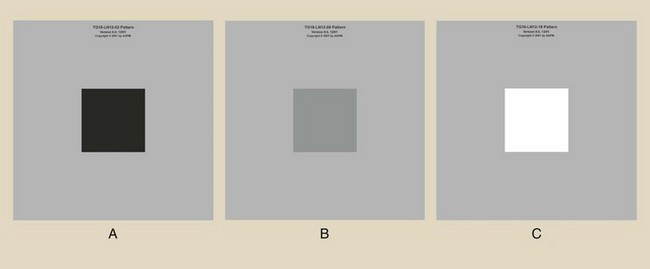
FIGURE 22-7 Examples of different luminance patches for measurement of luminance response of the system, using AAPM TG 18-LN Test patterns.
The luminance response of a display device varies as a function of location on the display surface. The contrast behavior is a function of the viewing angle as well. The maximum variation of luminance across the display area when a uniform pattern is displayed is referred to as luminance nonuniformity. CRT displays have luminance nonuniformity from the center to the edges and corners of the display.
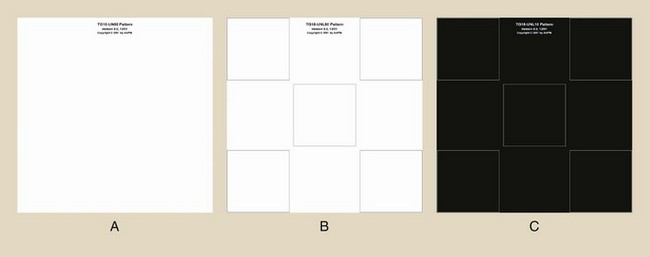
The TG 18-UN10 and 80 test patterns (Figure 22-8) can be used for visual evaluation of nonuniformity. By observing the patterns across the display screen, one can observe any gross variations in uniformity. No luminance variations with dimensions on the order of 1 cm or larger should be observed.
For qualitative or visual assessment of angular dependence, the TG 18-CT test pattern is used. By first observing the half-moon targets straight on-axis and then comparing them with viewing angles in which the visibility of half-moon targets is altered, one can gain an understanding of viewing angle dependency of a particular display device.
The viewing angle within which the monitor shows no variation in viewed patterns will define a conelike region and is the region in which the monitor should be used clinically. Established viewing angle limits may be clearly labeled on the front of the display device. For multiple LCD monitor workstations, displays should be adjusted in such a way that the displays optimally face the user.
For quantitative evaluation of luminance uniformity, one measures the luminance in different regions of TG 18-UNL10 and TG 18-UNL80 patterns with an external photometer. Luminance is measured at five different locations of the monitor.
Maximum deviation in uniformity is calculated as the percent difference between maximum and minimum luminance values relative to their average value as follows:

Maximum nonuniformity for an individual display device should be less than 30%.
Display Resolution
Spatial resolution is the quantitative measure of the ability of the display system to produce separable images of different points of an object with high fidelity.
TG 18-CX (Figure 22-9) and TG 18-QC (see Figure 22-3) patterns can be used to evaluate display resolution. The CX patterns in the middle and in the corners can be evaluated with a magnifying glass and compared. The TG 18-PX (Figure 22-10) pattern can be used to evaluate resolution uniformity.


Display Noise
Noise in an image, along with image contrast and size, is an important factor in determining the visibility of an object. Any high-frequency fluctuations or patterns that interfere with detection of the true signal are classified as noise. Noise can be quantified with the TG 18-AFC test pattern (Figure 22-11), which is based on the method used to determine just noticeable luminance difference as a function of size.
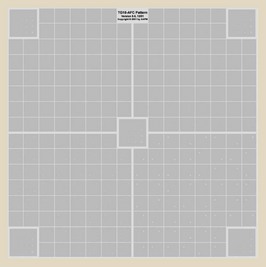
The test pattern contains a large number of regions with changing target positions. Size and contrast, however, are constant in four of the four quadrants into which the pattern is subdivided.
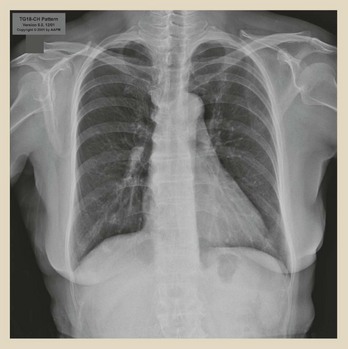
In addition to all the patterns that have been described here, other patterns are designed to evaluate characteristics such as veiling glare and display chromaticity. Also, some reference anatomical images, such as the digital chest image shown in Figure 22-12, are available for overall display system evaluation.
Quality Control by the Technologist
The digital radiographic QC described in this chapter is principally the responsibility of medical physicists. QC technologists should learn how to acquire the TG 18-QC test pattern and use it on each digital display device regularly.
To ensure proper operation of each digital display device, it is important to develop a continuous QC program. This should include the following:
• Medical physicist’s acceptance testing of any new digital display devices
• Routine QC tests by the QC technologist using TG 18-QC test pattern
• Periodic review of QC program by a qualified medical physicist
• Annual and postrepair medical physics performance evaluations
Although a comprehensive QC program is strongly desirable, regular evaluation of monitors with the TG 18-QC test pattern is important and takes just a few minutes. QC records are essential. A quick review of the pattern should give the technologist an idea about any gross changes in system performance. For example, a change in contrast-detail “QUALITY CONTROL” letters may be indicative of a malfunctioning system; this may necessitate further testing by a medical physicist and the engineering staff.
Summary
Several national scientific organizations have published protocols that are based on electronic test patterns for assessing the quality of a digital display device. Assessment requires visual interpretation of a test pattern and photometric measurement of emitted light intensity and stray light intensity.
A spatial electronic display pattern should be used for the evaluation of various digital display characteristics. The TG 18-QC test pattern should be used regularly for overall display evaluation.
1. Define or otherwise identify the following:
2. Which TG 18 test pattern is used to evaluate diffuse reflection, and how does the pattern appear?
3. What type of device is used to evaluate diffuse reflection?
4. What are the time requirements on technologist QC of a digital display device?
5. Which TG 18 test pattern is used to evaluate digital display resolution, and how does the pattern appear?
6. What luminance range should be measurable?
7. What does Lamb represent, and what is its preferred value?
8. Which TG 18 test pattern is used to evaluate display noise, and how does it appear?
9. What is the principle of perceptual linearization?
10. When should a medical physicist perform digital display device quality control?
11. What TG 18 electronic test pattern is used to evaluate contrast resolution of a digital display device, and how does it appear?
12. What is threshold of visibility?
13. What are the standard descriptions for digital display devices?
15. Which TG 18 electronic test pattern is used for luminance uniformity assessment, and how does it appear?
The answers to the Challenge Questions can be found by logging on to our website at http://evolve.elsevier.com.