2 Excitation
The Cardiac Action Potential
1. Characterize the types of cardiac action potentials.
2. Define the ionic basis of the resting potential.
3. Define the ionic basis of cardiac action potentials.
4. Describe the characteristics of the fast- and slow-response action potentials.
Experiments on “animal electricity” conducted by Galvani and Volta two centuries ago led to the discovery that electrical phenomena were involved in the spontaneous contractions of the heart. In 1855 Kölliker and Müller observed that when the nerve of an innervated skeletal muscle preparation contacted the surface of a frog’s heart, the muscle twitched with each cardiac contraction.
The electrical events that normally occur in the heart initiate its contraction. Disorders in electrical activity can induce serious and sometimes lethal rhythm disturbances.
Cardiac Action Potentials Consist of Several Phases
The potential changes recorded from a typical ventricular muscle fiber are illustrated in Figure 2-1A: When two microelectrodes are placed in an electrolyte solution near a strip of quiescent cardiac muscle, no potential difference (time a) is measurable between the two electrodes. At point b, one microelectrode was inserted into the interior of a cardiac muscle fiber. Immediately the voltmeter recorded a potential difference (Vm) across the cell membrane; the potential of the cell interior was about 90 mV lower than that of the surrounding medium. Such electronegativity of the resting cell interior is also characteristic of skeletal and smooth muscles, nerves, and indeed most cells within the body.
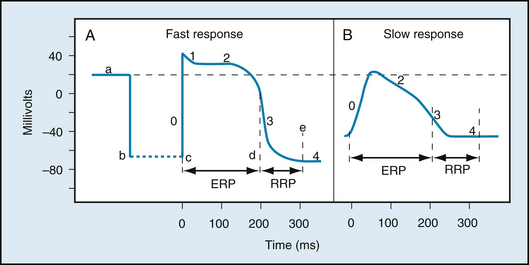
FIGURE 2-1 Changes in transmembrane potential recorded from fast-response (A) and slow-response (B) cardiac fibers in isolated cardiac tissue immersed in an electrolyte solution from phase 0 to phase 4. A, At time a, the microelectrode was in the solution surrounding the cardiac fiber. At time b the microelectrode entered the fiber. At time c an action potential was initiated in the impaled fiber. Time c to d represents the effective refractory period (ERP); time d to e represents the relative refractory period (RRP). B, An action potential recorded from a slow-response cardiac fiber. Note that in comparison with the fast-response fiber, the resting potential of the slow fiber is less negative, the upstroke (phase 0) of the action potential is less steep, and the amplitude of the action potential is smaller; also, phase 1 is absent, and the RRP extends well into phase 4, after the fiber has fully repolarized.
At point c, an electrical stimulus excited the ventricular cell. The cell membrane rapidly depolarized and the potential difference reversed (positive overshoot), such that the potential of the interior of the cell exceeded that of the exterior by about 20 mV. The rapid upstroke of the action potential is designated phase 0. Immediately after the upstroke, there was a brief period of partial repolarization (phase 1), followed by a plateau (phase 2) of sustained depolarization that persisted for about 0.1 to 0.2 seconds (s). The potential then became progressively more negative (phase 3), until the resting state of polarization was again attained (at point e). Repolarization (phase 3) is a much slower process than depolarization (phase 0). The interval from the end of repolarization until the beginning of the next action potential is designated phase 4.
The temporal relationship between the action potential and cell shortening is shown in Figure 2-2. Rapid depolarization (phase 0) precedes force development, repolarization is complete just before peak force is attained, and the duration of contraction is slightly longer than the duration of the action potential.
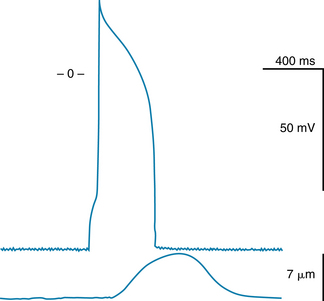
FIGURE 2-2 Temporal relationship between the changes in transmembrane potential and the cell shortening that occurs in a single ventricular myocyte.
(From Pappano A: Unpublished record, 1995.)
The Principal Types of Cardiac Action Potentials Are the Slow and Fast Types
Two main types of action potentials are observed in the heart, as shown in Figure 2-1. One type, the fast response, occurs in the ordinary atrial and ventricular myocytes and in the specialized conducting fibers (Purkinje fibers). The other type of action potential, the slow response, is found in the sinoatrial (SA) node, the natural pacemaker region of the heart, and in the atrioventricular (AV) node, the specialized tissue that conducts the cardiac impulse from atria to ventricles.
As shown in Figure 2-1, the membrane resting potential (phase 4) of the fast response is considerably more negative than that of the slow response. Also, the slope of the upstroke (phase 0), the action potential amplitude, and the overshoot of the fast response are greater than those of the slow response. The action potential amplitude and the steepness of the upstroke are important determinants of propagation velocity, as explained later. Hence, conduction velocity is much slower in slow-response fibers than in fast-response fibers. Slow conduction increases the likelihood of certain rhythm disturbances.
CLINICAL BOX
Fast responses may change to slow responses under certain pathological conditions. For example, in patients with coronary artery disease, when a region of cardiac muscle is deprived of its normal blood supply, the K+ concentration in the interstitial fluid that surrounds the affected muscle cells rises because K+ is lost from the inadequately perfused (ischemic) cells. The action potentials in some of these cells may then be converted from fast to slow responses (see Figure 2-18). An experimental conversion from a fast to a slow response through the addition of tetrodotoxin, which blocks fast Na+ channels in the cardiac cell membranes, is illustrated in Figure 2-3.
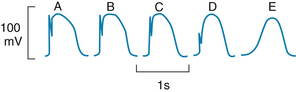
FIGURE 2-3 Effect of tetrodotoxin on the action potential recorded in a calf Purkinje fiber perfused with a solution containing epinephrine and 10.8 mM K+. The concentration of tetrodotoxin was 0 M in A, 3 × 10⁻⁸ M in B, 3 × 10⁻⁷ M in C, and 3 × 10⁻⁶ M in D and E; E was recorded later than D.
(Redrawn from Carmeliet E, Vereecke J: Adrenaline and the plateau phase of the cardiac action potential. Importance of Ca++, Na+ and K+ conductance. Pflügers Arch 313:300, 1969.)
The Ionic Basis of the Resting Potential
The various phases of the cardiac action potential are associated with changes in cell membrane permeability, mainly to Na+, K+, and Ca++. Changes in cell membrane permeability alter the rate of ion movement across the membrane. The membrane permeability to a given ion defines the net quantity of the ion that will diffuse across each unit area of the membrane per unit concentration difference across the membrane. Changes in permeability are accomplished by the opening and closing of ion channels that are specific for individual ions.
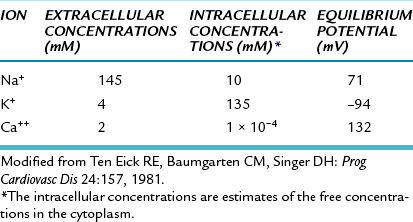
Just as with all other cells in the body, the concentration of K+ inside a cardiac muscle cell, [K+]i, greatly exceeds the concentration outside the cell, [K+]o, as shown in Figure 2-4. The reverse concentration gradient exists for free Na+ and for free Ca++ (not bound to protein). Estimates of the extracellular and intracellular concentrations of Na+, K+, and Ca++, and of the equilibrium potentials (defined later) for these ions, are compiled in Table 2-1.
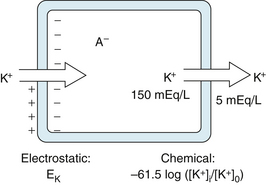
FIGURE 2-4 The balance of chemical and electrostatic forces acting on a resting cardiac cell membrane, based on a 30:1 ratio of the intracellular to extracellular K+ concentrations and the existence of a nondiffusible anion (A− inside but not outside the cell.)
TABLE 2-1 Intracellular and Extracellular Ion Concentrations and Equilibrium Potentials in Cardiac Muscle Cells
The resting cell membrane is relatively permeable to K+ but much less so to Na+ and Ca++. Hence K+ tends to diffuse from the inside to the outside of the cell, in the direction of the concentration gradient, as shown on the right side of the cell in Figure 2-4.
Any flux of K+ that occurs during phase 4 takes place through certain specific K+ channels. Several types of K+ channels exist in cardiac cell membranes. Some of these channels are controlled (i.e., opened and closed) by the transmembrane voltage, whereas others are controlled by some chemical signal (e.g., a neurotransmitter). The specific K+ channel through which K+ passes during phase 4 is a voltage-regulated channel called iK1, which is an inwardly rectifying K+ current, as explained later (Figure 2-5). Many of the anions (labeled A−) inside the cell, such as the proteins, are not free to diffuse out with the K+ (see Figure 2-4). Therefore, as the K+ diffuses out of the cell and the A− remains behind, the cation deficiency causes the interior of the cell to become electronegative.
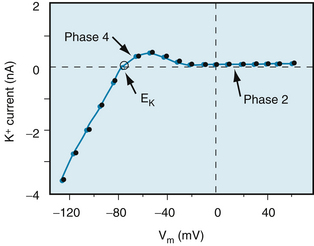
FIGURE 2-5 The K+ currents recorded from a rabbit ventricular myocyte when the potential was changed from a holding potential of −80 mV to various test potentials. Positive values along the vertical axis represent outward currents; negative values represent inward currents. The Vm coordinate of the point of intersection (open circle) of the curve with the X axis is the reversal potential; it denotes the Nernst equilibrium potential (EK) at which the chemical and electrostatic forces are equal.
(Redrawn from Giles WR, Imaizumi Y: Comparison of potassium currents in rabbit atrial and ventricular cells. J Physiol [Lond] 405:123, 1988.)
Therefore, two opposing forces regulate K+ movement across the cell membrane. A chemical force, based on the concentration gradient, results in the net outward diffusion of K+. The counterforce is electrostatic; the positively charged K ions are attracted to the interior of the cell by the negative potential that exists there, as shown on the left side of the cell in Figure 2-4. If the system comes into equilibrium, the chemical and electrostatic forces are equal.
This equilibrium is expressed by the Nernst equation for K+, as follows:
 (1)
(1)The term to the right of the equals sign represents chemical potential difference at the body temperature of 37° C. The term to the left, EK, called the potassium equilibrium potential, represents the electrostatic potential difference that would exist across the cell membrane if K+ were the only diffusible ion.
An experimental disturbance in the equilibrium between electrostatic and chemical forces imposed by voltage clamping would cause K+ to move through the K+ channels (see Figure 2-5). If the transmembrane potential (Vm) were clamped at a level negative to EK, the electrostatic force would exceed the diffusional force, and K+ would be attracted into the cell (i.e., the K+ current would be inward). Conversely, if Vm were clamped at a level positive to EK, the diffusional force would exceed the electrostatic force, and K+ would leave the cell (i.e., the K+ current would be outward).
When the measured concentrations of [K+]i and [K+]o for mammalian myocardial cells are substituted into the Nernst equation, the calculated value of EK equals about −94 mV (see Table 2-1). This value is close to, but slightly more negative than, the resting potential actually measured in myocardial cells. Therefore the electrostatic force is slightly weaker than the chemical (diffusional) force, and K+ tends to leave the resting cell.
The balance of forces acting on Na+ is entirely different from that acting on the K+ in resting cardiac cells. The intracellular Na+ concentration, [Na+]i, is much lower than the extracellular Na+ concentration, [Na+]o. At 37° C, the sodium equilibrium potential, ENa, expressed by the Nernst equation is as follows:
 (2)
(2)For cardiac cells, ENa is about 70 mV (see Table 2-1). Therefore at equilibrium a transmembrane potential of about +71 mV would be necessary to counterbalance the chemical potential for Na+. However, the actual voltage of the resting cell is just the opposite. The resting membrane potential of cardiac cells is about −90 mV (see Figure 2-1A). Hence both chemical and electrostatic forces favor entry of extracellular Na+ into the cell. The influx of Na+ through the cell membrane is small because the permeability of the resting membrane to Na+ is very low. Nevertheless, it is mainly this small inward current of Na+ that causes the potential of the resting cell membrane to be slightly less negative than the value predicted by the Nernst equation for K+.
The steady inward leak of Na+ would gradually depolarize the resting cell were it not for the metabolic pump that continuously extrudes Na+ from the cell interior and pumps in K+. The metabolic pump involves the enzyme Na+,K+-ATPase, which is located in the cell membrane. Pump operation requires the expenditure of metabolic energy because the pump moves Na+ against both a chemical gradient and an electrostatic gradient. Increases in [Na+]i or in [K+]o accelerate the activity of the pump. The quantity of Na+ extruded by the pump exceeds the quantity of K+ transferred into the cell by a 3:2 ratio. Therefore, the pump itself tends to create a potential difference across the cell membrane, and thus it is termed an electrogenic pump. If the pump is partially inhibited, as by digitalis, the resting membrane potential becomes less negative than normal.
The dependence of the transmembrane potential, Vm, on the intracellular and extracellular concentrations of K+ and Na+ and on the conductances (gK and gNa, respectively) of these ions is described by the chord conductance equation, as follows:
 (3)
(3)For a given ion (X), the conductance (gx) is defined as the ratio of the current (ix) carried by that ion to the difference between the Vm and the Nernst equilibrium potential (Ex) for that ion; that is,
 (4)
(4)The chord conductance equation reveals that the relative, not the absolute, conductances to Na+ and K+ determine the resting potential. In the resting cardiac cell, gK is about 100 times greater than gNa. Therefore the chord conductance equation reduces essentially to the Nernst equation for K+.
When the ratio [K+]o/[K+]i is increased experimentally by a rise in [K+]o, the measured value of Vm (Figure 2-6) approximates that predicted by the Nernst equation for K+. For extra-cellular K+ concentrations above 5 mM, the measured values correspond closely with the predicted values. The measured levels of Vm are slightly less negative than those predicted by the Nernst equation because of the small but finite value of gNa. For values of [K+]o below 5 mM, the effect of the Na+ gradient on the transmembrane potential becomes more important, as predicted by Equation 3. This increase in the relative importance of gNa accounts for the greater deviation of the measured Vm from that predicted by the Nernst equation for K+ at very low levels of [K+]o (see Figure 2-6).
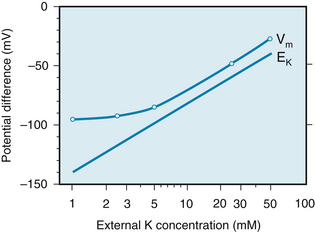
FIGURE 2-6 The transmembrane potential (Vm) of a cardiac muscle fiber varies inversely with the potassium (K) concentration of the external medium (curved line). The straight line represents the change in transmembrane potential predicted by the Nernst equation for EK.
(Redrawn from Page E: The electrical potential difference across the cell membrane of heart muscle. Biophysical considerations. Circulation 26:582, 1962.)
The Fast Response Depends Mainly on Voltage-Dependent Sodium Channels
Genesis of the Upstroke
Any process that abruptly depolarizes the resting membrane to a critical potential value (called the threshold) induces a propagated action potential. The characteristics of fast-response action potentials are shown in Figure 2-1A. The initial rapid depolarization (phase 0) is related almost exclusively to Na+ influx by virtue of a sudden increase in gNa. The action potential overshoot (the peak of the potential during phase 0) varies linearly with the logarithm of [Na+]o, as shown in Figure 2-7. When [Na+]o is reduced from its normal value of about 140 mM to about 20 mM, the cell is no longer excitable.
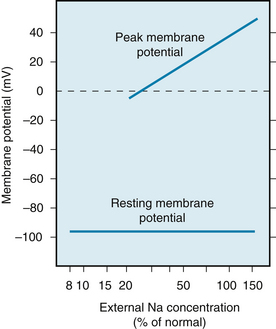
FIGURE 2-7 The concentration of sodium in the external medium is a critical determinant of the amplitude of the action potential in cardiac muscle (upper line) but has relatively little influence on the resting potential (lower line).
(Redrawn from Weidmann S: Elektrophysiologie der Herzmuskelfaser, Bern, 1956, Verlag Hans Huber.)
Specific voltage-dependent Na+ channels (often called fast Na+ channels) exist in the cell membrane. These channels can be blocked selectively by the puffer fish toxin tetrodotoxin (see Figure 2-3) and by local anesthetics. A voltage-gated Na+ channel is depicted in Figure 2-8; it contains an α subunit composed of four domains (I-IV) and two β subunits (only one is shown). Each domain has six transmembrane α-helical segments linked by external and internal peptide loops. Transmembrane segment 4 serves as a sensor whose conformation changes with applied voltage and is responsible for channel opening (activation). The intracellular loop that connects domains III and IV functions as the inactivation gate. After depolarization, this loop swings into the mouth of the channel to block ion conductance. The extracellular portions of the loops that connect helices 5 and 6 in each domain form the pore region and participate in the determination of ion selectivity. The Ca++ channels that form the basis of the slow response (see later) are similar in overall structure to Na+ channels but have a different ion selectivity.
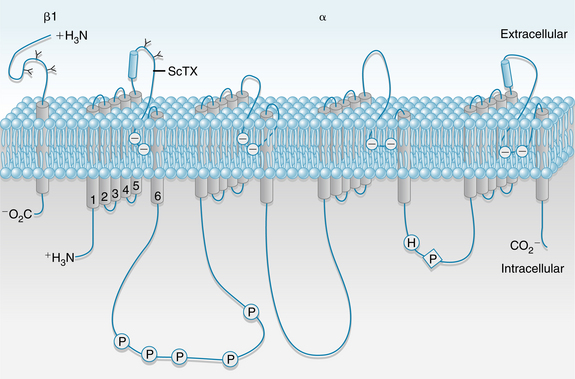
FIGURE 2-8 Schematic structure of a voltage-gated Na+ channel. The α subunit is composed of 4 domains (I-IV), each of which has 6 transmembrane helices; the N and C termini are cytoplasmic. Transmembrane segment 4 is a voltage sensor whose conformation changes with applied voltage. The 4 domains are arranged around a central pore lined by the extracellular loops of transmembrane segments 5 and 6. The β2 subunit is shown on the left. P, phosphorylation sites; ScTX, scorpion toxin binding site.
(Redrawn from Squire LR, Roberts JL, Spitzer NC, et al: Fundamental neuroscience, ed 2, San Diego, CA, Academic Press, 2002.)
The physical and chemical forces responsible for the transmembrane movements of Na+ are explained in Figure 2-9. The regulation of Na+ flux through the fast Na+ channels can be understood in terms of the “gate” concept. One of these gates, the m gate, tends to open as Vm becomes less negative than the threshold potential and is therefore called an activation gate. The other, the h gate, tends to close as Vm becomes less negative and hence is called an inactivation gate. The m and h designations were originally employed by Hodgkin and Huxley in their mathematical model of ionic currents in nerve fibers.
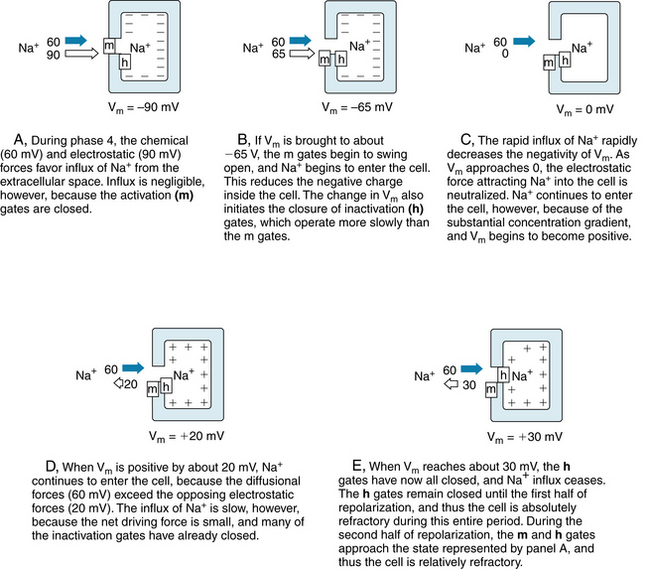
FIGURE 2-9 The gating of a sodium channel in a cardiac cell membrane during phase 4 (A) and during various stages of the action potential upstroke (B to E). The positions of the m and h gates in the fast Na+ channels are shown at the various levels of Vm. The electrostatic forces are represented by the white arrows, and the chemical (diffusional) forces by the dark arrows.
Panel A in Figure 2-9 represents the resting state (phase 4) of a cardiac myocyte. With the cell at rest, Vm is −90 mV and the m gates are closed while the h gates are wide open. The electrostatic force in Figure 2-9A is a potential difference of 90 mV, and it is represented by the white arrow. The chemical force, based on the difference in Na+ concentration between the outside and inside of the cell, is represented by the dark arrow. For an Na+ concentration difference of about 130 mM, a potential difference of 60 mV (inside more positive than the outside) is necessary to counterbalance the chemical, or diffusional, force, according to the Nernst equation for Na+ (Equation 2). Therefore we may represent the net chemical force favoring the inward movement of Na+ in Figure 2-9 (dark arrows) as equivalent to a potential of 60 mV. With the cell at rest, the total electrochemical force favoring the inward movement of Na+ is 150 mV (panel A). The m gates are closed, however, and the conductance of the resting cell membrane to Na+ is very low. Hence, the inward Na+ current is negligible.
Any process that makes Vm less negative tends to open the m gates and thereby activates the fast Na+ channels so that Na+ enters the cell (Figure 2-9B) via the chemical and electrostatic forces. Thus, activation of the fast channels is a voltage-dependent phenomenon. The precise potential at which the m gates swing open is called the threshold potential. The entry of Na+ into the interior of the cell neutralizes some of the negative charges inside the cell and thereby diminishes further the transmembrane potential, Vm (Figure 2-9B).
The rapid opening of the m gates in the fast Na+ channels is responsible for the large and abrupt increase in Na+ conductance, gNa, coincident with phase 0 of the action potential (see Figure 2-12). The rapid influx of Na+ accounts for the steep upstroke of Vm during phase 0. The maximal rate of change of Vm (dVm/dt) varies from 100 to 300 V/s in myocardial cells and from 500 to 1000 V/s in Purkinje fibers. The actual quantity of Na+ that enters the cell is so small and occurs in such a limited portion of the cell’s volume that the resulting change in the intracellular Na+ concentration cannot be measured precisely. The chemical force remains virtually constant, and only the electrostatic force changes throughout the action potential. Hence the lengths of the dark arrows in Figure 2-9 remain constant at 60 mV, whereas the white arrows change in magnitude and direction.
As Na+ enters the cardiac cell during phase 0, it neutralizes the negative charges inside the cell and Vm becomes less negative. When Vm becomes zero (Figure 2-9C), an electrostatic force no longer pulls Na+ into the cell. As long as the fast Na+ channels are open, however, Na+ continues to enter the cell because of the large concentration gradient. This continuation of the inward Na+ current causes the cell interior to become positively charged (Figure 2-9D). This reversal of the membrane polarity is the overshoot of the cardiac action potential. Such a reversal of the electrostatic gradient tends to repel the entry of Na+ (Figure 2-9D). However, as long as the inwardly directed chemical forces exceed these outwardly directed electrostatic forces, the net flux of Na+ is still inward, although the rate of influx is diminished.
The inward Na+ current finally ceases when the h (inactivation) gates close (Figure 2-9E). The opening of the m gates occurs very rapidly, in about 0.1 to 0.2 milliseconds [ms], whereas the closure of the h gates is slower, requiring 10 ms or more. Inactivation of the fast Na+ channels is completed when the h gates close. The h gates remain closed until the cell has partially repolarized during phase 3 (at about time d in Figure 2-1A). From time c to time d, the cell is in its effective refractory period and does not respond to excitation. This mechanism prevents a sustained, tetanic contraction of cardiac muscle that would interfere with the normal intermittent pumping action of the heart. A period of myocardial relaxation, sufficient to permit the cardiac ventricles to fill with venous blood during each cardiac cycle, is as essential to the normal pumping action of the heart as is a strong cardiac contraction.
About midway through phase 3 (time d in Figure 2-1A), the m and h gates in some of the fast Na+ channels resume the states shown in Figure 2-9A. Such channels are said to have recovered from inactivation. The cell can begin to respond again to excitation (Figure 2-10). Application of a suprathreshold stimulus to a region of normal myocardium during phase 3 evokes an action potential. As the stimulus is delivered progressively later during the course of phase 3, the slopes of the action potential upstrokes and the amplitudes of the evoked action potentials progressively increase. Throughout the remainder of phase 3, the cell completes its recovery from inactivation. By time e in Figure 2-1A, the h gates have reopened and the m gates have reclosed in the remaining fast Na+ channels, as shown in Figure 2-9A.
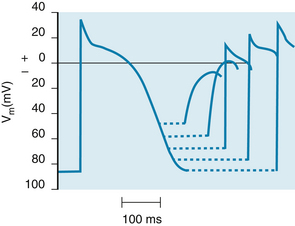
FIGURE 2-10 The changes in action potential amplitude and slope of the upstroke as action potentials are initiated at different stages of the relative refractory period of the preceding excitation.
(Redrawn from Rosen MR, Wit AL, Hoffman BF: Electrophysiology and pharmacology of cardiac arrhythmias. I. Cellular electrophysiology of the mammalian heart. Am Heart J 88:380, 1974.)
Statistical Characteristics of the “Gate” Concept
The patch-clamp technique has made it possible to measure ionic currents through single membrane channels. The individual channels open and close repeatedly in a random manner. This process is illustrated in Figure 2-11, which shows the current flow through single Na+ channels in a myocardial cell. To the left of the arrow, the membrane potential was clamped at −85 mV. At the arrow, the potential was suddenly changed to −45 mV, at which value it was held for the remainder of the record.
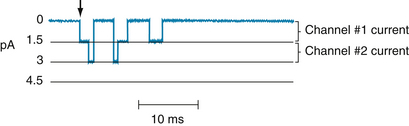
FIGURE 2-11 The current flow (in picoamperes) through two individual Na+ channels in a cultured cardiac cell, recorded by the patch-clamping technique. The membrane potential had been held at −85 mV but was suddenly changed to −45 mV at the arrow and held at this potential for the remainder of the record.
(Redrawn from Cachelin AB, DePeyer JE, Kokubun S, et al: Sodium channels in cultured cardiac cells. J Physiol 340:389, 1983.)
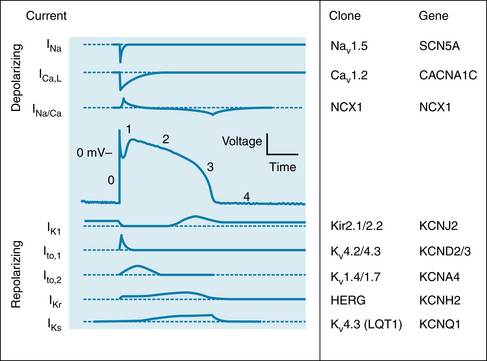
FIGURE 2-12 Changes in depolarizing (upper panels) and repolarizing ion currents during the various phases of the action potential in a fast-response cardiac ventricular cell. The inward currents include the fast Na+ and L-type Ca++ currents. Outward currents are IK1, Ito and the rapid (IKr) and slow (IKs) delayed rectifier K+ currents. The clones and respective genes for the principal ionic currents are also tabulated.
(Redrawn from Tomaselli G, Marbán E: Electrophysiological remodeling in hypertrophy and heart failure. Cardiovasc Res 42:270. 1999.)
Figure 2-11 indicates that immediately after the membrane potential was made less negative, one Na+ channel opened three times in sequence. It remained open for about 2 or 3 ms each time and closed for about 4 or 5 ms between openings. In the open state, it allowed 1.5 pA of current to pass. During the first and second openings of this channel, a second channel also opened, but for periods of only 1 ms. During the brief times that the two channels were open simultaneously, the total current was 3 pA. After the first channel closed for the third time, both channels remained closed for the rest of the recording, even though the membrane was held constant at −45 mV.
The overall change in ionic conductance of the entire cell membrane at any given time reflects the number of channels that are open at that time. Because the individual channels open and close randomly, the overall membrane conductance represents the statistical probability of the open or closed state of the individual channels. The temporal characteristics of the activation process then represent the time course of the increasing probability that the specific channels will be open, rather than the kinetic characteristics of the activation gates in the individual channels. Similarly, the temporal characteristics of inactivation reflect the time course of the decreasing probability that the channels will be open and not the kinetic characteristics of the inactivation gates in the individual channels.
Genesis of Early Repolarization
In many cardiac cells that have a prominent plateau, phase 1 constitutes an early, brief period of limited repolarization between the end of the action potential upstroke and the beginning of the plateau (Figure 2-12). Phase 1 reflects the activation of a transient outward current, ito, mostly carried by K+. Activation of these K+ channels leads to a brief efflux of K+ from the cell because the interior of the cell is positively charged and because the internal K+ concentration greatly exceeds the external concentration (see Table 2-1). This brief efflux of K+ brings about the brief, limited repolarization (phase 1).
Phase 1 is prominent in Purkinje fibers (see Figure 2-3) and in epicardial fibers from the ventricular myocardium (Figure 2-13); it is much less developed in endocardial fibers. When the basic cycle length at which the epicardial fibers are stimulated is increased from 300 to 2000 ms, phase 1 becomes more pronounced and the action potential duration is increased substantially. The same increase in basic cycle length has no effect on the early portion of the plateau in endocardial fibers, and it has a smaller effect on the action potential duration than it does in epicardial fibers (see Figure 2-13).
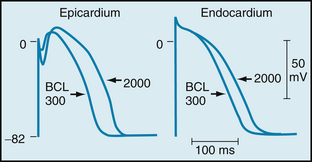
FIGURE 2-13 Action potentials recorded from canine epicardial and endocardial strips driven at basic cycle lengths (BCLs) of 300 and 2000 ms.
(From Litovsky SH, Antzelevitch C: Rate dependence of action potential duration and refractoriness in canine ventricular endocardium differs from that of epicardium: role of the transient outward current J Am Coll Cardiol 14:1053, 1989.)
Genesis of the Plateau
During the plateau (phase 2) of the action potential, Ca++ enters the cell through calcium channels that activate and inactivate much more slowly than do the fast Na+ channels. During phase 2 (see Figure 2-12), this influx of Ca++ is balanced by the efflux of an equal amount of K+. The K+ exits through various specific K+ channels, as described in the next section.
Ca++ Conductance during the Plateau
The Ca++ channels are voltage-regulated channels that are activated as Vm becomes progressively less negative during the upstroke of the action potential. Two types of Ca++ channels (L-type and T-type) have been identified in cardiac tissues. Some of their important characteristics are illustrated in Figure 2-14, which displays the Ca++ currents generated by voltage-clamping an isolated atrial myocyte. Note that when Vm is suddenly increased to +30 mV from a holding potential of −30 mV (lower panel), an inward Ca++ current (denoted by a downward deflection) is activated. After the inward current reaches maximum (in the downward direction), it returns toward zero very gradually (i.e., the channels inactivate very slowly). Thus, current that passes through these channels is long lasting, and they have been designated L-type channels. They are the predominant type of Ca++ channels in the heart, and they are activated during the action potential upstroke when Vm reaches about −30 mV. The L-type channels are blocked by Ca++ channel antagonists, such as verapamil, nifedipine, and diltiazem.
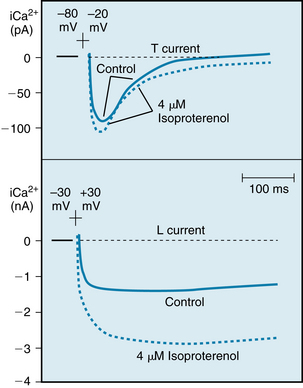
FIGURE 2-14 Effects of isoproterenol on the Ca++ currents conducted by T-type (upper panel) and L-type (lower panel) Ca++ channels in canine atrial myocytes. Upper panel, Potential changed from −80 to −20 mV; lower panel, potential changed from −30 to +30 mV.
(Redrawn from Bean BP: Two kinds of calcium channels in canine atrial cells. Differences in kinetics, selectivity, and pharmacology. J Gen Physiol 86:1, 1985.)
The T-type (transient) Ca++ channels are much less abundant in the heart. They are activated at more negative potentials (about −70 mV) than are the L-type channels. Note in Figure 2-14 (upper panel) that when Vm is suddenly increased to −20 mV from a holding potential of −80 mV, a Ca++ current is activated and then is inactivated very quickly.
Opening of the Ca++ channels is reflected by an increase in Ca++ current (ICa,L), that begins during the later phase of the upstroke of the action potential (Figure 2-15). When the Ca++ channels open, Ca++ enters the cell throughout the plateau because the intracellular Ca++ concentration is much less than the extracellular Ca++ concentration (see Table 2-1). The Ca++ that enters the myocardial cell during the plateau is involved in excitation-contraction coupling, as described in Chapter 4.
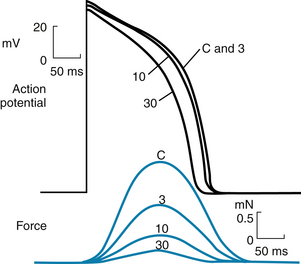
FIGURE 2-15 The effects of diltiazem, a Ca++ channel blocking drug, on the action potentials (in millivolts) and isometric contractile forces (in millinewtons) recorded from an isolated papillary muscle of a guinea pig. The tracings were recorded under control conditions (C) and in the presence of diltiazem, in concentrations of 3, 10, and 30 µmol/L.
(Redrawn from Hirth C, Borchard U, Hafner D: Effects of the calcium antagonist diltiazem on action potentials, slow response and force of contraction in different cardiac tissues. J Mol Cell Cardiol 15:799, 1983.)
Neurohumoral factors may influence gCa. An increase in gCa by catecholamines, such as isoproterenol and norepinephrine, is probably the principal mechanism by which catecholamines enhance cardiac muscle contractility. Catecholamines interact with β-adrenergic receptors located on cardiac cell membranes. This interaction stimulates the membrane-bound enzyme, adenylyl cyclase, which raises the intracellular concentration of cyclic AMP adenosine monophosphate) (see Figure 4-8). This change enhances the voltage-dependent activation of the L-type Ca++ channels in cell membrane (see Figure 2-14, lower panel) and thus augments Ca++ influx into the cells from the interstitial fluid. However, catecholamines have little effect on the Ca++ current through the T-type channels (see Figure 2-14, upper panel).
The Ca++ channel antagonists decrease gCa during the action potential. By reducing the amount of Ca++ that enters the myocardial cells during phase 2, these drugs diminish cardiac contractility and are negative inotropic agents (see Figure 2-15). These drugs also diminish the contraction of the vascular smooth muscle by suppressing Ca++ entry caused by depolarization or by neurotransmitters such as norepinephrine, and thereby induce arterial vasodilation. This effect reduces the counterforce (afterload) that opposes the propulsion of blood from the ventricles into the arterial system, as explained in Chapters 4 and 5. Hence vasodilator drugs, such as the Ca++ channel antagonists, are often referred to as afterload reducing drugs. This ability to diminish the counterforce enables the heart to provide a more adequate cardiac output, despite the direct depressant effect that these drugs exert on myocardial fibers.
K+ Conductance during the Plateau
During the plateau of the action potential, the concentration gradient for K+ between the inside and outside of the cell is virtually the same as it is during phase 4, but the Vm is positive. Therefore the chemical and electrostatic forces greatly favor the efflux of K+ from the cell during the plateau (see Figure 2-12). If gK1 were the same during the plateau as it is during phase 4, the efflux of K+ during phase 2 would greatly exceed the influx of Ca++, and a plateau could not be sustained. However, as Vm approaches and attains positive values near the end of phase 0, gK1 suddenly decreases as does IK1 (see Figure 2-12).
The changes in gK1 during the different phases of the action potential may be appreciated through an examination of the current-voltage relationship for the IK1 channels (the channels that mainly determine gK during phase 4). An example of this relationship in an isolated ventricular myocyte is shown in Figure 2-5. Note that the current-voltage curve intersects the voltage axis at a Vm of about −80 mV. The absence of ionic current flow at the intersection indicates that the electrostatic forces must have been equal to the chemical (diffusional) forces (see Figure 2-4) at this potential. Thus in this isolated ventricular cell, the Nernst equilibrium potential (EK) for K+ was −80 mV; in a myocyte in the intact ventricle, EK is normally about −95 mV.
When the membrane potential was clamped at levels negative to −80 mV in this isolated cell (see Figure 2-5), the electrostatic forces exceeded the chemical forces and an inward K+ current was induced (as denoted by the negative values of K+ current over this range of voltages). Note also that for Vm more negative than −80 mV, the curve has a steep slope. Thus when Vm equals or is negative to EK, a small change in Vm induces a substantial change in K+ current; that is, gK1 is large. During phase 4, the Vm of a myocardial cell is slightly less negative than EK (see Figure 2-6).
When the transmembrane potential of this isolated myocyte was clamped at levels less negative than −70 mV (see Figure 2-5), the chemical forces exceeded the electrostatic forces. Therefore the net K+ currents were outward (as denoted by the positive values along the corresponding section of the Y axis).
During phase 4 of the cardiac cycle, the driving force for K+ (the difference between Vm and EK) favored the efflux of K+, mainly through the iK1 channels. Note that for Vm values positive to −80 mV, the curve is relatively flat; this is especially pronounced for values of Vm positive to −40 mV. A given change in voltage causes only a small change in ionic current (i.e., gK1 is small). Thus gK1 is small for outwardly directed K+ currents but substantial for inwardly directed K+ currents; that is, the iK1 current is inwardly rectified. The rectification is most marked over the plateau (phase 2) range of transmembrane potentials (see Figures 2-5 and 2-12). This characteristic prevents excessive loss of K+ during the prolonged plateau, during which the electrostatic and chemical forces both favor the efflux of K+.
The delayed rectifier K+ channels, which conduct the iK current, are also activated at voltages that prevail toward the end of phase 0. However, activation proceeds very slowly, over several hundreds of milliseconds. Hence activation of these channels tends to increase IKr (see next section) slowly and slightly during phase 2. These channels play only a minor role during phase 2, but they do contribute to repolarization (phase 3), as described in the next section. The action potential plateau persists as long as the efflux of charge carried by certain cations (mainly K+) is balanced by the influx of charge carried by other cations (mainly Ca++). The effects of altering this balance are demonstrated by administration of diltiazem, a calcium channel antagonist. Figure 2-15 shows that with increasing concentrations of diltiazem, the plateau voltage becomes less positive and the duration of the plateau diminishes. Similarly, administration of certain K+ channel antagonists prolongs the action potential substantially.
Genesis of Final Repolarization
The process of final repolarization (phase 3) starts at the end of phase 2, when the efflux of K+ from the cardiac cell begins to exceed the influx of Ca++. At least four outward K+ currents (Ito, IKr, IKs, and IK1) contribute to the rapid repolarization (phase 3) of the cardiac cell (see Figure 2-12).
The transient outward current (Ito) not only accounts for the brief, partial repolarization (phase 1), as previously described, but also helps determine the duration of the plateau; hence it also helps initiate repolarization. For example, the transient outward current is much more pronounced in atrial than in ventricular myocytes. In atrial cells, therefore, the outward K+ current exceeds the inward Ca++ current early in the plateau, whereas the outward and inward currents remain equal for a much longer time in ventricular myocytes. Hence the plateau of the action potential is much less pronounced in atrial than in ventricular myocytes (Figure 2-16).
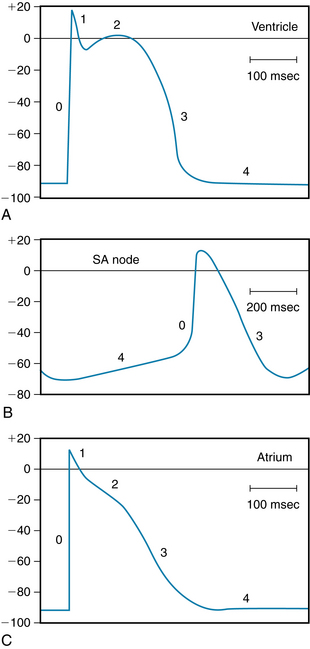
FIGURE 2-16 Typical action potentials (in millivolts) recorded from cells in the ventricle (A), sinoatrial (SA) node (B), and atrium (C). Note that the time calibration in B differs from that in A and C.
(From Hoffman BF, Cranefield PF: Electrophysiology of the heart, New York, McGraw-Hill, 1960.)
The delayed rectifier K+ currents (IKr and IKs) are activated near the end of phase 0, but activation is very slow. Therefore these outward IK currents tend to increase gradually throughout the plateau. Concurrently, the Ca++ channels are inactivated after the beginning of the plateau, and therefore the inward Ca++ current decreases. As the efflux of K+ begins to exceed the influx of Ca++, Vm becomes progressively less positive, and repolarization occurs. Two types of delayed rectifier K+ currents, IK, are present in cardiac myocytes. The distinction is based mainly on the speed of activation. The currents that activate more rapidly are designated IKr, whereas the currents that are activated more slowly are designated IKs. The action potentials recorded from myocytes in the endocardial, central, and epicardial regions of the left ventricle differ substantially in duration. Figure 2-13 illustrates some of the differences that prevail in the epicardial and endocardial layers of the ventricle. Such differences are induced, at least in part, by differences in the distributions of these two types of delayed rectifying IK channels.
The inwardly rectified K+ current (iK1) contributes substantially to the later repolarization phase. As the net efflux of cations causes Vm to become more negative during phase 3, the conductance of the channels that carry the iK1 current progressively increases. This increase is reflected by the hump that is evident in the flat portion of the current-voltage curve at Vm values between −20 and −80 mV in Figure 2-5. Thus as Vm passes through this range of values less negative than EK, the outward K+ current increases and thereby accelerates repolarization.
Restoration of Ionic Concentrations
The excess Na+ that entered the cell rapidly during phase 0 and more slowly throughout the action potential is removed from the cell by the action of the enzyme Na+,K+-ATPase. This enzyme ejects Na+ in exchange for the K+ that had exited mainly during phases 2 and 3.
Similarly, most of the excess Ca++ that had entered the cell during phase 2 is eliminated by a Na+/Ca++ antiporter, which exchanges 3 Na+ for 1 Ca++. However, a small fraction of the Ca++ is eliminated by an adenosine triphosphate (ATP)–driven Ca++ pump (see Figure 4-8).
CLINICAL BOX
The cardiac action potential is generated by the interplay among ionic channels whose currents are produced at appropriate times and voltages (see Figure 2-12). Long QT syndrome (LQTS) is a condition that can lead to cardiac arrhythmias. LQTS can be detected by a prolonged QT interval on an electrocardiogram. Molecular genetic studies show that mutations in genes encoding cardiac ion channels are linked to congenital LQTS. Mutations in KCNQ1, KCNH2, and SCN5A account for most of the inherited forms of LQTS. Mutations in these genes alter the function of the corresponding cardiac ion channel proteins (Kv4.3, hERG, and Nav1.5). Thus, loss-of-function mutation of the KCNQ1 gene alters the KVLQT1 protein in the Ks channel, resulting in the LQT1 syndrome. A gain-of-function mutation of the SCN5A gene that produces the Nav 1.5 protein for the fast Na+ channel underlies the LQT3 syndrome. Animal and stem cell models of LQTS based on hERG channel mutations show reduced ionic currents, prolonged action potentials, and early afterdepolarizations. Inherited LQTS is relatively rare, but there is an acquired form of LQTS that is quite common. Acquired LQTS is due to the blockade of hERG potassium channels by drugs.
Ionic Basis of the Slow Response
Fast-response action potentials (see Figure 2-1A) may be considered to consist of four principal components: an upstroke (phase 0), an early repolarization (phase 1), a plateau (phase 2), and a period of final repolarization (phase 3). In the slow response (see Figure 2-1,B), phase 0 is much less steep, phase 1 is absent, phase 2 is brief and not flat, and phase 3 is not separated very distinctly from phase 2. In the fast response, the upstroke is produced by the influx of Na+ through the fast channels (see Figure 2-12).
When the fast Na+ channels are blocked, slow responses may be generated in the same fibers under appropriate conditions. The Purkinje fiber action potentials shown in Figure 2-3 clearly exhibit the two response types. In the control tracing (panel A), a prominent notch (phase 1) separates the upstroke from the plateau. Action potential A in Figure 2-3 is a typical fast-response action potential. In action potentials in panels B to E, progressively larger quantities of tetrodotoxin were added to the bathing solution to gradually block the fast Na+ channels. The sharp upstroke becomes progressively less prominent in action potentials in panels B to D, and it disappears entirely in panel E. Thus, tetrodotoxin had a pronounced effect on the steep upstroke and only a negligible influence on the plateau. With elimination of the steep upstroke (panel E), the action potential resembles a typical slow response.
Certain cells in the heart, notably those in the SA and AV nodes, are normally slow-response fibers. In such fibers, depolarization is achieved by the inward current of Ca++ through the Ca++ channels. These ionic events closely resemble those that occur during the plateau of fast-response action potentials.
Conduction in Cardiac Fibers Depends on Local Circuit Currents
The propagation of an action potential in a cardiac muscle fiber by local circuit currents is similar to the process that occurs in nerve and skeletal muscle fibers. In Figure 2-17, consider that the left half of the cardiac fiber has already been depolarized, whereas the right half is still in the resting state. The fluids normally in contact with the external and internal surfaces of the membrane are electrolyte solutions and are good electrical conductors. Hence current (in the abstract sense) flows from regions of higher potential to those of lower potential, denoted by the plus and minus signs, respectively. In the external fluid, current flows from right to left between the active and resting zones, and it flows in the reverse direction intracellularly. In electrolyte solutions, current is caused by a movement of cations in one direction and anions in the opposite direction. At the cell exterior, for example, cations flow from right to left, and anions from left to right (Figure 2-17). In the cell interior, the opposite migrations occur. These local currents tend to depolarize the region of the resting fibers adjacent to the border. Repetition of this process causes propagation of the excitation wave along the length of the cardiac fiber.
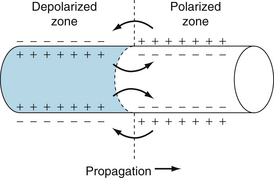
FIGURE 2-17 The role of local currents in the propagation of a wave of excitation down a cardiac fiber.
For propagation of the impulse from one cell to another, consider the left half of Figure 2-17 a depolarized cell and the right half a cell in the resting state. When the wave of depolarization reaches the end of the cell, the impulse is conducted to adjacent cells through gap junctions or nexuses (see Figures 4-2 and 4-3). Gap junctions are preferentially located at the ends of the cell and are rather sparse along lateral cell borders. Therefore, impulses pass more readily longitudinally (isotropic) than laterally from cell to cell (anisotropic). Gap junction channels are composed of proteins called connexins that form electrical connections between cells. Connexins vary in their composition and in their tissue distribution within the heart. Each cell synthesizes a hemichannel consisting of six connexons arranged like barrel staves. The hemichannel is transported to the gap junction locus on the cell membrane, where it docks with a hemichannel from an adjacent cell to form an ion channel. These channels are rather nonselective in their permeability to ions and have a low electrical resistance that allows ionic current to pass from one cell to another. The electrical resistance of gap junctions is similar to that of cytoplasm. The flow of charge from cell to cell follows the principles of local circuit currents and therefore allows intercellular propagation of the impulse.
Conduction of the Fast Response
In the fast response, the fast Na+ channels are activated when the transmembrane potential is suddenly brought from a resting value of about −90 mV to the threshold value of about −70 mV. The inward Na+ current then depolarizes the cell very rapidly at that site. This portion of the fiber becomes part of the depolarized zone, and the border is displaced accordingly (to the right in Figure 2-17). The same process then begins at the new border.
At any given point on the fiber, the greater the amplitude and the greater the rate of change of potential (dVm/dt) of the action potential during phase 0, the more rapid is the conduction down the fiber. The amplitude of the action potential equals the difference in potential between the fully depolarized and the fully polarized regions of the cell interior (see Figure 2-17). The magnitude of the local currents is proportional to this potential difference. Because these local currents shift the potential of the resting zone toward the threshold value, they are the local stimuli that depolarize the adjacent resting portion of the fiber to its threshold potential. The greater the potential difference between the depolarized and polarized regions (i.e., the greater the amplitude of the action potential), the more efficacious are the local stimuli, and the more rapidly the wave of depolarization is propagated down the fiber.
The rate of change of potential (dVm/dt) during phase 0 is also an important determinant of the conduction velocity. The reason can be appreciated by referring again to Figure 2-17. If the active portion of the fiber depolarized very gradually, the local currents across the border between the depolarized and polarized regions would be very small. Thus the resting region adjacent to the active zone would be depolarized very slowly, and consequently each new section of the fiber would require more time to reach threshold.
The level of the resting membrane potential is also an important determinant of conduction velocity. This factor operates through its influence on the amplitude and maximal slope of the action potential. The resting potential may vary for several reasons: (1) it can be altered experimentally through varying of [K+]o (see Figure 2-6); (2) in cardiac fibers that are intrinsically automatic, Vm becomes progressively less negative during phase 4 (see Figure 2-16B); and (3) during a premature excitation, repolarization may not have been completed when the next excitation arrives (see Figure 2-10). In general, the less negative the level of Vm, the less is the velocity of impulse propagation, regardless of the reason for the change in Vm.
The results of an experiment in which the resting Vm of a bundle of Purkinje fibers was varied by altering the value of [K+]o are shown in Figure 2-18. When [K+]o was 3 mM (panels A and F), the resting Vm was −82 mV and the slope of phase 0 was steep. At the end of phase 0, the overshoot attained a value of 30 mV. Hence the amplitude of the action potential was 112 mV. When [K+]o was increased gradually to 16 mM (panels B to E), the resting Vm became progressively less negative. Concomitantly, the amplitudes and durations of the action potentials and the steepness of the upstrokes all diminished. As a consequence, the conduction velocity diminished progressively, as indicated by the distances from the stimulus artifacts to the upstrokes. At the [K+]o levels of 14 and 16 mM (panels D and E), the resting Vm had attained levels sufficient to inactivate all the fast Na+ channels. The action potentials in panels D and E are characteristic slow responses, mediated by the inward Ca++ current. When the [K+]o concentration of 3 mM was reestablished (panel F), the action potential was again characteristic of the normal fast response (as in panel A).
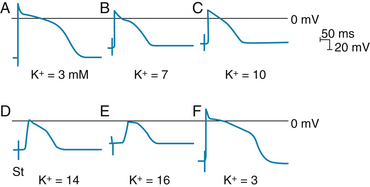
FIGURE 2-18 The effect of changes in external potassium (K+) concentration on the transmembrane action potentials recorded from a Purkinje fiber. The fiber bundle was stimulated at some distance from the impaled cell, and the stimulus artifact (St) appears as a biphasic spike to the left of the upstroke of the action potential. The time from this artifact to the beginning of phase 0 is inversely proportional to the conduction velocity. The horizontal lines near the peaks of the action potentials denote 0 mV.
(From Myerburg RJ, Lazzara R. In Fisch E, editor: Complex electrocardiography, Philadelphia, 1973, FA Davis.)
CLINICAL BOX
Most of the experimentally induced changes in transmembrane potential shown in Figure 2-18 also take place in patients with coronary artery disease. When blood flow to a region of the myocardium is diminished, the supply of oxygen and metabolic substrates delivered to the ischemic tissues is insufficient. The Na+,K+-ATPase in the membrane of the cardiac myocytes requires considerable metabolic energy to maintain the normal transmembrane exchanges of Na+ and K+. When blood flow is inadequate, the activity of the Na+,K+-ATPase is impaired, and the ischemic myocytes gain excess Na+ and lose K+ to the surrounding interstitial space. Consequently, the K+ concentration in the extracellular fluid surrounding the ischemic myocytes is elevated, and therefore the myocytes are affected by the elevated K+ concentration in much the same way as was the myocyte depicted in Figure 2-18. Such changes may lead to serious aberrations of cardiac rhythm and conduction.
Conduction of the Slow Response
Local circuits (see Figure 2-17) are also responsible for propagation of the slow response. However, the characteristics of the conduction process differ quantitatively from those of the fast response. The threshold potential is about −40 mV for the slow response, and conduction is much slower than for the fast response. The conduction velocities of the slow responses in the SA and AV nodes are about 0.02 to 0.1 m/s. The fast-response conduction velocities are about 0.3 to 1 m/s for myocardial cells and 1 to 4 m/s for the specialized conducting fibers in the atria and ventricles. Conduction in slow-response fibers is more likely to be blocked than conduction in fast-response fibers. Also, impulses in slow-response fibers cannot be conducted at such rapid repetition rates.
Cardiac Excitability Depends on the Activation and Inactivation of Specific Currents
Detailed knowledge of cardiac excitability is essential because of the rapid development of artificial pacemakers and other electrical devices for correcting serious disturbances of rhythm. The excitability characteristics of cardiac cells differ considerably, depending on whether the action potentials are fast or slow responses.
Fast Response
Once the fast response has been initiated, the depolarized cell is no longer excitable until about the middle of the period of final repolarization (see Figures 2-1A, 2-10). The interval from the beginning of the action potential until the fiber is able to conduct another action potential is called the effective refractory period. In the fast response, this period extends from the beginning of phase 0 to a point in phase 3 when repolarization has reached about −50 mV (time c to time d in Figure 2-1A). At about this value of Vm, some fast channels have recovered sufficiently from inactivation to permit a feeble response to stimulation.
Full excitability is not regained until the cardiac fiber has been fully repolarized (time e in Figure 2-1A). During period d to e in the figure, an action potential may be evoked, but only when the stimulus is stronger than one that could elicit a response during phase 4. Period d to e is called the relative refractory period.
When a fast response is evoked during the relative refractory period of a previous excitation, its characteristics vary with the membrane potential that exists at the time of stimulation. The nature of this voltage dependency is illustrated in Figure 2-10. As the fiber is stimulated later and later in the relative refractory period, the amplitude of the response and the rate of rise of the upstroke increase progressively. As a consequence of the greater amplitude and upstroke slope of the evoked response, the propagation velocity increases as the cell is stimulated later in the relative refractory period. Once the fiber is fully repolarized, the response is constant no matter what time in phase 4 the stimulus is applied. By the end of phase 3, the fast Na+ channels recover fully from inactivation after several milliseconds in fully repolarized cells. This reflects the fact that recovery from inactivation depends on time as well as voltage.
Slow Response
The relative refractory period during the slow response extends well beyond phase 3 (see Figure 2-1B). Even after the cell has completely repolarized, it may be difficult to evoke a propagated response for some time. This characteristic, called postrepolarization refractoriness, arises from the long time constant for recovery from inactivation.
Action potentials evoked early in the relative refractory period are small, and the upstrokes are not very steep (Figure 2-19). The amplitudes and upstroke slopes gradually increase as action potentials are elicited later and later in the relative refractory period. The recovery of full excitability is much slower than for the fast response. Impulses that arrive early in the relative refractory period are conducted much more slowly than those that arrive late in that period. The lengthy refractory periods also lead to conduction blocks. Even when slow responses recur at a low repetition rate, the fiber may be able to conduct only a fraction of those impulses.
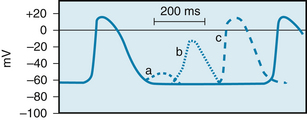
FIGURE 2-19 The effects of excitation at various times after the initiation of an action potential in a slow-response fiber. In this fiber, excitation very late in phase 3 (or early in phase 4) induces a small, nonpropagated (local) response (a). Later in phase 4, a propagated response (b) may be elicited; its amplitude is small and the upstroke is not very steep. This response, which displays postrepolarization refractoriness, is conducted very slowly. Still later in phase 4, full excitability is regained, and the response (c) displays its normal characteristics.
(Modified from Singer DH, Baumgarten CM, Ten Eick RE: Cellular electrophysiology of ventricular and other dysrhythmias: studies on diseased and ischemic heart. Prog Cardiovasc Dis 24:97, 1981.)
Effects of Cycle Length
Changes in cycle length alter the action potential duration of cardiac cells and thus change their refractory periods. Consequently, the changes in cycle length are important factors in the initiation or termination of certain dysrhythmias. Changes in action potential durations produced by stepwise reductions in cycle length from 2000 to 200 ms in a Purkinje fiber are shown in Figure 2-20. Note that as the cycle length is diminished, the action potential duration decreases.

FIGURE 2-20 The effect of changes in cycle length (CL) on the action potential duration (APD) of canine Purkinje fibers.
(Modified from Singer D, Ten Eick RE: Aberrancy: electrophysiologic aspects. Am J Cardiol 28:381, 1971.)
This direct correlation between action potential duration and cycle length is ascribable mainly to changes in gK that involve the delayed rectifier K+ channels. The iKr current activates slowly, remains activated for hundreds of milliseconds before inactivation, and is inactivated very slowly. Consequently, as the basic cycle length is diminished, each action potential tends to occur earlier in the inactivation period of the iKr current initiated by the preceding action potential. Therefore, the shorter the basic cycle length, the greater the outward K+ current will be during phase 2. Hence the action potential duration diminishes.
Summary
 The transmembrane action potentials that can be recorded from cardiac myocytes comprise the following five phases (0 to 4):
Phase 0, upstroke. A suprathreshold stimulus rapidly depolarizes the membrane by activating the fast Na+ channels. Phase 1, early partial repolarization. Achieved by the efflux of K+ through channels that conduct the transient outward current, Ito. Phase 2, plateau. Achieved by a balance between the influx of Ca++ through Ca++ channels and the efflux of K+ through several types of K+ channels. Phase 3, final repolarization. Initiated when the efflux of K+ exceeds the influx of Ca++. The resulting partial repolarization rapidly increases the K+ conductance and rapidly restores full repolarization. Phase 4, resting potential. The transmembrane potential of the fully repolarized cell is determined mainly by the conductance of the cell membrane to K+. Two principal types of action potentials may be recorded from cardiac cells:
Fast-response action potentials may be recorded from atrial and ventricular myocardial fibers and from specialized conducting (Purkinje) fibers. The action potential is characterized by a large-amplitude, steep upstroke, which is produced by the activation of the fast Na+ channels. The effective refractory period begins at the upstroke of the action potential and persists until about midway through phase 3.
Slow-response action potentials may be recorded from normal sinoatrial (SA) and atrioventricular (AV) nodal cells and from abnormal myocardial cells that have been partially depolarized. The action potential is characterized by a less negative resting potential, a smaller amplitude, and a less steep upstroke than is the fast-response action potential. The upstroke is produced by the activation of Ca++ channel.
Carmeliet E. Cardiac ionic currents and acute ischemia: from channels to arrhythmias. Physiol Rev. 1999;79:917.
Grant A.O. Cardiac Ion Channels. Circ Arrhythmia Electrophysiol. 2009;2:185.
Noble D. Modeling the heart–from genes to cells to the whole organ. Science. 2002;295:1678.
Priori S.G. The fifteen years of discoveries that shaped molecular electrophysiology: time for appraisal. Circ Res. 2010;107:451.
Sanguinetti M.C. HERG1 channelopathies. Pflügers Arch.. 2010;460:265.
ten Tusscher K.H., Noble D., Noble P.J., Panfilov A.V. A model for human ventricular tissue. Am J Physiol. 2004;286:H1573.
Zipes D.P., Jalife J. Cardiac electrophysiology: from cell to bedside, ed 4. Philadelphia: WB Saunders; 2004.
CASE 2-1
History
A 63-year-old man suddenly felt a crushing pain beneath his sternum. He became weak, he was sweating profusely, and he noticed his heart was beating rapidly. He called his physician, who made the diagnosis of myocardial infarction. The tests made at the hospital confirmed his doctor’s suspicion that the patient had suffered a “heart attack”; that is, a major coronary artery to the left ventricle had suddenly become occluded. An electrocardiogram indicated that the SA node was the source of the rapid heart rate. Two hours after admission to the hospital, the patient suddenly became much weaker. His arterial pulse rate was only about 40 beats/min. An electrocardiogram at this time revealed that the atrial rate was about 90 beats/min and that conduction through the AV junction was completely blocked, undoubtedly because the infarct affected the AV conduction system. Electrodes of an artificial pacemaker were inserted into the patient’s right ventricle, and the ventricle was paced at a frequency of 75 beats/min. The patient felt stronger and more comfortable almost immediately.
Questions
1. Soon after coronary artery occlusion, the interstitial fluid K+ concentration rose substantially in the flow-deprived region. In this region, the high extracellular K+ concentration:
2. The attending physician was alerted to the possibility of an arrhythmia because the high extracellular K+ concentration could:
3. The most likely mechanism responsible for the patient’s arterial pulse rate of about 40 beats/min after impulse conduction through the AV junction was blocked is:
4. While the heart was being paced, the cardiologist discontinued ventricular pacing periodically to test the patient’s cardiac status. The cardiologist found that the ventricles did not begin beating spontaneously until about 5 to 10 s after cessation of pacing, because the preceding period of pacing led to: