Tammy Hoffmann, Marilyn Baird, John W Bennett, Mal Boyle, Jeff Coombes, Mark R Elkins, Lisa Nissen, Sheena Reilly, Claire Rickard and Sharon Sanders
This chapter is an accompaniment to the previous chapter (Chapter 8) where the steps involved in answering a clinical question about prognosis were explained. In order to further help you learn how to deal with prognostic clinical questions when they arise and appraise the evidence, this chapter contains a number of worked examples of questions about prognosis from a range of health professions. The worked examples in this chapter follow the same format as the examples in Chapter 5. In addition, as with the worked examples that were written for Chapter 5, the authors of the worked examples in this chapter were asked not to choose a systematic review (for the reason that was explained in Chapter 5), but instead to find the next best available level of evidence to answer the prognostic question that was generated from the clinical scenario.
Clinical scenario
You are an occupational therapist who has recently rotated into the outpatient department of a brain injury rehabilitation unit. After patients are discharged as inpatients and return home to live, they return to the hospital to receive outpatient therapy. One of your patients is Mary, a 21-year-old who sustained a mild traumatic brain injury in a motor vehicle accident 8 weeks ago. Her Glasgow Coma Scale was 14 on admission to hospital. Prior to the accident Mary worked full-time as an apprentice chef. She has been working in this job for 2 years and started after finishing high school. After discharge from hospital, Mary returned home to live with her parents and has been able to do simple tasks around the home and shopping with assistance from her mother.
Your initial outpatient assessment of Mary revealed that her current difficulties are poor endurance, poor memory and planning problems. Mary is already 2 months post-injury and her employer has just advised her that he is only able to keep her position in the apprenticeship scheme reserved for her for another 4 months. Mary has asked you how likely it is that she will be able to return to her job within that timeframe. As you are new to working in this area of clinical practice, you decide to search the literature to help you answer this question.
In adults with mild traumatic brain injury, what is the likelihood of returning to work within 6 months of the injury occurring?
Search terms and databases used to find the evidence
Database: PubMed—Clinical Queries (with ‘prognosis category’ and ‘narrow scope’ selected).
Search terms: (mild traumatic brain injury) AND (return to work*)
This search retrieves 10 results. After reading through the titles and abstracts of these articles, three appear to be relevant to your clinical question. One is primarily focused on the application of a particular outcome measure. Of the other two, you choose the article with the largest sample size and obtain its full text so that you can do a critical appraisal.
Stulemeijer M, van der Werf S, Borm G, et al. Early prediction of favourable recovery 6 months after mild traumatic brain injury. J Neurol Neurosurg Psychiatry 2008;79:936–42.
Structured abstract*
Study design: Prospective cohort study.
Setting: Level 1 trauma centre of a university medical centre in The Netherlands.
Participants: 452 patients with mild traumatic brain injury who were admitted to the emergency department and aged between 18 and 60 years (mean age 35.6 years, 78% female) were sent a questionnaire to complete (the 6-month questionnaire was returned by 201 patients). Other eligibility criteria were: able to speak and write in Dutch and did not have premorbid mental retardation or dementia.
Outcomes: Postconcussional symptoms (measured using Rivermead Post-Concussion Questionnaire) and return to work (without any negative change in work situation because of the injury).
Prognostic factors studied: Pre-injury (age, gender, education, premorbid emotional problems, physical comorbidities and prior head injury); peri-injury (Glasgow Coma Scale score; presence and duration of loss of consciousness; post-traumatic amnesia duration; brain computed tomography characteristics; dizziness, nausea/vomiting or headache in the emergency department; additional extracranial injuries); and early post-injury (postconcussional symptoms, post-traumatic stress, fatigue, pain and self-efficacy).
Follow-up period: 6 months (mean = 6.5 months, range 5.5 to 10 months).
Main results: At follow-up, 153 (76%) of the participating patients reported full return to work and 64% reported full recovery. Patients with more than 11 years of education, without nausea or vomiting on admission, with no additional extracranial injuries and only low levels of pain early after injury had a 90% chance of full return to work.
Conclusion: Early identification of patients with mild traumatic brain injury who are likely to have good 6-month recovery was feasible based on relatively simple prognostic models.
Is the evidence likely to be biased?
• Was there a representative and well-defined sample?
Yes. There was a reasonably well-defined population and representative sampling. The article states that consecutive patients who were admitted to the trauma centre with a mild traumatic brain injury were eligible to participate in the study. A definition of what was considered a mild traumatic brain injury is provided. There were only a few inclusion criteria (between 18 and 60 years of age, able to speak and write in Dutch and no premorbid intellectual disability or dementia), although it is not detailed how these latter criteria were assessed. No specific exclusion criteria are provided. The exclusion of people who could not read or write may limit the generalisability of the study results.
• Was there an inception cohort?
Yes. Participants were recruited at a similar well-described point, namely after they were admitted to hospital after the traumatic brain injury occurred.
• Was exposure determined accurately?
Yes. In this study, it would have been very unlikely that an error was made in recruiting participants who had suffered a mild traumatic brain injury as a result of a motor vehicle accident, as this exposure (or in this case, eligibility criteria) can be easily determined. The authors also explain how the severity of participants' traumatic brain injury was determined (mild traumatic brain injury was defined as having a Glasgow Coma Scale admission score of 13–15, with or without a loss of consciousness of less than 30 minutes and with or without post-traumatic amnesia).
• Were the outcomes measured accurately?
Yes. The outcomes were postconcussional symptoms and return to work. Postconcussional symptoms were measured using the Rivermead Post-Concussion Questionnaire and the definition of a ‘favourable’ outcome using this measure is provided. Return to work status: participants were considered to have full return to work when they were not on sick leave at the time of follow-up or reported no change in working status (such as to part-time or a lower level) because of their injury. There are no details provided about what is meant by a lower level of working status and whether this included modified duties, which have been useful to know about.
Participants provided the outcome measure information in a self-completed questionnaire at 6 months after recruitment to the study. It was not possible to measure outcomes in a blind fashion, as it was based on participant self-report. It was not possible to blind outcome assessors about participants' status on the prognostic factors, as the measures were based on participant self-report where the participant was technically the outcome assessor.
• Were important prognostic factors considered?
Yes. The authors appear to have identified the major factors that could influence return to work. The study examined three main categories of possible prognostic factors (refer to the structured abstract).
• Was the follow-up of participants sufficiently long and complete?
No, not sufficiently complete. The study identified 529 patients who met the inclusion criteria and of these, 452 were sent the early questionnaire (with most of the 77 missed due to logistical reasons). Complete questionnaires were returned by 280 patients and the follow-up questionnaire returned by 201 patients (which is 44% of those who were sent the early questionnaire and 72% of those who completed the first questionnaire). Compared with the total cohort, the group of participants that completed the follow-up questionnaire contained fewer men and were younger (mean difference of 2.6 years). With regards to length, the mean length of follow-up time was 6.5 months (range 5.5 to 10 months), which matches our clinical question. However, many studies that look at return to work after head injury follow participants for 12 months. Although only participants with mild traumatic brain injury were included in this study, they may have experienced impairments (physical, psychological and/or cognitive impairments) that could continue to have impacts on their ability to return to work beyond this amount of time post-injury.
Return to work: Of the 201 participants who were able to be followed up, 153 (76%) reported full return to work by the time of the follow-up assessment. You calculate the 95% confidence interval (CI) to be 71% to 81% (using the formula that was provided in Chapter 8, where 95% CI = risk ± [1 ÷ ]). In other words, the likelihood of having returned to work by approximately 6.5 months after mild traumatic brain injury could be as low as 71% or as high as 81%.
Significant predictors of full return to work at 6 months: More than 11 years of education (odds ratio 6.4; 95% CI 2.3 to 18.3), without nausea or vomiting on admission (odds ratio 5.1, 95% CI 1.8 to 14.3), with no additional extracranial injuries (odds ratio 3.4, 95% CI 1.6 to 7.3) and only low levels of pain early after injury (odds ratio 2.3, 95% CI 0.9 to 5.9).
How might we use this evidence to inform practice?
As you have determined the internal validity of this study to be reasonably strong (although you keep in mind the bias from the incomplete follow-up) and the results useful, you proceed to assessing the applicability of the evidence by comparing your patient with the participants in the study, before deciding whether you can use the evidence to help inform your practice. Mary's mechanism and severity of injury is similar to the majority of the study participants. She is younger than the mean age of study participants, but meets the eligibility criterion for age and all of the other eligibility criteria of the study. In terms of the prognostic factors that were identified in this study, Mary has >11 years of education; did not have nausea, vomiting or extracranial injuries on admission; and had only low levels of pain early after injury. All of these factors were positively related to return to work, so this may increase the likelihood of her returning to work.
You explain to Mary that you think there is a reasonable chance that she will be able to return to her usual job by 6 months post-injury. As part of your treatment planning, you will arrange a time for Mary and yourself to meet with her employer to discuss the option of her returning to work in a modified capacity (such as shorter hours, different duties, graded return to work, etc) if this is necessary. During this meeting, you also plan to obtain more-detailed information about Mary's duties at work and then use this, in conjunction with Mary, to set her rehabilitation program and goals.
*Reproduced and adapted from the above reference with permission from BMJ Publishing Group Ltd.
Clinical scenario
A 32-year-old baker presents to your private physiotherapy practice 2 days after the onset of his first episode of acute low back pain. His pain is localised to his lumbar spine and is not accompanied by signs of more-serious pathology such as weight loss, weakness or paraesthesia. However, it is currently preventing him from working and he urgently needs to arrange a replacement until he is able to work again. He is therefore primarily interested in any advice you can give him with regard to when he can expect to improve enough to return to work. He is also interested to know how quickly his pain is likely to improve with usual intervention.
In adults with acute low back pain, what is the average time to return to work and to resolution of pain?
Search terms and databases used to find the evidence
Database: PubMed—Clinical Queries (with ‘prognosis category’ and ‘narrow scope’ selected).
Search terms: (acute OR recent) AND (low back pain) AND (return to work*)
The search returns 36 records. You scan the titles of the articles and read the abstracts of four studies that seem like they could be relevant. Of these, one is highly relevant as it is an inception cohort study of acute low back pain, it was conducted in the same healthcare setting as your work, it followed a large cohort and it measured the outcomes that are of primary concern to your patient.
Henschke N, Maher C, Refshauge K, et al. Prognosis in patients with recent onset low back pain in Australian primary care: inception cohort study. BMJ 2008;377:a171.
Structured abstract (adapted from the above)
Study design: Inception cohort study.
Setting: Medical, physiotherapy and chiropractic practices in Sydney, Australia. Participants: 973 participants (mean age 43.3 years; 54.8% male) aged at least 14 years with non-specific low back pain of less than 2 weeks' duration. Exclusion criteria included radiculopathy, cancer, spinal fracture, spinal infection and inflammatory arthritis.
Outcomes: Time to return to work (determined by self-report of returning to previous work status), time to complete resolution of pain and return to function.
Prognostic factors studied: Age, gender, intensity of low back pain and level of interference with function at baseline, plus individual variables grouped into seven factors—current history, past history, features of serious spinal pathology, sociodemographics, general health, psychological health and work.
Follow-up period: 1 year (with assessments also at baseline, 6 weeks and 3 months).
Main results: Median time to return to work was 14 days (95% confidence interval [CI] 11 to 17 days). Resolution of pain was much slower, at a median of 58 days (95% CI 52 to 63 days). A reasonable proportion of patients still had unresolved problems at 1 year. The cumulative probability of having returned to previous work status at 1 year was 89% and the cumulative probability of being pain-free at 1 year was 72%.
Conclusion: Prognosis of participants was not as favourable as is claimed in clinical guidelines. Most participants experienced slow recovery and almost one-third had not recovered from the presenting episode by the 12-month follow-up.
Is the evidence likely to be biased?
• Was there a representative and well-defined sample?
Yes. The article states that consecutive participants who presented to primary care with recent-onset low back pain were invited to participate. Also, the target population is well-defined, as clear inclusion and exclusion criteria are provided.
• Was there an inception cohort?
Yes. Participants were recruited within 2 weeks of onset of their condition, which minimises possible bias due to variable disease duration within the cohort.
• Was exposure determined accurately?
Yes. Eligibility was determined by doctors, physiotherapists and chiropractors, so misclassification is unlikely unless participants misreported their symptoms.
• Were the outcomes measured accurately?
Cannot tell. The outcomes (pain intensity, disability and work status) were based on participant self-report. Therefore, it was not possible to measure the outcomes in a blind fashion. Also, there is little indication of psychometric validation of any of the outcome measures, which may be one source of potential bias.
• Were important prognostic factors considered?
Yes. The researchers identified an extensive range of prognostic factors (refer to the structured abstract).
• Was the follow-up of participants sufficiently long and complete?
Yes. The follow-up rate was excellent (97%) and the length of follow-up appears to have been sufficient for the outcomes that were measured.
Return to work: The median time to return to work (to previous work hours and duties) was 14 days (95% CI 11 to 17 days). The cumulative probability of having returned to previous work status was 74.6% at 6 weeks, 83.2% at 12 weeks and 89.5% at 1 year.
Resolution of pain: The median time to resolution of pain was 58 days (95% CI 53 to 63 days). The cumulative probability of being pain-free was 39.9% at 6 weeks, 58.2% at 12 weeks and 72.5% at 1 year.
Complete recovery: This was measured by recovery on all three dimensions (return to work, no disability and no pain). The cumulative probability of being fully recovered was 39.0% at 6 weeks, 57.4% at 12 weeks and 71.8% at 1 year.
Prognostic factors: Factors associated with a longer time to recovery included older age, compensation cases, higher pain intensity, longer duration of low back pain before consultation, more days of reduced activity because of lower back pain before consultation, feelings of depression and a perceived risk of persistence.
How might we use this evidence to inform practice?
You compare your patient's characteristics with those of the participants in the sample, and decide that he is similar enough that you can apply this evidence to him and his situation. As this prognostic evidence has little risk of potential bias and the confidence interval extends only a few days either side of the estimate of median time to return to work, you can confidently reassure your patient that about 50% of people with acute low back pain return to work at about 2 weeks. Resolution of his pain is likely to take substantially longer, with 50% of people being pain-free by about 8 weeks. However, you also explain to your patient that there is a small risk that the condition will not have fully resolved by 1 year, with 28% of the study participants not considered as fully recovered by 1 year. Because he is young, self-employed and has only had the pain for 2 days, however, he does not have several of the prognostic factors that were found to predict a longer time to recovery. Therefore, it is likely that he may have a better than average prognosis for recovery. You clearly explain all of these findings to your patient.
Clinical scenario
You are a podiatry student on clinical placement in a hospital podiatry department. You have just seen a 62-year-old man who attended with his wife. He has been referred by the diabetes educator for foot screening, education and management. He has had type 2 diabetes for approximately 10 years and, according to the patient, his control has been good.
Your examination indicates that neuropathy is present, vascular assessment is satisfactory, there is some foot deformity and there are active pressure lesions present plantar to the first metatarsal head bilaterally. Debridement of the callosity on the right foot reveals an ulcer. Together with your supervisor, you conduct a detailed ulcer assessment. The ulceration has white, macerated margins, the base is clean and pink to red and there is no exudate. The ulcer is round, 6 mm across and 4 mm deep. There do not appear to be any sinuses and you cannot probe to bone.
While discussing an intervention plan with your patient, his wife, who appears visibly worried, asks if he will end up losing his leg. You know that this is a possibility but are not sure of the actual risk, so your supervisor suggests you conduct a search to see if you can find some evidence to guide your answer to the question. You tell your patient and his wife that you will endeavour to answer her question more accurately when you see them again in a few days' time.
In a person with a first neuropathic foot ulcer, what is the risk of amputation?
Search terms and databases used to find the evidence
Database: PubMed—Clinical Queries (with ‘prognosis category’ and ‘narrow scope’ selected).
Search terms: (ulcer* AND (diabetic OR neuropathic)) AND amputat*
This search returns 77 systematic reviews and 116 studies. You quickly scan the titles of the first few systematic reviews, as a review of prognostic studies addressing your question would be more useful than a single study. In doing so, you notice a warning at the top of the page stating that ‘the wildcard search for “ulcer” used only the first 600 variations'. To understand what this means, you click on ‘details’ to see how PubMed has dealt with your search terms. The ‘Query Translation’ box, which displays how the search was run, shows that the first 600 variations include the term ‘ulcer’ but not ‘ulcers’. You think this term should also be searched, so go back and re-enter your search terms as:
This slightly increases the number of studies retrieved, to 121. You decide this is too many abstracts to scan through, so you try to refine your search by adding the term ‘first’. This retrieves a more reasonable 24 studies. You scan the titles and choose the following article which most closely matches your clinical question.
Winkley K, Stahl D, Chalder T, et al. Risk factors associated with adverse outcomes in a population-based prospective cohort study of people with their first diabetic foot ulcer. J Diabetes Complications 2007;21:341–9.
Structured abstract (adapted from the above)
Study design: Prospective cohort study.
Setting: Community and hospital foot clinics in London, UK.
Participants: 253 people (mean age 62.0 years; 63.6% male) with diabetes (type 1 or type 2) and their first foot ulcer. Exclusion criteria included not being fluent in English, a current independent comorbid medical condition, severe mental illness (such as psychosis or dementia), duration of foot ulcer greater than 1 year, or severely ischaemic feet (ankle brachial pressure index <0.5).
Outcomes: Death, amputation and recurrence of ulceration and the time taken for each outcome to occur.
Prognostic factors studied: Age, sex, smoking status, ulcer site (dorsal or plantar), size and severity of ulcer, severity of neuropathy, ischaemia, glycosylated haemoglobin, presence of micro- and macrovascular complications, and depression.
Follow-up period: 18 months (with assessments also at baseline, 6 months and 12 months).
Main results: At 18 months, 15.5% of participants had had an amputation, 15.8% had died and 43.2% had experienced ulcer recurrence. The severity of the ulcer at baseline was significantly associated with amputation (hazard ratio [HR] 3.18, 95% CI 1.53 to 6.59). Being older, having lower glycosylated haemoglobin, moderate ischaemia and depression were associated with mortality. Microvascular complications were associated with recurrent ulceration.
Is the evidence likely to be biased?
• Was there a representative and well-defined sample?
Yes. It is likely that the sample was representative, as the article states that the records of each participating clinic were checked fortnightly so that eligible patients could be identified (using a standardised checklist of case definition and exclusion criteria) from all of the current and new patients that were being seen by the clinics. Also, there was a very high proportion of eligible patients that were recruited into the study (of the 260 people who were eligible, 253 were recruited), which helps to ensure the representativeness of the sample. The target population is well-defined, with clear inclusion and exclusion criteria described in the article.
• Was there an inception cohort?
No. Although the range of time over which the ulcers had been present is not reported (mean duration was 3.1 months with a standard deviation of 3.6 months), it appears that the participants may have had the ulcers for as little as a few weeks or for as long as a year, and only participants with an ulcer duration of greater than 1 year were excluded. As participants were not recruited at a similar point in the course of this condition, possible bias due to variable disease duration within the cohort may have been introduced into the study.
• Was exposure determined accurately?
Yes. The article states that a clinically significant case definition of diabetic foot ulcer was used and go on to provide details about what this definition was. Also, participants were assessed by podiatrists at community and hospital foot clinics. Therefore it is likely that it was accurately determined whether participants had a foot ulcer or not.
• Were the outcomes measured accurately?
Yes. The outcomes of death and amputation are valid, and objective and specific criteria were established to define the outcome of ulcer recurrence. The methods used to identify the occurrence of the outcomes of interest appear reliable. It is not clear whether the outcome assessors were blind to clinical characteristics or prognostic factors, although it does state in the discussion that they were blind to depression status. Given the objectivity of the outcome measures, the issue of blinding is not likely to be of great importance.
• Were important prognostic factors considered?
Yes. The researchers identified an extensive range of factors that could have potential prognostic value.
• Was the follow-up of participants sufficiently long and complete?
Yes. Follow-up was both sufficiently long and complete. Eighteen months is an adequate length of time to observe amputation and ulcer recurrence. You wonder if it is long enough to observe mortality, but notice that quite a number of participants (15%) had experienced this outcome during the follow-up period. The rate of follow-up was 100% for the death outcome, 92% for the amputation outcome and 90.5% for the recurrence outcome. While the loss to follow-up in this study is reasonably small (that is, <10%), there were some differences in baseline characteristics between the participants who were lost to follow-up and those that remained in the cohort. Participants with missing information had a shorter duration of diabetes and fewer microvascular problems. It is unclear whether this constitutes a certain type of participant who was selectively lost to follow-up.
Amputation: By 18 months, 15.5% (n = 36) of the study population had undergone an amputation. Of the amputations, 10 were considered a major amputation (above the ankle) and the remainder were below the ankle (mainly of the toes). Using the data provided in the article, you calculate the 95% confidence interval for this 15.5% estimated risk of having an amputation to be 11.5% to 19.5%. In other words, the risk of amputation for a diabetic foot ulcer (at approximately 18 months after first seeking medical attention for the ulcer) is between 11.5% and 19.5%.
In a multivariate analysis, the severity of the ulcer was significantly associated with amputation (HR 3.34; 95% CI 1.53 to 6.59). The presence of an ulcer categorised as ‘deep’ according to the University of Texas Diabetic Wound Classification System increased the risk of amputation three-fold. As the confidence interval for the ratio does not contain 1 (the ‘no effect’ value), this result is statistically significant.
Recurrence of ulcer: By 18 months, 43% of participants developed another ulcer at the same or different site to the first ulcer. Microvascular complications (such as neuropathy) were associated with recurrent ulceration (HR 3.34; 95% CI 1.53 to 6.59).
Death: Being older (HR 1.07; 95% CI 1.04 to 1.11) and having moderate ischaemia (HR 2.74; 95% CI 1.46 to 5.14) and depression (HR 2.51; 95% CI 1.33 to 4.73) increased the risk of mortality. Better glycaemic control reduced mortality risk (HR 0.73; 95% CI 0.56 to 0.96).
How might we use this evidence to inform practice?
You consider the results of the study to be relatively free of bias, and your patient appears to be similar to the study participants in many respects including age, type and duration of diabetes and other clinical characteristics. You have not previously seen the wound classification system used in this study to assess the severity of the ulcers. The reference provided in the study report indicates that it is a validated instrument. In the study, the ulcers were categorised as either superficial (wound extended through the epidermis or dermis only) or deep (wound penetrates tendon, joint capsule, bone or joint). Using this categorisation, your patient's ulcer would be considered superficial. Given this, you feel that you can reassure the patient and his wife that he is at a lower risk of amputation than if the ulcer had penetrated to tendon, bone or joint. You will emphasise the importance of continued good control of his diabetes, as this may reduce the risk of death. However, due to the presence of peripheral neuropathy (a microvascular complication), your patient is at increased risk of recurrent ulceration. In conjunction with your supervisor, you discuss the findings of the study with your patient and his wife and also suggest that they schedule regular follow-up assessments to check frequently for ulcer recurrence and initiate prompt intervention if/when they recur to prevent them from progressing to deep ulcers.
Clinical scenario
You are a speech pathologist who works in a community child health centre. Mrs Overato brings her daughter Martha, aged 23 months, to see you. She is concerned that Martha has recently begun to stutter. Martha has a (dizygotic) twin brother, Steve, who does not stutter. There is no family history of stuttering. Mrs Overato reported that Martha first stuttered when she was about 18 months old, but this only lasted a few weeks and then stopped. She reports that the most recent bout of stuttering seemed to commence after Martha was frightened by their neighbour's dog.
Martha repeats words and initial sounds, but there is no blocking or prolongation occurring. She is reported to be as chatty as ever and appears unconcerned about her stuttering. There are no other concerns about Martha's development; she has a large vocabulary and she speaks in phrases and short sentences. Martha's speech development is normal and she is able to articulate words very clearly for her age. Mrs Overato is very anxious as Martha and Steve will soon be beginning day-care and, on a recent visit, the care staff remarked on her stuttering. She wonders if she should be seeking any intervention for Martha's stuttering. She has also heard that Martha is likely to grow out of her stuttering anyway. You decide to search the literature to obtain information about this issue.
When stuttering develops in infancy and early childhood in a twin, how likely is it that recovery will occur naturally and are there any indications about which children are most likely to recover?
Search terms and databases used to find the evidence
Database: PubMed—Clinical Queries (with ‘prognosis category’ and ‘narrow scope’ selected).
Search terms: (stutter* OR stammer*) AND (child*) AND (twin*) AND (recover*)
This search retrieves no articles. You repeat the search, this time with ‘broad’ scope selected. This retrieves one article and it is relevant to your clinical question.
Dworzynski K, Remington A, Rijsdijk F, et al. Genetic etiology in cases of recovered and persistent stuttering in an unselected, longitudinal sample of young twins. Am J Speech Lang Pathol 2007;16:169–78.
Structured abstract (adapted from the above)
Study design: Prospective, longitudinal twin study (in the UK).
Study question: What is the recovery rate from developmental stuttering in childhood and are there factors which predict recovery and persistence?
Participants: Participants were 12,892 twins recruited at 18 months of age.
Outcomes: Recovery of stuttering.
Follow-up period: Parent reports of the children's stuttering were obtained at 2, 3, 4 and 7 years of age.
Main results: Of the 12,892 children with at least two ratings, 950 children had recovered and 135 had a persistent stutter. Ratings of stuttering at 2 years of age were not predictive of later stuttering (at 7 years), but ratings at 3 and 4 years of age were. At 3, 4 and 7 years, the liability to stuttering was highly heritable.
Conclusion: Stuttering is a disorder that appears to have high heritability and little shared environment effect in early childhood and for recovered and persistent groups of children up to 7 years of age.
Is this evidence likely to be biased?
• Was there a representative and well-defined sample?
Yes. This is one of the largest and most methodologically rigorous twin studies about stuttering that has been undertaken. Its strength lies in the fact that the study of stuttering was embedded within a larger study of twin development. The prospective and longitudinal nature of the study was ideal for addressing the research question. The families of all twins that were born in the UK between 1994 and 1996 were invited to participate in the larger study about twin development. Appropriate exclusion criteria were applied in participant selection, namely that children with a specific medical condition (such as a chromosomal anomaly) were excluded, as were cases where zygosity data were unavailable.
• Was there an inception cohort?
No. Although the children in this study were recruited at a similar age (18 months), it is unlikely that they would have all been at a similar point with respect to the development/onset of stuttering.
• Was exposure determined accurately?
No. Stuttering at ages 2, 3 and 4 years was used to predict stuttering at age 7 years. A parent questionnaire pack was sent to parents at each assessment point. Each questionnaire contained at least one question that specifically asked about stuttering/stammering. A weakness is that the study relied on parental report of the presence of stuttering and there was no clinical verification of the report. The authors argue that, in their studies of child language, clinical face-to-face assessments have verified parental report. However, this has not been tested satisfactorily in stuttering to date and the validity of using parent report alone to verify presence or absence of stuttering remains unknown.
• Were the outcomes measured accurately?
No. A parent questionnaire pack was sent to parents at age 7 years (as was done for the measurement of exposure at ages 2, 3 and 4 years). The same issues that were discussed above with respect to the determination/measurement of exposure (that is, early stuttering) apply to the measurement of the outcome (that is, stuttering at 7 years).
• Were important prognostic factors considered?
Yes. The researchers considered the effect of gender and genetic and environmental influences on stuttering outcomes.
• Was the follow-up of participants sufficiently long and complete?
In terms of the length and completeness of follow-up, the overall length of follow-up (until children were 7 years old) is appropriate and one of the longest studies published to date. However, as the assessments were conducted when the participants were 2, 3, 4 and 7 years old, there were lengthy gaps (for example, 12 months) between the reports, so many short-lived bursts of stuttering may have been missed and data about onset prior to 2 years of age were not captured. The follow-up rate was 59% at 2 years of age, 64.8% at 3 years of age, 65% at 4 years of age and 62.4% at 7 years of age.
Incidence of stuttering: The incidence was 1.1% (82/7164) at 2 years of age, 2.4% (180/7616) at 3 years and 2.5% (262/10,514) at 4 years of age. At 2 and 3 years, for every girl who stuttered there were 1.6 boys who stuttered; whereas at 4 and 7 years, there were 1.8 boys for every girl who stuttered.
Recovery and persistence rates: Of the children whose parents had provided at least two ratings across the ages, 970 (7%) were classified as recovered (comprised of 429 girls [45%] and 521 boys [55%]). In the 135 (1%) children in which stuttering persisted, 35 (26%) were girls and 100 (74%) were boys. These figures can be expressed as: for every girl who continued to stutter, there were 2.9 boys who continued to stutter. Of the 82 children who were reported to be stuttering at 2 years of age, 81 had recovered by 7 years of age. Recovery rates at 3 and 4 years were reported to be 79% and 53%, respectively. Not only are fewer girls than boys affected by stuttering, but this holds for each age as well as for the recovered and persistent groups.
Prediction of later stuttering: Using logistic regression, the authors explored whether reports of stuttering at early ages were predictive of stuttering at 7 years. Ratings of stuttering at 2 years of age were not predictive of later stuttering, but ratings at 3 and 4 years of age were.
Twin analyses: Monozygotic concordance rates were higher than dizygotic rates, which suggests that there is substantial genetic influence operating and little evidence of shared environmental influence. This was verified in formal statistical twin modelling. The authors examined recovery and persistence patterns where one child had been affected by stuttering and the other had not. Most often the other twin was not affected, with this pattern being more apparent in dizygotic pairs compared with monozygotic pairs. The data presented did not suggest gender differences in pairs where both twins stuttered, nor were there different recovery and persistence rates. The authors concluded that the factors that increase liability to stuttering do not seem to be different for male or female children.
How might we use this evidence to inform practice?
In the case of Martha, we can draw a number of conclusions based on the results of this study. First, reports of stuttering obtained close to 2 years of age are not predictive of stuttering later in childhood, for example at 7 years. In this study 81 of the 82 children who were reported to be stuttering at 2 years did not stutter at 7 years. Second, Martha's mother can be reassured that the factors that increase liability to stuttering do not seem to be different for male or female children. Third, because there is a large genetic component to stuttering and little evidence of shared environmental influences, it is unlikely that the traumatic incident that Martha experienced with the neighbour's dog is implicated in the onset of stuttering, especially as this was the second bout of stuttering. Fourth, Martha's mother can also be reassured of the likelihood of a favourable outcome as there is no family history of stuttering and the data suggest that girls are more likely to recover than boys.
Based on the evidence from this well-conducted study, we can infer that Martha's stuttering is less likely to persist because there is no family history of stuttering. Intervention therefore could be delayed and stuttering observed and monitored for up to 12 months after onset. There is limited research to suggest that Martha's dizygotic twin brother will start to stutter. It is unlikely that the stuttering onset can be linked to environmental influences such as Martha's experience with the neighbour's dog.
Clinical scenario
As a general practitioner you regularly see a 48-year-old man who smokes about 25 cigarettes per day but is otherwise well. He is resistant to public health messages about smoking cessation, partly because he feels no immediate negative consequences from smoking. You thought it might be useful to provide him with current information about the effect of smoking on mortality and quality of life.
In people who are heavy smokers, what is the long-term effect on their quality of life and survival?
Search terms and databases used to find the evidence
Database: PubMed—Clinical Queries (with ‘prognosis category’ and ‘narrow scope’ selected).
Search terms: smok* AND (quality of life) AND (mortality OR survival) AND (long-term)
This search returned 45 studies. The first article listed in this search was the most current, most relevant and appeared from the abstract to have sound methods, so you obtain the full text of it so that you can appraise it in detail.
Strandberg A, Strandberg T, Pitkälä K, et al. The effect of smoking in midlife on health-related quality of life in old age: a 26-year prospective study. Arch Intern Med 2008;168:1968–74.
Structured abstract (adapted from the above)
Study design: Prospective cohort study.
Participants: 1658 white men (born 1919–1934) of similar socioeconomic status who were participating in the Helsinki Businessmen Study. All were healthy at baseline (year 1974), when cardiovascular risk factors and smoking habits were assessed.
Outcomes: Health-related quality of life was measured with the RAND 36-Item Health Survey. Total mortality up to the year 2000 was determined from Finnish national registers.
Prognostic factors studied: Baseline smoking status.
Follow-up period: 26-year follow-up (from 1974 to 2000).
Main results: Those who had never smoked (n = 614) lived a mean of 10 years longer than heavy smokers (>20 cigarettes daily; n = 188). Those who had never smoked also had the best scores on all the RAND 36-Item Health Survey scales of survivors in 2000 (n = 1131). The largest differences were found between never-smokers and heavy smokers, ranging from 4 points on the scale of social functioning to 14 points on the physical functioning scale. The physical component summary score of the RAND decreased as the number of cigarettes that were smoked daily increased (p = 0.01).
Conclusion: Health-related quality of life deteriorated with an increase in daily cigarettes smoked in a dose-dependent manner. Never-smokers survived longer than heavy smokers and they had better quality of life.
Is the evidence likely to be biased?
• Was there a representative and well-defined sample?
Yes. This was a well-defined sample with clear inclusion and exclusion criteria. Participants were healthy, professionally active in positions of responsibility and did not take regular medication or have signs of chronic diseases (including diabetes mellitus, cardiovascular disease, malignant neoplasms, psychiatric disorders or alcoholism). The participants were aged between 40 and 55 years at baseline. At baseline in 1974, data about detailed smoking status were available for 2464 men. However, only the data for 1658 men who were healthy were included. While these data are relevant for the particular patient that you are seeing (a 48-year-old, otherwise healthy male), extrapolation of the results of this study to the general population and to women must be done cautiously.
• Was there an inception cohort?
No. ‘Inception cohort’ refers to cohorts that are assembled at a similar well-described point in the course of a disease. The participants in this particular study were all healthy at baseline, showed no signs of cardiovascular disease or other serious diseases, were taking no medications permanently and were professionally active.
• Was exposure determined accurately?
No. Smoking status was assessed with a questionnaire. Participants were classified into five groups according to their self-reported smoking status in 1974: (1) never-smoked (n = 614), defined as men who had never smoked regularly and were not currently smoking; (2) ex-smokers (n = 650), defined as those who had previously been smokers but had quit smoking by 1974; and participants who smoked (3) 1 to 10 cigarettes per day (n = 87), (4) 11 to 20 cigarettes per day (n = 119) or (5) more than 20 cigarettes per day (n = 188). Information about the duration of the smoking habit during the study period was not available. Misclassification is possible as participants may have misreported their smoking status. However, as people who smoke may be more likely to under-report rather than over-report smoking, this would only strengthen the association if the people who smoked did not correctly identify their smoking status.
• Were the outcomes measured accurately?
Partially. Health-related quality of life was measured using the RAND 36-Item Health Survey questionnaire—that is, it used participant self-report. Therefore, it was not possible to measure this outcome in a blind fashion. Total mortality of the study population was retrieved from the National Population Information System of the Finnish Population Register Centre, which includes data from all Finnish citizens. It is unclear whether the assessors who extracted this data were blind to participants' clinical characteristics or prognostic factors.
• Were important prognostic factors considered?
Partially. Data about a range of factors such as alcohol consumption and cardiovascular risk factors were available from baseline to enable important prognostic factors to be adjusted for with respect to the mortality outcome. However, limited data were available for important prognostic factors for health-related quality of life at baseline. Only participants' self-rating of health and physical fitness on a 5-point scale (very good, good, fair, poor or very poor) was available, as the RAND 36-Item Health Survey 1.0 questionnaire did not exist in 1974 (at baseline).
• Was the follow-up of participants sufficiently long and complete?
Yes. The length of follow-up is the strength of this study. Mortality information was available for all participants. The total follow-up time was as long as 26 years, which generated 40,261 person-years of follow-up. Smoking status and health-related quality-of-life data were measured with a questionnaire that was mailed in the year 2000 to 1286 survivors and 1131 (87.9%) responded.
Mortality: Participants who had never smoked (n = 614) lived a mean of 10 years longer than heavy smokers (>20 cigarettes daily; n = 188).
Health-related quality of life: Among survivors in 2000 (n = 1131), the never-smokers had the best scores on all of the RAND 36-Item Health Survey scales. The largest differences were found between never-smokers and heavy smokers, ranging from 4 points on the scale of social functioning to 14 points on the physical functioning scale. The physical component summary score of the RAND decreased as the number of cigarettes that were smoked daily (p = 0.01) increased.
How might we use this evidence to inform practice?
This article clearly demonstrates that people who are heavy smokers are not only likely to live 10 years less than people who are non-smokers, but also that the more they smoke, the worse their physical functioning is likely to be in later years. The data provide further support for the already substantial evidence that warns about the negative risks of smoking. You consider the results of the study to be relatively free of bias. The data are directly relevant to your patient (a 48-year-old, otherwise healthy male). The editorial comment about this article from the same journal issue suggests that:
It is not just that the heavy smoker loses 10 years of life expectancy but rather that at any given age, the functional capacities of the heavy smoker are equivalent to those of non-smokers who are 10 years older. The clear message is that smoking makes you old before your time, and this reality may be far less attractive to younger smokers than the macho image of dying young while still strong and active.1
You discuss the findings of the study with your patient and discuss methods that may support him as he quits smoking. As a starting point, you make a time to follow up with him about one of these methods, specifically nicotine replacement therapy.
Clinical scenario
As the charge nurse in a nursing home, you frequently provide education on pressure-ulcer prevention to your nursing staff. One of the nurses points out that many patients have red areas that do not blanch (representing grade 1 ulcers) and wonders how many develop pressure ulcers (grade 2–4). You additionally wonder what factors may predict the development of pressure ulcers in these patients. You have a fairly clear idea of the most likely causes of pressure ulcer development, but want to ensure that your information is up-to-date before including this information in the in-service program. You advise the nurse that you will search for evidence and get back to him at next week's meeting.
In nursing-home patients with non-blanchable erythema, what factors are associated with the development of pressure ulcers?
Search terms and databases used to find the evidence
Database: PubMed—Clinical Queries (with ‘prognosis category’ and ‘narrow scope’ selected).
Search terms: ((nursing home) OR (care facility*)) AND ((pressure ulcer) AND (grade 1) OR (non-blanchable erythema))
The search returns two records. Of these, one is very relevant to your clinical question.
Vanderwee K, Grypdonck M, DeBacquer D, et al. The identification of older nursing home residents vulnerable for deterioration of grade 1 pressure ulcers. J Clin Nurs 2009;18:3050–8.
Structured abstract (adapted from the above)
Study design: Secondary analysis of data from a randomised controlled trial.
Setting: Eighty-four wards of 16 nursing homes in Belgium.
Participants: 235 participants (mean age 87 years, 16.6% male) with a grade 1 pressure ulcer, able to be repositioned, and with an expected length of stay in the nursing home greater than 3 days. Exclusion criteria included pressure ulcer grade 2–4 as defined by the European Pressure Ulcer Advisory Panel.
Outcomes: Incidence of a pressure ulcer lesion grade 2–4.
Prognostic factors studied: Age, body mass index, diabetes mellitus, history of cerebrovascular accident, urinary incontinence, faecal incontinence, dual incontinence, sleeping medication or tranquillisers, contractures, temperature, hypertension (systolic blood pressure ≥140 mmHg or diastolic blood pressure ≥90 mmHg), hypotension (systolic blood pressure <90 mmHg or diastolic blood pressure <60 mmHg), sensory perception, moisture, activity, mobility, nutrition, friction and shear.
Follow-up period: Patients were followed until they developed a pressure ulcer grade 2 or worse or until they were discharged or died. Mean follow-up period was 15 days.
Main results: A total of 44 (18.7%) participants developed a pressure ulcer grade 2–4. Predictive factors for developing a pressure ulcer were: hypotension (relative risk [RR] 3.42, 95% CI 1.6 to 7.5), history of stroke (RR 1.9, 95% CI 1.1 to 3.7), and contractures (RR 2.0, 95% CI 1.0 to 3.9). Urinary incontinence decreased the risk of developing a pressure ulcer by 76%.
Conclusion: Nursing-home residents with grade 1 pressure ulcers, hypotension, history of stroke, and/or contractures are at higher risk for the development of pressure-ulcer lesions.
Is the evidence likely to be biased?
• Was there a representative and well-defined sample?
Yes—well-defined; no—representative. Data were collected as part of a randomised trial which examined the effect of turning residents with unequal time intervals on pressure ulcer lesions. Of 379 patients who were eligible for the study (because they had developed a grade 1 pressure ulcer and were from the total population of 2663 residents), only 235 gave informed consent and were included. Of these, all were Caucasian, the majority (83.4%) were women, and the median age was 87 years (with half aged ≥90 years). So although the target population is well-defined, with clear inclusion and exclusion criteria, the sample is not particularly representative of nursing-home residents in general.
• Was there an inception cohort?
Yes. One of the eligibility criterion was that participants did not have a grade 2–4 pressure ulcer, but had to have a grade 1 pressure ulcer.
• Was exposure determined accurately?
Yes. Exposure in this study refers to whether participants had a grade 1 pressure ulcer (non-blanchable erythema) at a pressure point on the skin. This was an eligibility criterion for the randomised controlled trial and the procedure for determining this is described in the article with the results of the trial.
• Were the outcomes measured accurately?
Yes. Participants' skin was checked daily. Definitions were provided for each of the grades of pressure ulcer. All staff nurses received training in the observation of pressure ulcers using the European Pressure Ulcer Advisory Panel pressure ulcer classification educational program. Inter-rater reliability of the skin observations was carried out by the researcher and a study nurse who carried out unannounced weekly skin inspections of a random sample of participants.
• Were important prognostic factors considered?
Yes. The study included a range of prognostic factors (refer to structured abstract) and these were selected based on a review of the literature.
• Was the follow-up of participants sufficiently long and complete?
Yes. The follow-up period was quite short (mean of 15 days, interquartile range of 7 to 26 days); however, follow-up continued until participants developed a pressure ulcer grade 2–4, were discharged or died. The article does not mention if any participants were lost to follow-up; however, for this sample of participants (who were nursing-home residents) it is assumed that this did not occur (although it is possible that participants could have withdrawn from the study).
A grade 2–4 pressure ulcer developed in 44 (18.7%) participants, with an incidence rate of 12.7 per 1000 days (95% CI 0.9 to 1.6). The majority of the participants developed a grade 2 pressure ulcer (n = 39). From a multivariate analysis, independent predictive factors which increased the risk of developing a pressure ulcer were: hypotension (relative risk [RR] 3.4, 95% CI 1.6 to 7.5), history of stroke (RR 1.9, 95% CI 1.1 to 3.7), and contractures (RR 2.0, 95% CI 1.0 to 3.9). Urinary incontinence decreased the risk of developing a pressure ulcer (RR 0.2, 95% CI 0.09 to 0.64). The authors hypothesise that this may be due to more-frequent position changes, to check incontinence materials, in these participants.
How might we use this evidence to inform practice?
You are reasonably satisfied with the validity of the results of this study, although aware that the sample may not be representative of typical nursing-home residents. The study found three significant risk factors for the progression of grade 1 pressure ulcers into grade 2–4 lesions. At next week's meeting you plan to discuss with your team what additional preventive nursing measures can be used with residents with these risk factors to reduce the occurrence of pressure ulcers. At the meeting you also plan to develop a clinical question that will lead to a review of the latest evidence of the most effective interventions for preventing pressure-ulcer development in nursing-home residents.
Clinical scenario
You are a radiographer with 5 years post-qualification experience. The large public teaching hospital where you have just started a new job has women's health as one of its specialties. In the course of your rotation through the breast unit, you become aware of the role played by the nurses in supporting the women who attend for the various breast-imaging examinations. It becomes clear to you that the women rely very much upon these nurses for information about the efficacy of the various imaging modalities in diagnosing cancer of the breast. One nurse in particular is keen to know whether it is possible for any of the imaging modalities (such as magnetic resonance [MR] imaging) to accurately predict which patients might survive breast cancer. She recently had some very anxious patients who asked her about their long-term chances of survival. You offer to do some searching and let the nurse know the answer later that week.
Can MR imaging be used to predict survival in women with breast cancer?
Search terms and databases used to find the evidence
Database: PubMed—Clinical Queries (with ‘prognosis category’ and ‘narrow scope’ selected).
Search terms: (MR imaging) AND (breast cancer) AND (survival)
This search results in 17 articles. You scan the titles, and one article is relevant to your clinical question.
Bone B, Szabo B, Perbeck L, et al. Can contrast enhanced MR imaging predict survival in breast cancer? Acta Radiol 2003;4:373–8.
Structured abstract (adapted from the above)
Study design: A longitudinal cohort study. This study followed up a cohort of participants who had previously been recruited for an earlier study that examined MR imaging in women with breast cancer.
Participants: The initial study consisted of 50 consecutive breast-cancer patients (mean age at diagnosis = 59 years) who had undergone a preoperative contrast-enhanced MR imaging (CE-MRI) examination between September 1992 and December 1993. Inclusion criteria for the initial study were a histopathologically verified primary breast malignancy and a detectable abnormality at MR imaging (lesion visible on at least three consecutive images).
Outcomes: Disease-free survival and overall survival.
Prognostic factors studied: A range of established classical and molecular prognostic markers were analysed, such as age, lymph node status, tumour size and proliferating cell nuclear antigen index.
Follow-up period: Median follow-up was 95 months (range 23–111 months).
Main results: The cumulative 5-year and 7-year survival rates for the whole cohort were 63% and 59% for disease-free and 81% and 77% for overall survival, respectively. Local recurrence or metastasis of the primary disease developed in 20 (40%) patients. Independent and significant predictors of disease-free survival were tumour size and the signal enhancement ratio. Independent and significant predictors of overall survival were age, lymph node status, tumour size and proliferating cell nuclear antigen index.
Conclusion: CE-MRI is useful in predicting the disease-free survival of women with breast cancer.
Is the evidence likely to be biased?
• Was there a representative and well-defined sample?
Cannot tell. When the cohort was gathered for the initial study, the article states that participants were consecutively investigated breast-cancer patients, which may indicate that the cohort was likely to be representative. However, it is not clear what is meant by ‘investigated’, as this could imply that only patients who had undergone a CE-MRI investigation were included and, if this was the situation, it is possible that these patients may have systematically differed in some way to the patients who did not undergo this investigation. The sample was reasonably well-defined, as clear inclusion criteria are provided; however, no exclusion criteria are stated.
• Was there an inception cohort?
Cannot tell. The article does not provide any clear details about whether participants were in a similar stage in the disease process when they were recruited. Although it is likely that participants were recruited shortly after the time of diagnosis as they were patients who had undergone a CE-MRI examination preoperatively, no further details about this are provided.
• Was the exposure determined accurately?
Yes. One of the inclusion criteria was that participants needed to have a histopathologically verified primary breast malignancy. In addition, all imaging and other clinical predictive markers were correlated and confirmed with the histopathological description of the biopsied tumour samples.
• Were the outcomes measured accurately?
Yes. Data about the outcomes of overall survival and disease-free survival were obtained from the hospital medical records. Disease-free survival and overall survival are objective outcomes that were defined and the article states that participants who died from causes other than breast cancer were censored.
• Were important prognostic factors considered?
No. The researchers identified some prognostic factors, but not all potentially important ones. For example, there was a mix of tumour types in this cohort and this may have affected the results, especially in such a small group. Ideally, results should have been stratified according to tumour type and grade, but this would require a much larger cohort.
• Was the follow-up of participants sufficiently long and complete?
No. A major weakness of the study is that the follow-up was conducted retrospectively via hospital medical records. This implied that participants continued to be cared for by the same hospital throughout the study period, which may not have been the case. No information is provided as to whether all participants were able to be followed up (in this case, whether current medical records were available for all participants from the initial study). A prospective follow-up of patients would have strengthened the study. Additionally, the follow-up of participants was not long enough. Although the median follow-up time was appropriate at 95 months, the range was very large (23 to 111 months) and the reason for this large variation in the follow-up period is not explained.
Predictors of disease-free survival: In a multivariate analysis, only the signal enhancement ratio obtained during the CE-MRI (p = 0.014) and tumour size at excision (p = 0.001) were significant and independent prognostic factors for disease-free survival.
Predictors of overall survival: In a multivariate analysis, age (p = 0.003), lymph node status (p = 0.014), tumour size (p = 0.039) and the proliferating cell nuclear antigen index (p = 0.053) were found to be significant and independent prognostic factors for overall survival.
How might we use this evidence to inform practice?
Because the study had a number of flaws which cast doubt on the validity of the results, you decide that the results should be treated with caution. You decide to tell the nurse that, although the results of this study seem to indicate a possible role for CE-MRI in predicting survival in breast cancer, the evidence is currently not adequate for it to be used to replace biological markers as predictors of survival in women with breast cancer.
Clinical scenario
Mr Roberts has been referred to you by his general practitioner. He is 47 years old with hypertension, high cholesterol, obesity and impaired glucose tolerance. You undertake a fitness assessment and determine that he has a low exercise capacity (lowest 20th percentile for his age). He is very worried about developing type 2 diabetes and wants to know if improving his fitness will make him less likely to develop diabetes. You want to give Mr Roberts evidence-based advice about this issue, and look for recent evidence to guide your discussion with him.
In a man with impaired glucose tolerance, does a high level of fitness lower the risk of developing type 2 diabetes?
Search terms and databases used to find the evidence
Database: PubMed—Clinical Queries (with ‘prognosis category’ and ‘narrow scope’ selected).
Search terms: (impaired glucose tolerance) AND fitness AND diabetes
This search results in nine articles, two which appear relevant from the abstracts. You obtain the full-text of each and find that both papers are describing the same cohort. You decide to use the 2009 article as it is based on more-recent data/analyses.
Lee D, Sui X, Church T, et al. Associations of cardiorespiratory fitness and obesity with risks of impaired fasting glucose and type 2 diabetes in men. Diabetes Care 2009;32:257–62.
Structured abstract (adapted from the above)
Study design: A prospective cohort study.
Setting: A medical clinic in Texas, USA.
Participants: 14,006 men in a larger study about diabetes; and of these, 7795 who had normal baseline glucose and were considered to be in an impaired fasting glucose group. Inclusion criteria were: men aged 20–79 years who had undergone at least two medical examinations at the clinic between 1974 and 2006. Exclusion criteria were: body mass index <18.5 kg/m2; abnormal resting or exercise electrocardiogram; history of heart attack, stroke, cancer or diabetes at baseline; or did not achieve at least 85% of their age-predicted maximal heart rate during the treadmill test.
Outcomes: Primary outcomes: development of impaired fasting glucose or type 2 diabetes.
Prognostic factors studied: Baseline age, examination year, waist girth, percent body fat, parental diabetes, current smoking, alcohol consumption, blood pressure, total cholesterol, baseline impaired fasting glucose, body mass index and exercise capacity (treadmill time for a maximal exercise test). Exercise was divided into fifths of treadmill time in each age group. The lowest 20% were classified as having fitness level 1, and in continuing increments of 20%, participants were classified as fitness levels 2 through 5.
Follow-up period: From baseline to first follow-up event (impaired fasting glucose or type 2 diabetes) or to the last follow-up in 2006 in participants who did not develop either condition.
Main results: 3612 men developed impaired fasting glucose and 477 men developed diabetes. Men in the highest fitness level (most fit 20%) showed a 52% lower risk of developing type 2 diabetes and a 14% lower risk of impaired glucose fasting compared with those in the lowest (least 20% fit) fitness level after accounting for body mass index.
Conclusion: Low fitness and obesity increased the risk of impaired glucose fasting and diabetes.
Is the evidence likely to be biased?
• Was there a representative and well-defined sample?
Yes. The sample was recruited from all patients who received two medical examinations at the recruiting clinic, and clear inclusion and exclusion criteria are provided in the article.
• Was there an inception cohort?
Yes. Participants in the study who had diabetes at baseline, a history of diabetes or were currently taking insulin were excluded from the study, thus leaving an inception cohort of participants without impaired fasting glucose or diabetes.
• Was the exposure determined accurately?
Yes. Fitness was determined using total duration of a treadmill test which is highly correlated (r = 0.92) with the gold-standard measure (maximal oxygen uptake). It is not clear from the study how fitness was determined on an ongoing basis. The limitations section of the paper mentions that participants revisited the clinic every 1.5 years, on average, and that fasting glucose tests were done then, but it is not clear whether that is when the fitness tests were also done.
• Were the outcomes measured accurately?
Yes. Impaired fasting glucose and diabetes were diagnosed according to the American Diabetes Association criteria.
• Were important prognostic factors considered?
Yes. Important known risk factors for developing diabetes were measured and considered in the statistical analyses.
• Was the follow-up of participants sufficiently long and complete?
Cannot tell. Participants were followed until they developed diabetes or impaired fasting glucose, or until the study ceased recruiting. The mean follow-up period was 5.1 years for the 7795 men with normal baseline glucose and 7.2 years for the entire cohort. The article does not provide any details about loss to follow-up of participants from the study. We know that some were lost to follow-up, as there is a brief mention in the limitations about comparing the main variables for men who were lost to follow-up and those who were not, but no further information is given.
Men with a body mass index ≥30.0 kg/m2, waist girth >102 cm or percent body fat ≥25% had 2.7, 1.9 and 1.3 fold higher risks for type 2 diabetes, compared with those for non-obese men. Table 9.1 shows the relative risk of developing diabetes for each fitness level category. For example, men in the highest fitness level (most fit 20%) showed a 52% lower risk of developing type 2 diabetes compared with those in the lowest (least 20% fit) fitness level after accounting for body mass index. As fitness improved, there was a lower risk of developing diabetes. The addition of body mass index into model 2 shows that the associations between fitness levels and the risks of developing diabetes were still significant irrespective of whether body weight was changed. The dose–response relationship between fitness and onset of diabetes remained in all multivariate-adjusted models.
TABLE 9.1:
Adjusted relative risk of developing type 2 diabetes according to fitness level
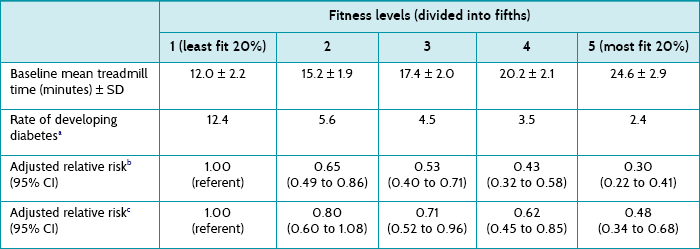
CI = confidence interval; SD = standard deviation.
aPer 1000 person-years adjusted for age and examination year.
bModel 1 = Adjusted for age, examination year, parental diabetes, current smoking, alcohol consumption, systolic and diastolic blood pressure, total cholesterol, and impaired fasting glucose.
cModel 2 = Adjusted for model 1 plus body mass index.
How might we use this evidence to inform practice?
You are reasonably confident of the validity of this study, although a little cautious given that details regarding the completeness of follow-up are not reported in this article (although possibly are in other articles related to this cohort of patients). This study provides evidence to support your response to Mr Roberts that he could decrease his risk of developing diabetes if he increased his fitness level, even without a change in his body weight. Mr Roberts decides that he would like to increase his fitness level and you plan to design a training program to achieve this goal, taking into account his comorbidities, medications, limitations and personal preferences.
Clinical scenario
You are a paramedic who is at a social function when a friend asks what to do if a stranger collapses with a heart attack. ‘I couldn’t bring myself to do mouth-to-mouth on a total stranger,’ he says. ‘Well, the good news is that you don’t have to. It has been shown that chest compression-only resuscitation can be used instead,’ you reply. ‘Yeah, maybe, but what’s the point—aren’t they all pretty much in a coma afterwards? I doubt any make a good recovery’ is the reply. You decide to look up the evidence so that you can provide your friend with a research-based answer to his query.
For patients who have an out-of-hospital cardiac arrest and receive chest compression only, how many people survive to hospital discharge with reasonable neurological function?
Search terms and databases used to find the evidence
Database: PubMed—Clinical Queries (with ‘prognosis category’ and ‘narrow scope’ selected).
Search terms: (cardiac arrest) AND (chest compression only) AND surviv*
This resulted in nine articles, two of which match your clinical question. They both used a similar study design, so you choose the largest and most recent study to appraise.
Bobrow B, Spaite D, Berg R, et al. Chest compression–only CPR by lay rescuers and survival from out-of-hospital cardiac arrest. JAMA 2010;304:1447–54.
Structured abstract (adapted from the above)
Study design: Prospective cohort study.
Setting: Arizona, USA (and occurred following a state-wide multifaceted promotion of chest-compression-only cardiopulmonary resuscitation).
Participants: Patients (n = 4415) ≥18 years of age who experienced an out-of-hospital cardiac arrest of a presumed cardiac origin which was not witnessed by Emergency Medical Services (EMS) personnel which occurred between 2005 and 2009.
Outcomes: The primary outcome was survival to hospital discharge. Additional outcomes were Cerebral Performance Category (CPC) on hospital discharge and the frequency and type of bystander cardiopulmonary resuscitation (CPR).
Prognostic factors studied: Age, sex, witnessed arrest, shockable rhythm, bystander CPR provision and type, location of arrest, EMS response interval, type of EMS resuscitation protocol (minimally interrupted cardiac resuscitation vs conventional basic life support/advanced cardiac life support), use of post-arrest therapeutic hypothermia and year.
Follow-up period: The patients were followed up until hospital discharge.
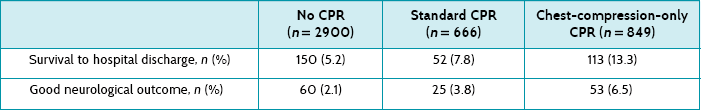
Main results: Of the 4415 patients, 2900 received no bystander CPR, 666 received standard CPR by a bystander, and 849 received chest compression only CPR by a bystander. Rates of survival to hospital discharge and good neurological outcome were 5.2% and 2.1% for no bystander CPR, 7.8% and 3.8% for standard CPR, and 13.3% and 6.5% for chest-compression-only CPR, respectively.
Conclusion: For patients with out-of-hospital cardiac arrest of presumed cardiac aetiology, bystander chest compression only was associated with increased survival to hospital discharge compared with conventional CPR and no bystander CPR.
Is the evidence likely to be biased?
• Was there a representative and well-defined sample?
Cannot tell, but probably. The study investigated all patients ≥18 years of age who suffered an out-of-hospital cardiac arrest, of cardiac origin, not witnessed by emergency medical service (EMS) staff, over a 5-year period for the whole state of Arizona, USA. Although it is probably implied by the authors of the article, we do not how many people were not included in this sample (that is, was it the entire state of Arizona that was potentially eligible?). However, it is hard to imagine a systematic bias towards patients with any better, or worse, prognosis.
• Was there an inception cohort?
Yes. Patients were included in the study following arrival of the ambulance.
• Was the exposure determined accurately?
Yes. All patients were assumed to be in cardiac arrest, unless they had obvious alternative explanations (such as drowning or trauma). Exposure to CPR was determined by the paramedics either by observation on their arrival or by questioning bystanders during the ongoing resuscitation attempt. Although there is some possibility of bias during collection of these data (such as misclassification of type of CPR that was performed), attempts were made to minimise this by training EMS staff in how to document the presence and type of bystander CPR.
• Were the outcomes measured accurately?
Yes. Patient survival to hospital discharge was determined by review of hospital records and the state health database. Neurological outcome was categorised, according to neurological status at discharge, using a 5-level Cerebral Performance Category (good cerebral performance, moderate cerebral disability, severe cerebral disability, coma or vegetative state and death).
• Were important prognostic factors considered?
Yes. Important prognostic factors were accounted for (see list in structured abstract).
• Was the follow-up of participants sufficiently long and complete?
Yes. Data was collected on participants until hospital discharge (which was the primary outcome measure) and few participants were lost to follow-up, mainly due to missing data (1.4% in the ‘no resuscitation’ group; 1.6% in the conventional CPR group; and 0.5% in the chest-compression-only CPR group).
Patients in each of the three groups were similar in age and gender, with the same response time for the EMS. Table 9.2 shows that patients who have a witnessed cardiac arrest and who receive some form of CPR are more likely to survive to hospital discharge with a good neurological outcome (scored 1 in the Cerebral Performance Category).
How might we use this evidence to inform practice?
This was a well-conducted study that suggests that the outcomes of patients who are given chest-compression-only CPR by bystanders is not hopeless, with about 13% surviving to hospital discharge and of those, about 6–7% with good neurological outcomes. The question about whether chest-compression-only CPR is better than conventional CPR is suggested by these results, but this is really a question that should be answered by a randomised controlled trial (if this were possible). However, you do feel empowered to tell your friend that there is reasonable evidence, from a large state-wide study, that chest-compression-only CPR from a lay person results in about 1 person in 15 surviving with a good outcome.
Clinical scenario
You are a pharmacist working in a community pharmacy. One of your regular customers has just returned from her general practitioner (GP) after seeing him for worsening hip and knee pain. She has a history of osteoarthritis in these areas and until now has used regular paracetamol to manage the pain. Her GP suggested that she try taking a non-steroidal anti-inflammatory drug (NSAID) for a few weeks to see if that helps with the pain, as she is showing some signs of inflammation. Today she has a prescription for diclofenac 50 mg tablets, 1–2 tablets twice a day. However, after leaving the GP, she realised that she forgot to ask him whether taking a NSAID will give her a stomach ulcer and anxiously asks you if that is the case.
For primary-care patients who need to take NSAIDs, what is the likelihood of a gastric ulcer developing?
Search terms and databases used to find the evidence
Database: PubMed—Clinical Queries (with ‘prognosis category’ and ‘narrow scope’ selected).
Search terms: (primary care) and (ulcer*) and (NSAID)
This resulted in 14 articles, one of which matched your clinical question.
Hollenz M, Stolte M, Leodolter A, et al. NSAID-associated dyspepsia and ulcers: a prospective cohort study in primary care. Dig Dis 2006;24:189–94.
Structured abstract (adapted from the above)
Study design: Prospective cohort study.
Setting: A single primary-care practice in Germany.
Participants: 104 patients (mean age 53 years, 88% female) who were ≥18 years, not currently being treated for dyspepsia and starting treatment with an NSAID that was estimated by the GP to be needed for at least 2 weeks.
Outcomes: Development of upper gastrointestinal tract ulcers and/or troublesome dyspepsia.
Prognostic factors studied: Age, gender, smoking, regular consumption of alcohol, history of upper gastrointestinal tract disease and concomitant medication.
Follow-up period: After at least 2 weeks of NSAID treatment.
Main results: 16% of patients experienced an ulcer, 35% developed dyspepsia that required treatment and 44% developed ulcer and/or dyspepsia. 41% of the patients with an ulcer had no dyspepsia.
Conclusion: Primary-care patients frequently develop treatment-requiring dyspeptic symptoms and ulcers while on NSAIDs; the latter were not identifiable from symptoms or risk factors.
Is the evidence likely to be biased?
• Was there a representative and well-defined sample?
Partially. This was a typical cohort of patients being treated with NSAIDs in primary care, for typical reasons (most for pain from degenerative spinal column and joint disease). There was a preponderance of females (88%), which weakens the generalisability of the study results. Participants were consecutively recruited; however, we do not know what the refusal rates were. Although the paper mentions that two patients were excluded after recruitment because they refused the gastroscopy, we do not know if this was a supplement to a larger number who declined before recruitment. The article describes clear inclusion and exclusion criteria.
• Was there an inception cohort?
Cannot tell. Although patients were recruited prior to beginning NSAID treatment, we do not know much about participants' prior history of upper gastrointestinal tract disease.
• Was the exposure determined accurately?
Partially. The exposure was prescription of NSAIDs. However, it is possible that not all patients adhered to treatment and this was not measured explicitly.
• Were the outcomes measured accurately?
Yes. Dyspeptic symptoms were measured using a structured questionnaire. Although it is not mentioned whether this was a validated instrument, this may not be critical because whether or not patients are experiencing symptoms is a direct and simple construct. Additionally, participants had an abdominal examination and a gastroscopy (with removal of two biopsies), which was probably objective.
• Were important prognostic factors considered?
Yes. There was measurement of known confounders such as smoking, alcohol consumption and previous history of upper gastrointestinal disease and all of these existed in credibly typical rates in the cohort.
• Was the follow-up of participants sufficiently long and complete?
No. Participants were followed up after at least 2 weeks of NSAID treatment, which may be considered to be a rather short duration of follow-up. No justification for choosing this minimum duration was provided. Actual follow-up was treatment of <1 month duration in 64%, 1–3 months in 16% and >3 months in 19%. It is possible that the results might have been more striking with a longer follow-up. The article reports that data were analysed for 100 (of the 104 participants), as 2 refused gastroscopy and 2 had had a partial gastrectomy. No other details about follow-up completeness are provided.
An ulcer was diagnosed in 17 patients, giving an ulcer prevalence of 16%. These patients were not identifiable on the basis of their symptoms. Predictors for the development of an ulcer were smoking (odds ratio [OR] 5.1, 95% CI 1.6 to 16.5), regular use of alcohol (OR 4.5, 95% CI 1.3 to 15.1) and duration of treatment <1 month (OR 4.9, 95% CI 1.1 to 23.1).
How might we use this evidence to inform practice?
You have some concerns about the validity of this study's results, but it appears to be the best available evidence to answer this question at this time. The ulcer prevalence of 16% seems quite high and begs the question of what the figure would have been had the patients not been using NSAIDs, which we can only guess at (and would be difficult to answer; not least because of the ethical considerations of performing a gastroscopy on otherwise healthy people). We could mention to our concerned lady that there is a reasonable chance that she will suffer either dyspeptic symptoms (sometimes called ‘indigestion’) or even an ulcer following starting the NSAID diclofenac. However, it is not clear how much these adverse outcomes are actually caused by the diclofenac (which would require a randomised controlled trial).