Evidence about prognosis
After reading this chapter, you should be able to:
• Generate a structured clinical question about prognosis for a clinical scenario
• Appraise the validity of prognostic evidence
• Understand how to interpret the results from prognostic studies and calculate additional results (such as confidence intervals) where possible
• Describe how prognostic evidence can be used to inform practice
Let us consider a clinical scenario that will be useful for illustrating the concepts of evidence about prognosis that are the focus of this chapter.
The clinical scenario above raises several questions about the future of the patient's condition. What change in pain and mobility can Mrs Wilson expect if she chooses not to undergo the surgery? If she decides not to have the operation now, for how long will she remain a suitable candidate for surgery? Assuming the surgery is performed, many more questions are raised. How long will it take for the immediate symptoms associated with the surgery to resolve? Will complications occur? How much improvement in mobility can she expect after the surgery? How long will it take to achieve this level of mobility? Will surgical revision of the joint replacement become necessary and, if so, when? These types of questions will be the focus of this chapter on prognosis.
Prognosis is about predicting the future—the future of a patient's condition. While it is impossible for anyone to predict the future with absolute certainty, we can use evidence from the past to make informed and sensible predictions about the future. These evidence-based predictions about the future can be useful in many ways. They can help reassure patients by removing some doubt about the future, especially if their expectations are unjustifiably pessimistic. Predictions about natural recovery can help you and your patient to jointly decide whether interventions need to be considered at all. Sometimes an intervention is chosen that is typically applied only once, as with joint replacement or organ transplant. In such cases, the optimal time to apply the intervention can be determined by predictions about the rate of deterioration before it and the rate of recovery after it. Predictions about the average course of a particular condition can also be adjusted for individual patients. This adjustment is possible when other features about a patient or the patient's health or management, besides the primary diagnosis, have been shown to affect outcomes.
This chapter will address the process of using prognostic evidence to make these predictions and incorporating them into clinical practice. We will start by defining the components of a structured clinical question about prognosis. Then we will see how to appraise the evidence to determine its likely validity. Subsequent sections of the chapter will review how to understand the results of a prognostic study, how to use the evidence to inform practice and how to explain prognostic information clearly to patients.
How to structure a prognostic question
You will recall from Chapter 2 that clinical questions can be structured using the PICO format: Patient/Problem, Intervention/Issue, Comparison (if relevant) and Outcomes. When our question was about the effect of an intervention, the comparison was an important component. The effect of an intervention was always estimated by comparison against this component, even if it was a ‘no-intervention’ or usual care control. Questions about prognosis, instead, are questions about expected outcomes, not questions about what has caused those outcomes. Therefore, the comparison component is not used in questions about prognosis. Let us look at each of the remaining components in more detail.
Patient/problem
The patient/problem component can simply be specified as previously described, for example: ‘In patients with coronary heart disease …’, ‘Among children with epilepsy …’ or, from our scenario, ‘In adults with osteoarthritis of the knee …’. Sometimes, the prognosis for typical patients with the condition is quite different to the prognosis for patients with some extra characteristic. For example, the prognosis for patients with cystic fibrosis who become infected with the bacteria Burkholderia cepacia is worse than for those who do not.1 Characteristics that influence outcomes are known as prognostic factors. If you suspect that some characteristic of your patient might be a prognostic factor, this can be incorporated into the patient/problem component. Let us assume for a moment that Mrs Wilson, the patient in our scenario at the beginning of this chapter, is mildly obese. This may be a prognostic factor, so we could incorporate this into our clinical question: ‘In adults with osteoarthritis of the knee who are obese …’ In addition to comorbidities like obesity, prognostic factors can also relate to the severity of the condition, for example: ‘In patients with coronary heart disease (New York Heart Association Functional Class IV) …’. The New York Heart Association functional classification is a simple way of describing the extent of heart disease. It places patients in one of four categories based on the severity of their symptoms and how much they are limited during exercise. The history of the condition can also be a prognostic factor, for example: ‘Among children who have had their first epileptic seizure …’.
Intervention/issue
The next component of the question is the intervention/issue. If you are interested in the natural course of a condition, then you can simply add the term ‘untreated’ to your clinical question, for example: ‘In children with untreated nocturnal enuresis …’. This will remind you when you search for evidence that you are interested in prognostic evidence about untreated patients. It is logical to assume that a patient's prognosis may be affected by receiving an intervention, especially if the intervention has been shown to be effective. Therefore, a clinical question about prognosis should specify what intervention a patient has received or is receiving for their condition. In fact, some questions are only relevant to a population that has received an intervention, such as in these two examples:
and
Outcomes
The last component of a clinical question about prognosis is outcomes. It is important to consider outcomes that will have the greatest impact on the patient's goals and priorities. The prognosis can also change over time. For example, among alcoholic women who are able to stop drinking alcohol and remain abstained from it, the average improvements in memory and psychomotor speed at 1 year are minimal, while by 4 years they have usually returned to within the normal range.2 Therefore, it is sometimes worthwhile adding a timeframe to the outcome component of your clinical question.
Is this evidence likely to be biased?
We will use questions drawn from the Critical Appraisal Skills Program (CASP) and associated checklists for appraising a cohort study to explain how to assess the likelihood of bias in a prognostic study. Note, however, that the checklist for cohort studies is intended not only for use with longitudinal single-group studies, but also with other study designs such as case-control studies. Therefore, not all the questions that are raised in the checklist will be explained in this chapter. The key questions to ask when appraising the validity of a prognostic study are summarised in Box 8.1. The checklist begins with two simple screening criteria that, if not met, indicate that the article is unlikely to be helpful and that further assessment of potential bias is probably unwarranted.
As you saw in Chapters 4 and 6, there are standards for reporting of randomised controlled trials (CONSORT statement) and diagnostic accuracy studies (STARD statement). The reporting standard for observational studies in epidemiological studies is known as the STROBE statement, and there is a particular checklist for cohort studies (and checklists for other study designs such as case-control studies and cross-sectional studies). Further details are available at www.strobe-statement.org.
Did the study address a clearly focused issue?
The first criterion on the CASP checklist is whether the study addressed a clearly focused issue. For prognostic evidence, the article should clearly define the population, potential prognostic factors and the outcomes considered.
Appropriate study type
The second criterion is that the method used was appropriate to answer the question posed by the authors. In Chapter 2, we saw that longitudinal studies, particularly prospective cohort studies, provide the best evidence about prognosis. Even better than that is a systematic review of prospective cohort studies. However, currently there are so few systematic reviews of prognostic studies in this area that it is probably not realistic for you to expect to find one.
Although prospective cohort studies are typically the study type that you should use to answer prognostic questions, you should be aware that prognostic information can also be generated by other study designs. For example, if you are interested in the natural history of a condition, then the outcomes of an untreated control group in a randomised controlled trial can provide this information. Conversely, case-control studies or case series, where all cases receive a particular treatment, give prognostic information about a treated cohort.
Was there a representative and well-defined sample of participants?
The next criterion on the checklist is whether the cohort was recruited in a way that ensured it was representative of the larger population of interest. This criterion is important, as a study's estimate of prognosis will be biased if the study's sample is systematically different from (and therefore not representative of) the larger population of interest. It is important that a study clearly defines its inclusion and exclusion criteria, as this can help in recruiting a representative sample. Clearly defined criteria help make it clear to everyone (researchers, participants, you) just what the target population of the study was. A representative sample is also more likely to be obtained if the study recruits all of the eligible patients who presented at the recruitment site into the study. When appraising a study, look for a statement in the article that describes either recruiting ‘all patients’ or recruiting ‘consecutive cases’. Recruiting all eligible patients prevents bias in the data that could arise if some eligible patients avoided recruitment and these patients differ in some systematic way from those who were recruited. The greater the proportion of eligible patients that are recruited into the study, the more representative of the target population the sample is likely to be.
The problem with retrospective studies
As we saw in Chapter 2, cohort studies can either be prospective or retrospective, with retrospective studies being lower down the hierarchy of evidence for prognostic questions. The reason for this is that studies that identify patients retrospectively are more likely to have recruitment bias. This is because it is relatively common for patients with a particular characteristic to be systematically missed. As an extreme example, one retrospective study examined 81 patients with infections after total knee arthroplasty.4 Clearly, we cannot use this cohort to determine the likelihood of joint infection, because this cohort was selected to ensure that 100% of patients had an infection. It is also inappropriate to use the cohort to determine, for example, the likelihood of independent mobility 1 year after total knee arthroplasty, as the mobility of individuals with infections may differ from that of all individuals who undergo knee arthroplasty. In other retrospective studies, the cohort is selected because they presented for treatment. For example, another study examined 1012 patients who presented for treatment of knee complaints after any previous knee injury.5 The severity of the changes in bone and cartilage were compared with details in their health records to identify prognostic factors for the progression of osteoarthritis. Note that this study does not capture people who sustain a knee injury but do not present for treatment of knee complaints later, such as those who develop very mild or no osteoarthritis. The data from this study could therefore lead to excessively pessimistic predictions about the likely severity of osteoarthritis after knee injury. Instead, what is needed is a study in which patients are identified at the time of knee injury and followed for decades to assess the development of osteoarthritis.6
Was there an inception cohort?
Although it is not explicitly mentioned on the CASP checklist (but rather is covered by the question ‘Was the cohort recruited in an acceptable way?’ on the checklist), one of the things that will help you to determine whether the cohort was recruited in an acceptable way—a key issue that affects the validity of a cohort study (by minimising selection bias)—is whether there was an inception cohort. In other words, were participants recruited at a similar well-described point in the course of the disease? It is important that this was done because a group of people with the same condition may vary in their prognoses because of how long they have had the condition. Consider the scenario of a disease that is sometimes fatal, with the deaths that do occur usually being within 2 years of its onset. If we consider the prognosis for short-term mortality, it is likely to be worse in newly diagnosed patients than in those who have had the disease for 5 years. This is because the 5-year survivors have survived the ‘danger period’ and now have a short-term mortality that is similar to people without the disease. This means that, in a cohort study that recruited people with this disease, the average prognosis could be greatly affected by the proportions of participants who are newly diagnosed and participants who are chronic (that is, diagnosed some time ago) that are recruited. Some studies recruit from sources, such as patient support groups, that can bias recruitment towards these survivors, which makes any prognostic estimate favourable when this is really not an accurate estimate for this disease.
Avoiding this bias is solved by recruiting participants at a consistent and defined point in their disease. When this point is very early in the disease process, the cohort is called an ‘inception’ cohort. Some studies recruit participants at diagnosis. However, the point of diagnosis is not always at an early or a uniform point in the disease process. This is particularly the case for chronic conditions, for example rheumatoid arthritis or low back pain. You must therefore consider carefully whether a true inception cohort has been identified when recruitment occurs at diagnosis.
Was exposure determined accurately?
The next criterion on the checklist is whether exposure was determined accurately. The term ‘exposure’ can be confusing when referring to a simple prognostic cohort study, as it is more commonly considered in case-control studies. For a simple prognostic cohort study, we can think of it as whether we have accurately determined eligibility criteria (that is, the main condition or disease or event that we are interested in determining the prognosis of). In the knee arthroplasty study, the criterion amounts to whether we have accurately determined whether our patients have undergone a total knee arthroplasty for osteoarthritis. While there is probably little chance of confusion about whether someone has undergone this procedure, the diagnosis of osteoarthritis may be more prone to error. This is relevant given that other prognostic studies have shown that some outcomes after total knee arthroplasty is performed because of rheumatoid arthritis differ markedly from those outcomes that occur when the total knee arthroplasty is performed because of osteoarthritis.7
Were the outcomes measured accurately?
Accuracy is important not only in the application of eligibility criteria, but also in the measurement of outcomes. Researchers should specify and clearly define their outcomes at the start of the study. We must consider whether the outcome measures have been validated—that is, do they measure what they claim to measure? The article that you are appraising should provide details about the validity of the outcome measures that were used. The CASP checklist also suggests that we consider whether the outcomes are objective (for example, a fall) or subjective (for example, pain). Although it is not always possible, outcomes should be measured using objective criteria where possible. As the subjectivity of the outcome measures increases, the risk of bias increases. In this situation, where the outcomes are subjective and require a degree of judgment on the part of the person who is doing the assessing of the outcome, it becomes important that the assessor is blinded to the prognostic factors that each patient has. However, it can be difficult to blind assessors to certain prognostic factors of each patient, such as age and gender. Prognostic factors are explained in more detail in the following section.
When prognostic studies report dichotomous outcomes, the criterion of accuracy is that the events have been clearly defined and a reliable system for identifying them has been implemented. Otherwise, some events might have occurred but not been recorded. For example, consider a cohort study of patients who commenced non-invasive ventilation for acute respiratory failure which reported the number of patients that died during that hospital admission. As this study involved hospitalised patients, the death of a patient would have been recorded in the patient's medical record, so we could be confident about the accuracy of this outcome. Now consider a cohort study that followed up elderly patients who had received an intervention (such as home assessment and modification) to prevent falls and evaluated whether the patients sustained a musculoskeletal injury in the year following the intervention. This dichotomous outcome (did or did not sustain musculoskeletal injury) is more difficult to measure accurately than the outcome of death in the above cohort study. Even if musculoskeletal injuries were well defined and explained to patients, such injuries may not have been reported if a patient misjudged whether the injury was musculoskeletal or forgot that it occurred.
Confounding factors and prognostic factors
We saw in Chapter 2 how confounding factors are anything that can become confused with the outcome of interest and bias the results. Although the CASP checklist only refers to confounding factors, it can also be useful to consider a reasonable range of possible prognostic factors that may influence the outcome of interest in the study and check whether the study has considered (and also measured) these factors. A prognostic factor is any characteristic that can influence the outcome of interest and is associated strongly enough with the outcome that it can accurately predict the eventual development of the outcome. Note that this does not necessarily mean that the prognostic factor causes the outcome. Prognostic factors can include demographic characteristics (such as age), disease-specific characteristics (for example severity of a head injury) or whether the patient has any comorbid conditions (that is, other conditions, for example hypertension or diabetes).
Many prognostic studies will report results for various subgroups of participants who differ because of the presence of a certain prognostic factor (or factors), and the prognosis that is reported for each subgroup will probably be different. When a study reports subgroup results like this, you need to check whether the researchers did an adjusted analysis. By this we mean: did they check that these subgroup differences and predictions are not the result of another important prognostic factor? Information about any adjusted analysis that was done is usually presented in the data analysis section of an article. It is beyond the scope of this book to explain the statistical methods that are involved with adjusted analysis. If you are interested in understanding this, we suggest that you consult an additional statistical resource.
Was the follow-up of participants sufficiently long and complete?
There are two elements to this criterion, and you should assess whether the study meets both elements. You must use your knowledge about the condition of interest to judge whether the follow-up period was long enough for clinically important changes or events to occur. Consider a cohort study to determine the proportion of tracheotomised patients who can manage a speaking valve as soon as ventilatory support is weaned. The outcome from each participant can be determined within minutes. Therefore, a very short follow-up period is sufficient in this situation. Conversely, a cohort study of very low birthweight infants may need to follow participants for a decade or more to accurately assess the extent of neurodevelopmental delay.
As we saw with randomised controlled trials in Chapter 4, the greater the loss to follow-up, the greater the opportunity for bias in the results, especially if there is something systematic about those who drop out. Some experts suggest using the ‘5 and 20’ rule: a loss to follow-up of less than 5% is unlikely to influence the results much, while a loss greater than 20% starts to seriously threaten a study's validity.8 Using the same rule-of-thumb guide (where a study that has at least 80–85% follow-up is unlikely to be seriously biased) that we discussed in Chapter 4 when explaining how to evaluate the adequacy of follow-up in a randomised controlled trial is another simple way to determine whether follow-up in a prognostic study was sufficiently complete. As with randomised controlled trials, a study should also state the reasons why participants were lost to follow-up. It can also be helpful if a study provides a comparison of prognostic factors for participants who were lost to follow-up and those who were not. This information can help you to determine whether there were certain types of participants who were selectively lost to follow-up.
If you have got to this point and determined that the article about prognosis that you have been appraising is reasonably valid, you then proceed to look at the importance and applicability of the results.
What are the results?
Prognostic data can be presented in several ways, and the results of the study may have been measured using continuous or dichotomous outcomes. In a similar manner to the way in which we approached understanding the results of a randomised controlled trial in Chapter 4, when understanding prognostic results we will be looking at how to answer two main questions:
Likelihood of the outcomes over time
Regardless of the way the outcome was measured, the prognosis often changes over time. Thus, prognostic data are usually only relevant to a particular time period. For continuous outcomes, the expected value (usually the mean value) of the outcome at a certain point in time is what is usually reported. For example, men with aphasia after their first stroke showed an average improvement of 12.3 on the Aphasia Quotient 1 year after the stroke.11 The Aphasia Quotient is a measure of the severity of aphasia, rated from 0 (worst) to 100 (best). Scores above 93.8 are considered normal (non-aphasic). Where the pattern of change in the outcome is of interest, the outcome may be graphed over time (see Figures 8.2 and 8.3, later in the chapter, for graphs related to the knee arthroplasty clinical scenario).
Dichotomous outcomes can be reported as the proportion of patients who experienced the event at a particular time (that is, the risk of the event). For example, among women who develop postnatal depression, 62% are likely to still have depression 3 months later.12 Alternatively, the same information can be reported as the risk for an individual patient: for a woman who develops postnatal depression, the risk of having depression 3 months later is 62%. Where the change in risk over time is of interest, this may be graphed as a survival curve.
Survival curves are often used to present prognostic data, and they show how the likelihood of an event changes over time. Figure 8.1 shows a survival curve from a study that examined the long-term risk of dislocation following total hip arthroplasty (replacement).13 In this particular survival curve, the cumulative risk of hip dislocation following hip replacement is presented separately for females and males. You can see that at 25 years the risk of dislocation for females was 8.9% (the authors also provide the 95% confidence interval for this, 7.7% to 10.2%), whereas the risk for males was 4.5% (95% confidence interval 3.3% to 5.8%). You can also see, by looking at the slope of the curve, that female participants had both a higher early risk of dislocation as well as a higher late risk than male participants.
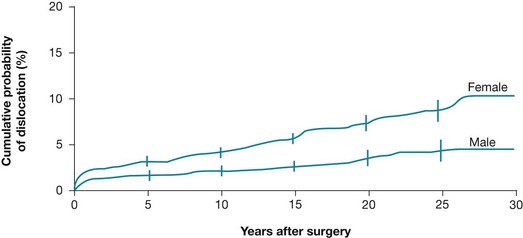
Figure 8.1 Cumulative probability of a first-time hip dislocation for female and male patients. Reproduced with permission from Berry DJ, von Knoch M, Schleck CD, Harmsen WS, The cumulative long-term risk of dislocation after primary Charnley total hip arthroplasty, The Journal of Bone and Joint Surgery, Inc.13
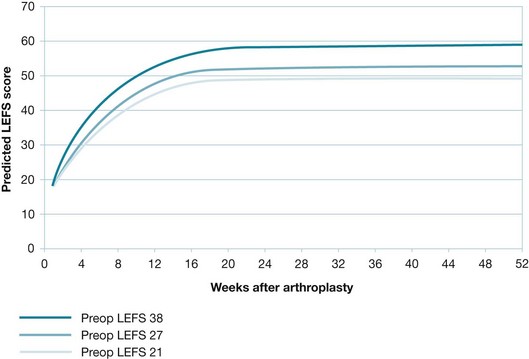
Figure 8.2 Change in average Lower Extremity Functional Scale (LEFS) scores for females (middle curve), with adjustment for higher (top curve) and lower (bottom curve) preoperative LEFS scores. Reproduced with permission from Kennedy D et al, Assessing recovery and establishing prognosis following total knee arthroplasty, American Physical Therapy Association, 2008, Fig 2b.3 This material is copyrighted, and any further reproduction or distribution requires written permission from APTA.
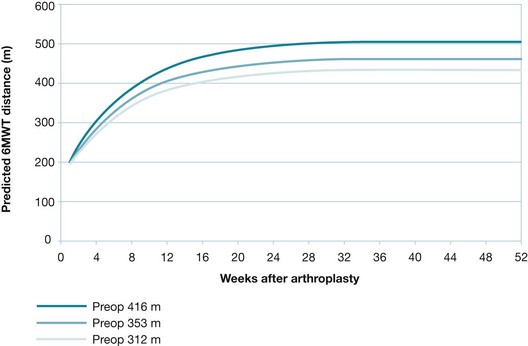
Figure 8.3 Change in average 6-Minute Walk Test: distances for females (middle curve), with adjustment for longer (top curve) and shorter (bottom curve) preoperative 6-Minute Walk Test distances. Reproduced with permission from Kennedy D et al, Assessing recovery and establishing prognosis following total knee arthroplasty; American Physical Therapy Association 2008, Fig 3b.3 This material is copyrighted, and any further reproduction or distribution requires written permission from APTA.
Precision of the estimates of likelihood
To properly interpret a prognostic study, it is necessary to know how much uncertainty is associated with its results. Just as we saw with estimates of the effect of an intervention in Chapter 4, a 95% confidence interval indicates the precision of the estimate of prognosis. As with the confidence intervals for randomised controlled trials, the larger the size of the prognostic study, the narrower (and more precise) the confidence interval will be. Confidence intervals can often be calculated if the authors of an article have not provided them.
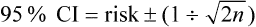
Calculating a confidence interval for continuous outcomes
For continuous outcomes, the 95% confidence interval (CI) provides the range of average values within which we are 95% certain that the true average value lies. The confidence interval can be calculated approximately using the formula:

where n is the number of patients. Let us assume in our example of aphasia in men after their first stroke that the mean improvement of 12.3 on the Aphasia Quotient had a standard deviation of 18 and was determined using data from 83 patients:
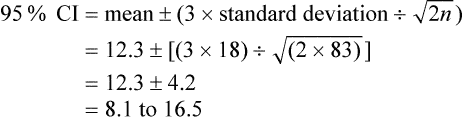
Therefore, we could expect that, in men with aphasia after their first stroke, the average level of improvement would be between 8 and 16 on the Aphasia Quotient 1 year after their stroke.
Calculating a confidence interval for dichotomous outcomes
For dichotomous outcomes, which are reported as the risk of an event, the 95% confidence interval provides the range of risks within which we are 95% certain that the true risk lies. The confidence interval can be calculated approximately using the formula:
where n is the number of patients. Let us assume, in our example of postnatal depression in women, that the 62% risk of still having depression 3 months later was determined using data from 24 patients:
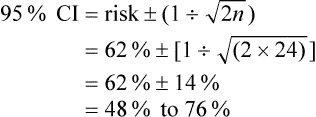
Therefore, we could assume that the risk of postnatal depression persisting for 3 months is between 48% and 76%.
Identification and analysis of prognostic factors
In prognostic studies, data about the likelihood of the outcome are typically presented first, and then an analysis of prognostic factors is presented if the study conducts such an analysis. Such data may be presented simply by reporting the prognosis for various subgroups of participants, where each subgroup has a certain prognostic factor (or if dealing with a continuous variable, varying degrees of the factor). Data about prognostic factors may also be presented in a more complex way using multivariate predictive models which assess how each prognostic factor is associated with each other prognostic factor and the overall prognosis. Explanation about multivariate analysis techniques is beyond the scope of this book.
An example of how a prognostic factor can be reported in a way that treats it as continuous data comes from a study about risk factors for hip fracture in women.14 In this study, increasing age was reported as a risk factor for hip fracture in women over 65 years of age. For every 5-year increment in age, the risk of a hip fracture increased 1.5 times. This study also treated other risk factors dichotomously. For example, having a maternal history of hip fracture was found to double a woman's risk of hip fracture.
Clinical scenario (continued)
What are the results?
In the knee arthroplasty article, the average pattern of postoperative improvement in the Lower Extremity Functional Scale is presented in a graph—see the middle curve in Figure 8.2. Note that these data are for females only. The authors elected to analyse the data for males and females separately because gender has previously been shown to influence functional mobility after total knee arthroplasty.15,16 Females had average scores of 27 preoperatively, 18 at 1 week, 38 at 6 weeks and 53 at 6 months. The 6-month value was then maintained until 12 months.
A similar pattern of improvement was seen on the 6-Minute Walk Test. Females achieved an average distance of 353 m preoperatively, 200 m at 1 week, 330 m at 6 weeks and 470 m at 6 months. The 6-month value was again maintained until 12 months. For a graph of the average pattern of improvement, see the middle curve in Figure 8.3.
In addition to gender, there is another prognostic factor for functional mobility in the postoperative period: preoperative functional mobility. The higher a patient's Lower Extremity Functional Scale score was preoperatively, the higher their postoperative Lower Extremity Functional Scale score was throughout the following year. For a graph of the average effect of preoperative Lower Extremity Functional Scale score on postoperative recovery, see the top and bottom curves in Figure 8.2. Similarly, a patient's preoperative 6-Minute Walk Test distance influenced the postoperative value—see the top and bottom curves in Figure 8.3.
For simplicity, let us assume that Mrs Wilson has average preoperative Lower Extremity Functional Scale and 6-Minute Walk Test results. It is important to remember that there is still a degree of uncertainty in using the average results for females as prognostic estimates for Mrs Wilson. For example, we have determined that her likely 6-Minute Walk Test distance at 1 year will be 470 m. The article tells us that the standard deviation around this estimate was 84.7 m and that this was determined with data from 44 female patients. Therefore, we can calculate a 95% confidence interval around that estimate.
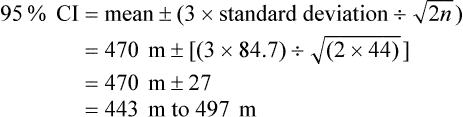
This is a reasonably precise estimate. We can be confident when discussing our estimate with Mrs Wilson, knowing that it is a good approximation of the true value that we are seeking to estimate. However, we should acknowledge and explain to her that the true average prognosis of the 6-Minute Walk Test may be a little higher or lower than our best estimate of 470 m.
How can we use this evidence to inform practice?
As we saw in Chapter 4 in the section on using evidence about interventions, before applying the evidence about interventions from a study, you need to consider whether your patient is similar to the participants in the study. The same consideration needs to occur before applying the results from a prognostic study to your patient.
Prognostic information has several uses in clinical practice. Having information about the likely clinical course of a condition can help you to determine whether intervention needs to be considered for the condition. If the prognosis for natural recovery is very good, there may be little point in starting any intervention. Similarly, if the prognosis for a cohort treated with a particular intervention is very good, then alternative or additional interventions may not need to be considered for patients who can be managed successfully with that intervention. In such cases, using the information to counsel patients and provide them with explanation and reassurance may be all that is necessary.
However, if the prognosis for the condition may be able to be improved by intervention and there are available interventions that are likely to make a clinically important difference, the information that you have about prognosis can form the starting point for a discussion with your patient. In addition to explaining what is likely to occur in the future with respect to the condition, you also need to discuss the various intervention options (if there are more than one) with your patient and engage them in the decision-making process. Shared decision making is an important component of evidence-based practice (and indeed, clinical practice in general) and further information about this and strategies to facilitate shared decision making are discussed in Chapter 14.
Central to facilitating patient involvement in decision making is communicating with patients effectively. Again, Chapter 14 provides you with a number of practical strategies that you can use to ensure that you are communicating effectively with your patients. When explaining prognostic information to a patient, it is important to do so in a manner that the patient can understand and make it relevant to the patient's goals and priorities. It is therefore good to focus on the outcomes and timeframes that matter most to the patient. In addition, if the patient has prognostic factors that affect the prognosis, it is reasonable to consider explaining their influence, especially if any of them are modifiable (for example, being overweight).
References
1. Liou, T, Adler, S, FitzSimmons, B, et al. Predictive 5-year survivorship model of cystic fibrosis. Am J Epidemiol. 2001; 153:345–352.
2. Roseribloom, M, Pfefferbaum, A, Sullivan, E. Recovery of short-term memory and psychomotor speed but not postural stability with long-term sobriety in alcoholic women. Neuropsychology. 2004; 18:589–597.
3. Kennedy, D, Stratford, P, Riddle, D, et al. Assessing recovery and establishing prognosis following total knee arthroplasty. Phys Ther. 2008; 88:22–32.
4. Segawa, H, Tsukayama, D, Kyle, R, et al. Infection after total knee arthroplasty. A retrospective study of the treatment of eighty-one infections. J Bone Joint Surg Am. 1999; 81:1434–1445.
5. Roos, H, Adalberth, T, Dahlberg, L, et al. Osteoarthritis of the knee after injury to the anterior cruciate ligament or meniscus: the influence of time and age. Osteoarthritis Cartilage. 1995; 3:261–267.
6. Gelber, A, Hochberg, M, Mead, L, et al. Joint injury in young adults and risk for subsequent knee and hip osteoarthritis. Ann Intern Med. 2000; 133:321–328.
7. Bullens, P, van Loon, C, de Waal Malefit, M, et al. Patient satisfaction after total knee arthroplasty. J Arthroplasty. 2001; 16:740–747.
8. Straus, S, Richardson, W, Glasziou, P, et al. Evidence-based medicine: how to practice and teach EBM, 4th ed. Edinburgh: Elsevier Churchill Livingstone; 2011.
9. Robertsson, O, Knutson, K, Lewold, S, et al. The Swedish Knee Arthroplasty Register 1975–1997. Acta Orthop Scand. 2001; 72:503–513.
10. White, R, Romano, P, Zhou, H, et al. Incidence and time course of thromboembolic outcomes following total hip or knee arthroplasty. Arch Intern Med. 1998; 158:1525–1531.
11. Pedersen, P, Vinter, K, Olsen, T. Aphasia after stroke: type, severity and prognosis. Cerebrovasc Dis. 2004; 17:35–43.
12. Holden, J, Sagovsky, R, Cox, J. Counselling in a general practice setting: controlled study of health visitor intervention in treatment of postnatal depression. BMJ. 1989; 298:223–226.
13. Berry, J, Von Knoch, M, Schleck, C, et al. The cumulative long-term risk of dislocation after primary Charnley total hip arthroplasty. J Bone Joint Surg Am. 2004; 86:9–14.
14. Cummings, S, Nevitt, M, Browner, W, et al. Risk factors for hip fracture in white women. N Engl J Med. 1995; 332:767–774.
15. Kennedy, D, Stratford, P, Pagura, S, et al. Comparison of gender and group differences in self-report and physical performance measures in total hip and knee arthroplasty candidates. J Arthroplasty. 2002; 17:70–77.
16. Kennedy, D, Hanna, S, Stratford, P, et al. Preoperative function and gender predict pattern of functional recovery after hip and knee arthroplasty. J Arthroplasty. 2006; 21:559–566.
17. Stratford, P, Hart, D, Binkley, J, et al. Interpreting Lower Extremity Functional Status score. Physiotherapy Canada. 2005; 57:154–162.
18. Bohannon, R. Six-minute Walk Test: a meta-analysis of data from apparently healthy elders. Topics Geriatric Rehabil. 2007; 23:155–160.