Talking with patients about evidence
After reading this chapter, you should be able to:
• Describe why it is important that health professionals communicate effectively with their patients
• Understand what is meant by the term patient-centred care
• Explain what is meant by shared decision making and discuss some of the challenges associated with it and the strategies that can be used to facilitate it
• List the key communication skills needed by health professionals when talking with patients about evidence
• Describe the various methods that can be used for communicating information to patients, the main considerations associated with each method, and the major factors that should be considered when deciding which communication tool(s) to use with a patient
• Explain how to effectively communicate statistical information to patients
At the heart of the definition of evidence-based practice that was provided in Chapter 1 lies the involvement of patients and the consideration of their values and preferences when making decisions regarding their health care. As part of the health care that they are receiving, patients often need to make decisions about aspects of their health care, such as whether to proceed with a particular intervention. Many patients and their families find it difficult to take an active part in healthcare decisions.1 A health professional's ability to communicate effectively with patients and, often, also their family members is crucial to the successful involvement of patients in these decisions.1 For these decisions to be fully informed and ones with which the patient is involved, patients need to know about the benefits, harms and risks and uncertainties associated with the various intervention options.1 Even when a decision about intervention is not needed, there are often many other aspects of their health care that patients can benefit from being knowledgeable about. Many patients and their families have only a limited understanding about health and its determinants, and do not know where to find information that is clear, trustworthy and easy to understand.1 Individualised education that is specific to the disease and the patient is able to improve a patient's self-efficacy to manage chronic conditions, assist with short-term behaviour change, improve quality of life and reduce morbidity and healthcare utilisation.2 Effective communication can also help to build trust between patients and health professionals, make clinical practice more effective and reduce clinical mishaps and errors.3
Despite its importance, many health professionals are not specifically trained in how to effectively communicate with patients, and many patients do not know how to communicate with health professionals. Therefore, we have devoted a chapter of this book to this topic so that, when you are interacting with patients, you are aware of the importance of talking with your patients about evidence and are knowledgeable about the skills and resources that can assist you to do this successfully. In this chapter, we will discuss why effective communication is important, outline the steps to communicating effectively with patients and discuss some of the key communication skills that health professionals need, including sections on how to decide which communication method and tool(s) to use and how to communicate statistical information to patients. We will also outline the concept of patient-centred care and one of the skills that is often central to achieving this, namely shared decision making.
Why is effective communication so important?
Many people do not think of communication as a particularly important or specialised skill for health professionals to have, and often health professionals do not give it the emphasis that it needs. Health professionals often think of communication as secondary to their ‘real’ job of caring for patients. However, the success of an intervention is frequently dependent on the health professional successfully providing the patient with appropriate information. In addition, health professionals often do not realise that, as with many of the other interventions that they provide to patients, there are theories and principles that should be used to guide communication with patients.
Effective communication is central to a ‘patient-centred’ approach by health professionals. The evolution and benefits of patient-centred care are discussed in the following section.
Patient-centred care
Patient-centred care (also commonly referred to as client-centred care or patient-centred practice) is a broad umbrella term reflecting a particular approach to the health-professional–patient relationship that implies communication, partnerships, respect, choice and empowerment and a focus on the patient rather than their specific clinical condition.4 Patient-centred practice by health professionals reflects their commitment to quality care by the way they respect patients' needs, goals, values, expectations and preferences and involve patients in the decision-making process.5
Central to patient-centred care is treating patients with dignity, responding quickly and effectively to patients' needs and concerns6 and providing patients with enough information to enable them to make informed choices about their health care.7 Patient-centred care has become the model that is advocated by health professionals and health professional associations. This model of care sits between the ‘paternalistic’ and ‘informed patient or independent choice’ models of care.8,9 In the traditional ‘paternalistic’ model of care, the health professional is in control, discloses information as and when suitable and makes the decisions for the patient who is expected to be passive, unquestioning and compliant. At the other end of the spectrum is the ‘informed patient or independent choice’ model, in which health professionals present the facts and leave the decision making solely up to the patient.8
There is emerging evidence of the benefits of patient-centred care to health professionals and patients. Patient-centred practice can increase patient satisfaction and quality of life, reduce patient anxiety and improve symptom resolution, pain control, function and physiological measures and improve adherence to long-term medication use.4,10 For health professionals, patient-centred practice can contribute to more appropriate and cost-effective use of health services, such as reducing the number of diagnostic tests and unnecessary referrals.10,11 Features of patient-centred practice include shared decision making and tailoring communication and education to the needs, abilities and preferences of the patient, each of which will be discussed in the following sections of this chapter.
Shared decision making
Shared decision making refers to clinical decision making as a partnership between the patient and the health professional, with communication focused on achieving shared understanding of treatment goals and plans.12 The ultimate goal of shared decision making is for health professionals to make decisions that are consistent with the wishes of patients,13 and ones which respect patients' autonomy.14 Shared decision making allows patients the opportunity to ask questions and to express their values, preferences and personal circumstances.1 Patient involvement in the decision-making process often extends beyond just choosing treatment options and can also involve:8
• recognition and clarification of the health issue
• identification of possible solutions
• appraisal of possible solutions
Many leading health organisations now advocate patient participation in clinical decision making. These include the National Health and Medical Research Council of Australia,3 the USA Preventive Services Taskforce,8 the American Medical Association15 and the General Medical Council of the UK.16 In 2011, the Salzburg Global Seminar published the Salzburg Statement on Shared Decision Making, which calls on patients and health professionals to work together to be co-producers of health.1
Shared decision making between patients and health professionals has been linked with improved patient outcomes, for example improved control of hypertension,17 better compliance,18,19 greater family satisfaction with communication,20 improved emotional status21 and reduced visits to emergency departments,22 use of medications,22 hospital admissions23 and total medical costs.23 However, shared decision making is not possible in all clinical encounters, nor is it welcomed or desired by all patients. The next section presents some of the challenges that can be associated with shared decision making.
Shared decision making: the challenges
Challenges related to the availability of evidence
Sometimes shared decision making can be relatively straightforward, for example in common health problems where there is only one course of action or where the evidence is clear and most informed health professionals and patients would agree that the benefits outweigh the harms.24 In other situations, shared decision making can be more difficult. For example, with some chronic conditions the research evidence that is provided by randomised controlled trials and systematic reviews often fails to endorse one intervention, and instead highlights the benefits and harms of a number of interventions. While difficult, shared decision making can be particularly valuable in these situations, with health professionals helping patients to understand the risks, benefits and trade-offs of the various interventions.18 Finally, for some medical conditions there may not be sufficient evidence about the benefits and harms of intervention options, in which case the health professional needs to assist the patient to assess this uncertainty against the patient's values and preferences.24
Patients' involvement in shared decision making
Shared decision making is not always possible, for example in medical emergencies or with patients who do not have the cognitive capacity to participate. Further, shared decision making is not always welcomed or desired by patients. In a nationally representative sample of 2750 adults in the USA, it was found that while 96% of the participants wanted to be asked for their opinions and offered choices, half preferred to rely on their doctors for information and half wanted to leave the final decisions up to their doctors.25 Patients' preferences for involvement in decision making were found to differ by health status and socio-demographic characteristics. For example, patients who were in poorer health, male, older than 45 years of age and with fewer years of education were less likely to want to participate in shared decision making. More recently, in a 2010 patient survey by the Care Quality Commission in the United Kingdom, 48% of inpatients reported wanting more involvement in decisions about their care.26 A systematic review of studies on patient preferences for shared decision making found that in 63% of studies, the majority of patients preferred to participate in shared decision making with their health professionals. Furthermore, the number of patients who prefer to make shared decisions appears to have increased over time. The majority of patients want to discuss their options and receive information, even though they may not wish to be responsible for making the final decision.27
Individual patients may also vary in the degree to which they want to participate in shared decision making, depending upon the specific clinical situation.3 Indeed, shared decision making may be more easily conceptualised as a continuum, whereby decision making can be health professional or patient driven (at extreme ends of the continuum) or driven by the many combinations in between.13 This illustrates the need for you, as a health professional, to determine the role that each of your patients wishes to take in the management of their health. A simple question that you can ask to help establish this is ‘How do you feel about being involved in making decisions about your treatment?’28
It is worth pointing out that shared decision making may also have unwanted effects. For example, once patients are fully informed about benefits, harms and risks, they may still decide not to undertake treatment for a health condition or to have a screening test because they are at low risk of developing future problems.29 It has been suggested that this expression of ‘fully informed choice may sometimes frustrate the health professional’,29 as it can lead to some patients choosing a path that results in harm or death. A clear example of this is when patients reject the need for blood transfusions due to religious beliefs.
Shared decision making also has legal implications, in particular concerning informed consent. Health professionals have been found legally liable for damages in instances where inadequate information has been provided to patients and harm has arisen following intervention.30 The High Court of Australia has referred to the importance of shared decision making, defining it as ‘a shared exercise in which healthcare practitioners are obliged to take active steps to ensure that patients are empowered to make their own decisions about important procedures to be undertaken on their bodies’.30
The complexities of patient and health professional involvement in shared decision making
Shared decision making is a complex process which involves not only the patient's values and preferences, but also their feelings and views about their relationship with the health professional and the degree of effort that both parties put into the decision-making process and the communication between them.8 Box 14.1 provides some examples of the complexities in health-professional–patient relationships that can influence shared decision making.8
Strategies to assist shared decision making
As a health professional, there are various strategies that you can use to facilitate effective shared decision making and these are presented in Box 14.2.13,18,20,21,31–33 Central to successful shared decision making is effective communication, which involves communicating the evidence to patients and actively listening to patients' concerns. Effective communication is informed by how patients prefer to receive information and their ability to understand it. These issues are described in more detail later in this chapter.
Assessment tools for health professionals to use in shared decision making
A number of scales have been developed to assess the involvement of patients and health professionals in shared decision making. The scales in these two areas will be discussed separately and one example of each will be described in detail. These scales can also assist you by providing examples of questions that you can ask and competencies you can aim for in your own clinical practice.
Scales to measure health professionals' involvement in shared decision making
In a 2001 systematic review, eight instruments that assess various aspects of clinical decision making were described, but the authors of the review concluded that none of the eight instruments sufficiently captured the concept of whether the health professional encouraged patient ‘involvement’ in the decision-making process.33 The authors of the review subsequently developed and revised the 12-item OPTION (Observing Patient Involvement in Decision Making) scale to measure the extent that a health professional engages in shared decision making during patient consultations.34,35 Examples of the 12 ‘competencies’ that are assessed in OPTION are:
• Item 1: The health professional draws attention to an identified problem as one that requires a decision-making process.
• Item 3: The health professional assesses the patient's preferred approach to receiving information to assist decision making.
• Item 5: The health professional explains the pros and cons of options to the patient (taking ‘no action’ is an option).
• Item 10: The health professional elicits the patient's preferred level of involvement in decision making.
Each ‘competency’ is rated by observers on a scale that measures the order of magnitude to which the health professional demonstrates the skill. The scale is as follows:
0—‘The behaviour is not observed’
1—‘A minimal attempt is made to exhibit the behaviour’
2—‘The health professional asks the patient about their preferred way of receiving information to assist decision’
3—‘The behaviour is exhibited to a good standard’
4—‘The behaviour is observed and executed to a high standard’.
Scales to measure patients' involvement in shared decision making
Questionnaires have been developed to assess patients' satisfaction with decision making,36 degree of decisional conflict,37 perceived involvement in care,38 risk communication and confidence in decision making28 and the extent of shared decision making.39 One of these will now be further described.
The COMRADE (Combined Outcome Measure for Risk Communication and Treatment Decision Making Effectiveness) was developed by combining items from some existing shared decision-making scales and constructs identified by patients during focus groups.28 It consists of 20 statements that represent two broad aspects of decision-making effectiveness—risk communication and confidence in the decision.
Each statement is scored on a five-point Likert scale from 1 (strongly agree) to 5 (strongly disagree). While the original scale statements use the term ‘doctor’, the COMRADE can be used by all health professionals. Examples of the 20 statements are as follows.
Statements about risk communication:
• The health professional gave me enough information about the treatment choices available.
• The health professional gave me the chance to express my opinions about the different treatments available.
• The health professional gave me the chance to decide which treatment I thought was best for me.
Statements about confidence in decision making:
• I am satisfied that I am adequately informed about the issues important to the decision.
• I am satisfied with the way the decision was made in the consultation.
• I am sure that the decision is the right one for me personally.
The COMRADE is intended to be used in conjunction with three other relevant instruments, the SF-12 measure of quality of life, the short-form anxiety instrument and the patient enablement instrument (see the reference that describes the COMRADE28 for more details).
Key steps to communicating evidence to patients effectively
A five-step model for communicating evidence to patients in a way that facilitates shared decision making has been proposed40 and is presented below. Although the model was developed as a guide for medical practitioners who are consulting with patients and helping them to make healthcare decisions, the key principles of the model can be used as a guide for any health professional who is communicating evidence to a patient.
1. Understand the patient's (and family members') experiences and expectations.
You need to take the time and make the effort to understand the needs, fears, experiences, expectations and values of your patient.
Rather than just providing information to your patient in an old-style paternalistic manner, you should try to gain your patient's trust and build a partnership with them. Activities that may assist with this include: encouraging partnership (for example, ‘This is a decision that we need to make together’), acknowledging the difficulty of the situation/decision that is being discussed, expressing empathy and expressing mutual understanding (for example, ‘I think I understand …’).40
3. Discuss the evidence, including a balanced discussion about uncertainties.
In addition to answering your patient's questions, you should also discuss issues that they may not have thought to ask or are reluctant to bring up. A discussion of the evidence needs to include a simple explanation of the uncertainties surrounding the evidence, but be aware that overemphasising the uncertainty can cause some patients to lose confidence.40 Using an appropriate method to communicate statistical information can be beneficial at this stage and a discussion of the various methods for doing this are explained in a later section of this chapter.
Obviously a healthcare decision does not need to be made every time that you communicate evidence to a patient, particularly if it is evidence related to a prognostic or qualitative information need that you or your patient had. However, when the clinical question is about the effect of an intervention, a decision may need to be made. This step should only occur after you have integrated the best quality clinical evidence that is available for the issue with your patient's values and preferences. You should explain how your recommendation has been generated from both the evidence and your patient's values.40 In situations where the evidence is uncertain or contradictory and you do not have a specific recommendation, you should present each of the options neutrally.
5. Check for understanding and agreement.
It is important to confirm that your patient has understood the information that you have presented to them. You may wish to ask your patient to briefly summarise their understanding of the information for you. You may need to repeat the information, explain it in a different way or provide more-detailed information. There are various communication tools that can be used to share information with patients and, in some cases, help them to make decisions. These tools are discussed in a later section of this chapter.
Key communication skills needed by health professionals
In addition to the general communication and relationship-building skills that you should have as a health professional, some of the key skills that you need when talking with your patients about evidence are listed in Box 14.3.
Methods for communicating information
There are various formats that you can choose to use when providing patients with information with the aim of increasing their knowledge and understanding of the evidence related to their situation. Using more than one method to provide the information can be a valuable way of increasing patients' retention of the information.41
Verbal information
Verbal education is the method that is most commonly used by health professionals for providing information. There are some general points that you should follow when providing patients with information verbally to improve the effectiveness of the information exchange42 and these are listed in Box 14.4.
One of the major limitations of providing information verbally is that people often forget what they have been told. It has been estimated that most people remember less than a quarter of what they have been told.43 For this reason, using written materials to supplement or reinforce information that has been presented verbally is recommended.44
Combination of verbal and written information
The combination of verbal and written information has the potential to maximise a patient's knowledge.36,45 For example, a Cochrane systematic review that evaluated the effect of providing written summaries or recordings (such as an audiotape) of consultations for people with cancer found that the majority of participants in the trials who received recordings or summaries used and valued them as a reminder of what was said during the consultation.46 Most studies found that patients who were given the summaries demonstrated better recall of information and reported greater satisfaction with the information received during the consultations.46 However, none of the studies in the review found that the summaries had a statistically significant effect on anxiety, depression or quality of life.46
Written information
Appropriate readability and design of written materials
There are many forms that written information can take, such as a pamphlet, booklet, printed information sheet or information from internet sites. Regardless of the form, for written information to be useful to patients they need to notice, read, understand, believe and remember it. Many written materials that health professionals use with patients are written and designed in a way that can make it difficult for patients to understand the content they contain. One of the most common problems is that many health education materials are written at a reading level that is too high for the majority of the patients who receive them.47,48 A fifth- to sixth-grade reading level (approximately a 10- to 11-year-old reading age in countries such as Australia) is recommended for written health information. There are various readability formulas that can be used to quickly and easily assess the readability of written information, including the SMOG49 and the Flesch Reading Ease formula50 (available in Microsoft Word).
In addition to readability, there are many other features of written patient health education materials that need to be given appropriate consideration in order to maximise the usefulness of the materials for patients. This includes features such as:
• the content in the material (for example, is it evidence-based?)
• the language used (for example, what types of words are used and how are sentences structured?)
• the organisation of content (for example, are bulleted lists used where possible?)
• the layout and typography throughout the material (for example, is an appropriate font size used throughout?)
• the illustrations within the material (for example, is each illustration appropriately labelled and explained in the text?)
• the incorporation of learning and motivation features into the content (for example, are there features in the material that actively engage the reader?)
It is beyond the scope of this chapter to discuss these features in detail. However, summaries of this information are readily available,51 and there are a number of checklists that can be used to assess the quality of the written information that is used with patients.51–53
Assessing the quality of written information about treatment choices
In addition to having appropriate readability and design, it is important that written health information is evidence-based. DISCERN is a questionnaire designed to assess the quality of written information on treatment choices for a health problem. It consists of 16 items, each scored on a 5-point scale. Box 14.5 lists the main points that are covered in the DISCERN questionnaire.54 The full questionnaire is available on the DISCERN website (www.discern.org.uk).
Computer-based information
In addition to accessing health information from the internet, there are other ways that computers can be used as a health information resource for patients. For example, providing patients with computer-generated interactive patient education materials (see, for example, the systematic review by Treweek and colleagues55) or with tailored printed information (see, for example, the system described by Hoffmann and colleagues56). There is preliminary evidence that computer-tailored education materials can be effective in changing various behaviours such as physical activity, short-term dietary behaviour and safe-sex behaviours,57–60 although intervention features such as intensity can influence whether this type of intervention is effective. Interactive computer-based health information interventions can have a positive effect on health knowledge, social support and behavioural outcomes (such as changes in diet and exercise) for patients with chronic diseases.61 Computer-based materials can also be used to assist patients to make health-related decisions. More information about this is provided in the later section of this chapter about decision aids.
Internet-based health information
As much health information is obtained from the internet,62 you should be prepared to evaluate health information from the internet that patients may bring with them and also to evaluate health information websites prior to recommending them to patients. There are various criteria that can be used to evaluate health information websites, and these criteria relate to the content of the website including an evaluation of its descriptive content, accuracy and completeness;63 the credibility of the website's authors, disclosure on the website and the design and aesthetics of the website.41 For internet sites that contain information about treatment options for a health problem, the DISCERN questionnaire (as shown in Box 14.5) can also be used to evaluate these sites.
As recommending health information websites to patients is now a common occurrence during health-professional–patient consultations, the following resources may be of use to you:
• The Cochrane Consumer Network (www.consumers.cochrane.org)—is aimed at helping patients to make informed decisions and provides a plain language summary of Cochrane reviews.
• MedlinePlus (www.nlm.nih.gov/medlineplus)—a free service provided by the US National Library of Medicine that offers web links that meet pre-established quality criteria to health information on the internet. It is designed to help provide high quality health information to patients and their families. Health professionals can also use this site to obtain quick and easy access to images or videos to help when providing information to patients.
• Health on the Net (HON) Foundation (www.hon.ch)—a foundation aimed at guiding internet users to reliable, understandable, accessible and trustworthy sources of health information. Using the HONcode (which consists of eight principles), the foundation evaluates websites and those that meet the criteria become accredited websites and can display the HON logo. On this site you can also access HONmedia (www.hon.ch/HONmedia), which contains a wide selection of medical illustrations that can be used when educating patients.
• HealthFinder (www.healthfinder.gov)—a US government gateway site to reliable health information resources that have been reviewed by HealthFinder staff.
Interactive computer-based information
Compared with standard verbal or written methods of providing information, interactive computer-based information has been found to significantly increase patients' knowledge, understanding and satisfaction.64,65 The use of computer programs to provide patients with interactive health information is generally well accepted by patients65 and often preferred to reading a booklet or watching a videotape.66
Tailored print information
Tailored information is information which is customised according to an individual's characteristics or preferences. Although it is not essential to use a computer to provide patients with tailored information, doing so can make the process of tailoring information to individual patients' needs quick and easy. There is evidence that, compared with non-tailored information, tailored print information is better remembered, read and perceived as relevant and/or credible.67 Tailored information is also more likely to influence changes in health behaviour67,68 and result in greater patient satisfaction with the information that is provided and in better-met informational needs.69 However, the effectiveness of tailored information is moderated by a number of variables such as the type of health behaviour, patient population and theoretical concepts which are being tailored.67
DVDs/videotapes and audiotapes
Use of media such as digital video discs (DVDs), videotapes and/or audiotapes can be a useful method for providing information to patients, particularly patients who have a low literacy level or English as a second language, or those who have an auditory (if audiotape) or visual (if DVD) learning style. There is some evidence that using formats such as videotapes or DVDs can improve patient outcomes such as knowledge and satisfaction,70 and clinical outcomes such as reducing in-hospital falls.71
Decision aids
What are decision aids?
For people who are facing decisions about the best way to manage their health, whether it is a decision about treatment or about screening, decision aids are a communication tool that may be of some assistance for patients in certain situations. Decision aids are interventions designed to help patients make decisions by providing them with information about the options and about the personal importance of possible benefits and harms, and encouraging their active participation in the decision-making process together with their health professional.72 Decision aids may be paper-based (such as a pamphlet) or involve a video (often with accompanying printed information). However, the majority of decision aids are internet-based.
What outcomes can decision aids have an effect on?
A Cochrane systematic review that evaluated the effectiveness of decision aids concluded that, compared with usual care, decision aids assist patients to have a greater knowledge of their options, more-realistic expectations of possible benefits and harms and make choices which better reflect their personal values and preferences, with no adverse effect on their health outcomes or satisfaction.72 Decision aids were also found to increase patient communication with health professionals and participation in collaborative decision making.72
Finding decision aids
Currently, the majority of decision aids that exist are on topics that are most appropriate for medical practitioners to discuss with their patients (for example, deciding between various treatments for cancer or deciding whether to receive hormone replacement therapy). However, other health professionals such as nurses and allied health professionals may find some of the decision aids that are currently available also useful in their clinical practice. For example, there are decision aids available on topics such as deciding about nursing-home care for a family member who has dementia, options for managing back pain and options for managing carpal tunnel syndrome.
New decision aids are continually being developed, so when you have a patient who needs to make a healthcare decision it is worth searching on the internet to see if there is a relevant decision aid. A recommended resource is the Ottawa Health Research Institute (www.ohri.ca/decisionaid), which maintains an inventory of decision aids. The Wiser Choices Program from the Mayo Clinic Shared Decision Making National Resource Center (kercards.e-bm.info) has also developed a number of useful decision aids.73
Using decision aids
As with other patient-education resources, if you are considering using a decision aid with a patient there are a number of factors that you need to take into account. These are detailed in the section below. If you choose to use a decision aid with a patient, you need to ensure that it is of good quality. A set of criteria, known as the CREDIBLE criteria, has been developed for assessing the quality of decision aids; full details of the criteria are available in the Cochrane review on decision aids that was discussed earlier.72 The main criteria are:
Decision aids, particularly internet-based ones, are a relatively new tool that can be used for communicating evidence to patients and enabling them to participate in making decisions about their health care. However, there are many gaps in the research related to decision aids, such as how they affect health-professional–patient communication, factors that determine the successful use of decision aids in practice, and what types of decision aids work best with different types of patients.72
Deciding which communication tool(s) to use with your patients
As discussed earlier in this chapter, there are various communication tools that you may choose to use when providing patients with information. Your choice will be influenced by a number of factors, including:
• patient's preference—this may also be influenced by your patient's preferred learning style (for example, visual or auditory), cultural background, level of motivation, cultural background and primary language
• patient's literacy level and education level—see below for more information
• patient's cognitive ability and any impairments they have that may affect their ability to communicate, understand or recall information or make decisions—see below for more information
• the educational resources/communication tools that are available to you
Literacy levels
If written (or printed or computer-based) health-education materials are used to provide information or supplement information that is provided verbally, the literacy levels of the patients who are receiving the information need to be considered. Written materials will not benefit patients if they are unable to understand them. However, health literacy encompasses more than general literacy skills. There are various definitions of health literacy. The US Institute of Medicine has defined health literacy as the degree to which individuals have the capacity to obtain, process and understand the basic information needed to make appropriate decisions about their health.74 You should be aware of your patient's literacy skills so that you can alter the educational intervention accordingly.75 There are a number of resources that provide strategies for how to do this—for example, see the publication by Fischoff and colleagues.76 Be aware that people with poor literacy often use a range of strategies to hide literacy problems75 and are often reluctant to ask questions so as not to appear ignorant.77
Although literacy levels can be influenced by educational level, low health-literacy levels can be found at all levels of educational attainment.78 Therefore, it is recommended that you assess patients' reading skills using one of the published tests that have been designed to do this, rather than relying only on their self-reported level of education.77,78 Commonly used tests include: the Rapid Estimate of Adult Literacy in Medicine (REALM),79 the Test of Functional Health Literacy in Adults (TOFHLA)80 and the Medical Achievement Reading Test (MART).81 Recently, the use of a brief and simple screening tool to assess health literacy has been developed and validated among patients with heart failure.82 This tool consists of the three items, each scored on a 5-point scale (with higher scores indicating lower literacy): (1) How often do you have someone help you read hospital materials?; (2) How often do you have problems learning about your medical condition, because of difficulty reading hospital materials?; and (3) How confident are you filling out forms by yourself? All of these tests evaluate a patient's ability to understand medical terminology and are quick and straightforward to administer and score.
Impairments which may affect communication
Your patient may have one or more impairments that can affect how they are able to process information. This can include cognitive, hearing, visual or speech and language impairments. You need to consider how the presence of one or more of these impairments may result in the need for you to alter how you communicate with your patient and which communication tool(s) you choose to use. There are various strategies that you can use to facilitate communication with patients who have one or more of these impairments; however, it is beyond the scope of this chapter to detail these. Further reading about strategies specific to different impairments is recommended; for example, refer to the patient education book by McKenna and Tooth.83
Time-related issues
Time-related issues include both the amount of time that is available for communicating with your patient and the timing of communicating with your patient. Patients' needs vary at different times. For example, patients' informational needs during an initial consultation are different to their needs after a diagnosis or during follow-up consultations or treatment sessions. There may be various points in time (for example, after a diagnosis or when feeling acutely unwell) when patients are unable to process much information. You should be sensitive to when this may be the case and adapt your communication with the patient accordingly. Providing only the most essential information may be sufficient initially. More-detailed information can be provided to your patient at a later, more appropriate time.
Various communication tools may also be indicated at different times. For example, verbal information is usually the main format that is used during initial consultations with patients, but in between subsequent consultations, patients may be given written information or referred to recommended internet sites. This may be useful as a reinforcement of information already provided, to answer some of the patient's questions and/or to generate more questions which can be discussed the next time that they see you.
Communicating statistical information to patients
Patients expect information about benefits and risks that is (as far as possible) accurate, unbiased, personally relevant to them and presented in a way that they can understand.3
Communicating statistical information, most notably information about probabilities and risks, in a manner that patients can understand is an area that health professionals need to be aware of. There are many examples of statistical information about health being presented in a non-transparent and/or incorrect manner by health professionals, public figures and journalists who write stories about health (for a good overview, see the article by Gigerenzer and colleagues;84 Gigerenzer has also written an excellent book which is recommended at the end of this chapter). The impacts of incorrectly presented and/or misunderstood health statistics are many, including:
• incorrectly heightened or lowered appreciation of risk and the associated emotional reactions and health decisions that can occur
• impediments to shared decision making and informed consent procedures, and
There are often differences between how health professionals and patients understand probability and risk. Many health professionals have been trained to understand these as mathematical probabilities of an event happening within a whole population. Health professionals subsequently tend to view these statistics as objective and impersonal. Conversely, patients' views and understanding of these concepts are commonly influenced by emotions, anxieties, concerns about the future, what they have seen and heard reported in the media and by the views of their social networks. Indeed, patients often personalise risk and are less interested in what happens to ‘populations’.3 Information about risks can also be hard for patients to understand when they do not have previous experience to compare the numbers against; for example, if the risk of an event is 20%, patients may not know whether this is relatively high or low.3 Finally, for allied health professionals the responsibility for a good health-professional–patient information exchange process may be even greater in cases where patients have not had a prior referral from a medical practitioner and may have no understanding about the possible risks of treatments.30
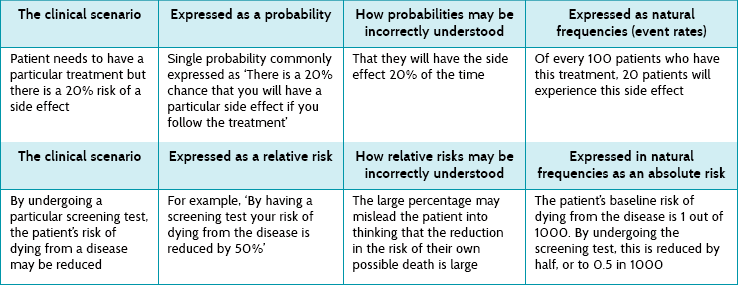
There are different types of statistical information that health professionals need to communicate to patients. The next section describes frequently used statistics and how patients may misinterpret the meanings. Table 14.1 presents strategies that you can use to simplify how you present this information.
TABLE 14.1:
The problem of probabilities and risk and how using natural frequencies can help when explaining this type of information
Types of data that health professionals use and how to present them to patients
Probability
Probability refers to the chance of an event occurring. Values for probability lie between 0 and 1 and are often presented as a percentage. For example, a probability of 0.5 may be expressed as 50%.
Probability can occur as a single probability or as a conditional probability. Consider the situation where a patient wants to know the likelihood of side effects that they might experience in relation to an intervention. An example of single probability is that there is a 20% chance that the patient will have a particular side effect if they receive a certain intervention. The problem with this concept is that how it should be interpreted may be confusing.86 For example, a patient may interpret this as meaning that 20% of patients will have the side effect or that all patients will have the side effect 20% of the time. The latter interpretation reflects the ‘personal’ as opposed to ‘population’ view that patients tend to have.87 Conditional probability refers to the probability of an event, given that another event has occurred. An example of conditional probability is if a person has a disease, the probability that a screening test will be positive for the disease is 90%.
Risk of disease/side effect
Risk of disease (or side effect) refers to the probability of developing the disease (or side effect) in a stated time period. As we saw in Chapter 4, risk is often presented either as absolute risk or relative risk. When referring to the risk of a disease or a side effect, these concepts can be interpreted as follows:
• Absolute risk refers to the incidence (or natural frequency) of the disease or event in the population.
• Relative risk is the ratio of two risks (or, as we saw in Chapter 4, the flip side of the concept of relative risk is relative benefit): the risk in the population exposed to some factor (for example, having received a particular intervention) divided by the risk of those not exposed. Relative risk gives an indication of the degree of risk.
• If the relative risk is equal to 1, the risk in the exposed population is the same as the unexposed population.
• If the relative risk is greater than 1, the risk in the exposed population is greater than it is for those in the unexposed population.
• If the relative risk is less than 1, the risk in the exposed population is less than it is for those in the unexposed population.
Box 14.6 illustrates an example of relative risk.
Box 14.6 Example of relative risk
Incidence of a side effect among people exposed to medication 
Incidence of a side effect among people not exposed to medication 
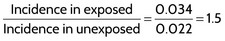
Therefore, in people who have taken the medication, the risk of having the side effect is 1.5 times greater (or a relative risk increase of 50%) than in those people who have not taken the medication.
Absolute risk: natural frequencies (incidence) versus probabilities (chance)
There is a general consensus that presenting natural frequencies (for example, 5 out of every 100 people) is preferable to probabilities or percentages (for example, 5%). A recent Cochrane systematic review of alternative statistical formats for presenting risk and risk-reduction information found that natural frequencies were better understood by health consumers and health professionals than probabilities/percentages in the context of making decisions about diagnostic or screening tests.88 This review included eight trials and the authors concluded that there was a moderate effect size for this finding. However, a recent randomised trial of community-based adults found percents to be better understood than natural frequencies.89 It also found that presenting both formats together led to better comprehension than natural frequencies alone. An important limitation to this trial was that it did not test comprehension in a setting of medical decision making and was an internet-based cross-sectional survey. Thus, while more research is obviously needed on determining the optimal way to present information, it would seem that having a flexible approach which utilises combined formats and assesses patients' comprehension of the content that is presented is warranted.
Relative risk reductions (or increases) versus absolute risk reductions (or increases)
This same Cochrane systematic review of alternative statistical formats88 also assessed the impact of presenting absolute risk reduction versus relative risk reduction on understanding, perception and persuasiveness. The settings were clinical decision making scenarios regarding diagnostic and screening tests by health consumers and health professionals.88 The review found moderate to strong evidence that while absolute risk reduction and relative risk reduction were equally understood, health consumers and health professionals were likely to perceive interventions to be more effective and be more persuaded to use or prescribe a treatment when presented with relative risk reductions. However, the review also found that relative risks were also more likely to lead to misinterpretation. The potential for relative risk to be misleading, to either patients or health professionals, was pointed out in Chapter 4.
As shown in the example in Box 14.6, while patients who take a medication may have a 50% higher risk of experiencing a side effect, in absolute terms, if a patient's initial risk was only 22 in 1000 (or 2.2%), then taking the medication would increase this risk to only 34 in 1000 people (or 3.4%). An important factor to note is to avoid using qualitative descriptors, such as ‘low’, ‘high’, ‘rare’ and ‘frequent’, to quantify risk without clear explanation, as patients' and health professionals' perceptions of what such descriptors actually mean can vary dramatically.40
The importance of baseline risk was explained in Chapter 4. When explaining absolute and relative risk reduction (or increase) to patients, the baseline or starting level of risk to the patient should also be presented to help the patient interpret the risks appropriately.90 For example, a 1995 warning by the Committee on Safety in the USA stated that third-generation oral contraceptive drugs were associated with twice the risk compared with second-generation contraceptives. This was reported by the media and it led to a dramatic reduction in the use of oral contraceptives and a subsequent increase in pregnancies and terminations. However, what the media did not inform people of was that the baseline risk was extremely low, at 15 cases per year per 100,000 users, and that the increased risk was still extremely low, at 25 cases per year.90,91
Number needed to treat
The concept of number needed to treat was explained in Chapter 4 and we saw that it can be a clinically useful concept for health professionals. However, you should be aware that studies which evaluated patients' understanding and ability to use the concept of number needed to treat have mostly found that it is a difficult concept for patients to understand and may have limited use as a communication tool during shared decision making.92
Table 14.1 above provides two examples of the issues surrounding the presentation of probability and risk to patients, and shows how using natural frequencies or plain numbers (for example, ‘8 out of 100’) can aid patients' understanding.
Factors for health professionals to consider when presenting statistical information to patients
Framing
Framing of information refers to whether the information is presented in a positive or a negative manner. If information is positively framed, it is presented in terms of who will benefit. For example, out of 1000 patients who have this treatment, 800 (or 80%) will benefit. If information is negatively framed, it is presented in terms of who will not benefit (or possibly be harmed). For example, out of 1000 patients who have this treatment, 200 (or 20%) will experience an adverse side effect.
How information is framed has been found to influence patients' perceptions of test or treatment options and confidence in medical decision making.87 However, a recent Cochrane review concluded that the effect of framing on actual health behaviour is not consistent, based on the available trials.93 Positive framing has been linked with patients being more willing to undertake risky treatments.87 Information can also be framed in terms of a gain or loss with respect to screening; for example, gain or loss framing concerns the outcomes from having (gain) or not having (loss) a screening test. Loss framing, which outlines the possible adverse outcomes from not having the test, has been linked with a higher uptake by patients of screening tests than gain framing, which outlines the advantages of having the test.87
Current recommendations are that health professionals be unbiased and present patients with both the positive and the negative aspects of an intervention by using the same statistical denominator; for example, telling a patient that the risk of developing a disease is 34 in 1000 people who follow the treatment and that the risk of not developing the disease is 966 in 1000 people who follow the treatment. Gigerenzer and Edwards87 describe an example of poor practice in an information brochure for patients about a particular screening test. In the brochure, health professionals presented information using relative risk statistics to make the benefits appear large presenting the risks of undertaking screening using absolute risk statistics (which were smaller).
Using graphs and pictures
Using graphs or pictures can assist patients to understand the information that you are presenting. For example, a pictograph of a population of 1000 people (represented by circles) which you can colour in to show how many will benefit (or be harmed) by a particular intervention is one way of showing data in an absolute manner. Figure 14.1 shows how a pictograph can be used, using a hypothetical example. Pictographs have been found to be more easily and accurately understood when the data are presented along the horizontal axis of the pictograph.94 This presentation can assist patients to see the overall picture and help them put the information into perspective. For example, they can see the baseline level of risk and how much the level of risk changes following the intervention.

Figure 14.1 Pictograph of a population of 1000 people that can be used to illustrate the risk of a certain intervention.
The pictograph in Figure 14.1 illustrates that:
• of 1000 people aged between 50 and 60 years, the chance of dying is 20 in 1000 if the medication is not taken (see second bottom row of the pictograph)
• of 1000 people aged between 50 and 60 years, the chance of dying is reduced to 5 in 1000 if the medication is taken (see bottom row of the pictograph).
Graphs representing benefit and harm can also be prepared. Figure 14.2 shows a hypothetical example of a graphical representation of risk for experiencing a side effect from taking a particular medication. The vertical (y) axis shows the number of patients per 1000 who experience this side effect. The horizontal (x) axis shows two groups. Group one is the general population (to represent baseline risk), and group two represents the patients who take the medication. The graph clearly shows the increased risk of experiencing the side effect for patients who take this particular medication, in comparison with the general population. Using this approach, graphs of benefit and harm can be presented side by side. However, if graphs of benefit and harm are presented side by side, the same y-axis should be used in both graphs to ensure consistency.87 There is some evidence that vertical bar graphs are better than horizontal bars, pie charts and systematic or random ovals in helping to explain differences in proportions to patients.95,96
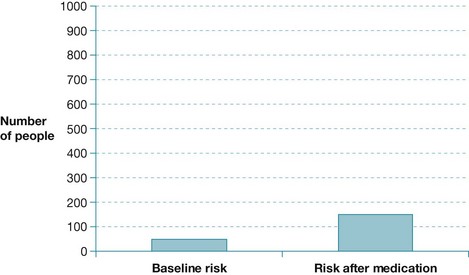
Figure 14.2 Graphical representation of the risk of side effects after taking a particular medication.
As we saw in Chapter 8, survival curves can sometimes be used to display prognostic information. A study that investigated using survival curves to inform patients found that survival curves were understood by patients if they were given more than one opportunity to see and discuss them.95 However, a more recent study found that mortality rates are better understood by patients rather than survival curves.84
Consider timeframes and social factors
You should be aware that how patients perceive probabilities and risks can differ according to their age. A lifetime risk may not mean much to a young person, whereas a risk over the next 5 years may mean more to an older person.3 There are also many social factors that can influence how patients interpret risk information. Patients can be influenced by the social context of the information, for example the perceived relevance of it and the extent to which they trust the source. Health professionals need to understand that they are just one source of information about risk and may not be the source that patients trust the most.97 In previous sections of this chapter we have described strategies that health professionals can use to help develop a relationship of trust with patients. These included: engaging in shared decision making; respecting the patient's needs, views and preferences; and using effective communication techniques.
The nature of the risk also influences how patients may react. For example, patients may be more sensitive to high-consequence risks (such as being struck by lightning) than by the consequences of disease/disability from smoking.97 These types of high-consequence, but rare, risks often evoke a strong emotional reaction and a disproportionately large popular media coverage. To help patients put risk numbers into perspective, it can be useful to compare risk numbers with other, more familiar risks, for example dying of any cause in the next year. Figure 14.3 provides an example of a perspective chart (based on one developed by Paling98) that can be used by health professionals when educating patients about the probability of developing melanoma. The chart provides the estimated risk of developing melanoma as well as the estimated risk of other events such as death by car accident, developing type 2 diabetes and being struck by lightning.
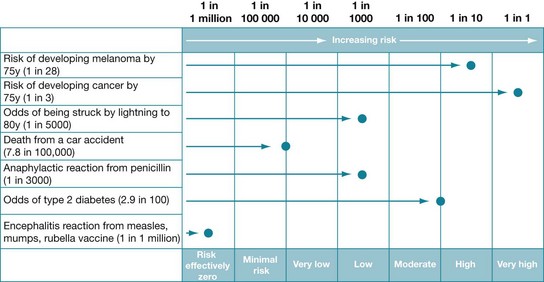
Figure 14.3 Presenting risk information in a way that gives perspective to the probability of an outcome. Based on: Risk Communication Format, © John Paling, 2000 (see www.riskcomm.com); reproduced with permission.
Less is more
Finally, health professionals should attempt to reduce the amount of statistical information they present to patients. Research has shown that limiting the amount to a few key points may results in higher comprehension, and therefore better and higher quality decision making by patients.99,100 Box 14.7 summarises the strategies that health professionals can use to ensure that statistical information about health is presented in the best possible way for patients to understand.
One final comment—we have focused in this chapter on the crucial role and, indeed, responsibility that health professionals have in assisting patients to understand and use health information and participate in the decision-making process. However, at a broader level, we should also, at every opportunity, be helping the public in general to gain the skills and knowledge needed to be critical consumers of health information, make informed decisions and also understand issues such as how research knowledge is generated and presented. As a starting point, some highly recommended resources that have been written on these topics (and, wonderfully, are free to download as PDFs) include: Testing Treatments (www.testingtreatments.org), Smart Health Choices (www.sensiblehealthadvice.org) and Know your Chances: Understanding Health Statistics (www.jameslindlibrary.org/documents/KnowYourChances_000.pdf). Additionally, the book Better Doctors, Better Patients, Better Decisions: Envisioning health care 2020 by Gerd Gigerenzer and Muir Gray is extremely well worth reading (mitpress.mit.edu/books/better-doctors-better-patients-better-decisions).
References
1. Salzburg Global Seminar. The Salzburg statement on shared decision making. BMJ. 2011; 342:d1745. [doi: 10.1136/bmj.d1745].
2. Tooth, L, Refshauge, K. The effectiveness of client education: a review of the evidence and future challenges. In: McKenna K, Tooth L, eds. Client education: a partnership approach for health practitioners. Sydney: University of New South Wales Press; 2006:22–56.
3. National Health and Medical Research Council of Australia. Making decisions about tests and treatments: principles for better communication between healthcare consumers and healthcare professionals. Canberra: Australian Government Printer; 2006.
4. Groves, J. International Alliance of Patients’ Organisations perspectives on person-centred medicine. Int J Integr Care. 2010; 10(Suppl):27–29.
5. Bergeson, S, Dean, J. A systems approach to patient-centered care. JAMA. 2006; 296:2848–2851.
6. Coulter, A. After Bristol: putting patients at the centre. BMJ. 2002; 324:648–651.
7. McKenna, T, Tooth, L. Client education: a partnership approach for health practitioners. Sydney: University of New South Wales Press; 2006.
8. Entwistle, V, Watt, I. Patient involvement in treatment decision-making: the case for a broader conceptual framework. Patient Educ Couns. 2006; 63:268–278.
9. Quill, T, Brody, H. Physician recommendations and patient autonomy: finding a balance between physician power and patient choice. Ann Intern Med. 1996; 125:763–769.
10. Kahn, K, Schneider, E, Malin, J, et al. Patient centred experiences in breast cancer: predicting long-term adherence to tamoxifen use. Med Care. 2007; 45:431–439.
11. Coulter, A. What do patients and the public want from primary care? BMJ. 2005; 331:1199–1201.
12. Trevena, L, Barratt, A. Integrated decision making: definitions for a new discipline. Patient Educ Couns. 2003; 50:265–268.
13. Kon, A. The shared decision making continuum. JAMA. 2010; 304:903–904.
14. Elwyn, G, Laitner, S, Coulter, A, et al. Implementing shared decision making in the NHS. BMJ. 2010; 341:971–973.
15. American Medical Association. Policy H-373.997 Shared Decision-Making, no date. Online Available www.ama-assn.org/resources/doc/cms/a10-cms-rpt-7.pdf. [5 May 2012].
16. General Medical Council of the United Kingdom. Good medical practice: relationships with patients. www.gmc-uk.org/static/documents/content/GMP_0910.pdf, 2006. [Online. Available 5 May 2012].
17. Naik, A, Kallen, M, Walder, A, et al. Improving hypertension control in diabetes mellitus: the effects of collaborative and proactive health communication. Circulation. 2008; 117:1361–1368.
18. Frosch, D, Kaplan, R. Shared decision making in clinical medicine: past research and future directions. Am J Prev Med. 1999; 17:285–294.
19. Wilson, S, Strub, P, Buist, S, et al. Shared treatment decision making improves adherence and outcomes in poorly controlled asthma. Am J Respir Crit Care Med. 2010; 181:566–577.
20. White, D, Braddock, C, Bereknyei, S, et al. Toward shared decision making at the end of life in intensive care units: opportunities for improvement. Arch Intern Med. 2007; 167:461–467.
21. Stewart, A. Effective physician–patient communications and health outcomes: a review. CMAJ. 1995; 152:1423–1433.
22. McWilliams, D, Jacobson, R, Van Houten, H, et al. A program of anticipatory guidance for the prevention of emergency department visits for ear pain. Arch Paediatr Adolesc Med. 2008; 162:151–156.
23. Wennberg, D, Marr, A, Lang, L, et al. A randomised trial of a telephone care-management strategy. New Engl J Med. 2010; 363:1245–1255.
24. O'Connor, A, Legare, F, Stacey, D. Risk communication in practice: the contribution of decision aids. BMJ. 2003; 327:736–740.
25. Levinson, W, Kao, A, Kuby, A, et al. Not all patients want to participate in decision making: a national study of public preferences. J Gen Intern Med. 2005; 20:531–535.
26. Care Quality Commission. The state of health care and adult social care in England: an overview of key themes in care 2010/11. Online Available www.cqc.org.uk/sites/default/files/media/documents/state_of_care_2010_11.pdf. [20 Oct 2011].
27. Chewning, B, Bylund, C, Shah, B, et al. Patient preferences for shared decisions: a systematic review. Patient Educ Couns. 2012; 86:9–18.
28. Edwards, A, Elwyn, G, Hood, K, et al. The development of COMRADE: a patient-based outcome measure to evaluate the effectiveness of risk communication and treatment decision making in consultations. Patient Educ Couns. 2003; 50:311–322.
29. Bauman, A, Fardy, H, Harris, P. Getting it right: why bother with patient centred care? Med J Aust. 2003; 179:253–256.
30. Delany, C. Cervical manipulation: how might informed consent be obtained before treatment? J Law Med. 2002; 10:174–186.
31. Lockwood, S. ‘Evidence of me’ in evidence based medicine? BMJ. 2004; 329:1033–1035.
32. Ford, S, Schofield, T, Hope, T. What are the ingredients for a successful evidence-based patient choice consultation? A qualitative study. Soc Sci Med. 2003; 56:589–602.
33. Elwyn, G, Edwards, A, Mowle, S, et al. Measuring the involvement of patients in shared decision making. Patient Educ Couns. 2001; 43:5–22.
34. Elwyn, G, Edwards, A, Wensing, M. Shared decision making: developing the OPTION scale for measuring patient involvement. Qual Saf Health Care. 2003; 12:93–99.
35. Elwyn, G, Hutchings, H, Edwards, A, et al. The OPTION scale: measuring the extent that health professionals involve patients in decision-making tasks. Health Expect. 2005; 8:34–42.
36. Holmes-Rovner, M, Kroll, J, Schmitt, N, et al. Patient satisfaction with health care decisions: the satisfaction with decision scale. Med Decis Making. 1996; 16:58–64.
37. O'Connor, A. Validation of a decisional conflict scale. Med Decis Making. 1995; 15:25–30.
38. Lerman, C, Brody, D, Caputo, G, et al. Patients’ perceived involvement in care scale: relationship to attitudes about illness and medical care. J Gen Intern Med. 1990; 5:29–33.
39. Simon, D, Schorr, G, Wirtz, M, et al. Development and first validation of the shared decision-making questionnaire (SDM-Q). Patient Educ Couns. 2006; 63:319–327.
40. Epstein, R, Alper, B, Quill, T. Communicating evidence for participatory decision making. JAMA. 2004; 291:2359–2366.
41. McKenna, K, Tooth, L. Deciding the content and format of educational interventions. In: McKenna K, Tooth L, eds. Client education: a partnership approach for health practitioners. Sydney: University of New South Wales Press; 2006:128–158.
42. Tse, S, Lloyd, C, McKenna, K. When clients are from diverse linguistic and cultural backgrounds. In: McKenna K, Tooth L, eds. Client education: a partnership approach for health practitioners. Sydney: University of New South Wales Press; 2006:307–326.
43. Boundouki, G, Humphris, G, Field, A. Knowledge of oral cancer, distress and screening intentions: longer term effects of a patient information leaflet. Patient Educ Couns. 2004; 53:71–77.
44. Hill, J. A practical guide to patient education and information giving. Baillières Clin Rheumatol. 1997; 11:109–127.
45. Johnson, A, Sandford, J, Tyndall, J. Written and verbal information versus verbal information only for patients being discharged from acute hospital settings to home. Cochrane Database Syst Rev. 2008. [CD003716. doi: 10.1002/14651858.CD003716].
46. Pitkethly, M, MacGillivray, S, Ryan, R. Recordings or summaries of consultations for people with cancer. Cochrane Database Syst Rev. 2008. [CD001539. doi: 10.1002/14651858.CD001539].
47. Griffin, J, McKenna, K, Tooth, L. Discrepancy between older clients’ ability to read and comprehend and the reading level of written educational materials used by occupational therapists. Am J Occup Ther. 2006; 60:70–80.
48. Hoffmann, T, McKenna, K. Analysis of stroke patients’ and carers’ reading ability and the content and design of written materials: recommendations for improving written stroke information. Patient Educ Couns. 2006; 60:286–293.
49. McLaughlin, H. SMOG grading: a new readability formula. J Reading. 1969; 12:639–646.
50. Flesch, R. A new readability yardstick. J Appl Psychol. 1948; 32:221–233.
51. Hoffmann, T, Worrall, L. Designing effective written health education materials: considerations for health professionals. Disabil Rehabil. 2004; 26:1166–1173.
52. Doak, C, Doak, L, Root, J. Teaching patients with low literacy skills, 2nd ed. Philadelphia: J.B. Lippincott; 1996.
53. Paul, C, Redman, S, Sanson-Fisher, R. The development of a checklist of content and design characteristics for printed health education materials. Health Promot J Aust. 1997; 7:153–159.
54. Charnock, D, Sheppard, S, Needham, G, et al. DISCERN: an instrument for judging the quality of written consumer health information on treatment choices. J Epidemiol Commun Hlth. 1999; 53:105–111.
55. Treweek, S, Glenton, C, Oxman, A, et al. Computer-generated patient education materials: do they affect professional practice? A systematic review. J Am Med Inform Assoc. 2002; 9:346–358.
56. Hoffmann, T, Russell, T, McKenna, K. Producing computer-generated tailored written information for stroke patients and their carers: system development and preliminary evaluation. Int J Med Inform. 2004; 73:751–758.
57. Kroeze, W, Werkman, A, Brug, J. A systematic review of randomised trials on the effectiveness of computer-tailored education on physical activity and dietary behaviours. Ann Behav Med. 2006; 31:205–223.
58. Neville, L, O'Hara, B, Milat, A. Computer-tailored dietary behaviour change interventions: a systematic review. Health Educ Res. 2009; 24:699–720.
59. Short, C, James, E, Plotnikoff, R, et al. Efficacy of tailored-print interventions to promote physical activity: a systematic review of randomised trials. Int J Behav Nutr Phys Act. 2011; 17:113.
60. Bailey, J, Murray, E, Rait, G, et al. Interactive computer-based interventions for sexual health promotion. Cochrane Database Syst Rev. 2010. [CD006483. doi: 10.1002/14651858.CD006483.pub2].
61. Murray, E, Burns, J, Tai, S, et al. Interactive health communication applications for people with chronic disease. Cochrane Database Syst Rev. 2009. [CD004274. doi: 10.1002/14651858.CD004274.pub4].
62. McMullan, M. Patients using the Internet to obtain health information: how this affects the patient–health professional relationship. Patient Educ Couns. 2006; 63:24–28.
63. Zun, L, Downey, L, Brown, S. Completeness and accuracy of emergency medical information on the web: update 2008. West J Emerg Med. 2011; 12:448–454.
64. Tait, A, Voepel-Lewis, T, Moscucci, M, et al. Patient comprehension of an interactive, computer-based information program for cardiac catheterisation: A comparison with standard information. Arch Intern Med. 2009; 169:1907–1914.
65. Beranova, E, Sykes, C. A systematic review of computer-based softwares for educating patients with coronary heart disease. Patient Educ Couns. 2007; 66:21–28.
66. Stromberg, A, Ahlen, H, Fridlund, B. Interactive education on CD-ROM: a new tool in the education of heart failure patients. Patient Educ Couns. 2002; 46:75–81.
67. Noar, S, Benac, C, Harris, M. Does tailoring matter? Meta-analytic review of tailored print health behavior change interventions. Psych Bull. 2007; 133:673–693.
68. Krebs, P, Prochaska, J, Rossi, J. A meta-analysis of computer-tailored interventions for health behavior change. Prev Med. 2010; 51:214–221.
69. Hoffmann, T, McKenna, K, Worrall, L, et al. Randomised controlled trial of a computer- generated tailored written education package for patients following stroke. Age Ageing. 2007; 36:280–286.
70. Gysels, M, Higginson, I. Interactive technologies and videotapes for patient education in cancer care: systematic review and meta-analysis of randomised trials. Support Care Cancer. 2007; 15:7–20.
71. Haines, T, Hill, A, Hill, D, et al. Patient education to prevent falls among older hospital inpatients: a randomised controlled trial. Arch Intern Med. 2011; 171:516–524.
72. Stacey, D, Bennet, C, Barry, M, et al. Decision aids for people facing health treatment or screening decisions. Cochrane Database Syst Rev. 2011. [CD001431. doi: 10.1002/14651858.CD001431.pub3].
73. Mayo Clinic. Knowledge and Education Research Unit (KER), no date. Online Available mayoresearch.mayo.edu/mayo/research/ker_unit/index.cfm. [6 May 2012].
74. Institute of Medicine (IOM). Health literacy: a prescription to end confusion. Washington: IOM; 2004.
75. Weiss, B, Coyne, C, Michielutte, R, et al. Communicating with patients who have limited literacy skills: report of the National Work Group on Literacy and Health. J Fam Pract. 1998; 46:168–175.
76. Fischoff, B, Brewer, N, Downs, J, Communicating risks and benefits: an evidence-based user's guide. US Department of Health and Human Services, Food and Drug Administration, Silver Spring, MD, 2011. Online Available www.fda.gov/AboutFDA/ReportsManualsForms/Reports/ucm268078.htm [15 Nov 2012].
77. Wilson, F, McLemore, R. Patient literacy levels: a consideration when designing patient education programs. Rehabil Nurs. 1997; 22:311–317.
78. Australian Bureau of Statistics (ABS). Health Literacy. Report No. 4233.0. Canberra: ABS; 2008.
79. Murphy, P, Davis, T, Long, S, et al. REALM: a quick reading test for patients. J Reading. 1993; 37:124–130.
80. Parker, R, Baker, D, Williams, M, et al. The Test of Functional Health Literacy in Adults: a new instrument for measuring patients’ literacy skills. J Gen Intern Med. 1995; 10:537–541.
81. Hanson-Divers, E. Developing a medical achievement reading test to evaluate patient literacy skills: a preliminary study. J Health Care Poor Underserved. 1997; 8:56–59.
82. Peterson, P, Shetterly, S, Clarke, C, et al. Health literacy and outcomes among patients with heart failure. JAMA. 2011; 305:1695–1701.
83. McKenna, K, Tooth, L. Client education: a partnership approach for health practitioners. Sydney: University of New South Wales Press; 2006.
84. Gigerenzer, G, Gaissmaier, W, Kurz-Milcke, E, et al, Helping doctors and patients make sense of health statistics. Psychol Sci Public Interest 2008; 8:53–96. Online Available www.psychologicalscience.org/journals/pspi/pspi_8_2_article.pdf [15 Nov 2012].
85. Welch, HG, Schwartz, L, Woloshin, S. Over-diagnosed: making people sick in the pursuit of health. Boston: Beacon Press; 2012.
86. Gigerenzer, G. Why do single event probabilities confuse patients? BMJ. 2012; 344:245.
87. Gigerenzer, G, Edwards, A. Simple tools for understanding risks: from innumeracy to insight. BMJ. 2003; 327:741–744.
88. Akl, EA, Oxman, AD, Herrin, J, et al. Using alternative statistical formats for presenting risks and risk reductions. Cochrane Database Syst Rev. (3):2011. [CD006776. doi: 10.1002/14651858.CD006776.pub2].
89. Woloshin, S, Schwartz, L. Communicating data about the benefits and harms of treatment: a randomised trial. Ann Intern Med. 2011; 155:87–96.
90. Berry, D, Knapp, P, Raynor, T. Expressing medicine side effects: assessing the effectiveness of absolute risk, relative risk and number needed to harm and the provision of baseline risk information. Patient Educ Couns. 2006; 63:89–96.
91. Edwards, R, Cohen, J. The recent saga of cardiovascular disease and safety of oral contraceptives. Hum Reprod Update. 1999; 5:565–620.
92. Halvorsen, P, Kristiansen, I. Decisions on drug therapies by numbers needed to treat: a randomised trial. Arch Int Med. 2005; 165:1140–1146.
93. Akl, EA, Oxman, AD, Herrin, J, et al. Framing of health information messages. Cochrane Database Syst Rev. (12):2011. [CD006776. doi: 10.1002/14651858.CD006777.pub2].
94. Price, M, Cameron, R, Butow, P. Communicating risk information: the influence of graphical display format on quantitative information perception—accuracy, comprehension and preferences. Patient Educ Couns. 2007; 69:121–128.
95. Trevena, L, Davey, H, Barratt, A, et al. A systematic review on communicating with patients about evidence. J Eval Clin Pract. 2006; 12:13–23.
96. Carling, C, Kristoffersen, D, Flottorp, S, et al. The benefits of alternative graphical displays used to present the benefits of antibiotics for sore throat on decisions about whether to seek treatment: a randomised trial. PLoS Med. 2009; 6:e1000140.
97. Alaszewski, A, Horlick-Jones, T. How can doctors communicate information about risk more effectively? BMJ. 2003; 327:728–731.
98. Paling, J. Strategies to help patients understand risks. BMJ. 2003; 327:745–748.
99. Peters, E, Dieckmann, N, Dixon, A, et al. Less is more in presenting quality information to consumers. Med Care Res Rev. 2007; 64:169–190.
100. Zikmund-Fisher, B, Fagerlin, A, Ubel, P. Improving understanding of adjuvant therapy options by using simpler risk graphics. Cancer. 2008; 113:3382–3390.